Fomc 20080805 g Bpt 220080730
119
Prefatory Note The attached document represents the most complete and accurate version available based on original files from the FOMC Secretariat at the Board of Governors of the Federal Reserve System. Please note that some material may have been redacted from this document if that material was received on a confidential basis. Redacted material is indicated by occasional gaps in the text or by gray boxes around non-text content. All redacted passages are exempt from disclosure under applicable provisions of the Freedom of Information Act. Content last modified 03/07/2014.
-
Upload
fraser-federal-reserve-archive -
Category
Documents
-
view
215 -
download
0
Transcript of Fomc 20080805 g Bpt 220080730

Prefatory Note The attached document represents the most complete and accurate version available based on original files from the FOMC Secretariat at the Board of Governors of the Federal Reserve System. Please note that some material may have been redacted from this document if that material was received on a confidential basis. Redacted material is indicated by occasional gaps in the text or by gray boxes around non-text content. All redacted passages are exempt from disclosure under applicable provisions of the Freedom of Information Act.
Content last modified 03/07/2014.
Class III FOMC - Internal (FR)
CURRENT ECONOMICAND FINANCIAL CONDITIONS
Part 2
Recent Developments
Prepared for the Federal Open Market Committeeby the staff of the Board of Governors of the Federal Reserve System
July 30, 2008

Class III FOMC - Internal (FR)
July 30, 2008
Recent Developments
Prepared for the Federal Open Market Committeeby the staff of the Board of Governors of the Federal Reserve System

Domestic NonfinancialDevelopments

Domestic Nonfinancial Developments
II-1
1 Since the June Greenbook, the Supplemental Appropriations Act of 2008 was passed. Legislation
included in the act provides extended unemployment insurance benefits for unemployed individuals who filed a claim for state benefits on May 7, 2007, or later; have exhausted their regular benefits; and meet earnings and work requirements. Individuals could start filing for extended benefits during the week of July 6, 2008; the Employment and Training Administration will begin to report claims for extended benefits in August.
Aggregate economic activity held up reasonably well in the first half of the year despite a weakening labor market, adverse financial conditions for households and businesses, and the continued rapid descent in residential construction. Although sales of motor vehicles stepped down sharply over the course of the spring, consumer spending on other goods was surprisingly well maintained until seeming to falter in June. Similarly, investment in business equipment excluding transportation still appeared to be rising modestly. Nonresidential construction activity has not tapered off yet even though vacancy rates have risen and credit conditions have tightened. Industrial production (IP) declined in the second quarter after little change over the previous two quarters, but the decline was not as sharp as in a typical recession. At the same time, core consumer price inflation has remained relatively stable in recent months, while headline inflation has been elevated, reflecting large increases in prices of food and energy.
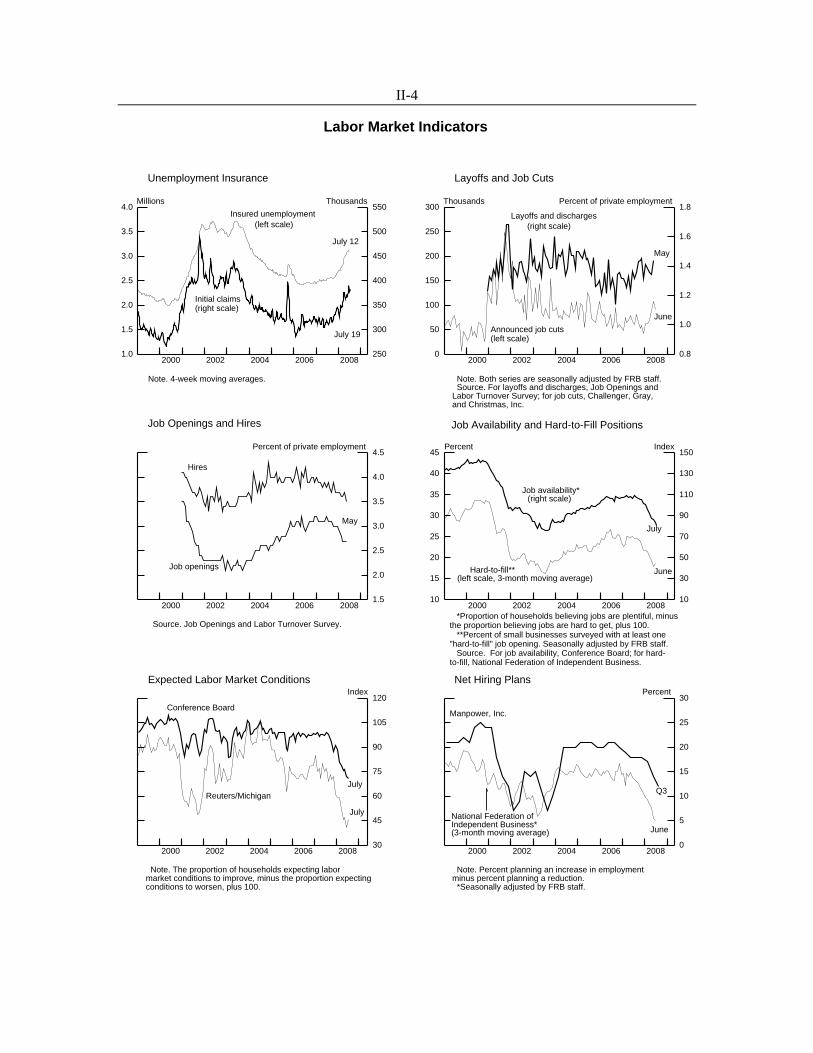
Labor Market Developments Labor demand continued to contract in the second quarter. Private payroll employment fell 91,000 in June, and the level of employment in May was revised down by about 75,000. Losses now average 91,000 over the three months ending in June, close to the first quarter’s average monthly decline of 97,000. In the household survey, the unemployment rate remained at 5.5 percent in June. Unemployment rates for those aged 16 to 24 partly retraced their jump in May, but this decrease was offset by a further increase in the unemployment rate among those aged 25 and older. The June reading on the unemployment rate brought the second-quarter average to 5.3 percent, up from 4.9 percent in the first quarter. Another measure of slack, the fraction of workers who are working part time for economic reasons, has continued to rise.
Other indicators point toward continued weakness in the labor market. The level of insured unemployment has continued to move up, and the number of individuals unemployed due to job loss has risen further as a percentage of the labor force.1 Most indicators of layoffs—including the short-term job losers rate and announcements of downsizing plans compiled by Challenger, Gray, and Christmas, Inc.—suggest that flows into unemployment remained elevated through June, and initial claims for unemployment insurance have drifted up a bit since then.

II-2
2000 2002 2004 2006 2008-400
-300
-200
-100
0
100
200
300
400
-400
-300
-200
-100
0
100
200
300
400Thousands
2000 2002 2004 2006 2008
June
3-month moving average
Changes in Private Payroll Employment
2000 2002 2004 2006 200833.0
33.5
34.0
34.5
35.0 Hours
94
96
98
100
102
104
106
108
1102002 = 100
2000 2002 2004 2006 2008
Workweek(left scale)
Aggregate hours (right scale)
June
Aggregate Hours and Workweek of Production and Nonsupervisory Workers
Changes in Employment(Thousands of employees; seasonally adjusted)
2007 2008
Measure and sector 2007 Q4 Q1 Q2 Apr. May June
Average monthly change Monthly change
Nonfarm payroll employment (establishment survey) 91 80 -82 -64 -67 -62 -62 Private 71 45 -97 -91 -91 -91 -91 Natural resources and mining 3 4 4 5 2 5 7 Manufacturing -22 -17 -43 -36 -52 -22 -33 Ex. motor vehicles -15 -8 -31 -32 -33 -24 -39 Construction -19 -41 -41 -46 -59 -37 -43 Residential -20 -39 -30 -28 -32 -30 -21 Nonresidential 1 -2 -11 -18 -27 -7 -22 Wholesale trade 9 6 -6 -6 -10 -4 -2 Retail trade 6 0 -29 -25 -46 -23 -8 Financial activities -9 -14 -7 -5 -2 -3 -10 Professional and business services 26 44 -39 -28 17 -49 -51 Temporary help services -7 4 -24 -27 -19 -32 -30 Nonbusiness services1 76 71 66 58 65 56 52 Total government 21 35 15 27 24 29 29 Total employment (household survey) 22 -16 -81 -26 362 -285 -155 Memo:Aggregate hours of private production workers (percent change)2 1.3 1.0 -1.1 -.9 -.1 -.4 -.1 Average workweek (hours)3 33.8 33.8 33.7 33.7 33.8 33.7 33.7 Manufacturing (hours) 41.2 41.2 41.1 40.9 41.0 40.9 40.8
1. Nonbusiness services comprises education and health, leisure and hospitality, and "other." 2. Establishment survey. Annual data are percent changes from Q4 to Q4. Quarterly data are percent changes from precedingquarter at an annual rate. Monthly data are percent changes from preceding month. 3. Establishment survey.

II-3
2000 2001 2002 2003 2004 2005 2006 2007 200865.6
65.8
66.0
66.2
66.4
66.6
66.8
67.0
67.2
67.4
67.6 Percent
3.0
3.5
4.0
4.5
5.0
5.5
6.0
6.5Percent
2000 2002 2004 2006 2008
Unemployment rate(right scale)
Participationrate (left scale)
June
Labor Force Participation Rateand Unemployment Rate
2000 2001 2002 2003 2004 2005 2006 2007 20080.6
0.8
1.0
1.2
1.4
0.6
0.8
1.0
1.2
1.4Percent of household employment
2000 2002 2004 2006 2008
3-month moving average (thick line)
Job Losers UnemployedLess Than 5 Weeks
Dec.
2000 2001 2002 2003 2004 2005 2006 2007 20081.0
1.5
2.0
2.5
3.0
3.5
4.0
1.0
1.5
2.0
2.5
3.0
3.5
4.0Percent of labor force
2000 2002 2004 2006 2008
June
Unemployed Due to Job Loss
2000 2001 2002 2003 2004 2005 2006 2007 20082.0
2.4
2.8
3.2
3.6
4.0
2.0
2.4
2.8
3.2
3.6
4.0Percent of household employment
2000 2002 2004 2006 2008
June
Persons Working Part Timefor Economic Reasons
Selected Unemployment and Labor Force Participation Rates(Percent; seasonally adjusted)
2007 2008
Rate and group 2007 Q4 Q1 Q2 Apr. May June
Civilian unemployment rateTotal 4.6 4.8 4.9 5.3 5.0 5.5 5.5 Teenagers 15.7 16.4 16.8 17.4 15.4 18.7 18.1 20-24 years old 8.2 8.6 9.0 9.8 8.9 10.4 10.1 Men, 25 years and older 3.6 3.7 3.8 4.2 4.0 4.2 4.3 Women, 25 years and older 3.6 3.8 3.9 4.1 3.9 4.1 4.2
Labor force participation rateTotal 66.0 66.0 66.0 66.1 66.0 66.2 66.1 Teenagers 41.3 41.0 40.3 41.4 41.1 42.6 40.5 20-24 years old 74.4 74.0 73.9 74.6 74.2 75.0 74.8 Men, 25 years and older 75.6 75.5 75.5 75.2 75.2 75.2 75.3 Women, 25 years and older 59.7 59.7 59.9 60.0 60.0 60.0 60.1
II-4
Labor Market Indicators
2000 2002 2004 2006 20081.0
1.5
2.0
2.5
3.0
3.5
4.0 Millions
250
300
350
400
450
500
550Thousands
2000 2002 2004 2006 2008
Initial claims(right scale)
July 19
Insured unemployment (left scale)
July 12
Note. 4-week moving averages.
Unemployment Insurance
2000 2002 2004 2006 20080
50
100
150
200
250
300 Thousands
0.8
1.0
1.2
1.4
1.6
1.8Percent of private employment
2000 2002 2004 2006 2008
May
Layoffs and discharges (right scale)
June
Announced job cuts(left scale)
Note. Both series are seasonally adjusted by FRB staff. Source. For layoffs and discharges, Job Openings andLabor Turnover Survey; for job cuts, Challenger, Gray,and Christmas, Inc.
Layoffs and Job Cuts
2000 2002 2004 2006 20081.5
2.0
2.5
3.0
3.5
4.0
4.5
1.5
2.0
2.5
3.0
3.5
4.0
4.5Percent of private employment
2000 2002 2004 2006 2008
May
Job openings
Hires
Source. Job Openings and Labor Turnover Survey.
Job Openings and Hires
2000 2002 2004 2006 200810
15
20
25
30
35
40
45 Percent
10
30
50
70
90
110
130
150Index
2000 2002 2004 2006 2008
July
Job Availability and Hard-to-Fill Positions
*Proportion of households believing jobs are plentiful, minus the proportion believing jobs are hard to get, plus 100. **Percent of small businesses surveyed with at least one"hard-to-fill" job opening. Seasonally adjusted by FRB staff. Source. For job availability, Conference Board; for hard-to-fill, National Federation of Independent Business.
Job availability*(right scale)
Hard-to-fill**(left scale, 3-month moving average)
June
2000 2002 2004 2006 200830
45
60
75
90
105
120
30
45
60
75
90
105
120Index
2000 2002 2004 2006 2008
July
Reuters/MichiganJuly
Conference Board
Note. The proportion of households expecting labormarket conditions to improve, minus the proportion expectingconditions to worsen, plus 100.
Expected Labor Market Conditions
2000 2002 2004 2006 20080
5
10
15
20
25
30
0
5
10
15
20
25
30Percent
2000 2002 2004 2006 2008
Manpower, Inc.
National Federation ofIndependent Business*(3-month moving average)
Q3
June
Note. Percent planning an increase in employmentminus percent planning a reduction. *Seasonally adjusted by FRB staff.
Net Hiring Plans
II-5
2 Although IP advanced 0.5 percent in June, output last month was boosted by a rebound in motor
vehicle production and a jump in both mining and utilities output. Manufacturing production excluding motor vehicles edged down 0.1 percent in June.
Evidence on hiring also is gloomy. The hires rate, as measured by the Job Openings and Labor Turnover Survey (JOLTS), moved down a bit further in May, while the JOLTS job openings rate held steady at a level ½ percentage point below its year-earlier level. Moreover, the most recent readings on net hiring plans from both the Manpower and the National Federation of Independent Business (NFIB) surveys suggest further reductions in hiring in coming months. Perceptions of job availability in the Conference Board survey eroded a bit further in July. The NFIB measure of hard-to-fill positions remained at a very low level in June.
Households are very pessimistic about the outlook for the labor market. Both the Reuters/University of Michigan and Conference Board surveys remain near the lows of the early 1980s.
We will receive the employment report for July two days after this Greenbook is published and will discuss that report in the Supplement to be distributed on August 1.
Industrial Production IP remains weak.2 For the second quarter as a whole, IP fell at an annual rate of 3.1 percent after having been flat over the previous two quarters. The decline in IP last quarter reflected weak domestic demand for industrial goods and a smaller boost from net trade than had been provided in the previous few quarters. The factory operating rate held steady at 77.6 percent in June—about 2 percentage points below its long-run average but still more than 6 percentage points above its 2001-02 low.
Motor vehicle assemblies tumbled more than 1 million units in the second quarter to an annual rate of 8.8 million. The downshift in production reflected both the effect of strikes, which restrained output at General Motors from March to May, and soft demand for full-size pickup trucks and sport-utility vehicles. In June, with the end of the strikes, motor vehicle production rebounded to a still-subdued pace of 9.3 million units. As for the third quarter, the domestic vehicle makers have substantially pared back their assembly plans from an initial rate of 10.5 million units to 9.6 million units.
Vehicle inventories edged down, on balance, over the second quarter, but the drop-off in the pace of sales pushed up days’ supply to an uncomfortably high 75 days at the end of June. The recent shift in demand toward smaller, more fuel-efficient vehicles is affecting

II-6
Selected Components of Industrial Production (Percent change from preceding comparable period)
Proportion 2008 20082007 20071
Component (percent) Q1 Q2 Apr. May June
Total 100.0 2.1 .5 -3.1 -.7 -.2 .5Previous 100.0 2.1 -.3 ... -.7 -.2 ...
Manufacturing 78.7 2.3 -.9 -3.7 -.9 -.1 .2 Ex. motor veh. and parts 73.6 2.6 .0 -1.9 -.5 -.1 -.1 Ex. high-tech industries 69.3 1.3 -1.1 -3.2 -.7 -.1 -.2
Mining 11.6 .2 3.1 1.4 -.4 .3 1.1Utilities 9.7 3.1 9.6 -3.7 .4 -2.1 2.1
Selected industriesEnergy 24.7 2.3 7.6 -1.3 .2 -.8 1.2
High technology 4.3 22.3 17.7 19.7 1.3 .1 1.8 Computers 1.0 16.7 22.8 5.7 -.2 .3 .8 Communications equipment 1.3 20.6 6.8 20.4 2.6 .1 1.6 Semiconductors2 2.0 25.9 22.8 26.3 1.3 .1 2.4
Motor vehicles and parts 5.1 -2.2 -14.3 -28.5 -6.7 .6 5.4
Total ex. selected industries 65.9 1.1 -2.0 -3.1 -.8 .0 -.2Consumer goods 19.9 .3 -1.4 -1.3 -.6 .1 -.2 Durables 3.6 -2.4 -10.3 -4.4 -.9 -.1 -.7 Nondurables 16.3 .9 .6 -.6 -.6 .1 -.1
Business equipment 7.3 2.8 2.8 -6.2 -2.0 .1 -.1Defense and space equipment 1.7 4.2 1.0 -4.5 -.3 -1.0 1.1
Construction supplies 4.2 -1.9 -7.8 -6.9 -1.2 .5 -.9Business supplies 7.4 -.1 -3.4 -4.4 -1.0 -.2 -.7
Materials 25.4 1.8 -2.7 -2.7 -.4 -.2 -.1 Durables 13.6 2.9 -.9 -3.2 -.5 -.6 .2 Nondurables 11.7 .6 -4.7 -2.0 -.4 .3 -.4
1. From fourth quarter of preceding year to fourth quarter of year shown. 2. Includes related electronic components. ... Not applicable.
Annual rate Monthly rate
Capacity Utilization (Percent of capacity)
1972- 1994- 2001- 2007 2008 2007 95 02
Sector average high low Q4 Q1 Q2 May June
Total industry 81.0 85.1 73.6 81.0 80.6 79.8 79.6 79.9
Manufacturing 79.7 84.6 71.5 79.3 78.7 77.6 77.6 77.6 Ex. motor veh. and parts 79.9 84.3 71.2 79.8 79.4 78.6 78.6 78.4Mining 87.5 88.7 84.8 90.2 90.4 90.5 90.3 91.2Utilities 86.8 93.9 84.6 85.9 86.7 86.1 84.9 86.5
Stage-of-process groupsCrude 86.6 89.5 81.9 89.3 89.5 89.5 89.6 89.7Primary and semifinished 82.2 88.2 74.6 81.3 80.8 79.9 79.6 79.9Finished 77.7 80.4 69.9 77.6 77.2 75.9 75.8 76.0

II-7
3 These models include the Ford Focus (produced in Michigan), the Honda Civic (produced in Ohio),
and the Toyota Corolla (produced in Ohio). In addition, inventories of Toyota’s popular Prius and Camry hybrid models, which are both produced in Japan, are extremely tight.
4 Recent industry anecdotes suggest that financial stress in the airline industry has placed at risk roughly one-third of the unfilled orders at both Boeing and Airbus. However, the current backlog of orders—more than seven years for both manufacturers at current production rates—suggests that even if cancellations were to soar, production would likely continue at high levels for several years.
the composition of the inventory stock: Days’ supply of light trucks rose sharply in the second quarter and stood at a very elevated 100 days at the end of June, while supplies of autos remained relatively lean. Capacity utilization rates for domestic auto production have increased in recent months. Indeed, production is running at or near capacity for a few models of small cars.3 In contrast, the operating rate at domestic plants producing light trucks has averaged about 55 percent since the spring.
Elsewhere in transportation equipment, the output of aircraft and parts picked up in June after having been little changed, on balance, since the end of 2007. The first deliveries of Boeing’s fuel-efficient 787 are expected in the second quarter of 2009; given the lead times for assembling these aircraft, the output of aircraft and parts will need to continue to ramp up in the near term to meet the scheduled deliveries.4
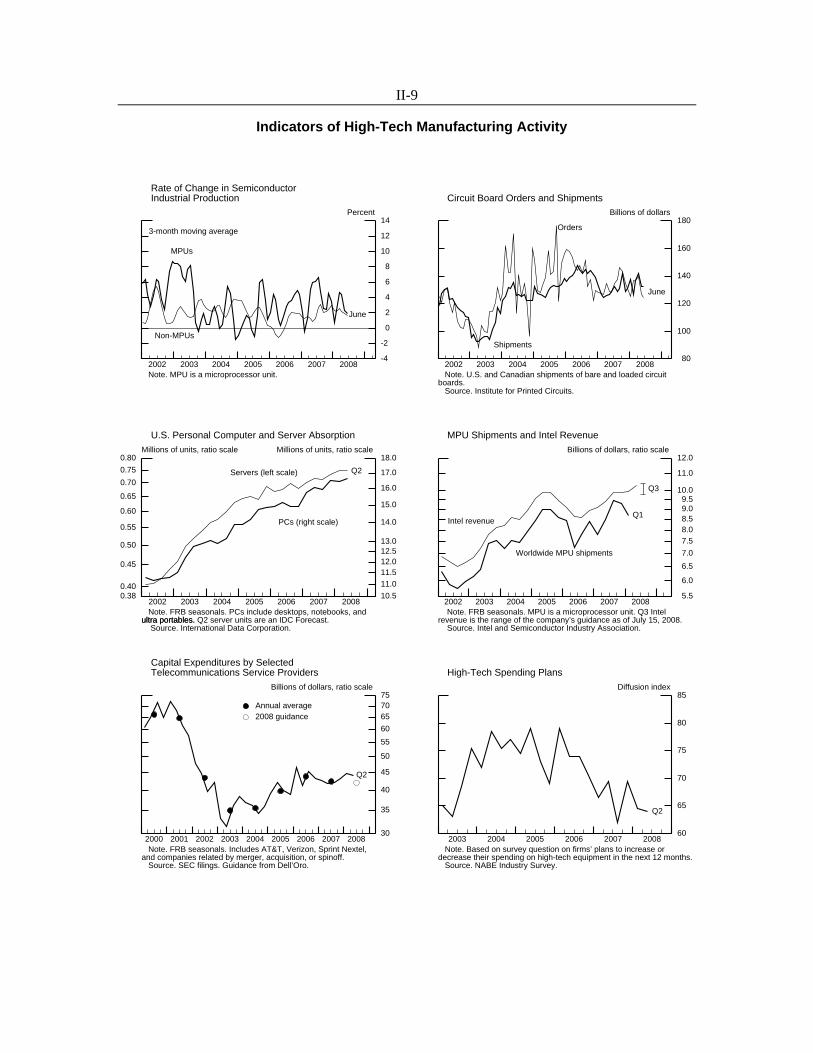
Production of high-tech equipment expanded at an annual rate of 20 percent in the second quarter after a similar-sized gain in the first quarter; these increases are relatively moderate by historical standards. Semiconductor production rose at a solid clip throughout the first half of the year, as sharp increases in a few categories in the first quarter were followed by more broad-based increases in the second quarter. Intel’s second-quarter revenues came in at the high end of their guidance and indicated robust demand for microprocessors and chipsets during the quarter. Downstream from semiconductors, computer output decelerated in the second quarter as increases in sales of both servers and personal computers were offset by a shift in demand toward lower-value products. The output of communications equipment rose solidly in the second quarter after a lull in the first quarter.
The available indicators of high-tech manufacturing activity point to slower production in the current quarter. The midpoint of Intel’s third-quarter guidance suggests a much more modest rise in real microprocessor output, and recent industry anecdotes point to weak downstream demand for semiconductors and the possibility of oversupply for certain chips. For manufacturers of equipment used to produce semiconductors, bookings have fallen to their lowest level in several years. Elsewhere, the book-to-bill ratio for circuit

II-8
Production of Domestic Light Vehicles(Millions of units at an annual rate except as noted)
2007 2008
Item Q4 Q1 Q2 Q3 Mar. Apr. May June
U.S. production1 10.3 9.7 8.6 9.4 9.1 8.2 8.4 9.1 Autos 4.0 3.9 3.6 4.6 4.0 3.5 3.6 3.7 Light trucks 6.3 5.7 4.9 4.8 5.1 4.7 4.8 5.3
Days’ supply2 64 65 72 n.a. 67 72 69 75 Autos 51 51 47 n.a. 52 53 44 49 Light trucks 76 76 95 n.a. 80 88 95 100
Inventories3 2.59 2.45 2.41 n.a. 2.45 2.47 2.36 2.41 Autos .90 .84 .78 n.a. .84 .85 .77 .78 Light trucks 1.69 1.61 1.63 n.a. 1.61 1.62 1.59 1.63
Memo: U.S. production, total motor vehicles4 10.5 9.9 8.8 9.6 9.4 8.4 8.7 9.3
Note. FRB seasonals. Components may not sum to totals because of rounding. 1. Production rates for the third quarter reflect the latest industry schedules. 2. Quarterly values are calculated with end-of-period stocks and average reported sales. 3. End-of-period stocks. 4. Includes medium and heavy trucks. n.a. Not available.
2.2
2.4
2.6
2.8
3.0
3.2
3.4
3.6Millions of units
1998 1999 2000 2001 2002 2003 2004 2005 2006 2007 2008
June
Inventories of Light Vehicles
30
40
50
60
70
80
90Days
1998 1999 2000 2001 2002 2003 2004 2005 2006 2007 2008
June
Using sales in current monthUsing 3-month moving average of sales
Days’ Supply of Light Vehicles
II-9
Indicators of High-Tech Manufacturing Activity
2002 2003 2004 2005 2006 2007 2008-4
-2
0
2
4
6
8
10
12
14 3-month moving average
MPUs
Non-MPUs
June
Note. MPU is a microprocessor unit.
Percent
Rate of Change in SemiconductorIndustrial Production
2002 2003 2004 2005 2006 2007 2008 80
100
120
140
160
180
June
Shipments
Orders
Note. U.S. and Canadian shipments of bare and loaded circuitboards. Source. Institute for Printed Circuits.
Billions of dollars
Circuit Board Orders and Shipments
2002 2003 2004 2005 2006 2007 20080.380.40
0.45
0.50
0.55
0.60
0.65
0.70
0.75
0.80
10.5
11.011.512.012.513.0
14.0
15.0
16.0
17.0
18.0
Q2
Millions of units, ratio scale
PCs (right scale)
Servers (left scale)
Millions of units, ratio scale
Note. FRB seasonals. PCs include desktops, notebooks, andultra portables. Q2 server units are an IDC Forecast. Source. International Data Corporation.ultra portables.
U.S. Personal Computer and Server Absorption
2002 2003 2004 2005 2006 2007 2008 5.5
6.0
6.5
7.0
7.5 8.0 8.5 9.0 9.510.0
11.0
12.0
Note. FRB seasonals. MPU is a microprocessor unit. Q3 Intelrevenue is the range of the company’s guidance as of July 15, 2008. Source. Intel and Semiconductor Industry Association.
Worldwide MPU shipments
Intel revenue
Billions of dollars, ratio scale
Q3
Q1
MPU Shipments and Intel Revenue
2000 2001 2002 2003 2004 2005 2006 2007 200830
35
40
45
50
55
60
657075
Annual average2008 guidance
Note. FRB seasonals. Includes AT&T, Verizon, Sprint Nextel,and companies related by merger, acquisition, or spinoff. Source. SEC filings. Guidance from Dell’Oro.
Q2
Billions of dollars, ratio scale
Capital Expenditures by Selected Telecommunications Service Providers
2003 2004 2005 2006 2007 200860
65
70
75
80
85Diffusion index
Q2
Note. Based on survey question on firms’ plans to increase or decrease their spending on high-tech equipment in the next 12 months. Source. NABE Industry Survey.
High-Tech Spending Plans

II-10
Indicators of Industrial Activity
2002 2003 2004 2005 2006 2007 20080.1
0.2
0.3
0.4
0.5
0.6
7.5
8.5
9.5
10.5
11.5
12.5
13.5Millions of unitsMillions of units
+ July
Medium and heavy trucks(left scale)
Note. July values are based on latest industry schedules.
+
Autos and light trucks (right scale)
Motor Vehicle Assemblies
2002 2003 2004 2005 2006 2007 2008 75
80
85
90
95
100
105
110
115
120
+
June
JulyElectricity
Note. The July value for electricity generation is based onweekly generation data.
2002 = 100
Natural gas
Utilities Output
2002 2003 2004 2005 2006 2007 2008 96
98
100
102
104
106
108
110
112
Construction supplies
Consumer goods
June
Note. Data exclude energy, motor vehicles and parts, andhigh-tech industries.
2002 = 100
IP: Consumer Goods and Construction Supplies
2002 2003 2004 2005 2006 2007 2008 2009
0
20
40
60
80
100
120
140
160
180
Note. 1998 price-weighted index. Actual completions equaldeliveries plus the change in the stock of finished aircraft.
.
Boeing strike
Actual
2002 = 100
Boeing Commercial Aircraft Completions: Actual
2002 2003 2004 2005 2006 2007 2008-3
-2
-1
0
1
2
3
30
35
40
45
50
55
60
65
70Percent
RADGO (left scale)
Regional average (right scale)
Note. The measure for real adjusted durable goods orders(RADGO) is a 3-month moving average. Regional average includesnew orders indexes from the Chicago, Dallas, Kansas City, NewYork (Empire State), Philadelphia, and Richmond surveys.
July
Index
June
New Orders: Regional Survey Average and Change inReal Adjusted Durable Goods Orders
9.2
9.3
9.4
9.5
9.6
9.7
9.8
9.9
10.0
10.1
10.2Index
Feb. May Aug. Nov. Feb. May Aug. Nov. Feb. May Aug.2006 2007 2008 Note. One index point equals 1 percent of 2002 total industrialoutput.
Monthly aggregate of weekly indexWeekly index
Weekly Production Index excluding MotorVehicles and Electricity Generation
m1ars02
Typewritten Text
Content partially redacted.

II-11
5 Two counterpoints to the evidence of weakness in semiconductors—and indications that at least the
bottom is not dropping out of the market—are a recent upgrade of Gartner’s semiconductor forecast and an “Apple effect” on flash memory due to strong demand for mobile devices.
6 In addition, capital expenditures by major Internet portals, such as Google, Microsoft, and eBay, were down in the second quarter, and a recent statement by Cisco suggests that most communications equipment customers do not foresee a rebound in activity until early 2009.
boards remained below 1 in June.5 For communications equipment, the annual guidance by telecommunications service providers suggests that capital expenditures will decline over the remainder of the year; capital spending at AT&T and Verizon edged down in the second quarter.6 For computers, industry anecdotes project that production is likely to continue to rise only moderately in the near term. In the most recent survey by the National Association for Business Economics, business plans for future spending on high-tech equipment edged down further in the second quarter; although the diffusion index remains above 50, it is at a relatively low level by historical standards.
Output excluding the production of energy, motor vehicles and parts, and high-tech products decreased at an annual rate of more than 3 percent in the second quarter after having declined at a rate of about 2 percent in each of the two preceding quarters. The index for business equipment fell more than 6 percent in the second quarter, as the production of industrial and other equipment—in particular farm machinery—dropped sharply. The output of consumer goods decreased for a third consecutive quarter, with declines in both durable and nondurable consumer goods.
The output of construction supplies continued to fall in the second quarter, and production in June was about 9½ percent below its peak at the beginning of 2006. The output of products associated with nonresidential construction, such as architectural and structural metals and construction steel, which previously had partially offset the production losses related to residential investment, moved lower in the second quarter. The output of business supplies and materials also moved down.
Indicators of near-term production generally point to further declines in manufacturing activity. Despite an uptick in June, the three-month moving average of real adjusted durable goods orders has decreased, on balance, since the start of the year. The average of the new orders diffusion indexes from the regional manufacturing surveys edged down to 46 in July after having fallen sharply in June. In contrast, the available weekly physical product data for July are on track to contribute positively to IP, mainly because of higher output of motor vehicles, crude oil, and refined petroleum products.

II-12
Sales of Light Vehicles(Millions of units at an annual rate; FRB seasonals)
2007 2008
Category 2007 Q4 Q1 Q2 Apr. May June
Total 16.1 16.1 15.2 14.1 14.4 14.3 13.6
Autos 7.6 7.8 7.4 7.7 7.5 8.0 7.6 Light trucks 8.5 8.3 7.8 6.4 6.9 6.2 6.0
North American1 12.3 12.3 11.5 10.3 10.6 10.4 9.9 Autos 5.3 5.5 5.0 5.0 4.9 5.3 4.9 Light trucks 7.1 6.9 6.5 5.3 5.7 5.1 5.0
Foreign-produced 3.8 3.8 3.7 3.8 3.8 3.8 3.7 Autos 2.4 2.3 2.4 2.7 2.6 2.7 2.7 Light trucks 1.4 1.4 1.3 1.1 1.2 1.1 1.0
Memo:Detroit Three domestic market share (percent)2 51.3 50.6 50.2 45.6 47.4 44.3 45.1
Note. Components may not sum to totals because of rounding. 1. Excludes some vehicles produced in Canada that are classified as imports by the industry. 2. Domestic market share excludes sales of foreign brands affiliated with the Detroit Three.
2006 2007 2008
Percent
0.10
0.14
0.18
0.22
0.26
0.30
0.34
0.38
0.42
Small cars
Large andmidsize cars
Pickup/van/SUV
Cross utility
Market Share of Light Vehicles by Segment
Note. Data through May. FRB seasonals.
-8
4
16
28
40
52
64
76
88 Percent
40
60
80
100
120
140
160
180Index
2002 2003 2004 2005 2006 2007 2008
JulyBad time to buy:Gas prices and shortages
(left scale)
Appraisal of car-buying conditions (right scale)
Car-Buying Attitudes
Source. Reuters/University of Michigan Survey.
m1ars02
Typewritten Text
Content redacted.
m1pmg01
Typewritten Text
Content redacted.

II-13
Motor Vehicle Sales Demand for light vehicles fell markedly in the second quarter. In June, sales plunged to an annual rate of 13.6 million units, the lowest level in 15 years, and sales for the quarter as a whole totaled only 14.1 million units. In addition, industry analysts report that sales have remained depressed in July. Most of the falloff in demand this year seems attributable to general factors such as income and employment. In addition, the drop in June sales likely was a reaction to the sharp rise in gasoline prices in recent months. The percentage of Reuters/Michigan survey respondents who cited high gasoline prices as the reason for their negative view of car-buying conditions stood at near-record levels from May through July.
Higher gasoline prices also appear to have accelerated the shift in motor vehicle sales toward small cars and cross-utility vehicles. The limited availability of some smaller, more fuel-efficient vehicles may also have played a role in the drop in June sales. The shift in demand has contributed to the continued downward movement in the domestic market share of the Detroit Three automakers, which rely heavily on sales of full-size pickups and sport-utility vehicles.
Consumer Spending The latest data on retail sales and consumer prices suggest that real outlays for goods excluding motor vehicles (PCE control) dropped noticeably in June after three months of robust gains. Smoothing through the volatility over the first half of this year, increases in real PCE control averaged 0.2 percent per month. In contrast, real outlays for motor vehicles have declined sharply since the start of the year. Real spending on services posted a solid rise in May—the latest month for which data are available—with a boost from outlays for energy services and recreation. Taken together, these pieces imply that real PCE rose moderately in the second quarter after posting a weak gain in the first quarter.
The resilience of consumer spending so far this year contrasts with the continued weakening of its fundamentals. The ratio of wealth to income declined in the fourth quarter of 2007 and the first quarter of this year, and household net worth has deteriorated further since then as equity prices have declined, on balance, and house prices have continued to fall. Weakness in the labor market has restrained nominal gains in compensation even as the run-up in food and energy prices has crimped the purchasing power of a dollar. Up to this point, households have been able to tap existing credit lines and other assets to maintain their spending. However, the most recent Senior Loan Officer Opinion Survey on Bank Lending Practices indicates a substantial increase in

II-14
Real Personal Consumption Expenditures(Percent change from preceding comparable period)
2008 2008 Category 2007 Q1 Q2 Apr. May June
Annual rate Monthly rate
Total real PCE1 2.9 1.1 n.a. .2 .3 n.a.
Motor vehicles 2.2 -13.4 -19.5 -2.5 -1.5 -1.6 Goods ex. motor vehicles 3.1 -.3 4.7 .6 .5 -.5
Ex. energy 3.6 .5 4.4 .7 .7 -.6 Services 2.8 3.1 n.a. .1 .4 n.a.
Ex. energy 2.7 2.8 n.a. .1 .3 n.a.Memo:
Nominal retail control2 5.2 4.6 10.2 .9 1.1 1.0
1. The values for Q2 and April, May, and June are staff estimates based on available data. 2. Total sales less outlays at building material and supply stores and automobile and other motorvehicle dealers. n.a. Not available.
1990 1992 1994 1996 1998 2000 2002 2004 2006 2008-0.6
-0.4
-0.2
-0.0
0.2
0.4
0.6
0.8
1.0
-0.6
-0.4
-0.2
-0.0
0.2
0.4
0.6
0.8
1.0Percent
Note. The values for April, May, and June are staff estimates based on available data. Shaded bars
Note. Shaded bars indicate periods of business recession as defined by the National Bureau of Economic Research.
indicate periods of business recession as defined by the National Bureau of Economic Research.
Change in Real PCE Goods
6-month moving average
June
2006 2007 2008-1.0
-0.5
0.0
0.5
1.0
1.5
2.0
-1.0
-0.5
0.0
0.5
1.0
1.5
2.0Percent
June
1-month
6-month
1990 1992 1994 1996 1998 2000 2002 2004 2006 20080.0
0.1
0.2
0.3
0.4
0.5
0.0
0.1
0.2
0.3
0.4
0.5Percent
Change in Real PCE Services
6-month moving averageMay
2006 2007 2008-0.6
-0.4
-0.2
-0.0
0.2
0.4
0.6
0.8
1.0
-0.6
-0.4
-0.2
-0.0
0.2
0.4
0.6
0.8
1.0Percent
1-month
6-month
May

II-15
Fundamentals of Household Spending
1998 2000 2002 2004 2006 2008-4
-2
0
2
4
6
8
-4
-2
0
2
4
6
8Percent
Note. The value for December 2004 excludes the effect on incomeof the one-time Microsoft dividend in that month.
May
Personal Saving Rate
1998 2000 2002 2004 2006 2008-4
-2
0
2
4
6
8
-4
-2
0
2
4
6
812-month percent change
Note. Values for December 2004 and December 2005 exclude the effect on income of the one-time Microsoft dividend in December 2004.
May
Note. Values for December 2004 and December 2005 exclude the effect on income of the one-time Microsoft dividend in December 2004.
Change in Real DPI
1998 2000 2002 2004 2006 20084200
6200
8200
10200
12200
14200
16200 Index
4.5
5.0
5.5
6.0
6.5
7.0Ratio
Q1
Wilshire 5000(left scale)
Ratio of householdnet worth to DPI*
(right scale)
Note. The value for 2004:Q4 excludes the effect on income ofthe one-time Microsoft dividend in December 2004.
July 29
Household Net Worth and Wilshire 5000
1998 2000 2002 2004 2006 20080
1
2
3
4
5
6
7
0
1
2
3
4
5
6
7Percent
Target Federal Funds Rate and 10-Year Treasury Yield
July 29
Federalfundsrate
Treasuryyield
1990 1991 1992 1993 1994 1995 1996 1997 1998 1999 2000 2001 2002 2003 2004 2005 2006 2007 2008 200940
60
80
100
120
140
1601985 = 100
40
50
60
70
80
90
100
110
1201966 = 100
July
Conference Board(left scale)
Reuters/Michigan
(right scale)
Consumer Confidence

II-16
Private Housing Activity(Millions of units, seasonally adjusted; annual rate except as noted)
2008
Sector 2007 Q1 Q2 Apr. May June
All units Starts 1.36 1.05 1.02 1.00 .98 1.07 Permits 1.40 .99 1.03 .98 .98 1.14
Single-family units Starts 1.05 .73 .67 .68 .68 .65 Permits .98 .65 .63 .65 .64 .62 Adjusted permits1 .99 .67 .65 .66 .65 .63 Permit backlog2 .109 .097 .087 .095 .093 .087
New homes Sales .78 .56 .54 .54 .53 .53 Months’ supply3 8.40 10.24 9.97 10.14 10.13 9.65
Existing homes Sales 4.94 4.39 4.34 4.34 4.41 4.27 Months’ supply3 8.67 10.23 10.30 10.51 10.02 10.37
Multifamily units Starts .309 .325 .346 .323 .294 .419 Permits .419 .341 .400 .333 .343 .522 Permit backlog2 .075 .067 .066 .065 .064 .066
Mobile homes Shipments .096 .092 n.a. .092 .087 n.a.
Condos and co-ops Existing home sales .713 .560 .573 .550 .580 .590
1. Adjusted permits equal permit issuance plus total starts outside of permit-issuing areas. 2. Number outstanding at end of period. Excludes permits that have expired or have been canceled,
abandoned, or revoked. Not at an annual rate. 3. At current sales rate; expressed as the ratio of seasonally adjusted inventories to seasonally adjusted
sales. Quarterly and annual figures are averages of monthly figures. n.a. Not available.
1999 2000 2001 2002 2003 2004 2005 2006 2007 2008.1
.2
.3
.4
.5
.6
.7
.8
.9
1.0 Millions of units
.0
.2
.4
.6
.8
1.0
1.2
1.4
1.6
1.8
2.0Millions of units
Private Housing Starts and Permits(Seasonally adjusted annual rate)
Single-family starts (right scale)
Single-family adjusted permits (right scale)
June
Note. Adjusted permits equal permit issuance plus total starts outside of permit-issuing areas.
Multifamily starts (left scale)
June

II-17
banks’ reluctance to extend consumer credit (see the appendix to the “Domestic Financial Developments” section). In addition, consumer sentiment—despite the small increase in July—remains at a depressed level.
Fiscal stimulus, in contrast, is likely providing some support to consumer spending. Since the end of April, households have received more than $90 billion in tax rebates. In fact, tax rebates account for the entire 5.3 percent jump (at a monthly rate) in real disposable income in May. With only a few months of spending data available since the rebate distribution began and considerable uncertainty about the underlying strength of spending, the timing and the ultimate magnitude of the response of households to the fiscal stimulus remain difficult to assess. The available indicators provide mixed signals. Consumer surveys report that only a minority of households expects to use the rebates mostly to increase their spending—strikingly similar to the plans reported during the 2001 tax rebates. Yet some retailers are using special promotions in an attempt to encourage rebate spending, and they attribute some types of purchases to tax rebates.
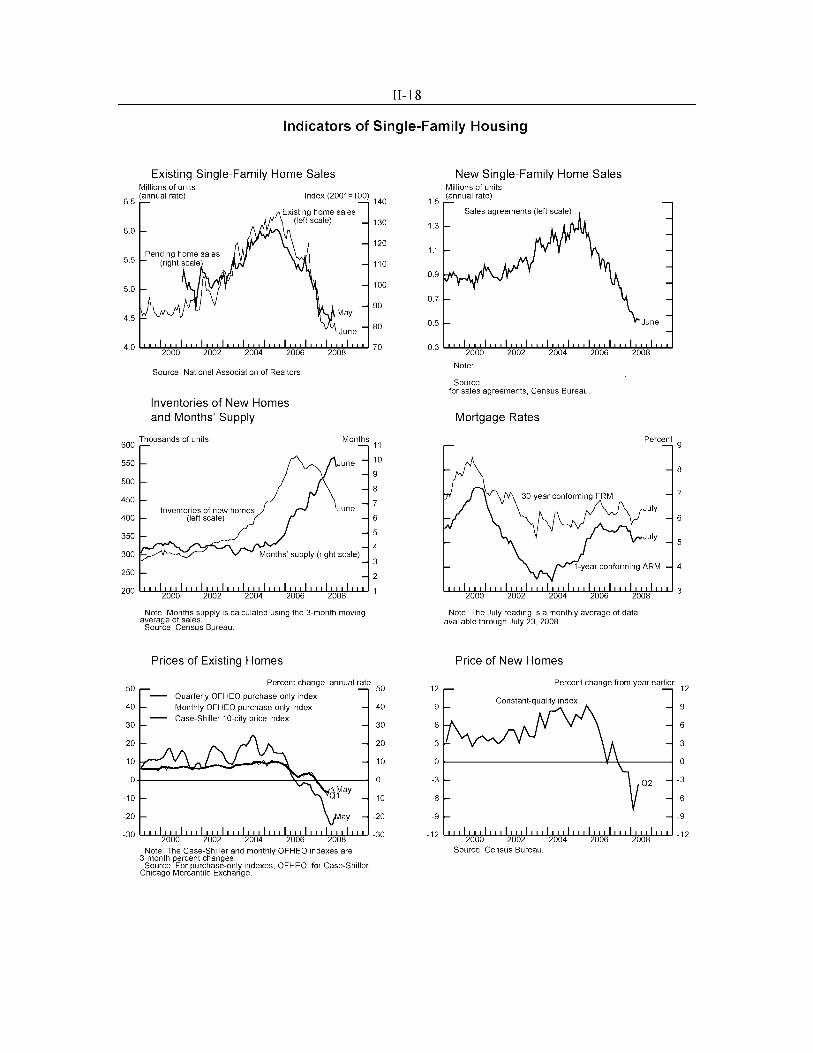
Housing Residential construction activity has continued to descend rapidly this year, albeit at a somewhat slower pace than during the second half of last year. In June, single-family housing starts dropped to an annual rate of 647,000 units, and adjusted permit issuance—a useful month-ahead indicator of starts—slid to an annual rate of 630,000 units. Both of these figures were about 15 percent below their December readings, compared with declines of about 30 percent in the preceding six-month period. In the multifamily sector, housing starts jumped nearly 45 percent in June to an annual rate of 419,000 units—well above the range of readings seen over the past two years. Available information suggests that this increase can be traced to more-stringent building codes that took effect in New York City on July 1, which apparently led developers to move up some planned apartment projects.
Even though cuts in new construction continue to trim the level of new-home inventories, the months’ supply of new homes remains severely bloated because of the ongoing reductions in demand for new houses. The Census Bureau’s measure of sales agreements for new homes edged down to an annual rate of 530,000 units in June, a decrease of 12 percent from six months earlier after a drop of 24 percent in the final six months of 2007.
. Sales of existing single-family homes fell to an
II-18
Indicators of Single-Family Housing
Existing Single-Family Home Sales
6.5
Millions of units (annual rate) Index (2001 = 1 00) 140
6.0
5.5
5.0
4.5
Source. National Association of Realtors.
Inventories of New Homes and Months' Supply
130
120
110
100
90
80
600 Thousands of units Months 11
550
500
450
400
350
300
250
June
June
200 '-'-'.L..I:~!<'-'...L.L~~...L.L......,.~,._...I...LJ'-;!,;\*.I...LJU,!:"""'.I...LJL.J...I
50
40
30
20
10
0
-10
-20
-30
Note. Months supply is calculated using the 3-month moving average of sales.
Source. Census Bureau.
Prices of Existing Homes Percent change, annual rate
Quarterly OFHEO purchase-only index Monthly OFHEO purchase-only index Case-S hiller 1 D-eity price index
Note. The Case-Shiller and monthly OFHEO indexes are 3-month percent changes.
Source. For purchase-only indexes, OFHEO; for Case-Shiller, Chicago Mercantile Exchange.
10
9
8
7
6
5
4
3
2
50
40
30
20
10
0
-10
-20
-30
New Single-Family Home Sales Millions of units
1_5 (annual rate)
1.3
1.1
0.9
0.7
0.5
Note:
Source. for sales agreements, Census Bureau.
Mortgage Rates
Note. The July reading is a monthly average of data available through July 23, 2008.
Price of New Homes
Percent 9
8
7
6
5
12
9
6
Percent change from year earlier 12
3
Ol-------------¥--l~-----1
-3
9
6
3
0
-3
~ ~
~ ~
-12 '-'-'.L..I:"'*'i<'-'...L.L~~...L.L.U,.~,._...L.L.'-;!,;\*.I...LJU,!:"""'~L.J...I -12
Source. Census Bureau.
m1ars02
Typewritten Text
Content partially redacted.

II-19
7 Recent anecdotes from builders also suggest that tightening standards for acquisition, development,
and construction loans are putting downward pressure on housing production, even in markets that have not experienced appreciable declines in demand.
8 Even before the mortgage-market turmoil, offer rates for prime jumbo loans were about ¼ percentage point above conforming rates, likely because the risk of prepayment is higher and because private-label mortgage-backed securities are less liquid.
annual rate of 4.27 million units in June. These sales inched lower over the first half of this year following a 14 percent drop in the second half of 2007. Meanwhile, the measure of homebuying sentiment from Reuters/Michigan and the NAHB index of homebuilder attitudes remain at levels consistent with a further deterioration in housing demand.
Tight conditions in the mortgage credit markets continue to restrain housing demand.7 The deterioration has been particularly acute for nonprime and nonconforming jumbo mortgages that cannot be purchased by government-sponsored enterprises (GSEs); new issuance of such loans has virtually halted, and lending spreads remain very wide. Although recent legislation created a new class of conforming loans with higher loan limits in high-priced cities, originations of these new jumbo conforming loans have been very sluggish, and offer rates for these loans are still 25 to 50 basis points above those for standard conforming loans.8 Meanwhile, rates for standard 30-year fixed-rate conforming mortgages have risen about ¾ percentage point since mid-April to 6.6 percent. In addition, these mortgages have become more difficult to obtain, as the GSEs have tightened lending standards and are charging higher guarantee fees on loans to borrowers with lower credit scores and smaller down payments. Moreover, down-payment requirements have become a more binding restriction on many potential buyers, because many private mortgage insurers have raised their fees and adopted more-stringent standards and because few lenders are willing to extend second mortgages that allow borrowers to sidestep these requirements.
House prices remain on a downward trajectory. The monthly version of the purchase-only repeat-sales price index calculated by the Office of Federal Housing Enterprise Oversight (OFHEO) decreased at an annual rate of 6¾ percent over the three months ending in May. By comparison, the 10-city version of the Case-Shiller repeat-sales price index—which, unlike the OFHEO index, includes houses financed by nonconforming loans and is more heavily concentrated in urban areas that had seen a more substantial run-up of house prices— tumbled at an annual rate of almost 20 percent over the same period. As for new homes, the constant-quality price index—which attempts to control for changes in the quality and geographic composition of new homes sold—was down 3½ percent in the second quarter relative to its level four quarters earlier. Though these

II-20
2000 2002 2004 2006 200870
90
110
130
150
170
190210
240
7
9
11
13
15
17
1921
242000 = 100 Billions of chained (2000) dollars
2000 2002 2004 2006 2008
June
Note. Ratio scales. Shipments are deflated by the staffprice index for computers and peripheral equipment, which is derived from the BEA’s quality-adjusted price indexes.
Real M3shipments
(right scale)
Industrial production(left scale)
Computers and Peripherals
2000 2002 2004 2006 20082
5
8
11
14
1720
2
5
8
11
14
1720
Billions of chained (2000) dollars, ratio scale
2000 2002 2004 2006 2008
June
Note. Shipments and orders are deflated by a price index that is derived from the BEA’s quality-adjusted price indexesand uses the PPI for communications equipment for monthly interpolation.
ShipmentsOrders
Communications Equipment
2000 2002 2004 2006 2008220
340
460
580
700
820940
1060
1240
220
340
460
580
700
8209401060
1240Thousands of units, ratio scale
2000 2002 2004 2006 2008
June
Note. Annual rate, FRB seasonals. Source. For sales, Ward’s Communications; for orders, ACT Research.
Sales of class 4-8 trucks
Net new ordersof class 5-8 trucks
Medium and Heavy Trucks
2000 2002 2004 2006 200832
37
42
47
52
59
32
37
42
47
52
59Billions of chained (2000) dollars, ratio scale
2000 2002 2004 2006 2008
June
Note. Shipments and orders are deflated by the staff price indexes for the individual equipment types included in this category. Indexes are derived from the BEA’squality-adjusted price indexes.
Orders
Shipments
Non-High-Tech, Nontransportation Equipment
Orders and Shipments of Nondefense Capital Goods(Percent change; seasonally adjusted current dollars)
2008
Category Q1 Q2 Apr. May June
Annual rate Monthly rate
Shipments -.1 3.0 1.8 -.3 .5 Excluding aircraft -.4 5.9 1.0 .2 .7 Computers and peripherals -5.8 -17.7 -4.5 2.8 -1.1 Communications equipment 2.6 4.1 -3.9 4.9 4.5 All other categories -.1 8.9 2.1 -.5 .5
Orders -5.6 -7.5 -2.4 .2 -3.2 Excluding aircraft 4.7 10.4 3.1 -.1 1.4 Computers and peripherals -1.7 -7.2 -10.5 9.3 -1.1 Communications equipment .6 -3.8 .3 1.5 -6.8 All other categories 5.7 13.7 4.8 -1.1 2.4
Memo: Shipments of complete aircraft1 44.3 n.a. 40.2 44.2 n.a.
1. From Census Bureau, Current Industrial Reports; billions of dollars, annual rate. n.a. Not available.

II-21
lower prices may eventually help bolster sales, survey evidence and anecdotal reports suggest that expectations of further house price declines are quite prevalent, a consideration that may make potential buyers reluctant to purchase homes until prices show signs of stabilizing.
Equipment and Software Real spending on equipment and software (E&S) appears to have been little changed in the second quarter, as a large decline in business outlays for motor vehicles more than offset a modest gain in E&S excluding transportation. Nontransportation investment held up reasonably well through midyear despite a subpar rate of increase in business output and an apparent increase in the user cost of capital, reflecting higher borrowing rates and an acceleration in the relative price of capital goods.
While monthly indicators of business sentiment—both national and regional—have edged back up over the past few months, they remain downbeat for the most part. Moreover, financial conditions have deteriorated further since the June Greenbook. In particular, corporate bond yields have increased somewhat in recent weeks, leaving spreads on investment-grade corporate bonds over Treasury yields near their recent peaks in March. In addition, according to the July Senior Loan Officer Opinion Survey, a large fraction of banks reported that they further tightened lending standards and terms on commercial and industrial loans.
Business outlays on transportation equipment fell sharply in the second quarter. Automakers continued to scale back deliveries to daily rental companies; demand from other businesses weakened as well. In June, sales of medium and heavy trucks edged down further from the already-weak pace observed in preceding months. New orders also moved down, a sign that truck sales are unlikely to improve in the near term. Data on aircraft shipments through May suggest that domestic outlays in this category may have retreated a little in the second quarter.
Spending on computers and software appears to have risen at a moderate rate in the first half of the year. The Bureau of Economic Analysis reported that software spending rose at a healthy pace in the first quarter, and Microsoft reported a strong increase in second-quarter revenues. Although nominal shipments of computers and peripheral equipment from domestic producers declined at a more rapid pace in the second quarter, imports of such items jumped in May. Investment in communications equipment has been soft recently, with shipments increasing only modestly and new orders declining in the second quarter.

II-22
Fundamentals of Equipment and Software Investment
1990 1991 1992 1993 1994 1995 1996 1997 1998 1999 2000 2001 2002 2003 2004 2005 2006 2007 2008-4
-2
0
2
4
6
8
-4
-2
0
2
4
6
84-quarter percent change
1990 1991 1992 1993 1994 1995 1996 1997 1998 1999 2000 2001 2002 2003 2004 2005 2006 2007 2008
Q1
Source. Bureau of Economic Analysis.
Real Business Output
1990 1995 2000 2005-15
-12
-9
-6
-3
0
3
6
9
12
15
-15
-12
-9
-6
-3
0
3
6
9
12
154-quarter percent change
1990 1992 1994 1996 1998 2000 2002 2004 2006 2008
Q1
High-tech
Non-high-tech
Source. Staff calculation.
User Cost of Capital
2000 2001 2002 2003 2004 2005 2006 2007 20084.5
5.5
6.5
7.5
8.5
9.5
10.5
11.5
12.5
13.5
4.5
5.5
6.5
7.5
8.5
9.5
10.5
11.5
12.5
13.5Percent
2000 2001 2002 2003 2004 2005 2006 2007 2008
10-year BBB
10-year high-yield
July 29
Note. Daily averages based on Merrill Lynch bond data.
Corporate Bond Yields
1990 1995 2000 2005300
500
700
900
1100
1300
1500
1700 Billions of chained (2000) dollars
0.7
0.8
0.9
1.0
1.1
1.2
1.3
1.4
1.5
Ratio
1991 1995 1999 2003 2007
Q1
Q1
Real cash flow (left scale)
Ratio of cash flowto fixed investment
(right scale)
Note. Cash flow and fixed investment for the corporate businesssector. Source. Bureau of Economic Analysis; FRB flow of funds accounts.
Corporate Cash Flow
2000 2002 2004 2006 200830
40
50
60
70
20
30
40
50
60
70
80Diffusion index
2000 2001 2002 2003 2004 2005 2006 2007 2008
June
July
Source. Manufacturing ISM Report on Business;Philadelphia Fed Business Outlook Survey.
ISMPhiladelphia Fed
Surveys of Business Conditions

II-23
Real spending on equipment other than high-tech and transportation looks to have improved a bit last quarter after having declined in the preceding two quarters. Orders and shipments for this broad category of equipment posted noticeable increases in the second quarter. Orders for mining and oilfield machinery as well as for HVAC (heating, ventilation, and air conditioning) equipment were particularly strong. Moreover, the second-quarter increase in spending on capital goods seems have been considerably greater than one would infer from domestic shipments alone, as imports of such items surged in April and May.
Some—but not all—of the apparent increase in nominal spending during the second quarter likely reflects large price increases for these capital goods. Prices have accelerated for both domestic and imported equipment: The producer price index (PPI) for capital goods excluding high-tech and transportation rose at an annual rate of 4¾ percent over the first half of 2008, up from 2½ percent in 2007. Prices for imported capital goods excluding computers and semiconductors, which rose 3¼ percent last year, increased at annual rates of 4 percent in the first quarter and 8½ percent in the second quarter.
Nonresidential Construction Data through May continue to show a robust increase in nonresidential construction activity. However, recent market fundamentals and forward-looking indicators for this sector have deteriorated. Vacancy rates in the office and industrial sectors reversed course in the first quarter following several years of declines, and rates for retail space continued on an upward trajectory. In the resale market, sales of existing commercial properties have plunged so far this year after 2007’s record pace, and prices are showing signs of softening. On the financing side, issuance of commercial mortgage-backed securities has fallen dramatically this year, corporate bond spreads remain wide, and recent (SLOOS) point to rapidly tightening standards for commercial real estate loans. Costs are also surging: The PPI for materials and components for construction rose at an annual rate of nearly 20 percent over the three months ending in June, and anecdotes from general contractors suggest that price increases for key construction inputs (like asphalt, steel, and plastic materials) are squeezing profit margins. The negatives for nonresidential activity appear to be depressing plans for new projects; the three-month average of the architectural billings index has registered a string of weak readings since February that are consistent with outright declines in nonresidential building outlays in the second half of this year.

II-24
Nonresidential Construction and Indicators(All spending series are seasonally adjusted at an annual rate; nominal CPIP deflated by
BEA prices through Q1 and by staff projection thereafter)
2000 2002 2004 2006 2008170
190
210
230
250
270
290
170
190
210
230
250
270
290Billions of chained (2000) dollars
2000 2002 2004 2006 2008
May
Total Structures
2000 2002 2004 2006 200820
30
40
50
60
70
80
90
20
30
40
50
60
70
80
90Billions of chained (2000) dollars
2000 2002 2004 2006 2008
Note. Other consists of structures for religious organizations,education, lodging, amusement and recreation, transportation,and health care.
OfficeMay
Commercial
May
Other
May
Office, Commercial, and Other
2000 2002 2004 2006 200810
20
30
40
50
60
70
10
20
30
40
50
60
70Billions of chained (2000) dollars
2000 2002 2004 2006 2008
Manufacturing
May
Manufacturing
Power & communication
and Power & Communication
2000 2002 2004 2006 2008-1.0
-0.5
0.0
0.5
1.0
1.5
2.0
2.5
3.0 Percent
35
40
45
50
55
60Diffusion index
June
2000 2002 2004 2006 2008
Architectural Billings andNonresidential Construction Employment
June
Billings (right scale)
Change inemployment (left scale)
Note. Both series are 3-month moving averages. Employmentconsists of industrial, commercial, and specialty trade construction. Source. For billings, American Institute of Architects;for employment, Bureau of Labor Statistics.
2000 2002 2004 2006 20080
3
6
9
12
15
18
0
3
6
9
12
15
18Percent
2000 2002 2004 2006 2008
Office
Q1
Retail
Industrial
Note. Industrial space includes both manufacturingstructures and warehouses. Source. Torto Wheaton Research.
Vacancy Rates
2000 2002 2004 2006 20080
5
10
15
20
25
30
35 Millions of feet
400
600
800
1000
1200
1400
1600
1800
2000
2200
2400Number
Drilling rigs(right scale)
2000 2002 2004 2006 2008
Footage drilled (left scale)
JulyJune
Note. The July readings for drilling rigs are based ondata through July 25, 2008. Both series are seasonallyadjusted by FRB staff. Source. DOE/Baker Hughes.
Drilling and Mining Indicators
II-25
2000 2002 2004 2006 20081.1
1.2
1.3
1.4
1.5
1.6
1.7
1.8
1.9
1.1
1.2
1.3
1.4
1.5
1.6
1.7
1.8
1.9 Months
2000 2002 2004 2006 2008
May
June
Census book-value data
Staff flow-of-goods system
Note. Flow-of-goods system covers total industry ex.motor vehicles and parts, and inventories are relativeto consumption. Census data cover manufacturing and trade ex. motor vehicles and parts, and inventories arerelative to sales.
Inventory Ratios ex. Motor Vehicles
2000 2002 2004 2006 200835
40
45
50
55
60
35
40
45
50
55
60 Index
2000 2002 2004 2006 2008
June
Note. A number above 50 indicates inventories are "too high."
ISM Customer Inventories:Manufacturing
Nonfarm Inventory Investment (Billions of dollars; seasonally adjusted annual rate)
2007 2008
Measure and sector Q3 Q4 Q1 Mar. Apr. May
Real inventory investment(chained 2000 dollars)Total nonfarm business 26.0 -21.7 -18.9 n.a. n.a. n.a. Motor vehicles 13.3 -25.7 -18.8 n.a. n.a. n.a. Nonfarm ex. motor vehicles 12.7 4.0 -.1 n.a. n.a. n.a.
Manufacturing and trade ex. wholesale and retail motor vehicles and parts e 18.1 7.6 9.3 -39.9 -24.4 n.a. Manufacturing e 3.1 8.5 16.5 7.6 -47.1 n.a. Wholesale trade ex. motor vehicles & parts e 13.9 -8.8 .0 -24.2 10.0 n.a. Retail trade ex. motor vehicles & parts e 1.1 7.9 -7.2 -23.3 12.8 n.a.
Book-value inventory investment(current dollars) Manufacturing and trade ex. wholesale and retail motor vehicles and parts 41.4 70.4 95.8 56.9 78.1 71.7 Manufacturing 16.2 34.7 60.5 61.4 -1.9 33.7 Wholesale trade ex. motor vehicles & parts 22.0 23.0 39.0 12.8 56.8 40.2 Retail trade ex. motor vehicles & parts 3.2 12.7 -3.7 -17.3 23.2 -2.3
n.a. Not available.e Staff estimate of real inventory investment based on revised book-value data.Source. For real inventory investment, BEA; for book-value data, Census Bureau.

II-26
Federal Government Budget(Unified basis; adjusted for payment-timing shifts and financial
transactions; data from Monthly Treasury Statement)
1994 1995 1996 1997 1998 1999 2000 2001 2002 2003 2004 2005 2006 2007 2008-500
-400
-300
-200
-100
0
100
200
300
-500
-400
-300
-200
-100
0
100
200
300Billions of dollars
12-month moving sum
June
Surplus or Deficit (-)
1994 1995 1996 1997 1998 1999 2000 2001 2002 2003 2004 2005 2006 2007 2008-15
-10
-5
0
5
10
15
20
-15
-10
-5
0
5
10
15
20Percent change from year earlier
12-month moving sum
Outlays
Receipts
June
Outlays and Receipts
Recent Federal Outlays and Receipts(Billions of dollars except as noted)
April-June 12 months ending in June
Percent Percent Function or source 2007 2008 change 2007 2008 change
Outlays 682.8 762.4 11.7 2,721.0 2,904.8 6.8 Net interest 65.2 58.6 -10.1 234.4 245.6 4.8 National defense 139.5 155.9 11.8 551.3 603.6 9.5 Major transfers1 377.7 437.7 15.9 1,495.8 1,610.0 7.6 Other 100.3 110.2 9.8 439.5 445.6 1.4
Receipts 824.4 787.9 -4.4 2,548.3 2,556.2 .3 Individual income and payroll taxes 633.0 611.9 -3.3 1,956.2 2,002.8 2.4 Corporate income taxes 125.6 107.0 -14.8 382.3 327.2 -14.4 Other 65.9 68.9 4.7 209.8 226.3 7.8
Surplus or deficit (-) 141.6 25.5 ... -172.7 -348.5 ... Memo:Unadjusted surplus or deficit (-) 137.5 44.1 ... -162.7 -309.2 ...
1. Includes Social Security, Medicare, Medicaid, and income security programs. ... Not applicable.

II-27
9 The Economic Stimulus Act of 2008 authorized an expected total of about $115 billion in stimulus
rebates, with $94 billion going out by the end of July, another $5 billion being disbursed over the remainder of calendar year 2008, and around $16 billion being distributed during the tax-filing season in 2009.
10 The Administration's Mid-Session Review of the Budget (MSR), which was released on July 28, projects the deficit for fiscal 2008 to be $389 billion, narrower than the Administration’s estimate of $410 billion in February but wider than suggested by the trend for the deficit over the first nine months of the fiscal year. Historically, the MSR has tended to be too pessimistic on the current-year deficit.
In the drilling and mining sector, rising energy prices have been stimulating activity for some time now, though the quarterly pattern has been uneven. Recent readings for footage drilled and the number of drilling rigs in operation suggest that activity resumed its upward climb in the second quarter after having paused early this year.
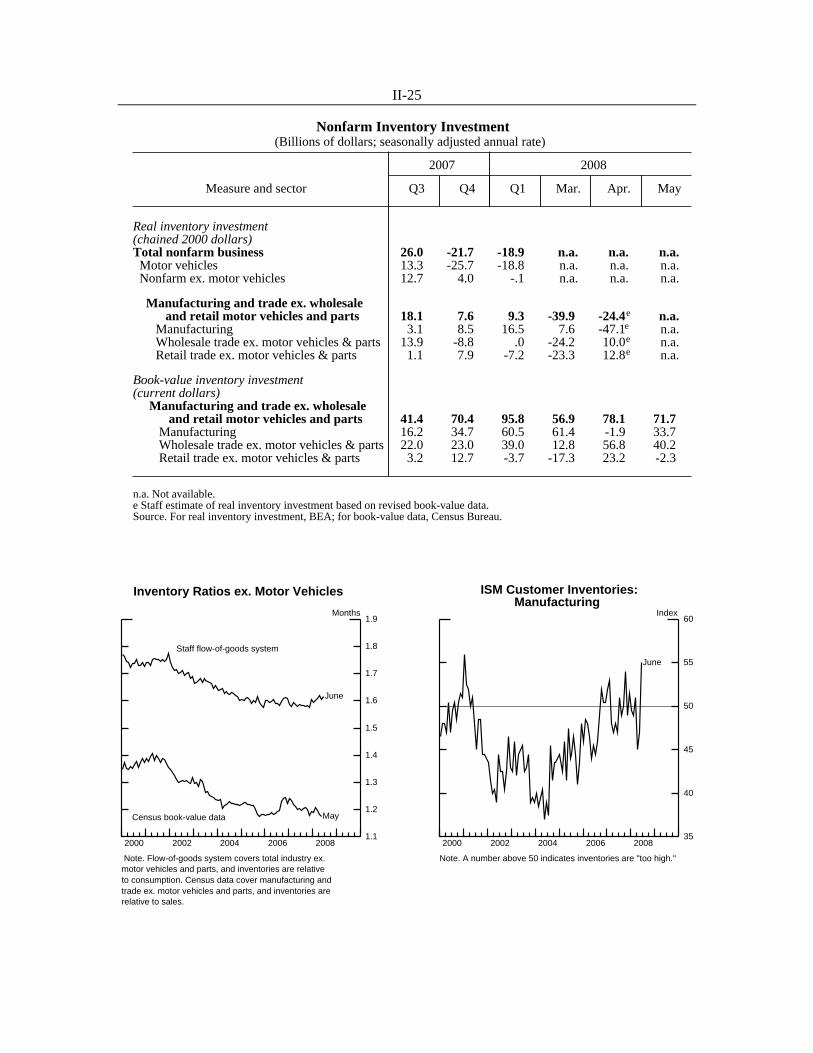
Business Inventories The indicators we track continue to send mixed messages regarding whether firms are holding excess inventories. On the one hand, the ratio of book-value inventories to sales (excluding motor vehicles) ticked down again in May and does not appear particularly elevated. On the other hand, information from the staff’s flow-of-goods inventory system suggests that months’ supply of goods excluding motor vehicles and parts has moved up, on balance, since November 2007; the recent increase is similar in magnitude to that witnessed during the 1995 inventory cycle and in the period before the 2001 recession. The details from the flow-of-goods system point to some deterioration in manufacturers’ inventory positions in areas such as equipment, construction supplies, and materials.
Federal Government Sector The deficit in the unified federal budget deteriorated markedly in the second quarter as the rise in tax receipts slowed further, outlays increased briskly, and the bulk of the stimulus rebates were mailed out.9 Adjusted for payment-timing shifts and financial transactions, the unified budget surplus recorded in the three tax-heavy months ending in June was $116 billion less than the adjusted surplus in the same period last year; the stimulus rebates accounted for about two-thirds of this erosion. Over the 12 months ending in June, the adjusted deficit was $349 billion, or approximately 2½ percent of nominal GDP.10
Excluding the effects of stimulus rebates, tax receipts in the April to June period posted a meager gain of 2 percent over their level in the comparable period last year. The slowing in federal tax payments has been most pronounced in corporate tax receipts, probably reflecting the decline in corporate book profits relative to a year ago. Net corporate receipts in the second quarter—which included firms’ first and second quarterly estimated payments on 2008 liabilities—were 15 percent below their level in the same

II-28
State and Local Indicators
1998 2000 2002 2004 2006 2008-4
-2
0
2
4
6
8
10
12
-4
-2
0
2
4
6
8
10
12
Percent change, annual rate
Q1
Spending4-quarter moving average
Real Spending on Consumption & Investment
1998 2000 2002 2004 2006 2008-10
0
10
20
30
40
50
-10
0
10
20
30
40
50
Thousands of jobs, monthly average
Q2
Net Change in Employment
1998 2000 2002 2004 2006 2008140
150
160
170
180
190
200
140
150
160
170
180
190
200Annual rate Billions of chained (2000) dollars
Q2
Note. Nominal CPIP deflated by BEA prices throughQ1 and by a staff projection thereafter. Observation for Q2 is the average for April and May.
Real Construction
0
2
4
6
8
10
12
14
0
2
4
6
8
10
12
14
Percent of expenditures
1988 1992 1996 2000 2004 2008 Note. Dots indicate estimated fiscal reserve balances;value for FY2009 is based on recommended budgets. Theshaded bars are periods of business recession as definedby the Natl. Bureau of Economic Research. Source. Natl. Governors Assn. and Natl. Assn. of StateBudget Officers, The Fiscal Survey of States.
June 2008December 2007
State Fiscal Reserve Balances at Year-End
1998 2000 2002 2004 2006 2008-15
-10
-5
0
5
10
15
20
-15
-10
-5
0
5
10
15
20
Percent change from year earlier
4-quarter moving average
Totalrevenues
Individual and corporate income taxes
Q1
Source. Census Bureau.
State Revenues
1998 2000 2002 2004 2006 20080
2
4
6
8
10
12
14
0
2
4
6
8
10
12
14
Percent change from year earlier
4-quarter moving average
Property taxes
Total revenues
Q1
Source. Census Bureau.
Local Revenues

II-29
year-earlier period. Individual income and payroll taxes, excluding stimulus rebates, posted a modest gain of 5 percent, down from more than 8¾ percent in the year-earlier period, likely consistent with the deceleration in personal income.
Adjusted federal outlays in the second quarter rose 11¾ percent above the level in the year-earlier period. Defense spending increased almost 12 percent over this period, which points to a robust increase in real defense purchases in the second quarter as measured in the national income and product accounts. Transfer payments also moved up briskly relative to a year ago, boosted in part by the portion of the stimulus rebates sent to households with little or no tax liability; such rebates are counted as transfer payments in the budget.
At the end of June, the Supplemental Appropriations Act of 2008 was passed, providing $163 billion in funding for military activities in Iraq and Afghanistan. This funding is expected to be spent through the rest of 2008 and into the middle of 2009. This legislation also included a temporary 13-week extension of unemployment insurance benefits to workers who have exhausted their regular 26 weeks of unemployment benefits. The extension is expected to provide a total of about $12 billion in additional benefits to covered workers still unemployed in the second half of 2008 and the first quarter of 2009.
The Congress passed, and the President has signed, legislation making a number of changes to federal housing policy. This legislation would provide temporary authority to the Treasury to purchase an unspecified amount of debt and equity issued by Fannie Mae, Freddie Mac, and the Federal Home Loan Banks. The Congressional Budget Office (CBO) estimated that there is a greater than 50 percent chance that this Treasury authority will not be used before it expires at the end of December 2009. Nonetheless, reflecting the large estimated expense in the event the authority is acted upon, the CBO put the expected cost of this authority to the federal budget at $25 billion, spread over fiscal 2009 and 2010. The other provisions in this legislation are estimated by the CBO to increase the federal deficit by around $20 billion through fiscal 2010. These provisions include a temporary program allowing the Federal Housing Administration to refinance mortgages that have been written down to 90 percent or less of their current assessed value, a temporary tax credit for first-time homebuyers, and some additional funds for state governments to purchase and rehabilitate foreclosed and abandoned homes.

II-30
Price Measures(Percent change)
12-month change 3-month change 1-month change
Annual rate Monthly rate
June June Mar. June May JuneMeasures 2007 2008 2008 2008 2008 2008
CPITotal 2.7 5.0 3.1 7.9 .6 1.1 Food 4.1 5.3 5.3 8.5 .3 .8 Energy 4.6 24.7 8.6 53.6 4.4 6.6 Ex. food and energy 2.2 2.4 2.0 2.5 .2 .3 Core goods -.8 .2 -.1 -.1 -.1 .1 Core services 3.4 3.3 2.9 3.6 .3 .4 Shelter 3.8 2.5 2.2 2.2 .2 .3 Other services 2.8 4.3 3.9 5.4 .5 .5 Chained CPI (n.s.a.) 1 2.4 4.2 ... ... ... ... Ex. food and energy 1 1.8 2.1 ... ... ... ...
PCE prices 2
Total 2.3 3.8 3.0 5.7 .4 .8 Food and beverages 3.8 5.0 5.4 7.2 .2 .6 Energy 4.4 20.3 8.3 53.1 4.3 6.8 Ex. food and energy 1.9 2.3 2.2 2.1 .1 .3 Core goods -.9 .0 .5 -.3 -.2 .1 Core services 3.1 3.1 2.9 3.0 .2 .3 Shelter 3.7 2.7 2.4 2.4 .2 .3 Other services 2.8 3.3 3.0 3.2 .3 .3 Core market-based 1.7 2.1 1.9 2.2 .1 .3 Core non-market-based 2.7 3.2 3.7 1.6 .0 .3
PPITotal finished goods 3.3 9.2 10.7 14.1 1.4 1.8 Food 6.5 8.3 9.9 9.6 .8 1.5 Energy 5.1 27.0 25.5 51.9 4.9 6.0 Ex. food and energy 1.7 3.0 5.3 3.7 .2 .2 Core consumer goods 1.8 3.4 5.7 4.2 .3 .3 Capital equipment 1.6 2.5 4.3 3.2 .1 .3 Intermediate materials 3.6 14.5 18.3 26.8 2.9 2.1 Ex. food and energy 2.6 8.4 10.4 19.3 2.0 1.3 Crude materials 15.5 45.5 78.0 70.1 6.7 3.7 Ex. food and energy 10.2 33.0 59.2 63.4 5.0 -.2
1. Higher-frequency figures are not applicable for data that are not seasonally adjusted. 2. PCE prices in June 2008 are staff estimates. ... Not applicable.

II-31
State and Local Government Sector Incoming data suggest that real purchases by state and local governments rose moderately in the second quarter. Following a sharp drop-off in the first quarter, nominal construction spending rebounded in April and May, increasing at an annual rate of about 8 percent relative to the first-quarter average. Hiring by state and local governments also appears to be holding up. Employment gains in the second quarter averaged 21,000 per month, a bit above the average level of hiring over the past four years. According to the Census Bureau, state and local tax revenues continued to decelerate in the first quarter, posting an average increase of about 5 percent relative to a year earlier.
Despite the slowing of state revenues, aggregate state budget balances still appear to be in generally good shape. Recent data from the National Association of State Budget Officers (NASBO) indicate that states will end the current fiscal year with balances in the range of 8 percent of expenditures on average—well above the threshold of 5 percent that is generally thought to provide an adequate fiscal cushion. The situation varies across the states, however. Several states, such as California and Florida, are already under significant strain, while others, particularly the agricultural and energy-producing states, remain in solid fiscal health. The NASBO report indicates that states expect to face increasing budget pressures over the next few years from decelerating revenues and further increases in Medicaid. In anticipation of these future pressures, state governors have proposed increasing nominal expenditures only about 1 percent in fiscal 2009. Under the assumption that these proposed budgets are enacted and that spending and revenues come in as the governors expect, year-end balances in fiscal 2009 would be roughly the same share of expenditures as in fiscal 2008.
Prices Headline consumer price inflation has stepped up in recent months, spurred by sizable increases in food and energy prices. On the basis of the June data for the consumer price index (CPI) and PPI, we estimate that overall PCE prices increased 0.8 percent last month after having risen 0.4 percent in May. These increases would push the average annual rate of inflation over the first half of this year to 4½ percent, up from 3½ percent over the 12 months of 2007. Excluding food and energy, PCE price inflation also is estimated to have been elevated in June, but, on balance, core prices have increased this year at about the same rate as last year.
We estimate that PCE energy prices climbed nearly 7 percent last month after having moved up more than 4 percent in May. The recent run-up in energy prices has brought the change over the first half of this year to an annual rate of nearly 30 percent, up from

II-32
Consumer Prices(12-month change except as noted)
2000 2002 2004 2006 20080
1
2
3
4
0
1
2
3
4 Percent
2000 2002 2004 2006 2008
June*Total PCE
Core PCE
* Staff estimate.
PCE Prices
2000 2002 2004 2006 20080
1
2
3
4
0
1
2
3
4 Percent
2000 2002 2004 2006 2008
June*
chainedCPI
PCE
CPI
* PCE for June is a staff estimate.
CPI and PCE ex. Food and Energy
2000 2002 2004 2006 20080
1
2
3
0
1
2
3 Percent
2000 2002 2004 2006 2008
June*
Market-based components
* Staff estimate.
PCE excluding Food and Energy
2000 2002 2004 2006 2008-1
0
1
2
3
4
5
-1
0
1
2
3
4
5 Percent
2000 2002 2004 2006 2008
June*
3-month change, annual rate
* Staff estimate.
PCE excluding Food and Energy
2000 2002 2004 2006 2008-3
-2
-1
0
1
2
3
4
-3
-2
-1
0
1
2
3
4 Percent
2000 2002 2004 2006 2008
June*
June*
Services ex. energy
Goods ex. food and energy
* Staff estimate.
PCE Goods and Services
2000 2002 2004 2006 2008-1
0
1
2
3
4
5
-1
0
1
2
3
4
5 Percent
2000 2002 2004 2006 2008
June
3-month change, annual rate
CPI excluding Food and Energy

II-33
Energy and Food Price Indicators(Data from Energy Information Administration except as noted)
2005 2006 2007 200860
80
100
120
140
160
180
60
80
100
120
140
160
180Cents per gallon
Retail price less average spot crude price*
* Regular grade seasonally adjusted by FRB staff,less average spot crude price: 60% WTI, 40% Mayaheavy crude. Includes gasoline taxes.
July 28
Total Gasoline Margin
2005 2006 2007 200850
100
150
200
250
300
350
400
450
50
100
150
200
250
300
350
400
450Cents per gallon
* Regular grade seasonally adjusted by FRB staff.** 60% WTI, 40% Maya heavy crude.
Retail price*Rack price
Average spot crude price**
July 28
Gasoline Price Decomposition
2005 2006 2007 2008185
195
205
215
225
235
245
185
195
205
215
225
235
245Millions of barrels
Note. Shaded region is average historical range ascalculated by DOE. Monthly data through May 2008,weekly data thereafter. * Adjustment for approximate amount of fuel ethanol to beblended with RBOB component of inventories; estimated byFRB staff.
July 25
Excluding ethanolAdjusted for ethanol use*
Gasoline Inventories
2005 2006 2007 2008100
150
200
250
300
350
400
450
500
100
150
200
250
300
350
400
450
500Cents per gallon
Source. Chicago Board of Trade.
Near-futures price, dailyMonthly futures, July 29
Ethanol Prices
2005 2006 2007 20080
1
2
3
4
5
6
7
8
9 Dollars per bushel
0
2
4
6
8
10
12
14
16Dollars per bushel
July 29
Source. Commodity Research Bureau.
Corn (left scale)Soybeans (right scale)Wheat (right scale)
Spot Agricultural Commodity Prices
2005 2006 2007 20080.0
0.5
1.0
1.5
2.0
2.5
3.0
3.5
4.0
4.5
5.0
5.5
0.0
0.5
1.0
1.5
2.0
2.5
3.0
3.5
4.0
4.5
5.0
5.512-month percent change
June*
Food and beverages
Ex. food and energy
Source. Bureau of Economic Analysis. *Staff estimate.
PCE Food Prices

II-34
Broad Measures of Inflation(Percent change, Q1 to Q1)
Measure 2005 2006 2007 2008
Product pricesGDP price index 3.3 3.2 2.9 2.2 Less food and energy 3.3 3.1 2.9 1.9
Nonfarm business chain price index 3.3 3.3 2.3 1.5
Expenditure pricesGross domestic purchases price index 3.5 3.6 2.6 3.2 Less food and energy 3.2 2.9 2.8 2.0
PCE price index 2.8 3.1 2.3 3.4 Less food and energy 2.3 2.0 2.4 2.0
PCE price index, market-based components 2.4 2.9 2.2 3.5 Less food and energy 1.8 1.6 2.2 1.8
CPI 3.0 3.7 2.4 4.2 Less food and energy 2.3 2.1 2.6 2.4
Chained CPI 2.6 3.2 2.2 3.7 Less food and energy 2.1 1.9 2.2 2.1
Median CPI 2.5 2.7 3.2 3.1 Trimmed mean CPI 2.4 2.6 2.7 2.9
Trimmed mean PCE 2.5 2.4 2.7 2.3
Actual CPI inflation 1
Professional forecasters (10 years) 4
Surveys of Inflation Expectations(Percent)
Reuters/Michigan Survey
1 year 2 5 to 10 years 3
Period Mean Median Mean Median CPI PCE
2006:Q3 3.3 4.0 3.4 3.3 3.0 2.5 ... Q4 1.9 3.5 3.0 3.5 3.0 2.5 ...
2007:Q1 2.4 3.6 3.0 3.4 2.9 2.4 2.0 Q2 2.7 4.2 3.3 3.5 3.0 2.4 2.0 Q3 2.4 4.1 3.2 3.5 3.0 2.4 2.1 Q4 4.0 4.1 3.3 3.3 2.9 2.4 2.1
2008:Q1 4.1 4.2 3.8 3.3 3.0 2.5 2.2 Q2 4.4 6.4 5.0 3.8 3.3 2.5 2.2
2008:Mar. 4.0 4.6 4.3 3.2 2.9 ... ... Apr. 3.9 5.7 4.8 3.5 3.2 ... ... May 4.2 7.0 5.2 4.0 3.4 2.5 2.2 June 5.0 6.5 5.1 4.0 3.4 ... ... July n.a. 6.3 5.1 3.5 3.2 ... ...
1. Percent change from the same period in the preceding year. 2. Responses to the question, By about what percent do you expect prices to go up, onaverage, during the next 12 months? 3. Responses to the question, By about what percent per year do you expect prices to go up,on average, during the next 5 to 10 years? 4. Median CPI and PCE price projections compiled by the Federal Reserve Bank of Philadelphia. ... Not applicable. n.a. Not available.

II-35
11 Sharply higher prices at the pump have weighed on the demand for gasoline, and gasoline
inventories have increased to the upper end of their seasonal range this summer.
20 percent last year. In the wake of the surge in the cost of crude oil this year, retail gasoline prices jumped in May and June after having declined slightly, on balance, in the first four months of this year. Survey data point to another large increase in gasoline prices in July.11 However, the recent drop in crude oil prices should greatly reduce the upward pressure on retail gasoline prices in coming months.
We estimate that the PCE price index for food and beverages jumped 0.6 percent in June, and over the first six months of this year, these prices are estimated to have risen at an annual rate of 6¼ percent, up from 4¾ percent over 2007. Rising prices of agricultural commodities have continued to put significant upward pressure on food prices this year. However, significant price increases have not been limited to food commodities; the index for food away from home, which tends to reflect broader inflationary trends in the economy, has also accelerated this year. Changes in spot prices for farm commodities are mixed since the June Greenbook: Wheat prices are down noticeably in response to a good harvest that is well under way; prices for corn and soybeans have also declined on reports of more-favorable weather in major growing regions. However, livestock prices have risen further, reflecting strong demand and high feed costs. Futures prices for farm products are consistent with a significant deceleration in crude food costs later this year.
We estimate that core PCE prices rose 0.3 percent in June after increases of 0.1 percent in both April and May. Over the first six months of this year, core PCE prices are estimated to have risen at an annual rate of 2.2 percent, the same as in 2007. The change in the market-based component of core PCE prices so far this year is also about the same as in 2007. In the first half of this year, prices for a wide variety of goods and services have accelerated. Price increases for some, such as airfares and transportation services, have no doubt been boosted by rising energy costs, while those for a number of household goods likely reflect higher import prices. At the same time, the indexes for motor vehicles and housing—weak areas of the economy—have decelerated.
Some measures of year-ahead expectations have moved up sharply in recent months; longer-run expectations have been little changed recently but remain above their levels at the end of 2007. According to the Reuters/Michigan survey, median expectations for inflation over the next 12 months moved up sharply over the first half of this year and held at 5.1 percent in July, up noticeably from about 3½ percent at the turn of the year. Median expectations for inflation over the next 5 to 10 years edged down in July to 3.2 percent from their recent peak in May and June, but they remained a bit higher than

II-36
Measures of Expected Inflation
1975 1980 1985 1990 1995 2000 20050
2
4
6
8
10
12
0
2
4
6
8
10
12Percent
1972 1976 1980 1984 1988 1992 1996 2000 2004 2008
Survey Measures (Reuters/Michigan)
Q2
Median, next 12 months
Median, next 5 to 10 years
Quarterly
2005 2006 2007 20080
1
2
3
4
5
6
0
1
2
3
4
5
6Percent
Monthly
July
1975 1980 1985 1990 1995 2000 20050
2
4
6
8
10
12
0
2
4
6
8
10
12Percent
1972 1976 1980 1984 1988 1992 1996 2000 2004 2008
Inputs to Models of Inflation
*For 2007 forward, the median projection for PCE inflation over the next 10 years from the Survey of Professional Forecasters (SPF);for 1991 to 2006, the equivalent SPF projection for the CPI; for 1981 to 1991, a related survey for the CPI conducted by Richard Hoey;and for the period preceding 1981, a model-based estimate constructed by Board staff. The survey data before 2007 are adjusted down0.5 percentage point to put the CPI projections approximately on a PCE basis.
**Derived from one of the reduced-form Phillips curves used by Board staff.
Q2
FRB/US long-run expectations measurefor PCE inflation*
Distributed lag ofcore PCE inflation**
Quarterly
2005 2006 2007 20080
1
2
3
4
5
0
1
2
3
4
5Percent
Quarterly
Q2
2001 2002 2003 2004 2005 2006 2007 20080
1
2
3
4
5
0
1
2
3
4
5Percent
Inflation Compensation from TIPS
Note. Based on a comparison of an estimated TIPS yield curve with an estimated nominal off-the-run Treasury yield curve, with anadjustment for the indexation-lag effect.
5 to 10 years ahead
Next 5 years
Quarterly
Q2
2005 2006 2007 20080
1
2
3
4
0
1
2
3
4Percent
Weekly
July 29

II-37
the average of 3 percent posted in 2007 and the first quarter of this year. Five-year inflation compensation derived from Treasury inflation-protected securities (TIPS) has declined 0.3 percentage point since the June Greenbook but is about unchanged since the end of last year. The measure of inflation compensation 5 to 10 years ahead—at 2.9 percent—has risen some since the June Greenbook and is up 0.2 percentage point, on balance, this year. These measures have exhibited greater variability this year, likely because of swings in the risk premiums that investors demand to induce them to hold relatively illiquid TIPS rather than nominal securities.
Excluding food and energy, sharp increases in the prices of products and services at earlier stages of processing continue to put upward pressures on business costs and consumer prices. The PPI for core intermediate materials moved up 1.3 percent in June, on top of a string of earlier large monthly increases. The rise in June brought the increase in the first half of the year to an annual rate of about 15 percent, up sharply from the pace of roughly 3 percent recorded last year. Price increases have been particularly large for chemicals, plastics, and metal products. The PPIs for trucking, rail transport, and delivery services also posted sizable increases again in June and have moved up rapidly over the past year.
In recent weeks, industrial materials prices have declined somewhat following large increases earlier this year: Since the June Greenbook, both the Commodity Research Bureau spot industrials index and the Journal of Commerce industrial commodities index have declined between 1 percent and 2 percent.
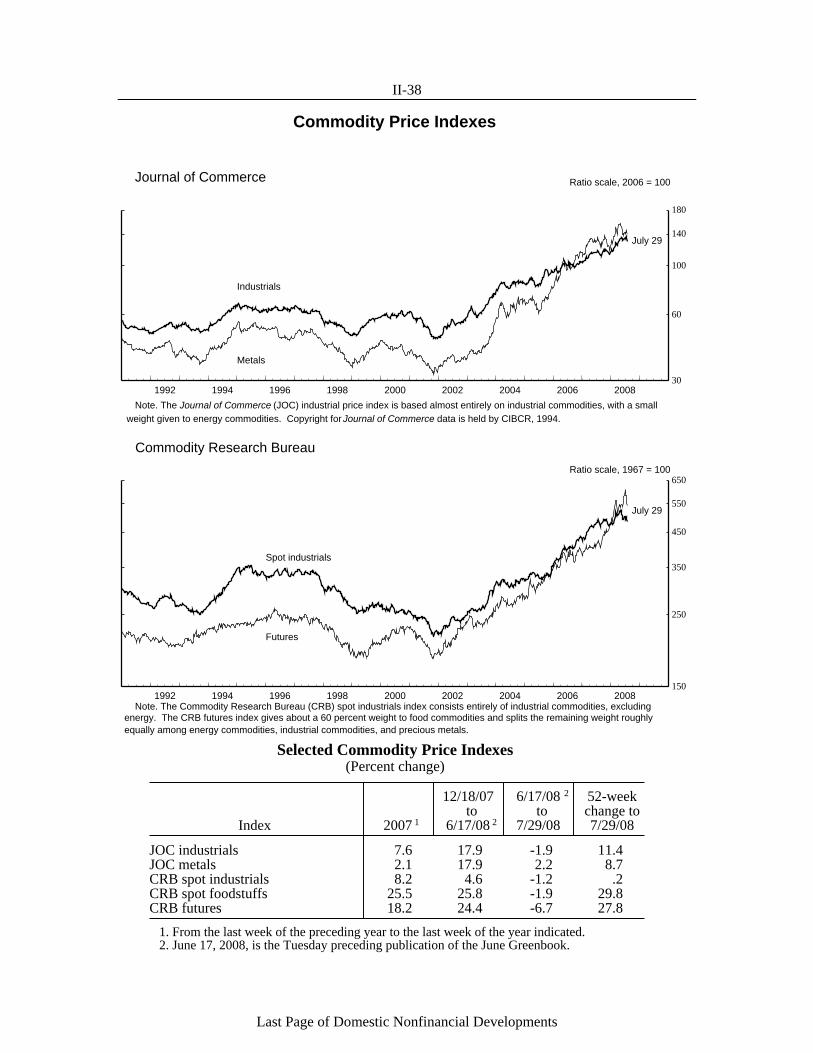
II-38
Commodity Price Indexes
1991 1992 1993 1994 1995 1996 1997 1998 1999 2000 2001 2002 2003 2004 2005 2006 2007 2008 2009
100 100
30
60
100
140
180
Note. The Journal of Commerce (JOC) industrial price index is based almost entirely on industrial commodities, with a small weight given to energy commodities. Copyright for Journal of Commerce data is held by CIBCR, 1994.
Ratio scale, 2006 = 100
Metals
Industrials
July 29
1992 1994 1996 1998 2000 2002 2004 2006 2008
Journal of Commerce
1991 1992 1993 1994 1995 1996 1997 1998 1999 2000 2001 2002 2003 2004 2005 2006 2007 2008 2009
200
300
400
500
600
200
300
400
500
600
150
250
350
450
550
650Ratio scale, 1967 = 100
Note. The Commodity Research Bureau (CRB) spot industrials index consists entirely of industrial commodities, excludingenergy. The CRB futures index gives about a 60 percent weight to food commodities and splits the remaining weight roughlyequally among energy commodities, industrial commodities, and precious metals.
Spot industrials
Futures
July 29
1992 1994 1996 1998 2000 2002 2004 2006 2008
Commodity Research Bureau
2
Selected Commodity Price Indexes(Percent change)
12/18/07 6/17/08 52-weekto to change to
Index 2007 1 6/17/08 2 7/29/08 7/29/08
JOC industrials 7.6 17.9 -1.9 11.4 JOC metals 2.1 17.9 2.2 8.7 CRB spot industrials 8.2 4.6 -1.2 .2 CRB spot foodstuffs 25.5 25.8 -1.9 29.8 CRB futures 18.2 24.4 -6.7 27.8
1. From the last week of the preceding year to the last week of the year indicated. 2. June 17, 2008, is the Tuesday preceding publication of the June Greenbook.
Last Page of Domestic Nonfinancial Developments

Domestic FinancialDevelopments

III-T-1Selected Financial Market Quotations(One-day quotes in percent except as noted)
Change to July 29 from2007 2008 selected dates (percentage points)
Instrument 2007 2008 2008 Aug. 6 Jan. 31 June 24 July 29 Aug. 6 Jan. 31 June 24
Short-termFOMC intended federal funds rate 5.25 3.00 2.00 2.00 -3.25 -1.00 .00
Treasury bills1
3-month 4.74 1.92 1.80 1.69 -3.05 -.23 -.11 6-month 4.72 2.02 2.20 1.91 -2.81 -.11 -.29
Commercial paper (A1/P1 rates)2
1-month 5.26 2.95 2.36 2.35 -2.91 -.60 -.01 3-month 5.29 2.98 2.78 2.76 -2.53 -.22 -.02
Large negotiable CDs1
3-month 5.34 3.01 2.80 2.82 -2.52 -.19 .02 6-month 5.27 2.93 3.17 3.17 -2.10 .24 .00
Eurodollar deposits3
1-month 5.33 3.15 2.70 2.65 -2.68 -.50 -.05 3-month 5.35 3.15 3.00 3.00 -2.35 -.15 .00
Bank prime rate 8.25 6.00 5.00 5.00 -3.25 -1.00 .00
Intermediate- and long-termU.S. Treasury4
2-year 4.49 2.16 2.80 2.61 -1.88 .45 -.19 5-year 4.52 2.83 3.55 3.41 -1.11 .58 -.14 10-year 4.82 3.86 4.29 4.27 -.55 .41 -.02
U.S. Treasury indexed notes5
5-year 2.43 .68 1.10 1.28 -1.15 .60 .18 10-year 2.48 1.35 1.76 1.81 -.67 .46 .05
Municipal general obligations (Bond Buyer)6 4.51 4.39 4.76 4.77 .26 .38 .01
Private instruments 10-year swap 5.44 4.23 4.84 4.78 -.66 .55 -.06 10-year FNMA7 5.34 4.28 4.98 4.81 -.53 .53 -.17 10-year AA8 6.12 5.62 6.54 6.82 .70 1.20 .28 10-year BBB8 6.57 6.39 7.00 7.21 .64 .82 .21 10-year high yield8 9.21 9.80 10.13 10.46 1.25 .66 .33
Home mortgages (FHLMC survey rate)9
30-year fixed 6.59 5.68 6.45 6.63 .04 .95 .18 1-year adjustable 5.65 5.05 5.27 5.49 -.16 .44 .22
Change to July 29 Record high 2008 from selected dates (percent)
Stock exchange index Record 2008 2008 Level Date Jan. 31 June 24 July 29 high Jan. 31 June 24
Dow Jones Industrial 14,165 10-9-07 12,650 11,807 11,398 -19.53 -9.90 -3.47S&P 500 Composite 1,565 10-9-07 1,379 1,314 1,263 -19.29 -8.37 -3.89Nasdaq 5,049 3-10-00 2,390 2,368 2,320 -54.05 -2.94 -2.05Russell 2000 856 7-13-07 713 708 715 -16.50 .18 .94Wilshire 5000 15,807 10-9-07 13,897 13,421 12,900 -18.39 -7.17 -3.88
1. Secondary market. 2. Financial commercial paper. 3. Bid rates for Eurodollar deposits collected around 9:30 a.m. eastern time. 4. Derived from a smoothed Treasury yield curve estimated using off-the-run securities. 5. Derived from a smoothed Treasury yield curve estimated using all outstanding securities and adjusted for the carry effect. 6. Most recent Thursday quote. 7. Constant-maturity yields estimated from Fannie Mae domestic noncallable coupon securities. 8. Derived from smoothed corporate yield curves estimated using Merrill Lynch bond data. 9. Home mortgage rates for July 29, 2008, are for the week ending July 24, 2008. _______________________________________________________________________
NOTES: August 6, 2007, is the day before the August 2007 FOMC meeting. January 31, 2008, is the day after the January 2008 FOMC meeting. June 24, 2008, is the day before the most recent FOMC monetary policy announcement.
_______________________________________________________________________

Financial Institutions and Market Functioning(Data extend through July 29, 2008)
Jan. Feb. Mar. Apr. May June July2008
0
5
10
15
20
25
30
35
40
45
50Dollars
Fannie MaeFreddie Mac
Daily
GSE Stock Prices
June FOMC
Jan. Feb. Mar. Apr. May June July2008
40
60
80
100
120
Basis points
Fannie MaeFreddie Mac
Daily
CDS Spreads for GSEs
June FOMC
Jan. Feb. Mar. Apr. May June July2008
50
75
100
125
150
175
200
225
250Basis points
Fannie Mae
Freddie Mac
Daily
30-Year Option-Adjusted Current MBS CouponSpreads
Note. Spread of the option-adjusted yield on newly issued 30-yearMBS over comparable duration Treasury securites using Bloomberg’sprepayment model. Source. Bloomberg.
June FOMC
2006-07 Fannie Mae avg.: 732006-07 Freddie Mac avg.: 77
Jan. Apr. July Oct. Jan. Apr. July2007 2008
50
100
150
200
250
300Basis points
Daily
CDS Spreads for Investment Banks
Note. Median spread for 10 investment banks. Source. Markit.
June FOMC
Jan. Apr. July Oct. Jan. Apr. July2007 2008
50
100
150
200Basis points
Regional bank indexLarge bank index
Daily
CDS Spreads for U.S. Commercial Banks
Note. Median spreads for 8 regional and 5 large commercial banks. Source. Markit.
June FOMC
50
100
150
200
250
300
Jan. Apr. July Oct. Jan. Apr. July2007 2008
86
88
90
92
94
96
98
100
102
104Basis points Percent of par value
Daily
Source. LSTA/LPC Mark-to-Market Pricing.
Pricing in the Secondary Market for LeveragedLoans
JuneFOMC
Bid price(right scale)
Bid-ask spread(left scale)
III-C-1

Domestic Financial Developments
III-1
Overview Sentiment in financial markets deteriorated markedly early in the intermeeting period, largely because of heightened concerns about the solvency of Fannie Mae and Freddie Mac, the health of financial institutions in general, and rising oil prices. Those concerns eased somewhat in response to the federal government’s explicit support for Fannie Mae and Freddie Mac, some bank earnings reports that were better than expected, and declines in oil prices. Nonetheless, equity prices decreased, on net, over the intermeeting period, corporate bond spreads widened, mortgage rates rose, and investors marked down the expected path of monetary policy. Market participants now place high odds on the Federal Open Market Committee (FOMC) making no change in the target federal funds rate at the upcoming meeting. The yield on the two-year Treasury note decreased moderately over the intermeeting period, while yields on longer-term Treasury securities were about unchanged. Near-term inflation compensation declined, likely owing to the drop in oil prices, whereas five-year forward inflation compensation increased. Interbank funding and commercial paper markets remained strained.
Net borrowing by businesses slowed somewhat in July. Credit quality of the nonfinancial corporate sector slipped a bit in the first and second quarters. House prices continued to fall in May, and delinquency rates on residential mortgages moved up further. Growth of consumer credit remained subdued in May. According to the July Senior Loan Officer Opinion Survey on Bank Lending Practices, large majorities of domestic commercial banks further tightened their lending standards and terms on most categories of loans to businesses and households (see the appendix to this section). In addition, second quarter earnings reports for a number of large banks indicated widespread increases in delinquency rates.
Financial Institutions and Market Functioning Financial markets were buffeted over the intermeeting period by developments affecting Fannie Mae and Freddie Mac as well as by renewed investor concerns about a further deterioration in the credit quality of other financial institutions, fueled in part by the failure of a large thrift. As pressures intensified on Fannie Mae and Freddie Mac amid reports that they might need to raise a substantial amount of capital, their stock prices tumbled through mid-July, and their credit default swap (CDS) premiums shot up. For a time, investors reportedly pulled back from auctions of agency discount notes, and trading conditions in agency-sponsored mortgage-backed securities (MBS) were said to be very poor.

III-2
Short-Term Funding and Interbank Markets
July Oct. Jan. Apr. July2007 2008
20
40
60
80
100
120Basis points
June FOMC
July 30
Spread between Libor and OIS Rates
Daily
3-month
1-month
Note. Libor quotes are taken at 6:00 a.m., and OIS quotesare observed at the close of business of the previous trading day.
July Oct. Jan. Apr. July2007 2008
0
50
100
150
200
250Basis points
July 29
June FOMCDaily
Spreads on 30-Day Commercial Paper
ABCP
A2/P2
Note. The ABCP spread is the AA ABCP rate minus the AAnonfinancial rate. The A2/P2 spread is the A2/P2 nonfinancialrate minus the AA nonfinancial rate.
July Oct. Jan. Apr. July2007 2008
0
5
10
15
20Billions of dollars
July 23
June FOMC
Primary Credit Borrowing
Weekly average (Wed.)
July Oct. Jan. Apr. July2007 2008
-20
0
20
40
60
80Basis points
Daily
Commercial Paper Spread for Financial Firms
Note. 30-day AA financial rate minus 30-day AA nonfinancial rate. Source. Markit.
July 29
June FOMC
July Oct. Jan. Apr. July2007 2008
0
1
2
3
4
5
6Percent
Daily
Repo Rates on Treasury General Collateral
June FOMC
July 29
Overnight
1-month
July Oct. Jan. Apr. July2007 2008
0
5
10
15
20
25
30
35
40
45
50Billions of dollars
June FOMC
July 23
Weekly average (Wed.)
Primary Dealer Credit Facility

III-3
1 Freddie Mac completed registration of an equity offering with the Securities and Exchange
Commission on July 18, facilitating its plans to raise additional capital. 2 Developments at Fannie Mae and Freddie Mac spurred investor concerns about the financial
condition of the Federal Home Loan Banks (FHLBs), and secondary-market spreads on their senior debt rose in late June and early July but are little changed, on net, over the intermeeting period. In addition, many dealers have not been reporting quotes for CDS on FHLB debt for the past two weeks, suggesting that liquidity in this market is impaired.
On July 13, the Treasury Department announced a proposal to support the two ailing government-sponsored enterprises (GSEs), and the Board of Governors authorized the Federal Reserve Bank of New York to provide liquidity support at the discount window if necessary. Subsequently, Fannie Mae’s and Freddie Mac’s stock prices reversed a portion of their earlier declines, premiums on CDS referencing their senior debt fell sharply, and both GSEs held auctions of short-term debt securities that were well received.1 However, option-adjusted spreads on MBS guaranteed by the GSEs were high and volatile over the intermeeting period.2 On July 30, legislation was enacted that largely incorporated the Treasury’s plan to support the GSEs and included additional measures intended to help the housing market.
Overall, second-quarter earnings in the financial sector were significantly below year-ago levels as banking organizations ratcheted up loan-loss provisions and continued to write down the values of mortgage-related assets. A number of financial institutions reported negative earnings, while several institutions raised significant amounts of new capital. CDS premiums for U.S. investment banks and for large commercial banks rose moderately, on net, over the intermeeting period, but are up somewhat more, on net, for regional banks. CDS premiums on subordinated debt issued by bank holding companies also rose substantially over the intermeeting period.
The intensification of concerns about the health of financial institutions left an imprint on the functioning of some financial markets. CDS market functioning remained under stress over the intermeeting period, particularly for the CDS of financial firms. Measures of liquidity for speculative-grade corporate bonds deteriorated markedly early on but have mostly recovered. The average bid-asked spread in the secondary market for leveraged loans widened slightly, and the average bid price on these loans moved down somewhat, which put additional pressures on banks attempting to reduce their backlog of previously underwritten deals.
In short-term funding markets, strains persisted over the intermeeting period. Amid continued bank funding pressures, spreads of Libor over comparable-maturity OIS rates

III-4
Policy Expectations and Treasury Yields
June 24 June 27 July 2 July 7 July 9 July 14 July 17 July 22 July 252.6
2.8
3.0
3.2
3.4
3.6
3.8
4.0Percent
FOMCstatement
ISMmanufacturing
Employmentreport
Chairman’stestimony
CPI Michiganconfidence
September 2008
March 2009
Eurodollar Rate
Note. 5-minute intervals. 8:00 a.m. to 4:00 p.m. No adjustments for term premiums.
1.50
1.75
2.00
2.25
2.50
2.75
3.00
3.25
3.50
3.75
4.00
4.25
4.50
June Oct. Feb. June Oct. Feb. June Oct.2008 2009 2010
June 24, 2008
July 29, 2008
Implied Federal Funds Rate
Percent
Note. Estimated from federal funds and Eurodollar futures, with anallowance for term premiums and other adjustments.
50
100
150
200
250
300
Oct. Mar. Aug. Jan. June Nov. Apr.2005 2006 2007 2008
200
300
400
500
600
700
800
900
1000
1100
1200Basis points Basis points
6-month Eurodollar (left scale)*10-year Treasury (right scale)
Implied Volatility of Interest Rates
Daily June FOMC
*Width of a 90 percent confidence interval computed from theterm structures for the expected federal funds rate and impliedvolatility.
July 29
1 3 5 7 10 201.0
1.5
2.0
2.5
3.0
3.5
4.0
4.5
5.0Percent
June 24, 2008
July 29, 2008
Treasury Yield Curve
Years ahead Note. Smoothed yield curve estimated from off-the-run Treasurycoupon securities. Yields shown are those on notional par Treasurysecurities with semiannual coupons.
Jan. Apr. July Oct. Jan. Apr. July2007 2008
1.8
2.0
2.2
2.4
2.6
2.8
3.0
3.2
3.4
Percent
5 to 10 years ahead
Next 5 years*
Inflation Compensation
Daily
Note. Estimates based on smoothed nominal and inflation-indexedTreasury yields. *Adjusted for lagged indexation of TIPS.
June FOMC
July 29
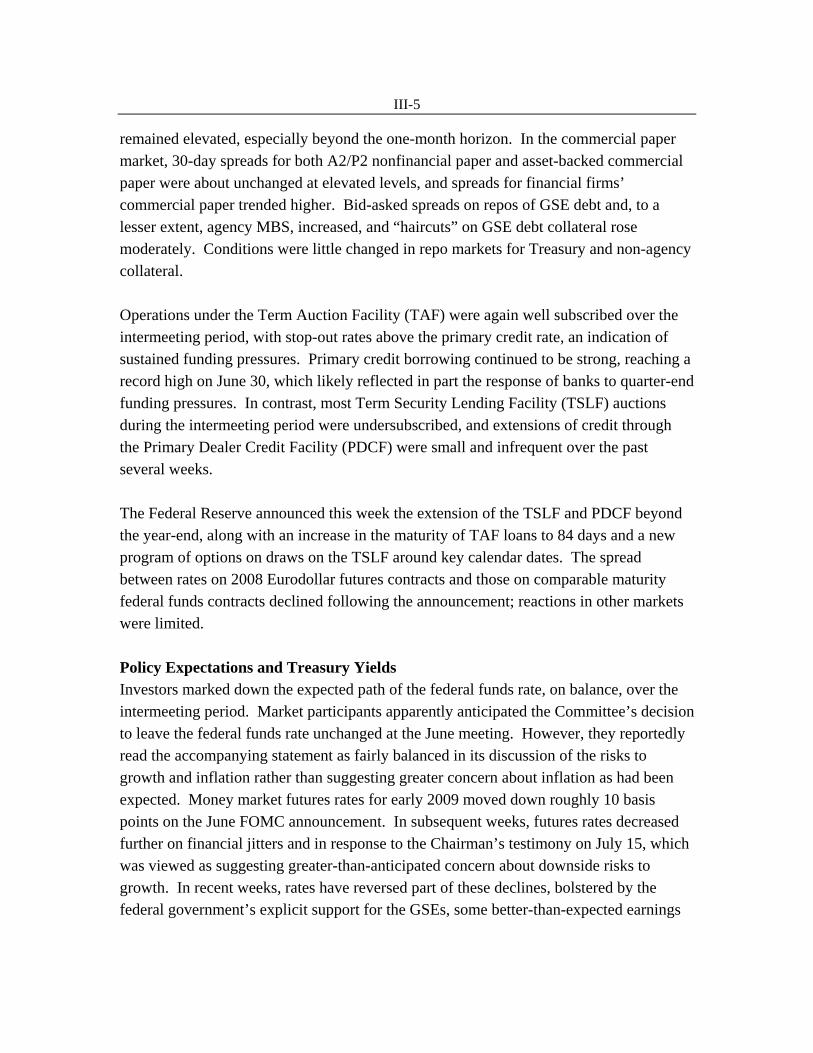
III-5
remained elevated, especially beyond the one-month horizon. In the commercial paper market, 30-day spreads for both A2/P2 nonfinancial paper and asset-backed commercial paper were about unchanged at elevated levels, and spreads for financial firms’ commercial paper trended higher. Bid-asked spreads on repos of GSE debt and, to a lesser extent, agency MBS, increased, and “haircuts” on GSE debt collateral rose moderately. Conditions were little changed in repo markets for Treasury and non-agency collateral.
Operations under the Term Auction Facility (TAF) were again well subscribed over the intermeeting period, with stop-out rates above the primary credit rate, an indication of sustained funding pressures. Primary credit borrowing continued to be strong, reaching a record high on June 30, which likely reflected in part the response of banks to quarter-end funding pressures. In contrast, most Term Security Lending Facility (TSLF) auctions during the intermeeting period were undersubscribed, and extensions of credit through the Primary Dealer Credit Facility (PDCF) were small and infrequent over the past several weeks.
The Federal Reserve announced this week the extension of the TSLF and PDCF beyond the year-end, along with an increase in the maturity of TAF loans to 84 days and a new program of options on draws on the TSLF around key calendar dates. The spread between rates on 2008 Eurodollar futures contracts and those on comparable maturity federal funds contracts declined following the announcement; reactions in other markets were limited.
Policy Expectations and Treasury Yields Investors marked down the expected path of the federal funds rate, on balance, over the intermeeting period. Market participants apparently anticipated the Committee’s decision to leave the federal funds rate unchanged at the June meeting. However, they reportedly read the accompanying statement as fairly balanced in its discussion of the risks to growth and inflation rather than suggesting greater concern about inflation as had been expected. Money market futures rates for early 2009 moved down roughly 10 basis points on the June FOMC announcement. In subsequent weeks, futures rates decreased further on financial jitters and in response to the Chairman’s testimony on July 15, which was viewed as suggesting greater-than-anticipated concern about downside risks to growth. In recent weeks, rates have reversed part of these declines, bolstered by the federal government’s explicit support for the GSEs, some better-than-expected earnings

III-6
Corporate Yields, Risk Spreads, and Stock Prices
70
80
90
100
110
120
130
140
150
160
170
180
190June 24, 2008 = 100
Jan. Apr. July Oct. Jan. Apr. July2007 2008
Selected Stock Price Indexes
Daily
S&P 500
S&P Financial
June FOMC
July 29
2
4
6
8
10
12Percent
1988 1992 1996 2000 2004 2008
Ratio of Trend Earnings to Price for S&P 500 andLong-Run Treasury Yield
Monthly
(Trend earnings) / P*
Long-run real Treasury yield
+
+
July 29
* Trend earnings are estimated using analysts’ forecasts ofyear-ahead earnings from I/B/E/S. + Denotes the latest observation using daily interest rates andstock prices and latest earnings data from I/B/E/S.
10
20
30
40
50Percent
2002 2003 2004 2005 2006 2007 2008
Implied Volatility on S&P 500 (VIX)
Weekly Friday*June
FOMC
July 29
* Latest observation is for most recent business day.
4.5
6.5
8.5
10.5
12.5Percent
2002 2003 2004 2005 2006 2007 2008
Corporate Bond Yields
Daily
10-year high-yield
10-year BBB
June FOMC
July 29
Note. Yields from smoothed yield curves based on Merrill Lynchbond data.
0
200
400
600
800
75
150
225
300
375
450Basis points Basis points
2002 2003 2004 2005 2006 2007 2008
Corporate Bond Spreads
DailyJune
FOMC
July 29
Note. Measured relative to comparable-maturity Treasurysecurities.
10-year high-yield(left scale)
10-year BBB(right scale)
0
25
50
75
100
125
150
175
200
225Basis points
2002 2003 2004 2005 2006 2007 2008
Investment-Grade CDS Indexes
Daily
Financial
Nonfinancial
June FOMC
July 29

III-7
reports from commercial banks, and the decline in oil prices. Economic data released over the intermeeting period had little net effect on policy expectations.
On net, investors revised down the expected policy rate at the end of this year about 30 basis points. Judging from options on federal funds futures, market participants assign very high odds on the target rate remaining at 2 percent at the August meeting. Futures rates also indicate that investors now expect the target rate to be left unchanged at the September meeting as well, consistent with the average forecast in the July survey of primary dealers. Further ahead, futures prices suggest a cumulative increase in the federal funds rate of more than 175 basis points by the end of 2010, about 30 basis points less than the rise anticipated at the time of the last FOMC meeting. The option-implied distribution of the federal funds rate six months ahead narrowed a bit, but it retained a moderate skew toward higher rates.
Short-term Treasury yields declined, on balance, in line with policy expectations. Two-year nominal Treasury yields were down 19 basis points. Meanwhile, 10-year yields were about unchanged. Five-year inflation compensation derived from yields on Treasury inflation-protected securities closely tracked oil prices, ending the period down 33 basis points on net. Inflation compensation 5 to 10 years ahead rose 19 basis points, with much of the increase occurring around the release of the June FOMC statement, the Chairman’s testimony, and higher-than-expected CPI inflation data.
Stock Prices, Corporate Yields, and Risk Spreads Broad equity-price indexes declined about 4 percent, on net, over the intermeeting period, as the energy sector substantially underperformed. Stock prices of financial firms were volatile and ended the period down about 2 percent. The spread between the 12-month-forward trend earnings-to-price ratio for S&P 500 firms and a real long-run Treasury yield—a rough gauge of the equity premium—climbed to the top of its range over the past 25 years. Option-implied volatility on the S&P 500 index increased significantly in late June and early July but was about unchanged, on net, over the intermeeting period.
Yields on investment- and speculative-grade corporate bonds rose, on net, over the intermeeting period, even as yields on comparable-maturity Treasury securities were little changed, pushing spreads back toward their March peaks. Indexes of premiums on investment-grade CDS for nonfinancial firms changed little over the intermeeting period, while those for financial firms increased notably, on net.

III-8
Corporate Earnings and Credit Quality
-30
-20
-10
0
10
20
30
40Percent
All firmsNonfinancials
S&P 500 Earnings Per Share
Change from 4 quarters earlier
Q2
Q2
Source. For S&P 500 earnings per share, Thomson Financial.
e Bottom-up forecasts by equity analysts for firms that have notreported.
e
e
1998 2000 2002 2004 2006 2008
-4
-3
-2
-1
0
1
2
3Percent
All firmsNonfinancials
2002 2003 2004 2005 2006 2007 2008
Revisions to Expected S&P 500 Earnings
Monthly
Mid- July
Note. Index is a weighted average of the percent change in theconsensus forecasts of current-year and following-year EPS for afixed sample.
0.03
0.06
0.09
0.12
0.25
0.30
0.35Ratio Ratio
1990 1993 1996 1999 2002 2005 2008
Financial Ratios for Nonfinancial Corporations
Debt overtotal assets(right scale)
Liquid assets overtotal assets(left scale)
Q1
Q1
Note. Data are annual through 1999 and quarterly starting in2000:Q1.
Source. Calculated with Compustat data.
p
p
p Preliminary.
1991 1993 1995 1997 1999 2001 2003 2005 200850
40
30
20
10
0
10
20
30
Upgrades
Downgrades
Bond Ratings Changes of Nonfinancial Companies
Percent of outstandings
Annual rate
Q1Q2
Source. Calculated with data from Moody’s Investors Service.
0
1
2
3
4
5
6
7Percent of outstandings
1990 1993 1996 1999 2002 2005 2008
Selected Default and Delinquency Rates
C&I loan delinquency rate (Call Report)
Bond default rate*
June
Q1
* 6-month moving average, from Moody’s Investors Service.
0.0
0.5
1.0
1.5
2.0Percent of liabilities
1993 1996 1999 2002 2005 2008
Expected Year-Ahead Defaults
Monthly
June
Note. Firm-level estimates of default weighted by firm liabilities asa percent of total liabilities, excluding defaulted firms. Source. Moody’s KMV.

III-9
Corporate Earnings and Credit Quality According to the approximately 300 second-quarter earnings reports in hand and analysts’ forecasts for the rest, earnings per share for S&P 500 firms are expected to come in about 18 percent below year-ago levels, mainly because of a sharp drop in profits in the financial sector. In contrast, earnings per share for nonfinancial firms are estimated to have risen about 8 percent over year-ago levels, with roughly half the gains accounted for by firms in the oil and gas industry. Among firms that have reported, about three-fourths posted earnings-per-share above analyst forecasts. Regarding the outlook, an index of analysts’ expectations of year-ahead earnings for S&P 500 firms was negative through mid-July.
The credit quality of nonfinancial firms deteriorated a little in the first and second quarters. The aggregate leverage ratio of nonfinancial firms increased in the first quarter, and the aggregate ratio of liquid assets to total assets ticked down. Rating downgrades on nonfinancial corporate bonds remained modest but outpaced upgrades in the second quarter, and the number of nonfinancial firms on watch for a downgrade continued to exceed the number on watch for an upgrade. The default of a large mortgage-related firm pushed up the six-month trailing bond default rate in June, and the KMV-based aggregate year-ahead expected default rate jumped to its highest level since early 2003.
Business Finance Overall, net debt financing by businesses has declined in July. Bond issuance by investment-grade nonfinancial corporations slowed from its rapid second-quarter pace, and speculative-grade issuance ticked down. At the same time, outstanding nonfinancial commercial paper posted a solid gain, while commercial and industrial (C&I) loans apparently grew moderately. According to the July Senior Loan Officer Opinion Survey, substantial majorities of banks tightened lending standards and terms on C&I loans over the past three months. Public issuance of bonds and equity by financial corporations sank in July, likely reflecting in part increased volatility in those securities.
Both seasoned and initial equity offerings remained weak in July, with almost no issuance outside the energy sector. Equity retirements from cash-financed mergers continued to fall in the second quarter, but announcements of new deals picked up. Retirements from share repurchases are also estimated to have continued to decline. Even so, net equity issuance by nonfinancial firms remained negative.

III-10
Business FinanceGross Issuance of Securities by U.S. Corporations
(Billions of dollars; monthly rates, not seasonally adjusted)
2007 2008
Type of security 2004 2005 2006 H1 H2 Q1 Q2 July p
Nonfinancial corporationsStocks1 5.4 4.6 4.7 5.5 5.4 2.3 4.8 4.8 Initial public offerings 1.6 1.7 1.8 1.7 1.6 .3 .9 .3 Seasoned offerings 3.8 2.8 2.9 3.9 3.8 2.0 3.9 4.5
Bonds2 22.4 18.7 29.3 37.6 32.5 29.5 39.5 19.0 Investment grade 8.3 8.7 13.1 14.9 20.2 24.1 25.6 12.0 Speculative grade 8.2 5.2 6.2 11.8 3.3 1.3 4.8 3.0 Other (sold abroad/unrated) 5.9 4.8 10.1 10.9 9.0 4.1 9.0 4.0
MemoNet issuance of commercial paper3 1.7 -.2 2.4 1.1 -2.0 4.5 -5.5 6.0Change in C&I loans at commercial banks3,4 2.4 9.6 11.6 14.0 28.8 16.1 9.2 6.4
Financial corporationsStocks1 6.9 5.0 5.3 9.3 7.9 13.2 21.3 1.0Bonds2 134.1 170.4 180.6 200.5 102.8 54.9 77.9 15.0
Note. Components may not sum to totals because of rounding. 1. Excludes private placements and equity-for-equity swaps that occur in restructurings. 2. Data include regular and 144a private placements. Bond totals reflect gross proceeds rather than par value oforiginal discount bonds. Bonds are categorized according to Moody’s bond ratings or to Standard & Poor’s ifunrated by Moody’s. 3. End-of-period basis, seasonally adjusted. 4. Based on adjusted commercial bank credit data through July 16. p Preliminary.
2004 2005 2006 2007 2008
-30
-20
-10
0
10
20
30
40
50
60
70
Commercial paper*C&I loans*Bonds
Total
Selected Components of Net Debt Financing
Billions of dollars
Monthly rate, nonfinancial firms
* Seasonally adjusted, period-end basis.
H1
H2
Q1Q2
Julyp
p Preliminary.
2004 2005 2006 2007 2008
-120
-110
-100
-90
-80
-70
-60
-50
-40
-30
-20
-10
0
10
20
30
40
50
Public issuancePrivate issuanceRepurchasesCash mergers
Total
Components of Net Equity Issuance
Billions of dollars
Monthly rate, nonfinancial firms
e Staff estimate.
H1 H2Q1
Q2pe
p Preliminary.

III-11
1998 2000 2002 2004 2006 2008 0
2
4
6
8
10
12
14
16
18Percent change from year earlier
Q1
Commercial Mortgage Debt
Quarterly
Source. Flow of funds.2002 2004 2006 2008
0
20
40
60
80
100
120
140Billions of dollars
3-month moving averageMonthly
Junep
Sales of Commercial Real Estate
p Preliminary. Source. Real Capital Analytics.
1990 1993 1996 1999 2002 2005 2008
100
150
200
250
Index, 1996:Q4=100
Transactedproperty
All property
Q1
Q2
Prices
Quarterly
Note. All-property index based on entire NCREIF portfolio. Transacted-property index based on sales involving NCREIF portfolio. Source. NCREIF, MIT Center for Real Estate.
Oct. Jan. Apr. July Oct. Jan. Apr.
0
500
1000
1500
2000
2500CMBX.NA Basis points
2006:H2*2006:H1*2005:H2*
July 29
Daily
July 2006 2007 2008
BBB Commercial Mortgage CDS Index Spreads
Note. Measured relative to Libor. *Corresponds to pools of mortgages originated in that period. Source. JP Morgan.
June FOMC
1996 1998 2000 2002 2004 2006 2008
0
1
2
3
4Percent
Q1
Q1
JuneAt lifeinsurancecompanies
CMBS
At commercial banks*
Delinquency Rates on Commercial Mortgages
*Excluding farmland. Source. Citigroup, Call Report, ACLI.
Q1 Q2 Q3 Q4 Q12007 2008
0
2
4
6
8
10
12Percent
Existingproperties
Commercialconstruction
Residentialconstruction
Quarterly
Delinquency Rates on Commercial Mortgagesat Banks
Note. Data series for residential and commercial constructionbegin in 2007:Q1. Existing properties include nonresidential andmultifamily. Source. Call Report.
Commercial Real Estate

III-12
100
125
150
175
200
225
250
275
300
Oct. Jan. Apr. July Oct. Jan. Apr. July4.5
5.0
5.5
6.0
6.5
7.0
7.5
8.0
8.5
9.0Basis points Percent
30-year fixed-rate spread
(left scale)
30-year fixed-rate
(right scale)
Jumbo rate(right scale)
June FOMC
July 23
2006 2007 2008
Mortgage Rates and Prime Conforming Spread
Weekly
Note. FRM spread relative to 10-year Treasury. Source. Freddie Mac, Inside Mortgage Finance.
4
6
8
10
12
14
16
18
20
2002 2004 2006 20080.0
0.5
1.0
1.5
2.0
2.5
3.0Percent of loans Percent of loans
Subprime (left scale)
Prime (right scale)
May
May
Delinquencies on Mortgages
Monthly
Note. Percent of loans 90 or more days past due or inforeclosure. Prime includes near-prime mortgages. Source. First American LoanPerformance.
1996 1998 2000 2002 2004 2006 2008-15
-10
-5
0
5
10
15
20
25Percent change
QuarterlyMonthly
Annual rate, s.a.
House Prices
Source. Office of Federal Housing Enterprise Oversight (OFHEO).
May
Q1
OFHEO purchase-only index
55
60
65
70
75
80
85
90
95
100
105
110ABX.HE Percent
July Nov. Mar. July Nov. Mar. July
2006 2007 2008
July 29
Daily
Subprime Mortgage AAA CDS Index Prices
Note. The index corresponds to pools of mortgages securitized in 2006:H1. Source. JP Morgan.
0
50
100
150
200
250
300Billions of dollars
2001 2002 2003 2004 2005 2006 2007 2008
GSEsGinnie MaeNon-agency
Monthly rate
Agency and Non-Agency MBS Issuance
H1
H2Q1
Q2*
J.**
*Estimate based on Inside Mortgage Finance MBS database. **GSEs from Inside Mortgage Finance as of July 25, and Ginnie Mae from Bloomberg as of July 28, both at monthly rate. Source. For agency issuance, Fannie Mae, Freddie Mac,and Ginnie Mae. For non-agency issuance, Inside MortgageFinance MBS database.
2001 2002 2003 2004 2005 2006 2007 2008 0
2
4
6
8
10
12
14
16Percent change from year earlier
Q1
Quarterly
Mortgage Debt
Source. Flow of funds.
Residential Mortgages

III-13
Commercial Real Estate Finance The volume of sales transactions in the commercial real estate sector remained weak in June, and a broad index of prices for commercial real estate edged down in the second quarter. There has been no issuance of commercial mortgage-backed-securities (CMBS) in July, and premiums on CDS written on CMBS rose over the intermeeting period, reversing more than half the declines from their rally earlier this year. CMBS delinquencies remained low in June, but some of the new CMBS delinquencies reflected the inability of borrowers to refinance large balloon payments as their initial loans came due. Many large banking organizations noted in their second-quarter earnings reports that delinquencies on commercial mortgages—particularly loans to residential developers—increased.
Household Finance Incoming data point to a further deterioration in residential mortgage markets. In the July Senior Loan Officer Opinion Survey, most banks reported having tightened lending standards further over the past three months for all classes of mortgage borrowers. In addition, interest rates on conforming mortgages rose, on net, over the intermeeting period, a move consistent with higher spreads in the agency MBS market. Interest rates on jumbo mortgages also increased. In May, the delinquency rates on both subprime and prime loans moved higher, and the monthly purchase-only house price index calculated by the Office of Federal Housing Enterprise Oversight declined further, dropping to a level about 5 percent below its peak in April 2007. The prices of indexes of CDS on AAA-rated tranches of subprime mortgage-backed securities declined sharply early in the intermeeting period to record lows, but reversed a portion of these declines in recent weeks.
MBS issuance by the GSEs was strong in the second quarter but is estimated to have slowed from that rapid pace in July. Some conforming MBS issued in the second quarter reportedly were backed by seasoned loans from bank portfolios rather than new originations. Residential mortgages held by banks have dropped steeply in recent weeks. Ginnie Mae issuance has increased over the past several months, as FHA originations continued to grow. The market for private-label residential mortgage-backed securities remained closed.
In May, the delinquency rate on auto loans at captive finance companies stayed above its long-term average, and the delinquency rates on credit card loans in securitized pools increased. Growth in consumer credit in May remained near the middle of its range over

III-14
1998 2000 2002 2004 2006 20081
2
3
4
5
6Percent
Auto loans at captive finance companies
Credit card loans in securitized pools
Nonrevolvingconsumer loans atcommercial banks
May
May
Q1
Delinquencies on Consumer Loans
Source. For credit cards, Moody’s; for auto loans, Federal Reserve.
2000 2002 2004 2006 2008 0
2
4
6
8
10
12
14
16
18
20Percent change
May
3-month percent change, annual rate
Consumer Credit
0
10
20
30
40Billions of dollars
2005 2006 2007 2008
AutoCredit cardStudent loans
Monthly rate
Gross Issuance of Consumer ABS by Type
H1
H2 Q1Q2
J.*
Note. Auto includes car loans, leases, and financing for buyers of motorcycles, trucks, and other vehicles. *Through July 25. Source. Inside Mortgage Finance MBS database, Merrill Lynch.
June Aug. Oct. Dec. Feb. Apr. June-20
0
20
40
60
80
100
120
140
160Basis points
3-year FFELP student loan2-year credit card2-year auto
2007 2008
Weekly
July 25
AAA ABS Spreads over Swaps
Source. For credit cards and auto, Citigroup Global Markets;for student loans, Merrill Lynch.
Consumer Credit and Household Wealth
Net Flows into Mutual Funds(Billions of dollars, monthly rate)
Fund type 2006 2007 2008 Assets H1 H2 Q1 Q2e May
Total long-term funds 18.9 31.6 5.8 1.7 21.2 8,814 Equity funds 13.3 14.4 1.2 -14.9 6.4 6,344 Domestic 0.9 0.9 -8.4 -13.4 1.7 4,704 International 12.4 13.5 9.6 -1.5 4.7 1,639 Hybrid funds 0.6 2.6 1.1 0.7 1.9 710 Bond funds 5.0 14.6 3.5 16.0 12.9 1,761 High-yield -0.2 0.2 -0.7 -1.3 1.1 155 Other taxable 4.0 12.0 4.8 15.2 8.1 1,219 Municipals 1.3 2.4 -0.6 2.1 3.7 387Money market funds 27.8 26.3 98.8 119.6 -15.9 3,509
Note. Excludes reinvested dividends.
e Staff estimate based on confidential weekly data.
Source. Investment Company Institute.

III-15
the past few years. Issuance of asset-backed securities (ABS) collateralized by auto loans and credit cards slowed somewhat in July, and spreads widened for AAA-rated consumer ABS in response to increased concerns about credit quality and ongoing financial market turmoil. Although conditions in the student loan market have improved significantly from earlier this year, some lenders reported that the new Department of Education procedures to support the market are difficult to implement.
Long-term mutual funds attracted small net inflows in June, but preliminary data show sizeable net redemptions in early July amid falling equity prices. Money market funds ran off in June, largely reflecting seasonal factors. Net inflows to money market funds appear to have resumed in July.
Treasury Finance The Treasury Department conducted several auctions of nominal and inflation-indexed securities over the intermeeting period, most of which were well received. Dealer participation at the 20-year TIPS reopening was, however, weaker than expected. The 6-month moving average of indirect bidding by foreign participants continued to trend down. In its mid-quarter refunding announcement, the Treasury Department announced that it is considering moving to a quarterly issuance schedule for 30-year bonds and that the Congress had approved an increase in the statutory debt limit.
Liquidity in Treasury markets remained below normal during the intermeeting period. Traders reported notably strained conditions in the bill market approaching quarter-end and in early July as concerns about the GSEs increased. Bid-asked spreads on coupon securities continued to be higher than historical norms. However, yield-curve fitting errors stayed high as investors apparently remain reluctant to arbitrage price differences across similar securities. The spread between on- and off-the-run ten-year notes also remained elevated, and the comparable spread for two-year notes rose a little on net, indications of strong demand for relatively liquid securities.
State and Local Government Finance Gross issuance of long-term municipal bonds remained robust in July, partly reflecting additional restructurings of auction rate securities. A substantial share of new capital issuance was for education and transportation projects. Meanwhile, short-term issuance was also strong through July, consistent with reports of budget shortfalls of state and local governments.

III-16
Treasury Finance
2000 2002 2004 2006 2008 0
10
20
30
40
50Percent of total issue
July 31
June 30
Indirect bids
Actual foreign allotment
Foreign Participation in Treasury Auctions
6-month moving average
Note. Indirect bids and actual allotment are a percentage ofthe total amount accepted, including the amount tendered tothe Federal Reserve. Moving averages include 2-, 5-, and 10-year original auctions and reopenings.
2003 2004 2005 2006 2007 2008 0
200
400
600
800
1000
1200
1400
1600Billions of dollars
July 23
June FOMC
Foreign Custody Holdings
Weekly average
Note. Securities held in custody at the Federal Reserve Bankof New York on behalf of foreign official institutions.
Treasury
Agency
2003 2004 2005 2006 2007 2008
0
5
10
15
20
25Billions of dollars
Securities Lending
Weekly (Wed.) average
Note. Volume of securities lent to market participants from theSystem Open Market Account portfolio through the overnightfacility.
July 23
0.80
0.85
0.90
0.95
1.00
1.05
1.10
Cents per $100 face value
Feb. June Oct. Feb. June Oct. Feb. June2006 2007 2008
2-year on-the-run Treasury notes
Treasury Bid-Ask Spread
Source. BrokerTec Interdealer Market Data.
5-day moving average
July 29
JuneFOMC
0
2
4
6
8
10
12
14
16Basis points
2001 2002 2003 2004 2005 2006 2007 2008
Average Absolute Nominal Yield CurveFitting Error
Daily
Note. Calculated from securities with 2 to 10 years until maturity,excluding on-the-run and first off-the-run securities.
July 29
-10
0
10
20
30
40Basis points
2001 2002 2003 2004 2005 2006 2007 2008
2-year
10-year
Treasury On-the-Run Premiums
Monthly average
Note. Computed as the spread of the yield read from an estimatedoff-the-run yield curve over the on-the-run Treasury yield. Julyobservation is the month-to-date average.
July
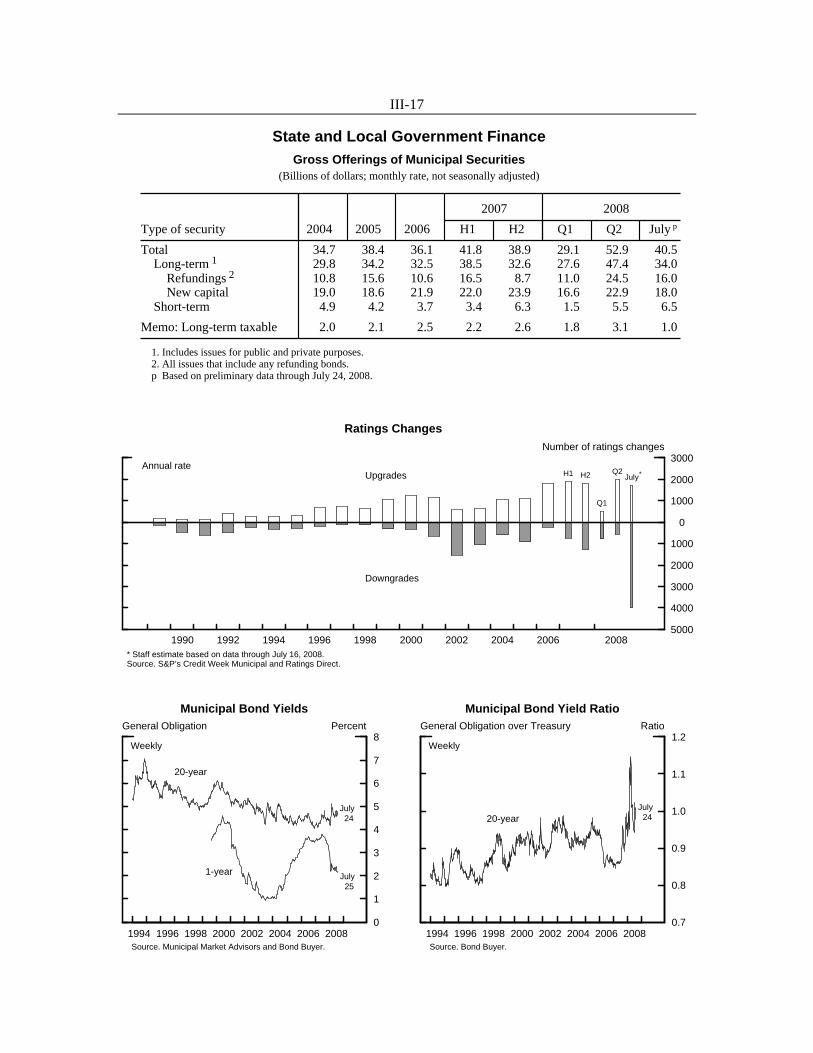
III-17
State and Local Government FinanceGross Offerings of Municipal Securities
(Billions of dollars; monthly rate, not seasonally adjusted)
2007 2008
Type of security 2004 2005 2006 H1 H2 Q1 Q2 July p
Total 34.7 38.4 36.1 41.8 38.9 29.1 52.9 40.5 Long-term 1 29.8 34.2 32.5 38.5 32.6 27.6 47.4 34.0 Refundings 2 10.8 15.6 10.6 16.5 8.7 11.0 24.5 16.0 New capital 19.0 18.6 21.9 22.0 23.9 16.6 22.9 18.0 Short-term 4.9 4.2 3.7 3.4 6.3 1.5 5.5 6.5
Memo: Long-term taxable 2.0 2.1 2.5 2.2 2.6 1.8 3.1 1.0
1. Includes issues for public and private purposes. 2. All issues that include any refunding bonds. p Based on preliminary data through July 24, 2008.
1990 1992 1994 1996 1998 2000 2002 2004 2006 20085000
4000
3000
2000
1000
0
1000
2000
3000
Upgrades
Downgrades
Ratings ChangesNumber of ratings changes
Annual rateH1 H2
Q1
Q2July *
Source. S&P’s Credit Week Municipal and Ratings Direct. * Staff estimate based on data through July 16, 2008.
0
1
2
3
4
5
6
7
8General Obligation Percent
1994 1996 1998 2000 2002 2004 2006 2008
Municipal Bond Yields
Weekly
20-year
1-year
July 24
July 25
Source. Municipal Market Advisors and Bond Buyer.
0.7
0.8
0.9
1.0
1.1
1.2General Obligation over Treasury Ratio
1994 1996 1998 2000 2002 2004 2006 2008
Municipal Bond Yield Ratio
Weekly
20-year July 24
Source. Bond Buyer.

III-18
M2 Monetary Aggregate(Based on seasonally adjusted data)
Percent change (annual rate)1 Level(billions
2008 of dollars),
Aggregate and components 2006 2007 Q1 Q2 June July July(e) (e)
M2 4.9 5.8 9.5 5.7 -.2 7.5 7,735
Components2
Currency 3.5 2.0 -.5 2.4 10.2 9.2 775Liquid deposits3 .7 4.5 7.0 7.5 3.0 7.5 4,692Small time deposits 18.6 4.3 2.4 -6.2 -3.6 7.5 1,207Retail money market funds 13.0 19.2 38.9 14.6 -17.2 6.2 1,056
Memo:Institutional money market funds 15.7 39.4 46.8 33.1 13.9 -.6 2,246Monetary base 3.1 2.0 -.4 2.0 8.9 7.6 838
1. For years, Q4 to Q4; for quarters and months, calculated from corresponding average levels.2. Nonbank traveler’s checks are not listed.3. Sum of demand deposits, other checkable deposits, and savings deposits.e Estimated.

III-19
3 Recent fluctuations in bank credit and its components reflect larger-than-usual movements in the
estimated seasonal factors. The seasonal factors for June and July are difficult to estimate—particularly for commercial real estate loans—owing to the timing of changes in the panel of respondent banks.
The credit quality of the municipal bond sector remained solid. The number of rating upgrades continued to outpace the number of downgrades in the second quarter. Downgrades picked up in July, reflecting deterioration in the credit quality of a few banks that provide liquidity support to tender option bonds, which are short-term securities backed by municipal bonds. Yields on long-term municipal bonds were little changed over the intermeeting period, as were ratios of long-term municipal bond yields to those on comparable-maturity Treasuries.
Money and Bank Credit M2 grew at an annual rate of 7½ percent in July after having been about flat in June. The pickup in money growth was broad based, and it may have been partly attributable to safe-haven flows from equity mutual funds and other nonmonetary assets into liquid deposits and retail money market funds. The expansion in small time deposits is largely attributable to a single institution offering high rates. The growth of currency likely reflected greater domestic demand, but some indicators suggest that foreign demand for dollars may have picked up from its recent sluggish pace.
Commercial bank credit is estimated to have increased only slightly in July, after having been about flat in June.3 C&I loans continued to rise moderately in July, while commercial real estate loans declined. On the household side, residential mortgage loans on banks’ books contracted in July, on the heels of a steeper runoff in June that reflected heavy sales and securitizations with the GSEs. In contrast, revolving home equity lines of credit expanded briskly in July, and consumer loans originated by banks grew modestly. The weak growth in bank credit over the past two months is consistent with the July Senior Loan Officer Opinion Survey, in which large fractions of banks reported having tightened lending standards and terms on all major loan categories.

III-20
Commercial Bank Credit(Percent change, annual rate, except as noted; seasonally adjusted)
Type of credit 2007 H2 Q1 Q2 June July Level1
2007 2008 2008 2008 2008e July 2008e
Total 10.6 11.3 6.2 3.3 -.2 2.7 9,023
Loans2
Total 11.4 11.5 9.5 4.4 -3.2 1.8 6,823 To businesses Commercial and industrial 19.6 26.1 15.6 12.0 5.7 7.9 1,510 Commercial real estate 10.2 10.2 9.8 10.3 11.9 -10.4 1,649
To households Residential real estate 5.8 -1.1 3.4 3.3 -16.2 -6.3 1,841 Revolving home equity 5.7 6.5 11.5 16.1 14.7 10.3 518 Other 5.9 -3.6 .7 -1.3 -27.7 -12.7 1,323 Consumer 7.9 10.8 8.8 6.0 6.8 9.4 835 Originated3 7.2 9.4 8.7 6.9 6.6 4.4 1,249 Other4 16.7 19.9 12.2 -14.9 -25.6 22.2 988
SecuritiesTotal 8.1 10.7 -3.5 .0 9.4 5.6 2,200 Treasury and agency -5.7 -4.4 -10.5 8.3 26.2 5.0 1,137 Other5 27.6 29.1 3.7 -8.4 -8.1 6.4 1,063
Note. Yearly annual rates are Q4 to Q4; quarterly and monthly annual rates use corresponding average levels. Datahave been adjusted to remove the effects of mark-to-market accounting rules (FIN 39 and FAS 115), the initial consolidation ofcertain variable interest entities (FIN 46), the initial adoption of fair value accounting (FAS 159), and the effects of sizablethrift-to-bank and bank-to-thrift structure activity in October 2006, March 2007, and October 2007. Data also account forbreaks caused by reclassifications. 1. Billions of dollars. Pro rata averages of weekly (Wednesday) levels. 2. Excludes interbank loans. 3. Includes an estimate of outstanding loans securitized by commercial banks. 4. Includes security loans and loans to farmers, state and local governments, and all others not elsewhere classified.Also includes lease financing receivables. 5. Includes private mortgage-backed securities; securities of corporations, state and local governments, and foreigngovernments; and any trading account assets that are not Treasury or agency securities. e Estimated.

Appendix
1 Banks received the survey on or after July 10, and their responses were due on July 24.
III-A-1
Senior Loan Officer Opinion Survey on Bank Lending Practices
The July 2008 Senior Loan Officer Opinion Survey on Bank Lending Practices addressed changes in the supply of, and demand for, bank loans to businesses and households over the past three months.1 The survey included two sets of special questions: The first set queried domestic banks about securitizations with, or sales to, Fannie Mae and Freddie Mac of conforming-jumbo mortgage loans; the second set asked respondents how they expected credit standards on loans to businesses and households at their bank to change in the second half of 2008 and in the first half of 2009, assuming that economic activity progresses in line with consensus forecasts. This appendix is based on responses from 52 domestic banks and 21 U.S. branches and agencies of foreign banks.
In the current survey, large net fractions of domestic institutions reported having tightened their lending standards and terms on all major loan categories over the previous three months. In particular, the net fractions of banks that had tightened credit standards on consumer loans increased notably relative to the April survey. Considerable fractions of foreign institutions also had tightened their credit standards and terms on loans to businesses over the past three months, although these fractions were smaller, on net, than those reported in the April survey. Large net fractions of domestic and foreign respondents expected their banks to tighten credit standards on all major loan categories in the second half of this year, and smaller, though substantial, net fractions expected their banks to tighten standards in the first half of 2009. Finally, demand for loans from both businesses and households at domestic and foreign institutions reportedly weakened, on net, over the past three months.
Business Lending
Questions on commercial and industrial lending. About 60 percent of domestic banks—a slightly larger fraction than in the April survey—reported having tightened lending standards on commercial and industrial (C&I) loans to large and middle-market firms over the past three months. About 65 percent of those institutions—up notably from roughly 50 percent in the April survey—also indicated that they had tightened their lending standards on C&I loans to small firms over the same period. Significant majorities of domestic respondents indicated that they had tightened selected price terms on C&I loans to firms of all sizes: About 80 percent of banks—up from roughly 70 percent in the April survey—noted that they had increased spreads of loan rates over their cost of funds on C&I loans to large and middle-market firms, whereas about 70 percent of respondents—a somewhat higher fraction than in the April survey—reported having widened spreads on loans to small firms. In addition, significant fractions of domestic respondents reported having tightened non-price-related lending terms on C&I loans to firms of

III-A-2
1990 1991 1992 1993 1994 1995 1996 1997 1998 1999 2000 2001 2002 2003 2004 2005 2006 2007 2008 2009−40
−20
0
20
40
60
80Percent
Loans to large and medium sized firmsLoans to small firms
1990 1991 1992 1993 1994 1995 1996 1997 1998 1999 2000 2001 2002 2003 2004 2005 2006 2007 2008 2009−40
−20
0
20
40
60
80Percent
Loans to large and medium sized firmsLoans to small firms
Proj.
Apr.survey
Net Percentage of Domestic Respondents Tightening Standards for C&I Loans
Measures of Supply and Demand for C&I Loans,by Size of Firm Seeking Loan
Note. Projections based on responses to questions on the outlook for credit standards in the July 2008 survey.
oo
1990 1991 1992 1993 1994 1995 1996 1997 1998 1999 2000 2001 2002 2003 2004 2005 2006 2007 2008 2009−80
−60
−40
−20
0
20
40
60
80
100Percent
Apr.survey
Net Percentage of Domestic Respondents Increasing Spreads of Loan Rates over Banks’ Costs of Funds
1990 1991 1992 1993 1994 1995 1996 1997 1998 1999 2000 2001 2002 2003 2004 2005 2006 2007 2008 2009−80
−60
−40
−20
0
20
40
60Percent
Apr.survey
Net Percentage of Domestic Respondents Reporting Stronger Demand for C&I Loans

III-A-3
all sizes over the survey period, and the fraction of banks that tightened such terms on loans to small firms increased considerably relative to the April survey.
About 35 percent of U.S. branches and agencies of foreign banks—down from about 60 percent in the April survey—indicated that they had tightened their lending standards on C&I loans over the past three months. A majority of foreign respondents reported that they had tightened selected price terms on such loans, although the fractions of foreign banks that reported having tightened such terms over the previous three months were, on net, significantly smaller than in the April survey. For example, about 60 percent of foreign banks—down from about 80 percent in the April survey—reported having raised spreads of loan rates over their cost of funds over the past three months.
Very large majorities of domestic and foreign respondents pointed to a less favorable or more uncertain economic outlook, their bank’s reduced tolerance for risk, and the worsening of industry-specific problems as reasons for tightening their lending standards and terms on C&I loans over the past three months. Roughly 65 percent of foreign respondents—up from about 45 percent in the April survey—also noted that concerns about their bank’s current or expected capital position had contributed to the more-stringent lending policies over the past three months. In contrast, only about 25 percent of domestic respondents—down from about 35 percent in the April survey—reported having tightened their lending standards because of concerns about their bank’s current or expected capital position.
On balance, the July survey points to a further weakening of C&I loan demand over the past three months. On net, about 15 percent of small domestic and 25 percent of foreign banks reported weaker demand for C&I loans from firms of all sizes over the survey period. Regarding large domestic banks, about 10 percent of these institutions, on net, noted weaker demand from small firms, although about 5 percent of these banks, on balance, reported that demand for C&I loans from large and middle-market firms had increased over the past three months.
Substantial majorities of domestic institutions that experienced weaker loan demand over the past three months pointed to a decrease in customers’ needs to finance investment in plant and equipment as well as their needs to finance inventories. In addition, about 75 percent of domestic and 70 percent of foreign respondents pointed to a decrease in customers’ needs for merger and acquisition financing as a reason for the lower demand for C&I loans. Regarding future business, small domestic and foreign institutions, on balance, reported that inquiries from potential business borrowers were about unchanged during the survey period. In contrast, about 15 percent of large domestic banks, on net, reported an increase in the number of inquiries from potential business borrowers over the past three months.
Questions on commercial real estate lending. On balance, about 75 percent of domestic banks—a fraction similar to that in the April survey—reported having tightened their lending

III-A-4
1990 1992 1994 1996 1998 2000 2002 2004 2006 2008 −40
−20
0
20
40
60
80
100Percent
1990 1992 1994 1996 1998 2000 2002 2004 2006 2008 −40
−20
0
20
40
60
80
100Percent
Proj.
Net Percentage of Domestic Respondents Tightening Standards for Commercial Real Estate Loans
Apr.survey
Measures of Supply and Demand for Commercial Real Estate Loans
Note. Projections based on responses to questions on the outlook for credit standards in the July 2008 survey.
o
o
1990 1992 1994 1996 1998 2000 2002 2004 2006 2008−60
−40
−20
0
20
40
60Percent
Apr.survey
Net Percentage of Domestic Respondents Reporting Stronger Demand for Commercial Real Estate Loans
III-A-5
2 A total of 48 institutions reported that they had originated prime residential mortgages. According to
the Call Reports, these 48 banks accounted for about 75 percent of residential real estate loans on the books of all commercial banks as of March 31, 2008.
3 According to the Call Reports, these 32 institutions accounted for about 70 percent of residential real estate loans on the books of all commercial banks as of March 31, 2008.
4 According to the Call Reports, these 7 institutions accounted for about 40 percent of residential real estate loans on the books of all commercial banks as of March 31, 2008.
standards on commercial real estate loans over the past three months. About 35 percent of foreign banks—down from about 55 percent in the April survey—also indicated that they had tightened their lending standards on commercial real estate loans. Regarding demand for these types of loans, about 30 percent of domestic banks and 45 percent of foreign institutions—fractions slightly smaller than those in the April survey—reported weaker demand for commercial real estate loans over the survey period on net.
Lending to Households
Questions on residential real estate lending. Large majorities of domestic respondents reported having tightened their lending standards on prime, nontraditional, and subprime residential mortgages over the previous three months. About 75 percent of domestic respondents—up from about 60 percent in the previous survey—indicated that they had tightened their lending standards on prime mortgages.2 Of the 32 banks that originated nontraditional residential mortgage loans, about 85 percent—up from about 75 percent in the April survey—reported having tightened their lending standards on such loans.3 Finally, 6 of the 7 banks that originated subprime mortgage loans—a somewhat higher proportion than in the April survey—indicated that they had tightened their lending standards on those loans over the past three months.4
On net, about 35 percent of domestic respondents—a slightly higher fraction than in the April survey—experienced weaker demand for prime residential mortgage loans over the past three months, and about 45 percent—up from roughly 30 percent in the April survey—indicated weaker demand for nontraditional mortgage loans over the same period. On balance, 2 of the 7 domestic banks that originated subprime mortgage loans—a proportion significantly smaller than in the April survey—reported weaker demand for subprime loans over the survey period.
About 80 percent of domestic respondents—up from about 70 percent in the April survey—noted that they had tightened their lending standards for approving applications for revolving home equity lines of credit (HELOCs) over the past three months. Concerning demand for this product, about 10 percent of domestic banks, on net, reported weaker demand for HELOCs over the past three months, down from about 20 percent in the April survey.

III-A-6
−20
0
20
40
60
80
100
1990 1992 1994 1996 1998 2000 2002 2004 2006
Percent
All residential
Net Percentage of Domestic Respondents Tightening Standards for Residential Mortgage Loans
Note. For data starting in 2007:Q2, changes in standards for prime, nontraditional, and subprime mortgage loans are reported separately. Projections based on responses to questions on the outlook for credit standards in the July 2008 survey. * The forward−looking questions asked about nontraditional and subprime mortgage loans combined.
Q2 Q4 Q2 Q4 Q2 Q4
2007 2008 2009
−20
0
20
40
60
80
100Percent
Q2 Q4 Q2 Q4 Q2 Q4
2007 2008 2009
−20
0
20
40
60
80
100Percent
Proj.
PrimeNontraditional*Subprime*
o
o
o
o
·
·
·
·
−80
−60
−40
−20
0
20
40
60
80
1990 1992 1994 1996 1998 2000 2002 2004 2006
Percent
All residential
Net Percentage of Domestic Respondents Reporting Stronger Demand for Residential Mortgage Loans
Note. For data starting in 2007:Q2, changes in demand for prime, nontraditional, and subprime mortgage loans are reported separately.
Q2 Q4 Q2 Q4 Q2 Q4
2007 2008 2009
−80
−60
−40
−20
0
20
40
60
80Percent
PrimeNontraditionalSubprime
Measures of Supply and Demand for Residential Mortgage Loans

III-A-7
1990 1991 1992 1993 1994 1995 1996 1997 1998 1999 2000 2001 2002 2003 2004 2005 2006 2007 2008 2009−20
0
20
40
60
80Percent
Credit card loansOther consumer loans
1990 1991 1992 1993 1994 1995 1996 1997 1998 1999 2000 2001 2002 2003 2004 2005 2006 2007 2008 2009−20
0
20
40
60
80Percent
Credit card loansOther consumer loans
Net Percentage of Domestic Respondents Tightening Standards for Consumer Loans
Proj.
Apr.survey o
o
o
o
Note. Projections based on responses to questions on the outlook for credit standards in the July 2008 survey.
Measures of Supply and Demand for Consumer Loans
1990 1991 1992 1993 1994 1995 1996 1997 1998 1999 2000 2001 2002 2003 2004 2005 2006 2007 2008 2009−40
−20
0
20
40Percent
Apr.survey
Net Percentage of Domestic Respondents Reporting Increased Willingness to Make Consumer Installment Loans
1990 1991 1992 1993 1994 1995 1996 1997 1998 1999 2000 2001 2002 2003 2004 2005 2006 2007 2008 2009−60
−40
−20
0
20
40
60Percent
Apr.survey
Net Percentage of Domestic Respondents Reporting Stronger Demand for Consumer Loans

III-A-8
5 The Economic Stimulus Act of 2008 raised the conforming loan limit through the end of 2008 for a
first mortgage on a single-family home in the contiguous United States from $417,000 to 125 percent of the median house price in certain high-cost areas, with an overall cap of $729,750. In the survey, conforming-jumbo mortgage loans were defined as those that do not conform under the previous loan-size limits but do under the new limits.
6 A total of 16 banks reported having securitized with, or sold to, the GSEs conforming-jumbo loans over the past three months. According to the Call Reports, these 16 banks accounted for about 60 percent of residential real estate loans on the books of all commercial banks as of March 31, 2008. A total of 22 respondents expect their banks to securitize with, or sell to, the GSEs conforming-jumbo mortgage loans in the next six months. According to the Call Reports, these 22 banks accounted for about 70 percent of residential real estate loans on the books of all commercial banks as of March 31, 2008.
Special questions on securitizations and sales of conforming-jumbo mortgage loans.5 About 35 percent of domestic respondents indicated that their bank had securitized with, or sold to, Fannie Mae and Freddie Mac (the government-sponsored enterprises, or GSEs) conforming-jumbo mortgage loans over the past three months, and about 45 percent of respondents expected their bank to do so over the next six months.6 As reasons for not securitizing or selling conforming-jumbo loans over the past three months or in the next six months, about 50 percent of respondents cited the cost of the GSEs’ guarantee fees or other pricing terms, and a similar fraction pointed to a lack of demand for conforming-jumbo loans. Finally, about 40 percent of respondents pointed to the limited number of mortgage applicants at their banks who meet the GSEs’ underwriting criteria.
Questions on consumer lending. About 65 percent of domestic banks—up notably from about 30 percent in the April survey—indicated that they had tightened their lending standards on credit card loans over the past three months, and about the same fraction of respondents—up from about 45 percent in the April survey—reported having tightened standards on consumer loans other than credit card loans. In addition, about 55 percent of banks reported raising minimum required credit scores on credit card loans, and 60 percent of respondents reported raising such scores on other consumer loans over the past three months, up from about 30 percent and 35 percent, respectively, in the April survey. In addition, 50 percent of respondents also reported reducing the extent to which both credit card and other consumer loans were granted to customers who did not meet their bank’s credit-scoring thresholds. Also, significant net fractions of respondents reported that they had reduced credit limits on credit card loans and raised minimum required down payments as well as spreads of loan rates on consumer loans other than credit card loans. On balance, about 35 percent of domestic banks—up from about 25 percent in the April survey—expressed a diminished willingness to make consumer installment loans relative to three months earlier. Regarding loan demand, about 30 percent of respondents, on net, indicated that they had experienced weaker demand for consumer loans of all types over the past three months, up from about 20 percent in the April survey.

III-A-9
Special questions on the outlook for credit standards. A final set of special questions in the July survey queried respondents about their outlook for changes in credit standards at their banks on loans to businesses and households in the second half of 2008 and in the first half of 2009, under the assumption that economic activity progresses in line with consensus forecasts. Responses to these questions suggested a gradual decline in the fractions of banks tightening lending standards over the next year, with very few banks expecting to ease standards over that period.
Regarding loans to businesses, about 55 percent of domestic and 45 percent of foreign respondents indicated that they expected their banks to tighten credit standards on C&I loans in the second half of this year, and about 45 percent of domestic and 30 percent of foreign institutions, on net, anticipated tightening their lending standards on these loans in the first half of next year. Regarding commercial real estate loans, about 70 percent of domestic and 45 percent of foreign respondents believed that their institutions would tighten their lending standards on these loans in the second half of 2008, and about 50 percent of both domestic and foreign banks anticipated doing so in the first half of 2009.
On the household side, about 45 percent of domestic respondents noted that they expected their banks to tighten lending standards on prime residential mortgage loans in the second half of 2008, and about 30 percent, on balance, thought that they would tighten standards on those loans in the first half of 2009. Concerning nonprime mortgage loans—a category that includes both nontraditional and subprime mortgage loans—about 65 percent of the respondents that reported having originated such loans indicated that they anticipated tightening their lending standards in the second half of the year, and about 50 percent believed that they would do so in the first half of 2009. About 60 percent of domestic respondents, on net, reported that they expected to tighten their credit standards for approving applications for revolving HELOCs through the end of 2008, and 40 percent of banks anticipated a tightening on these products in the first half of 2009. Regarding credit card loans, about 60 percent of domestic respondents indicated that they expected their banks to tighten standards on these loans in the second half of 2008, and about 35 percent, on balance, thought that their banks would tighten such standards on these loans in the first half of 2009. Finally, about 50 percent of respondents reported that they expected to tighten their lending standards on consumer loans other than credit cards through the end of 2008, and 30 percent, on net, indicated that they anticipated doing so in the first half of next year.
Last Page of Domestic Financial Developments

International Developments

International Developments
IV-1
U.S. International Transactions
Trade in Goods and Services
The U.S. international trade deficit narrowed to $59.8 billion in May, as a large increase
in exports of goods and services more than offset a moderate increase in imports.
In May, exports rose 0.9 percent, supported by strong exports of industrial supplies,
particularly of petroleum products, and services. Increased exports of passenger cars
pushed up automotive exports, while exports of consumer goods were flat after jumping
up in April. Exports of agricultural products fell back a bit in May but remained at an
elevated level. Exports of capital goods recorded a substantial decline following a large
increase in April.
The average value of exports in April and May increased 15.1 percent (a.r.) from the first
quarter, with a large portion of the increase reflecting higher exports of industrial
supplies. Exports of agricultural goods, consumer goods, capital goods, and services also
recorded strong growth. Exports of automotive products were a weak spot, recording a
slight decline.

IV-2

IV-3

IV-4
The value of imports of goods and services rose 0.3 percent in May, boosted in part by a
strong increase in imports of consumer goods, with televisions recording a particularly
large jump. Imports of capital goods moved up, supported by a surge in computer
imports. Imports of industrial supplies and services imports also showed solid growth.
In contrast, the value of petroleum imports fell back despite higher prices, as the volume
of imports declined steeply. Imports of automotive products also fell in May.
The average value of imports in April and May increased 14.6 percent (a.r.) from the first
quarter, with imports of industrial supplies exhibiting particular strength. Capital goods
and consumer goods also recorded robust gains. The value of oil imports rose, as an
increase in the price of imported oil more than offset a decline in volumes. In contrast,
imports of automotive products declined.
Prices of Internationally Traded Goods
Non-oil imports. In June, prices of core imports rose 1 percent. This increase mostly
reflected higher prices for material-intensive goods, which rose 2.5 percent after rising
1.3 percent in May. Prices for products made with steel and iron rose sharply in June.
Prices for imported finished goods rose a moderate 0.2 percent in June, the same pace as
in May.
The average level of core import prices in the second quarter was 13¾ percent (a.r.)
above the first-quarter average, as prices increased in all major subcategories. Prices for
material-intensive goods rose 32 percent. Prices for finished goods increased 5¾ percent,
a pace 1¾ percentage points above that in the first quarter. Prices of consumer goods
contributed to the acceleration of finished goods prices, increasing 5¾ percent in the
second quarter. Prices of capital goods excluding computers and semiconductors also
accelerated, rising at a pace of 8½ percent, twice as fast as in the first quarter. Much of
the price increase for capital goods is due to higher prices for oilfield equipment, but
prices for many other capital goods are also higher.
Oil. The BLS price index of imported oil rose 7.4 percent in June. Similarly, the spot
price of West Texas intermediate (WTI) crude oil averaged $133.93 per barrel in June, up
6.8 percent from the May average. In early July, the spot price of WTI climbed to above
$145 per barrel but has since fallen back to $122.19 per barrel as of July 29. The price of
futures for delivery at the end of 2016 moved in a similar fashion, closing on July 29 at
$118.18 per barrel. Increasing geopolitical risk likely provided support for oil prices
during June and early July, as tensions escalated in the Middle East and violence

IV-5

IV-6

IV-7
continued in Nigeria. Prices have fallen back rapidly, however, amid rising concerns
over the strength of economic activity and the resulting implications for global oil
demand. In addition, the most recent data from the International Energy Agency indicate
that Saudi Arabia increased production in June, and market participants expect further
production increases in July.
Exports. Core export prices rose 1 percent in June. Almost all of the increase was due
to higher prices for material-intensive goods. Prices for agricultural products and
nonagricultural industrial supplies both increased over 2 percent. The increase in
agricultural prices was driven by higher prices for soybeans, corn, meat, and fruit, which
more than offset declines in wheat and vegetable prices. For nonagricultural industrial
supplies, the June increase was primarily driven by rising fuel prices, although higher
prices for inorganic chemicals and plastics also contributed to the rise. Prices for finished
goods were little changed.
The average level of core export prices in the second quarter was 12 percent (a.r.) above
the first quarter average. Much of the rise can be attributed to a 26 percent increase in
prices of nonagricultural industrial supplies. Agricultural prices, having increased at a
58 percent pace in the first quarter, were up only 14½ percent in the second quarter.
Prices of exported finished goods were up 2½ percent, a rate comparable to that in 2007.
U.S. International Financial Transactions
Since the June Greenbook, we have received data on U.S. international financial
transactions for May, along with partial and confidential data on custody accounts at
FRBNY through July 29. Foreign official flows into the United States were $46 billion
in May, on par with April’s figure and near their six-month average (line 1 of the
Summary of U.S. International Financial Transactions table and the chart on Foreign
Official Financial Flows).
Among foreign officials, the G-10 and the ECB reduced their holdings of U.S. securities
by nearly $11 billion in May, the largest outflow since 2006 (line 1a);
. Inflows from OPEC (line 1b) and from other countries (line
1c) remained strong. On net, foreign official inflows in May were concentrated in agency
bonds. Data on custody accounts at FRBNY indicate that official net purchases of
agency bonds and Treasury securities likely remained strong during June but eased
somewhat in July (see inset chart).

IV-8
Foreign private purchases of U.S. securities
totalled $31 billion in May, exceeding the pace
of the first quarter but well below the pace of
the fourth quarter of 2007 (line 4 of the
Summary of U.S. International Financial
Transactions table; see also the chart on Private
Securities Flows). In contrast to foreign
officials, foreign private investors continued
selling agency bonds in May (line 4b) at the
near record pace that began in March (top right
panel of the chart); foreign private investors on
net purchased Treasury securities, but these
purchases were modest (line 4a). Outside
agency bonds and Treasury securities, foreign
private investors on net purchased corporate bonds; these purchases were well above the
pace of the past six months (line 4c). Net purchases of corporate stocks (line 4d) were
about in line with their six-month trend.
After recording small net sales in April, U.S. net acquisitions of foreign securities in May
amounted to $27 billion (line 5), exceeding their six-month trend; these purchases were
concentrated on foreign stocks (line 5b). The bottom left panel of the chart shows that,
despite their month-to-month volatility, private acquisitions of foreign securities have
been declining, on average, since 2007. This decline has been concentrated in purchases
of foreign bonds. Such purchases were especially weak early this year, in line with low
issuance of foreign bonds.
The volatile banking sector (line 3) posted a further net
outflow in May. Since the turmoil began in August
2007, net lending abroad by banks has increased with
unusual consistency (see inset chart). These outflows,
primarily from foreign-owned banks lending to
European affiliates, likely reflect tensions in interbank
funding markets and cumulate to a sizeable $336
billion between August 2007 and May 2008.
m1ars02
Typewritten Text
Content partially redacted.

IV-9
Finally, U.S. official assets (line 2) showed a $27 billion outflow in May, reflecting
primarily an increase in the amounts drawn from the temporary swap arrangements with
the European Central Bank and Swiss National Bank. These swap arrangements were
also the primary contribution to the $24 billion outflow for this line in the fourth quarter.

IV-10

IV-11

IV-12

IV-13
Foreign Financial Markets
Concerns about the GSEs weighed on the dollar and foreign stock markets, but both
rebounded as U.S. earnings reports and macro data generally exceeded market
expectations. The major currencies index depreciated almost 2 percent between July 7
and July 15, the period when worries about the GSEs were at their height, but it
subsequently appreciated as investor sentiment improved and is now only unchanged
from its level at the time of the June Greenbook. Despite this market volatility, concerns
about the GSEs seemed to have had little impact on foreign official demand for agency
debt. Although the major foreign stock markets erased most of the losses that they
suffered in mid-July, they have still declined 6 to 8 percent on net since the June
Greenbook amid signs that growth in the foreign advanced economies is slowing.
As expected, the European Central Bank (ECB) raised its policy rate 25 basis points to
4.25 percent on July 3. In the following press conference, President Trichet indicated
that he considered policy to be neutral. Expectations of further policy tightening in the
advanced foreign economies have diminished as growth has appeared to slow and as the
recent decline in oil prices has eased inflation fears. Ten-year benchmark sovereign
yields have declined 15 to 30 basis points in the euro area, United Kingdom, and Japan
since the June Greenbook, while ten-year inflation compensation has declined roughly
10 basis points in the euro area and Japan and 45 basis points in the United Kingdom.
Pressures in interbank funding markets have eased modestly since the June Greenbook.
Quarter-end pressures were high by historical standards but comparable to experience
over the past year, as overnight euro and sterling Libor rates declined about 25 basis
points at the start of the third quarter. Spreads between euro Libor and OIS rates declined
about 10 basis points as European banks appeared to successfully lock in funding in the
days prior to the quarter end, and spreads between sterling Libor and OIS rates declined
by a similar amount in mid-July. British banks appear to be securitizing assets for use as
collateral at the Bank of England’s special liquidity scheme, and their ability to make use
of the scheme may be partly responsible for the modest easing of funding pressures in
sterling. Implied rates from foreign exchange and currency basis swaps indicate that the
interest rates paid by European financial institutions for dollar funding also eased
somewhat. However, demand at the dollar term-funding auctions held by the ECB and
Swiss National Bank (SNB) remained strong, with the ECB’s auctions drawing record
amounts of bids. On July 30, The ECB and SNB announced that they would extend the
maturity of a portion of their auctions of dollar funding from one-month to three months

IV-14
in collaboration with the Federal Reserve, but it is too soon to gauge market reaction to
this decision.
The renminbi appreciated a further ¾ percent against the dollar and the Mexican peso and
Brazilian real both appreciated 2¼ percent as the central banks of those two countries
have continued to tighten policy. Several Asian countries struggled to cope with falling
stock markets, spending billions of dollars in an effort to prop up share prices. In
Taiwan, government officials requested that the government pension and insurance funds
buy more domestic shares and hold their investments for a longer period. In Vietnam, the
stock exchange and securities regulator erected a stabilization fund to support the
country’s stock market. Pakistan also announced that it would establish an equity market
stabilization fund in the wake of rioting over falling stock prices.

IV-15

IV-16

IV-17

IV-18

IV-19

IV-20
Developments in Advanced Foreign Economies
Across the advanced foreign economies, information received since the last Greenbook
points to subdued growth in the second quarter and increasing inflation pressures. Weak
second-quarter data on industrial production and sentiment in the euro area and on
consumer expenditures and exports in Japan suggest the first-quarter pop-up in output
growth was not sustained. In Canada, where output declined in the first quarter,
indications are for a mild rebound on improvements in the manufacturing sector. In
contrast, conditions have worsened considerably in the United Kingdom, with the
housing sector looking particularly grim. In all the major advanced foreign economies,
rising food and fuel prices continue to drive inflation to recent highs, although core
measures of inflation have generally remained contained. The European Central Bank
tightened policy in July, but other major central banks held rates constant. Currently,
market participants are expecting the major foreign central banks to keep monetary policy
on hold through the rest of the year.

IV-21

IV-22
Recent indicators point to a sizable step-down in Japanese output growth in the second
quarter, after the first-quarter’s 4 percent (a.r.) jump. Survey measures of household
spending contracted, consumer and business sentiment declined sharply, and industrial
production fell last quarter. Real growth of merchandise exports has also slowed
considerably since the beginning of the year, with export volume falling 3.2 percent over
the three months ending in June, reversing the previous quarter’s gain.
The labor market is weakening. The unemployment rate rose to 4.1 percent in June, and
the job openings-to-applicants ratio (the number of officially posted job openings relative
to the number of officially registered job seekers) fell to 0.91 in June, its lowest level
since February 2005. In addition, total cash earnings (which include bonuses) rose just
0.8 percent over the twelve months ending in May.
Rising energy and food prices have been the primary reason for the 2 percent increase in
Japanese consumer prices over the twelve months ending in June. Consumer prices
excluding fresh food rose nearly as much, but excluding food and energy, prices were
roughly unchanged from last year. The timelier core CPI for Tokyo rose 1.6 percent in
July from a year earlier. At its mid-July meeting, the Bank of Japan unanimously voted
to keep its main policy rate unchanged.
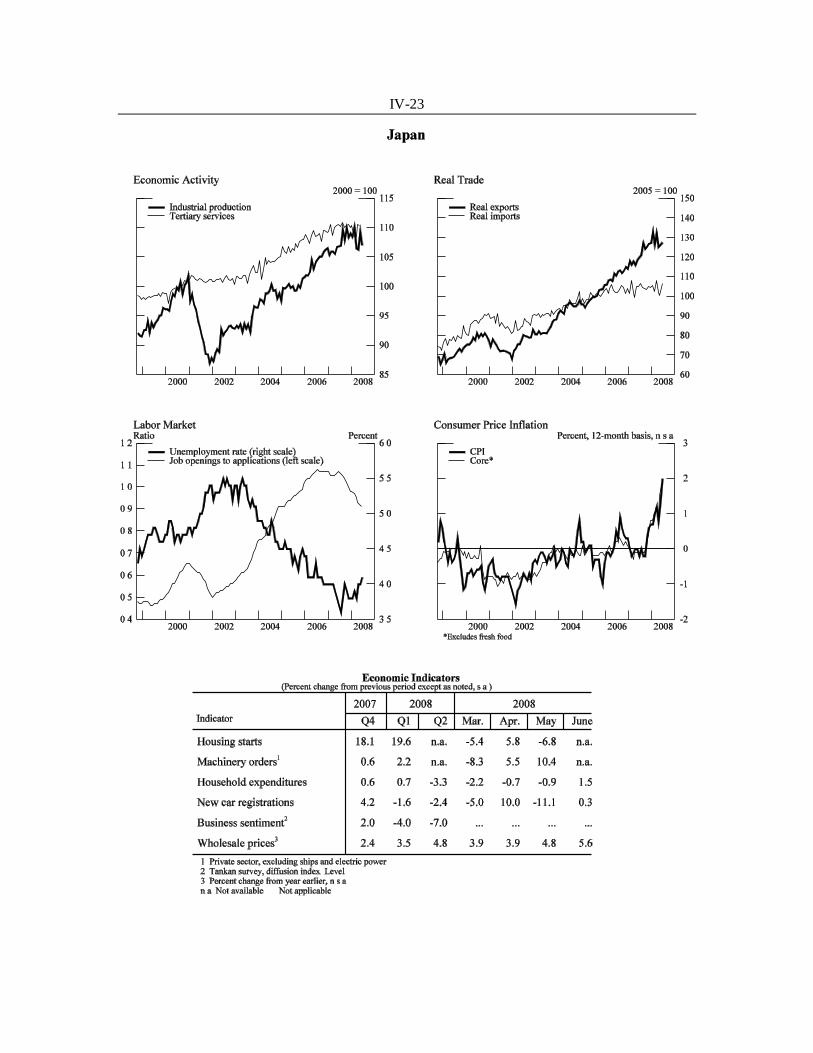
IV-23
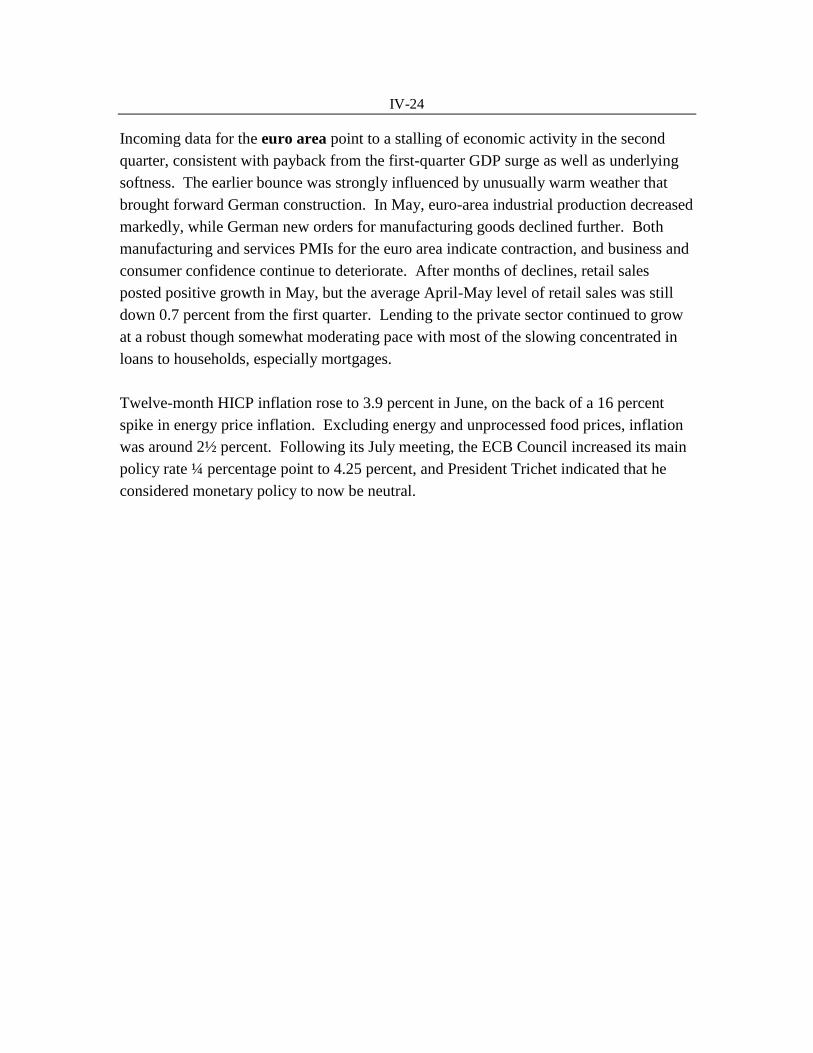
IV-24
Incoming data for the euro area point to a stalling of economic activity in the second
quarter, consistent with payback from the first-quarter GDP surge as well as underlying
softness. The earlier bounce was strongly influenced by unusually warm weather that
brought forward German construction. In May, euro-area industrial production decreased
markedly, while German new orders for manufacturing goods declined further. Both
manufacturing and services PMIs for the euro area indicate contraction, and business and
consumer confidence continue to deteriorate. After months of declines, retail sales
posted positive growth in May, but the average April-May level of retail sales was still
down 0.7 percent from the first quarter. Lending to the private sector continued to grow
at a robust though somewhat moderating pace with most of the slowing concentrated in
loans to households, especially mortgages.
Twelve-month HICP inflation rose to 3.9 percent in June, on the back of a 16 percent
spike in energy price inflation. Excluding energy and unprocessed food prices, inflation
was around 2½ percent. Following its July meeting, the ECB Council increased its main
policy rate ¼ percentage point to 4.25 percent, and President Trichet indicated that he
considered monetary policy to now be neutral.

IV-25
IV-26
In the United Kingdom, real GDP rose a tepid 0.7 percent (a.r.) in the second quarter,
after a downward-revised 1.1 percent in the first quarter. Declines in the manufacturing,
construction, and financial-related services sectors weighed on second-quarter growth.
Most recently, business confidence dropped sharply in July, consumer confidence slid to
a near fifteen-year low in June, and second-quarter surveys of investment intentions
showed further softening. The number of individuals claiming unemployment benefits
rose 4 percent in the second quarter, the largest increase since the early 1990s.
The slump in the housing sector has also deepened further since last Greenbook. In June,
house price indexes flirted with double-digit declines relative to their peak last fall and
mortgage lending for house purchases dropped by two thirds over the past twelve months.
The anticipation of further price declines, along with higher mortgage rates, tighter
lending standards, and the uncertain economic situation, has kept potential home buyers
at bay.
The twelve-month rate of headline inflation jumped to 3.8 percent in June, reflecting one
of the largest monthly increases since 1991. The main contributors to the rise were
energy and food products, especially gasoline, fruits, and meat. Core inflation, which
excludes energy and unprocessed food, firmed to a decade-high of 2.3 percent. Earnings
growth remained contained, however, with the indexes including and excluding bonuses
in May standing about 3½ percent higher than twelve months earlier, slightly below the
five-year average. The Bank of England kept its policy rate unchanged in July.

IV-27

IV-28
In Canada, indicators suggest GDP growth returned to positive, albeit subdued, territory
in the second quarter. Real GDP by industry advanced 0.4 percent in April from the
previous month; manufacturing activity, especially in motor vehicles, rebounded
following a downturn in the first quarter, and wholesale and retail trade were up sharply.
Volumes of manufacturing shipments and new orders rose in April and May. Second-
quarter housing starts were down about 4 percent from the first quarter, but remain in line
with their five-year average. Consumer spending also continued to expand, although
more slowly than in the previous two quarters, with the average level of real retail sales
in April and May 2.3 percent (a.r.) higher than in the first quarter. In April and May, real
exports outpaced real imports.
Total employment expanded at a slower pace in the second quarter. Continuing the trend
of the past several months, full-time employment declined, while part-time employment
expanded. At 6.2 percent in June, the unemployment rate was at its highest level since
early 2007, though still near a thirty-year low.
The twelve-month rate of consumer price inflation jumped to 3.1 percent in June, from
2.2 percent in May, on the back of escalating energy prices and an end to the extremely
low rates of food-price inflation over the past year. However, the Bank of Canada’s
preferred measure of core inflation, which excludes the eight most volatile components of
the consumer price index as well as the effects of indirect taxes, remained muted, ticking
up to 1.6 percent in June, from 1.5 percent in May. The Bank of Canada held rates
constant at its July meeting.

IV-29

IV-30
Economic Situation in Other Countries
Recent indicators for emerging market economies point to some slowing of growth in the
second quarter. Real GDP growth in China moderated but remained strong, supported by
domestic demand. Elsewhere in emerging Asia, incoming data suggest further slowing,
including in India, Singapore, and Thailand, while second-quarter activity remained
sluggish in Mexico.
Headline inflation rose further in much of the developing world, largely owing to higher
food and energy prices, and several countries continued to face upward pressure on core
inflation as well. In contrast, in China, twelve-month headline consumer inflation
continued to decline owing to a drop in food prices. The rising cost of energy subsidies
led several Asian countries to raise state-controlled fuel prices in June and July. Since
the time of the June Greenbook, monetary authorities in emerging market economies
have generally continued to tighten monetary conditions.
In China, the staff estimates that real GDP increased 9.9 percent (s.a.a.r.) in the second
quarter, with China’s official release showing an increase of 10.1 percent (n.s.a.) on a
four-quarter basis. Growth has edged lower in the past year as external demand has
weakened. In contrast, domestic demand appears to have picked up steam in the second
quarter. Retail sales increased 23 percent in June from a year earlier. Nominal import
growth was robust in the second quarter, although some of this increase likely reflects
higher prices of imported oil. Nominal export growth in the second quarter picked up a
bit from the slow pace of the first quarter, but the four-quarter growth rate remains below
that observed through most of last year. The trade surplus in the second quarter fell to
$217 billion (s.a.a.r.) from more than $250 billion in the previous two quarters.
Twelve-month consumer price inflation declined to 7.1 percent in June from a peak of
8.7 percent in February, as food price inflation continued to wane. In contrast, twelve-
month non-food price inflation edged up from 1.6 percent in February to 1.9 percent. In
June, bank lending decelerated to its slowest pace since mid-2006, helping to cool
inflationary pressures. Foreign reserve accumulation also slowed; reserves increased
$12 billion in June, down from an average of $50 billion per month over the first five
months of 2008.

IV-31
India’s industrial production declined slightly on average over the first two months of the
second quarter. The trade deficit widened further through May, reflecting increases in
prices of oil and other commodities. Inflation, measured by the widely followed
wholesale price index, jumped to 11.4 percent in June, largely due to hikes in fuel prices.
In response, the central bank raised the repo rate 50 basis points in late July. The United
Progressive Alliance (UPA) government narrowly won a confidence vote on July 22 that
was held in response to its decision to meet commitments under the U.S.-India nuclear
agreement. The UPA victory may help pave the way for needed structural reforms.

IV-32

IV-33
In the NIEs1, on balance, data point to slower GDP growth in the second quarter. Korean
real GDP growth remained steady at 3.4 percent in the second quarter, with growth
supported by the external sector, as domestic demand was weak. In Singapore, the
advance (unofficial) estimate suggests that real GDP contracted sharply in the second
quarter as a result of a fall in output of the volatile biomedical sector, weak electronics
production, and slow exports. In Taiwan, industrial production slowed. The merchandise
trade balance improved in Hong Kong and in Taiwan; the latter’s balance swung from a
small deficit to a surplus as the value of imports declined.
Twelve-month consumer price inflation moved higher in the NIEs, largely reflecting
higher food and energy prices, although there have been some upward pressures on core
inflation as well. In Taiwan, twelve-month inflation increased more than one percentage
point in June after administered fuel prices were raised. In late June, Taiwan’s central
bank raised its policy rate an eighth of a percentage point, its sixteenth consecutive
increase.
1 Newly-industrialized economies: Hong Kong, South Korea, Singapore, and Taiwan

IV-34

IV-35

IV-36
In the ASEAN-4 area, incoming indicators generally point to a moderation in activity in
the second quarter. In Indonesia, industrial production declined on average over April
and May, while consumer confidence reached a two-year low in June. In Malaysia and
Thailand, industrial production held up, but in Thailand, indicators of private investment
and business sentiment deteriorated. In the Philippines, strong remittances have helped
support domestic demand. In April and May, a fall in capital goods imports contributed
to the improvement in the trade balance in the Philippines and Thailand.
Increasing food and energy prices continue to push consumer price inflation higher. In
July, in response to the rising fiscal costs of fuel subsidies, the Indonesian and Malaysian
governments raised administered prices of fuel and Malaysian authorities indicated that
they will eliminate fuel subsidies by end-August. In contrast, domestic prices of fuel in
Indonesia remain well below market prices. Thailand, which had eliminated its fuel
subsidies in 2006, reenacted significant subsidies on some fuels in July. Inflation has
become the major concern of central banks in the region. The central banks of Indonesia,
the Philippines, and Thailand raised interest rates further to combat inflation.

IV-37

IV-38

IV-39
Financial conditions facing Vietnam deteriorated sharply over the past few months, but
have improved in July. Headline consumer price inflation has risen sharply in recent
months and in June surpassed 25 percent on a twelve-month basis, boosted by food
prices, which comprise more than 40 percent of the CPI. Concerns about rising inflation
and the large and widening current account and fiscal deficits put the dong under strong
downward pressures in late June. Pressures appeared to abate after the central bank
raised its policy rate 200 basis points to 14 percent in June and after the government
outlined steps that it would take to tighten fiscal policy. In late July, authorities
announced a surprise 30 percent increase in the retail price of gasoline, which brought the
retail price to market levels.
Data from Mexico present a mixed picture on activity in the second quarter. Industrial
production continued to edge down, as growth in the mining, utilities and construction
sectors was more than offset by a contraction in manufacturing. Retail sales increased on
average over the April-May period relative to the first quarter. The trade deficit
narrowed somewhat, as exports inched down and imports declined more substantially.
Headline and core inflation continued to increase in June. Both readings exceeded
5 percent on a twelve-month basis, above the 4 percent upper bound of the central bank’s
target range. In response, the Bank of Mexico raised its policy rate by ¼ percentage
point in each of the last two policy meetings, bringing the rate to 8 percent. In addition,
the Mexican government secured an agreement with food suppliers to freeze the prices of
certain food items. In late July, the central bank suspended dollar sales to the market in
an effort to contain upward pressures on the peso, which has appreciated 7 percent so far
this year.

IV-40
In Brazil, data releases since the last Greenbook also provide a mixed picture on the
second quarter. Industrial production over the April-May period was roughly unchanged
from the first-quarter level. Nonetheless, performance was strong in the natural resource-
intensive sectors (including mining, petroleum extraction and refining, and ethanol
refining). Retail sales in April and May expanded, but at a slower pace than in the first
quarter, supported in part by rapid growth in credit. Import growth continued to be very
rapid, partly reflecting strong domestic demand. However, the nominal trade surplus
rebounded from a weak first quarter, in part reflecting payback from strikes that
depressed exports. Exports were also boosted by the rise in commodity prices.
Both headline and core inflation continued to be sources of concern, in June reaching
6 and 5½ percent, respectively. Inflation expectations have also been creeping up,
according to survey data. In response, the central bank continued to tighten policy,
raising the overnight rate 75 basis points to 13 percent in late July.

IV-41
In Argentina, following a sharp slowdown in the first quarter, activity was weak in the
second quarter, weighed down by disruptions from the four-month-long farmers’ strike.
Industrial production declined on average in April and May. The trade surplus narrowed
in the second quarter through May, in part reflecting a strike-related fall in exports. The
strikes ended in late July, when the government’s proposed increases in export taxes on
several agricultural products were narrowly rejected by the Congress. Tensions between
the government and the farmers have also put considerable downward pressures on
Argentine asset prices and have led to a decline in foreign reserves. Reported headline
consumer price inflation continued to rise, surpassing 9 percent in June on a twelve-
month basis, amid large increases in prices of services, such as housing, transportation
and health. Questions about the reliability of official inflation data continue.

IV-42
In Venezuela, real GDP fell by an estimated 9 percent in the first quarter, and we still
expect a partial rebound in the second quarter. Credit growth slowed considerably in the
first half of 2008, most likely depressed by the rise in interest rates in recent months and
by the deterioration in the business climate. Vehicle sales in April were down by over
15 percent on a twelve-month basis. Inflation continues to rise; twelve-month headline
consumer price inflation surpassed 30 percent in June, boosted by soaring food prices.

IV-43

IV-44
In Turkey, recent indicators suggest that real GDP growth softened in the second quarter
following rapid first-quarter growth. Industrial production growth slowed on average in
April and May. Twelve-month consumer price inflation remained high, but monthly
inflation declined in June, as food prices declined. At its July meeting, the Monetary
Policy Committee raised the overnight borrowing rates 50 basis points to 16.75 percent.
In June, the central bank raised the upper bound of its inflation target from 6 to
7.5 percent for 2009, but lowered the 2011 upper bound from 6 to 5.5 percent, noting that
food and fuel price pressures will abate over the medium term.
Last Page of Part 2