Fomc 19930707 g Bpt 219930630
117
Prefatory Note The attached document represents the most complete and accurate version available based on original copies culled from the files of the FOMC Secretariat at the Board of Governors of the Federal Reserve System. This electronic document was created through a comprehensive digitization process which included identifying the best- preserved paper copies, scanning those copies, 1 and then making the scanned versions text-searchable. 2 Though a stringent quality assurance process was employed, some imperfections may remain. Please note that this document may contain occasional gaps in the text. These gaps are the result of a redaction process that removed information obtained on a confidential basis. All redacted passages are exempt from disclosure under applicable provisions of the Freedom of Information Act. 1 In some cases, original copies needed to be photocopied before being scanned into electronic format. All scanned images were deskewed (to remove the effects of printer- and scanner-introduced tilting) and lightly cleaned (to remove dark spots caused by staple holes, hole punches, and other blemishes caused after initial printing). 2 A two-step process was used. An advanced optimal character recognition computer program (OCR) first created electronic text from the document image. Where the OCR results were inconclusive, staff checked and corrected the text as necessary. Please note that the numbers and text in charts and tables were not reliably recognized by the OCR process and were not checked or corrected by staff.
-
Upload
fraser-federal-reserve-archive -
Category
Documents
-
view
222 -
download
0
Transcript of Fomc 19930707 g Bpt 219930630

Prefatory Note
The attached document represents the most complete and accurate version available based on original copies culled from the files of the FOMC Secretariat at the Board of Governors of the Federal Reserve System. This electronic document was created through a comprehensive digitization process which included identifying the best-preserved paper copies, scanning those copies,1 and then making the scanned versions text-searchable.2 Though a stringent quality assurance process was employed, some imperfections may remain.
Please note that this document may contain occasional gaps in the text. These gaps are the result of a redaction process that removed information obtained on a confidential basis. All redacted passages are exempt from disclosure under applicable provisions of the Freedom of Information Act.
1 In some cases, original copies needed to be photocopied before being scanned into electronic format. All scanned images were deskewed (to remove the effects of printer- and scanner-introduced tilting) and lightly cleaned (to remove dark spots caused by staple holes, hole punches, and other blemishes caused after initial printing). 2 A two-step process was used. An advanced optimal character recognition computer program (OCR) first created electronic text from the document image. Where the OCR results were inconclusive, staff checked and corrected the text as necessary. Please note that the numbers and text in charts and tables were not reliably recognized by the OCR process and were not checked or corrected by staff.

Confidential (FR) Class III FOMC
June 30, 1993
RECENT DEVELOPMENTS
Prepared for the Federal Open Market CommitteeBy the staff of the Board of Governors of the Federal Reserve System

CONTENTS
II DOMESTIC NONFINANCIAL DEVELOPMENTSEmployment and unemployment.................................. ..... . 1Industrial production ................... ............................... 5Personal income and consumption.................................... 11Housing markets ................................................... 16Business fixed investment .............. ........... ...... ....... 21Business inventories .................... ............................ 29Federal sector............... .... ..... ................ . ....... .... 31State and local government sector.................................. 34Prices ...... ...... .. ............ .. ............. ... . .... .. ......... 35Wages and labor productivity....................................... 45
TablesChanges in employment .. .................................... ... ..... 2Selected unemployment and labor force participation rates......... 2Growth in selected components of industrial production.............. 6Capacity utilization.................. ...................... ...... 6Production of domestic autos and trucks......... .. ................ 7Model-year assembly capacity for U.S. autos and light trucks ...... 7New orders for durable goods....................................... 9Personal income .................................................. 10Real personal consumption expenditures ...... ..................... 10Sales of automobiles and light trucks .............................. 14Private housing activity.................................. ........ . 17Business capital spending indicators................................ 22Prices of office buildings according to
the National Real Estate index ................................ 27Changes in manufacturing and trade inventories.................... 28Inventories relative to sales...................................... 28Federal government outlays and receipts............................ 32Recent changes in consumer prices ................................. 36Recent changes in producer prices ............ .............. ....... 36Inflation rates excluding food and energy .......................... 37Price indexes for commodities and materials ....................... 38Monthly average prices--West Texas intermediate ................. 42Labor productivity and costs....................................... 46Average hourly earnings ........................................... 46Revisions to labor productivity and costs........................... 47
ChartsOther labor market indicators ................................... .. 4Manufacturing sector .............................................. 8Personal consumption expenditures excluding motor vehicles........ 12Indicators of consumer sentiment................................. . 15Private housing starts ........................................... 17Consumer homebuying attitudes................... ................... 18MBA indexes of mortgage loan applications.......................... 18Build--: rating of new home sales.................... ............. 18Fund ,.-:.tal determinants of business fixed investment ............. 20Shipments of selected components of nondefense capital goods...... 23Nonresidential construction and selected indicators .............. 24Indicators of the market for office space.......................... 26Ratio of inventories to sales ................... ....... ...... .... 30State and local government construction put-in-place.............. 32State and local government employment . ................ .......... 32Index weights....... ..... ................................. .. ........ 38Commodity price measures ............ .............. ... .. ....... . 40Daily spot and posted prices of West Texas intermediate............ 42Factors influencing wage inflation.............................. 44Revisions to labor productivity................................... . 48

iiIII DOMESTIC FINANCIAL DEVELOPMENTSMonetary aggregates and bank credit............................... 3Nonfinancial business finance..................................... 7Treasury and sponsored agency financing........................... 11Municipal securities................................................ 13Mortgage markets................................................... 16Consumer installment credit......................................... 22
TablesMonetary aggregates................................................. 2Commercial bank credit and short- and intermediate-term
business credit .................................. ..... ........ 4Gross offerings of securities by U.S. corporations................ 8Treasury and agency financing...................................... 12Gross offerings of municipal securities........................... 14Mortgage-backed security issuance................................. 21Consumer credit .................................................. . 23Consumer interest rates ................................. .......... 23
ChartsRatio of net interest payments to cash flow plus
net interest payments, nonfinancial corporations.............. 10MBA index of mortgage loan applications............................. 16Mortgage yield spread and volatility............................... 18Prepayment rates on FNMA mortgage-backed securities................ 20Spreads between consumer loan rates at commercial banks........... 24Ratio of household debt service to disposable personal income..... 24Consumer loan delinquency rates at commercial banks .............. 25Home mortgage delinquency rates at all lenders..................... 25
IV INTERNATIONAL DEVELOPMENTSMerchandise trade.................................................... 1Oil imports....................................................... . 3Prices of non-oil imports and exports.............................. 4U.S. current account............................................. . 6U.S. international financial transactions......................... 7Foreign exchange markets..................................... ...... . 11Developments in foreign industrial countries...................... 15Economic situation in other countries............................. 28
TablesU.S. merchandise trade: Monthly data............................... 1Major trade categories.............................................. 2Oil imports........................................................ 4Import and export price measures.................................... 5U .S. current account............ ........ ... ............. .......... 7Summary of U.S. international transactions........................ 8International banking data........................................ 10Major industrial countries
Real GNP and industrial production.............................. 16Consumer and wholesale prices................................... 17Trade and current account balances................................ 18
Japanese economic indicators................. ..... ............... . 19Western German economic indicators.............................. .21
ChartsWeighted average exchange value of the dollar...................... 12Selected dollar exchange rates.................................... 12

DOMESTIC NONFINANCIALDEVELOPMENTS
DOMESTIC NONFINANCIAL DEVELOPMENTS
Real GDP growth in the second quarter appears to have exceeded
the meager 0.7 percent pace of the first, but by how much is still
uncertain. Production worker hours were very strong in May,
suggesting the possibility of a large gain in output, but the recent
spending indicators point to no more than a moderate expansion of
activity. The manufacturing sector slowed during the spring, with
imports perhaps accounting for an increased share of domestic
spending: new orders have softened in recent months. Although
consumer prices rose just 0.1 percent in May, the cumulative wage
and price data for the year to date provide no evidence that
inflation is still trending downward--and according to some measures
it may have turned back up.
Employment and Unemployment
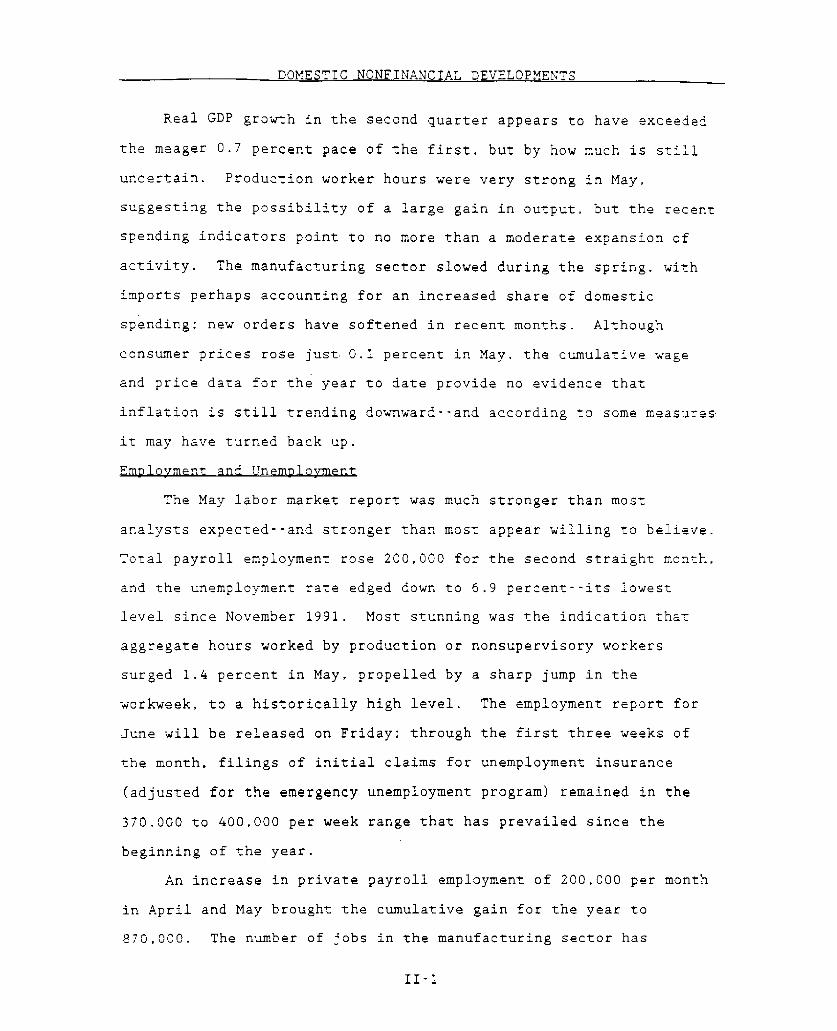
The May labor market report was much stronger than most
analysts expected--and stronger than most appear willing to believe.
Total payroll employment rose 200,000 for the second straight month,
and the unemployment rate edged down to 6.9 percent--its lowest
level since November 1991. Most stunning was the indication that
aggregate hours worked by production or nonsupervisory workers
surged 1.4 percent in May, propelled by a sharp jump in the
workweek, to a historically high level. The employment report for
June will be released on Friday; through the first three weeks of
the month, filings of initial claims for unemployment insurance
(adjusted for the emergency unemployment program) remained in the
370,000 to 400.000 per week range that has prevailed since the
beginning of the year.
An increase in private payroll employment of 200,000 per month
in April and May brought the cumulative gain for the year to
870,000. The number of jobs in the manufacturing sector has
II-I

II-2
CHANGES IN EMPLOYMENT(Thousands of employees; based on seasonally adjusted data)
1992 1993 1993
1991 1992 Q3 Q4 Q1 Mar. Apr. May
------------Average monthly changes-------...
Nonfarm payroll employment2 -72 80 73 135 162 26 216 209
Private -88 59 37 123 155 15 209 196Manufacturing -44 -26 -41 -12 7 -19 -75 -39
Durable -39 -22 -32 -9 3 -19 -56 -48Nondurable -5 -5 -9 -3 5 0 -19 9
Construction -33 -5 -7 4 7 -34 36 67Trade -30 20 10 35 62 -19 47 33Finance, insurance, real estate -9 -2 -1 3 0 -3 10 -1Services 39 78 84 92 77 91 199 126
Health services 30 29 31 36 29 30 33 24Business services 4 31 22 47 31 43 66 29
Total government 17 22 36 12 7 11 7 13
Private nonfarm production workers -71 74 52 132 149 -4 149 225Manufacturing production workers -29 -13 -28 1 16 -3 -59 -27
Total employment3 -62 130 71 196 85 114 -149 857Nonagricultural -53 122 79 182 145 148 -127 847
Memo:Aggregate hours of private production
workers (percent change) -.1 .1 0 0 .2 .1 -.4 .7 1.4Average workweek (hours) 34.3 34.4 34.4 34.4 34.4 34.2 34.4 34.8
Manufacturing (hours) 40.6 41.1 41.1 41.2 41.3 41.2 41.5 41.5
1. Average change from final month of preceding period to final month ofperiod indicated.
2. Survey of establishments.3. Survey of households.
SELECTED UNEMPLOYMENT AND LABOR FORCE PARTICIPATION RATES(Percent; based on seasonally adjusted data)
1992 1993 1993
1991 1992 Q3 Q4 Q1 Mar. Apr. May
Civilian unemployment rate(16 years and older) 6.7 7.4 7.5 7.3 7.0 7.0 7.0 6.9
Teenagers 18.7 20.0 20.3 19.4 19.6 19.5 20.7 19.720-24 years old 10.8 11.3 11.5 11.1 11.0 10.6 10.6 11.4Men, 25 years and older 5.7 6.4 6.5 6.3 5.9 6.1 5.8 5.7Women, 25 years and older 5.1 5.7 5.8 5.8 5.4 5.1 5.4 5.3
Fulltime workers 6.5 7.1 7.3 7.0 6.6 6.6 6.6 6.6
Labor force participation rate 66.0 66.3 66.4 66.2 66.0 66.0 65.9 66.3
Teenagers 51.7 51.3 51.7 51.2 51.5 51.3 51.7 52.720-24 years old 76.8 77.1 77.4 77.0 77.3 77.2 76.9 78.0Men, 25 years and older 76.7 76.7 76.7 76.4 76.1 76.1 76.1 76.3Women, 25 years and older 56.5 57.0 57.1 57.1 56.8 56.8 56.6 56.9

II-3
continued to decline, but increases have been reported of late in
most other sectors. Construction employment rose about 100,000 over
April and May, with the pickup in hiring undoubtedly enhanced by a
return to more normal weather. The share of payroll employment
growth attributable to service industries was even larger in the
recent two months than in the first quarter.
Job growth in business services, which was one of the few
bright spots in the labor market in 1992, has continued at a brisk
pace in 1993. Of that growth, about two-thirds has been in the
personnel supply category, the major component of which is temporary
help agencies; the share of temporary workers in total payroll
employment, while still small, has been increasing rapidly (chart).
Although the growth in temporary employment over the past decade may
reflect firms' desire for a more flexible workforce, recent
increases may also be a signal that firms remain cautious about
expanding payrolls permanently.
Average weekly hours of production or nonsupervisory workers
jumped 0.4 hour to 34.8 hours in May, the highest level since April
1989. In manufacturing, the average workweek held constant at
41.5 hours in May, and overtime hours were unchanged at 4.2 hours
per week--high levels by historical standards.
As measured in the household survey, employment surged 857,000
in May. Monthly movements in this series tend to be highly
volatile, but especially so at the end of the school year when large
seasonal swings in hiring occur. For the year to date, household
employment has increased about 960,000--a gain similar to that
recorded in payroll employment over the same period.
The labor force also posted a substantial increase in May, up
almost 800,000. Labor force growth had been quite sluggish during
the preceding four months, however, and the May gain only moved the

II-4
OTHER LABOR MARKET INDICATORS
Initial Claims for Unemployment Insurance'Thousands
Average Weekly Hours'Hours
1990 1991 1992 1993 1990 1991 1992 1993Induding EUC adjustment ' Production or non-supervisory workers.
Temporary Help*Percent
...... ." May...... .1.8
V- V
..... .....!!i!!i~i !!•i!! ii~i~~i~ii! !•!•! i-
1981 1983 1985 1987
" Employment in personnel services a a share of total private employment
Jobs Hard to Get* LaPercent
1989 1991
bor Force
1993
Millions
CLivilian labor force60 - - -- Three-month moving average
May-
1990 1991 1992 1993 1990 1991 1992 1993
P From te Conference Board's Survey of Consumer Sentiment
35.4
35.1
34.8
34.5
34.2
33.9
2.2
1.8
1.4
1
0.6
0.2
132
130
128
126
124
122
120
--

II-5
labor force participation rate back up to its December 1992 level of
66.3 percent. Participation so far this year probably has continued
to be damped by perceptions that job opportunities are scarce. For
example, the Conference Board survey of consumers shows that the
proportion of respondents who perceive jobs as "hard to get" has
come down only a little, on net, from its recent peak, and the
proportion who consider jobs to be plentiful has risen only a
little.
Industrial Production
Industrial production rose 0.2 percent in May, after upward-
revised increases of the same size in March and April. Mining
output moved up a bit further in May, and output of utilities edged
down. Manufacturing output increased 0.2 percent, as a slight
decline in motor vehicle assemblies partly offset gains elsewhere.
The capacity utilization rate for industry was unchanged at
81.6 percent for a third month.
Motor vehicle assemblies dropped to a 10.7 million unit annual
pace in May after holding steady in the preceding two months at just
over 11 million units. With sales of North-American-produced autos
improving slightly further in May. dealers' inventories of new autos
fell to an estimated seventy days' supply. For June, production
appears to have edged down further, to a 10.5 million unit annual
pace.
Assembly schedules for July call for production at U.S. plants
to return to the May level, and a sharp pickup in assemblies
currently is scheduled for August. The increase in auto assemblies
scheduled for August comes just before the start of labor
negotiations in the industry and may represent a desire to build
inventories in anticipation of a possible strike. Assemblies of
light trucks apparently edged down in June for a second month, but

II-6
GROWTH IN SELECTED COMPONENTS OF INDUSTRIAL PRODUCTION(Percent change from preceding comparable period)
Proportion 1992 1993 1993in
totalIP
1992:4 19921 Q4 Q1 Mar. Apr. May
-Annual rate ---Monthly rate----
Total index 100.0 3.2 6.7 5.5 .2 .2 .2Previous 3.2 6.7 5.3 .0 .1
Manufacturing 84.6 3.7 6.5 6.4 .3 .4 .2Motor vehicles and parts 4.9 10.2 33.7 37.4 -.5 .5 -1.4
Mining 7.3 -.9 1.5 -5.7 -.6 1.3 .5Utilities 8.2 2.0 14.4 4.6 .2 -3.4 -.3
MANUFACTURINGEXCEPT MOTOR VEHICLES AND PARTS 79.7 3.3 5.1 4.6 .3 .4 .3
Consumer goods 22.1 2.1 4.7 2.3 .2 .0 .2Durables 3.7 3.8 5.8 15.0 .3 .4 .2Nondurables 18.4 1.7 4.4 -.1 .2 -.1 .3
Business equipment 14.5 9.9 10.6 8.6 1.3 .8 .5Office and computing 3.2 31.1 25.2 32.0 2.9 2.8 2.7Industrial 4.0 6.1 8.3 4.8 .7 .7 .6Other 7.1 4.2 5.9 .6 .8 -.1 -.7
Defense and space equipment 3.3 -7.8 -7.5 -7.6 -.8 -.4 -.4
Construction supplies 4.8 4.5 4.4 5.9 -1.3 -.2 .5
Materials 28.2 3.2 5.1 7.3 .1 .6Durables 18.9 3.6 7.7 9.3 -.2 .4Nondurables 9.0 2.3 .4 4.1 .7 .9 .2
1. From the final quarter of the previous period to the final quarter of the periodindicated.
CAPACITY UTILIZATION(Percent of capacity; seasonally adjusted)
1967-92 1992 1992 1993 1993
Avg. Avg. Q4 Q1 Mar. Apr. May
Total industry 81.9 79.8 80.7 81.4 81.6 81.6 81.6
Manufacturing 91.2 78.8 79.6 80.5 80.6 80.8 80.8
Primary processing 82.2 82.2 82.7 83.9 83.8 84.1 84.3Advanced processing 80.7 77.3 78,3 79.0 79.3 79.4 79.4

II-7
remained in a very high range. Production plans for the third
quarter show assemblies holding close to their second-quarter
average.
PRODUCTION OF DOMESTIC AUTOS AND TRUCKS(Millions of units at an annual rate: FRB seasonal basis)
1993
Apr. May June July Aug. Sept.--------- scheduled---------
U.S. production 11.1 10.7 10.5 10.7 11.5 10.9Autos 6.3 6.0 6.0 6.2 6.7 6.2Trucks 4.8 4.7 4.5 4.5 4.7 4.7Light trucks 4.6 4.4 4.2 4.2 4.4 4.4
Days' supplyAutos 72.5 71.1Light trucks 69.6 68.2
1. Components may not sum to totals because of rounding.2. BEA seasonal basis, end of month.
Automobile manufacturers appear to have ample flexibility to
increase production of cars; annual assembly capacity for cars in
the United States presently amounts to about 8.2 million units.
about 2 million units above the production rates of recent months.
By contrast, truck makers have been operating much closer to
capacity, as sales growth for light trucks has greatly outstripped
growth in sales of cars over the past two years. U.S. capacity for
light trucks is slated to move up a bit further in the 1994 model
year. to 5.3 million units, about 3/4 million units above recent
output levels.
MODEL-YEAR ASSEMBLY CAPACITYFOR U.S. AUTOS AND LIGHT TRUCKS
(Millions of units)
1992 1993 1994
Total light vehicles 13.07 13.34 13.35
Autos 8.11 8.18 8.10
Light trucks 4.96 5.17 5.25
Source: FRB staff compilation from industry sources.

II-8
MANUFACTURING SECTOR
CAPACITY UTILIZATION Percent
Primary processing
Advanced processing
1985 1986 1987 1988 1989 1990 1991 1992 1993
PRODUCER PRICES
Excl. Food and Energy
Percent change, year earlier
Intermediate materials
Finished goods
.." ,,,j ". ,, .
1985 1986 1987 1988 1989 1990 1991 1992 1993
VENDOR PERFORMANCE* Percent
May
1985 1986 1987 1988 1989
Source: National Association of Purchasing Managers. Series is equal to thenet proportion of respondents who say that delivenes have slowed.
1990 1991 1992 1993

Outside of motor vehicles, manufacturing output increased
0.3 percent in May, just a shade less than the 0.4 percent average
monthly pace in the first four months of 1992. Growth of output for
consumer goods other than motor vehicles has been weak this year,
likely in response both to the subdued pace of retail sales and to
the recent increase in import penetration. In contrast, gains in
the output of business equipment have been strong, averaging about
0.8 percent per month. The May gain was on the low side of that
average--output of computers and industrial equipment is estimated
to have continued to grow briskly, but other business equipment
production fell 0.7 percent. Production of materials increased
0.3 percent in May, about the same as the average for the first four
months of 1993.
Among the more current indicators of industrial activity,
orders for manufacturers' durable goods fell in May for the third
consecutive month (table). Reports from the Philadelphia Business
Outlook Survey and Chicago purchasing managers suggest that activity
was sluggish in June. The available weekly output indicators are a
slight negative for June IP.
NEW ORDERS FOR DURABLE GOODS(Percent change from preceding period; seasonally adjusted)
Share1992 1993 1993H2 Q1 Feb. Mar. Apr. May
Total durable goods 1 100 3.1 2.5 -3.4 -.2 -1.7Adjusted durable goods 66 2.0 1.0 -1.4 -. 1 -1.1
Office and computing 2 4 9.0 9.6 -4.8 -2.5 6.5Nondefense capital goods 16 3.1 .9 2.8 1.2 -4.8Other 46 1.0 .2 -2.5 -.3 -.5
Memo:Real adjusted durable goods 2.2 1.5 -1.7 .0 -.4
1. Orders excluding defense capital goods, nondefense aircraft,motor vehicle parts, and those not reporting unfilled orders.
2. Excludes aircraft and computers.

II-10
PERSONAL INCOME(Average monthly change at an annual rate; billions of dollars)
1992 1993 1993
1992 Q3 Q4 Q1 Apr. May
Total personal income 20.8 14.1 37.7 22.3 5.5 30.3
Wages and salaries 10.8 7.5 20.8 4.0 10.9 30.2Private 8.9 7.5 18.6 2.2 9.0 28.3
Other labor income 1.4 1.4 1.4 1.5 1.4 1.4
Proprietors' income 4.1 5.3 8.2 10.0 -17.3 -7.8Farm .5 2.6 3.4 8.4 -21.0 -11.5
Rent 1.4 -.6 2.6 .4 8.3 .6Dividend 1.2 1.5 2.0 .6 .2 .3Interest -3.7 -5.5 .0 -.7 -.4 -.2
Transfer payments 6.7 5.3 4.0 7.8 3.0 7.6
Less: Personal contributionsfor social insurance 1.1 .7 1.5 1.3 .7 1.9
Less: Personal tax and nontaxpayments 2.0 4.4 5.4 2.3 2.3 5.5
Equals: Disposable personal income 18.7 9.7 32.2 20.0 3.3 24.9
Memo: Real disposable income 7.1 1.9 18.5 5.2 -8.1 15.7
REAL PERSONAL CONSUMPTION EXPENDITURES(Percent change from the preceding period)
1992
Personal consumptionexpenditures 3.4
Durable goods 9.2Excluding motor vehicles 10.0
Nondurable goods 3.3Excluding gasoline 3.6
Services 2.2Excluding energy 2.3
1992 1993
Q3 Q4 Q1----- annual rate-----
3.7 5.1 .8
9.4 14.0 -. 818.8 8.9 3.3
2.5 6.8 -2.72.6 8.0 -3.0
3.1 2.1 3.23.3 1.9 3.3
1993
Apr. MayMonthly rate
.9 .1
3.9 .7.9 .3
1.1 -.21.7 -.7
.1 .1
.4 .5
Memo :Personal saving rate
(percent) 4.8 4.6 4.4 4.9 4.4 4.8

II-11
The rate of capacity utilization in manufacturing was unchanged
in May, at 80.8 percent, after rising 1 percentage point from
December to April. However, historical revisions to the capacity
and production data have raised the level of the utilization rate
over the past few quarters. The revised rate for March, the last
month for which data were published before the revision, is about
1-1/2 percentage points above the initial estimate. Manufacturing
output during 1992 and early 1993 is now shown to have increased
about 1 percentage point faster than previously estimated, and the
growth rate of capacity over that period has been revised down. The
upward revision to the growth of manufacturing output since the end
of 1991 was particularly large for electrical machinery, industrial
and commercial machinery, and computer equipment.
The revised utilization rates continue to show an especially
rapid rise in operating rates for the primary-processing group since
the early 1991 trough (upper panel of chart). As typically occurs
when slack in utilization at primary processors is taken up, prices
for many intermediate materials have firmed over the past year and a
half. At higher operating rates, materials suppliers also tend to
ration deliveries through nonprice means, and the purchasing
managers' reports on delivery performance provide some evidence that
this phenomenon has been at work in recent months, although, to be
sure, the May reading showed delivery performance speeding up once
again.
Personal Income and Consumption
Indicators for the consumer sector have been mixed of late.
Real personal consumption expenditures appear to have increased
moderately in the second quarter, but the gains have been sporadic
and rather narrowly based. After rebounding in April from the

II-12
Personal Consumption Expenditures Excluding Motor Vehicles
PCE Durable Goods Excluding Motor Vehicles
* Quarterly Averages
I I
PCE
1989
Nondurable Goods
* Quarterly Averages
1990
Billions of 1987 dollars
May
lII IIIln I lli Il n II II1991 1992 1993
Billions of 1987 dollars
Y May -
I I1989
PCE Services
* Quarterly Averages
Iiiiiiiiiiiiliiiii11111111990 1992 1993
Billions of 1987 dollars
May
IIIL11I1l1l1t II LiLL1991 1992
290
280
270
260
250
240
230
1100
1080
1060
1040
1020
1920
1890
1860
1830
1800
1770
1740
1710
1680
[
19931989 1990
-
I
I
3

II-13
weather-related declines in March, total real PCE is estimated to
have risen only 0.1 percent in May, to a level 0.6 percent above the
average for the first quarter. Spending for motor vehicles and for
nonenergy consumer services has increased substantially in recent
months, but elsewhere little improvement has been evident.
After rebounding in April, spending on nondurable goods fell
0.2 percent in May. Services spending rose only 0.1 percent in
total, as energy consumption dropped back from the especially high
levels of late winter. Spending for durable goods other than motor
vehicles was up 0.3 in May but remained slightly below the average
for the first quarter. Overall, expenditures in May on real PCE
excluding motor vehicles were only 0.2 percent above the average
level in the fourth quarter of 1992 (not at an annual rate).
Sales of new cars and light trucks, which posted a weather-
related recovery in April from a lackluster pace in March, moved
higher in May to a 14.4 million unit annual rate, the highest since
January 1990. Purchases of both domestic- and foreign-nameplate
vehicles advanced last month. During the first twenty days in June,
sales of domestic light vehicles (which include some foreign
nameplates) continued at about the same elevated pace as in May.
Cutting through the weather-related disruptions in monthly
sales, purchases of light vehicles have been on a significant
uptrend since last fall. During this period, domestic-nameplate
vehicles have fared better than foreign-nameplate vehicles. The
market share for Big Three cars has averaged about 66 percent so far
this year, compared with a 63 percent share for 1992 as a whole.
This improvement reflects, at least in part, the smaller rise in Big
Three prices relative to increases in foreign car prices.
The sustained strength in auto sales in recent months seems at
odds with the softness evident in many other indicators for the

II-14
SALES OF AUTOMOBILES AND LIGHT TRUCKS 1
(Millions of units at an annual rate: BEA seasonals)
1992 1993
1991 1992 Q3 Q4 Q1 Apr. May June1-20
Total 12.30 12.85 12.59 13.24 13.12 14.22 14.39 n.a.Autos 8.39 8.38 8.21 8.38 8.30 8.91 9.10 n.a.Light trucks 3.91 4.46 4.38 4.86 4.82 5.31 5.29 n.a.
North American 2 9.73 10.51 10.41 11.02 10.92 11.88 12.00 12.16Autos 6.14 6.28 6.24 6.38 6.32 6.78 6.91 6.95
Big Three 4.99 5.10 4.94 5.18 5.29 5.64 5.70 5.72Transplants 1.14 1.18 1.30 1.20 1.04 1.15 1.21 1.25
Light trucks 3.59 4.23 4.17 4.64 4.60 5.10 5.09 5.22
Foreign produced 2.57 2.34 2.18 2.22 2.20 2.34 2.39 n.a.Autos 2.25 2.11 1.97 2.01 1.97 2.13 2.19 n.a.Light trucks .32 .23 .20 .21 .23 .21 .20 n.a.
Memo:Domestic nameplatemarket share, total .70 .72 .71 .73 .74 .75 .74 n.a.
Autos .63 .63 .63 .64 .66 .66 .65 n.a.
Note: Data on sales of trucks and imported autos for the current month arepreliminary and subject to revision.
1. Components may not add to totals because of rounding.2. Excludes some vehicles produced in Canada and Mexico that are classified
as imports by the industry.

II-15
Indicators of Consumer Sentiment
Car Buying Attitudes versus Light Vehicle Salesmillions of units Index
18 - 160Michigan Index of Car Buying Attitudes June (p)
- -- -Total Light Vehicle Sales, SAAR 150
16 - 140
14 - ""' • ' , /v i -130- 140\l ,fMay
12 - ^ \ \ /, - 130
A 1120121
110
10 1 1LLLt-LlI IIII i 1001989 1990 1991 1992 1993
Consumer ConfidenceIndex
- Michigan Index - 140- - - - Conference Board Index
-71 /\- - 120
- - 100
June (p)
80
-- ^ • \ i •./11 ^ . -- 60
/ 2 / June
II II l illill i IIII 111 1 401989 1990 1991 1992 1993
Comparison of Current and Expected Conditions (Michigan Survey)ndexIndex
150
- Current Conditions- - - - Expected Conditions
120
June (p)
S90
/ June (p)
I'/ 60
1989 1990 1991 1992 1993301989 1990 1991 1992 1993

II-16
consumer sector. One possible explanation for this strength is that
consumers are acting to relieve pent-up replacement demand for motor
vehicles that may have developed during the recession and early
phases of the recovery, when scrappage of older models was
apparently postponed. The attitudes of consumers toward car buying
have generally been improving. In the first part of June, the index
of car-buying conditions from the Michigan survey of consumers stood
at 149, significantly above both its January level of 134 and its
average 1992 level of 131. The leading reasons that consumers gave
for this positive appraisal were that "good buys" were available and
interest rates were low.
Personal income grew rapidly in May, led by a jump in wages and
salaries that was only partly offset by a second month of decline in
farm proprietors' income. Since the beginning of the year. income
growth has been uneven but moderate on average.
The University of Michigan's composite index of consumer
confidence rose slightly in early June, reflecting modest
improvements in consumers' assessments of both current and expected
conditions. Although the June increase reverses roughly half of the
May decline in sentiment, the index still stands approximately
8 points below its recent peak in December. A less favorable
outlook for future conditions more than accounts for the index's
deterioration in the first half of this year. The Conference
Board's index of consumer sentiment fell a bit further in June and
is also well below its level at the end of last year.
Housing Markets
Housing activity has picked up moderately following the
weakness of the first quarter. During April and May, starts and
sales of new homes averaged about 5 to 10 percent above their first-
quarter levels.

II-17
PRIVATE HOUSING ACTIVITY(Millions of units; seasonally adjusted annual rates)
1992 1992 1993 1993
Annual Q 3r Q4r Q1 r Mar. Apr.r May p
All unitsStarts 1.20 1.18 1.25 1.16 1.12 1.22 1.24Permits 1.11 1.10 1.16 1.11 1.03 1.10 1.11
Single-family units
Starts 1.03 1.02 1.10 1.03 .99 1.07 1.09Permits .92 .90 .99 .93 .87 .93 .91
SalesNew homes .61 .64 .64 .60 .60 .72 .57Existing homes 3.52 3.37 3.87 3.54 3.37 3.45 3.61
Multifamily unitsStarts .17 .17 .15 .13 .14 .15 .15Permits .19 .20 .17 .18 .16 .18 .20
p Preliminary. r Revised estimates.
PRIVATE HOUSING STARTS(Seasonally adjusted annual rate)
Millions of units
1986 1988 19901982 1984 1992

Millions of units(annual rate)
11-18
CONSUMER HOMEBUYING ATTITUDES 1
(Seasonally adjusted).
Consumer homebuying attitudes (right scale)
Diffusion index
P< AJunle fp)
May
scale)
20
1987 1988 1989 1990 1991 1992 19931 The homebuying attitudes index is calculated by the Survey Research Center (University of Michigan) as the proportion of respondents
rating current conditions as good minus the proportion rating such conditions as bad.
MBA INDEXES OF MORTGAGE LOAN APPLICATIONSPurchase Index
Weekly
March 16, 1990- 100
AJ June i_-' \* I
Seasonally adjusted 1
I'
Not seasonally adjusted
1990 1991 1992 1993
1. Seasonally adjusted by Federal Reserve Board Staff
Millions of units(annual rate)
BUILDERS' RATING OF NEW HOME SALES1
(Seasonally adjusted)Diffusion index
Builders' rating of new home sales (right scale)
June (p)
May
- 40Single-lamity starts (left scale)
I 1 I1987 1988 1989 1990 1991 1992 1993
1 The index is calculated from National Association of Homebuilders data as the proportion of respondents rating current sales as goodto excellent minus the proportion rating them as poor.
· ·
_I IF
1.3 -

II-19
The single-family sector has been responsible for the recent
gains. The lowest mortgage interest rates in twenty years and the
sluggishness of house prices over the past several years have
combined to make home purchase more affordable on a cash-flow basis
than at any time since the early 1970s. Despite improving
affordability, temporary factors kept both builders and their
customers from the market in the first quarter. Abnormally bad
weather, especially in March, delayed some projects and sales, and
the sharp spike in lumber prices--since reversed--probably disrupted
activity to a degree. With these temporary factors abating during
the spring, single-family starts have rebounded moderately.
New home sales in April jumped to their highest level in nearly
four years, but retraced the gain in May. The April-May average of
647,000 units at an annual rate was an improvement from the first
quarter, but was on the soft side relative to starts. As measured
by constant-quality price indexes, the year-to-year rise in house
prices was less than 1 percent as of the first quarter, but recent
monthly data on transactions prices for new homes show larger year-
to-year increases; as usual, price trends vary greatly from city to
city.
No big changes in housing activity are evident in the scattered
June indicators now in hand. Home builders surveyed early this
month assessed current sales slightly less positively than they had
a month earlier. However, consumer attitudes toward home purchase
improved early this month according to the Michigan Survey, and
mortgage applications for home purchase have increased in the two
most recent weekly reports (chart).
Despite the recent pickup in starts, real residential
investment expenditures probably were flat in the second quarter.
Expenditures typically peak two to three months after the start of

I-20
FUNDAMENTAL DETERMINANTS OF BUSINESS FIXED INVESTMENT
ACCELERATION OF BUSINESS OUTPUTChange in four-quarter growth rate
1963 1968 1973 1978 1983 1988.
GROWTH IN REAL DOMESTIC CORPORATE CASH FLOWFour-quarter percent change
1963 1968 1973 1978 1983 1988
GROWTH IN THE COST OF CAPITAL
1993
Four-quarter percent change
1973 1978 1983
1993
1963 1968 1988 1993

II-21
construction, and much of the spending associated with April and May
starts will not occur until the third quarter.
Construction of multifamily housing remains at its lowest level
since the 1950s. These structures--most of which are intended for
rental use--now account for only about 5 percent of total
residential investment expenditures, compared with a figure of
15 percent in the mid-1980s. Despite the low production of the past
several years, vacancy rates and rents in most local markets have
not yet shown clear signs of tightening.
Business Fixed Investment
Revised data show that real outlays for producers' durable
equipment advanced at an annual rate of 18-1/4 percent in the first
quarter, and despite some unevenness in the recent orders and
shipments data, a further strong advance in equipment spending
appears to be in train in the second quarter. Shipments of
nondefense capital goods excluding aircraft and computers were up
1-1/2 percent in May after a decline of 3 percent in April; their
average level for April and May combined was about 1 percent above
the first-quarter average (not at an annual rate). From a longer-
term perspective, these shipments have been on an uptrend since
early last year, reflecting widespread advances for various types of
machinery, electrical equipment, and communications equipment
(chart). Business purchases of motor vehicles also have been
trending up in recent quarters, and in the quarter just completed
greater purchases of both light vehicles and heavy trucks appear to
have contributed to gains in overall equipment spending.
Shipments of computing equipment, which surged 10 percent in
the first quarter, declined sharply in April and retraced only a
small part of the lost ground in May. This retrenchment may stem

II-22
BUSINESS CAPITAL SPENDING INDICATORS(Percent change from preceding comparable period;
based on seasonally adjusted data, in current dollars)
1992 1993 1993
Q3 Q4 Q1 Mar. Apr. May
Producers' durable equipment
Shipments of nondefense capital goods .7 3.4 1.1 4.6 -3.8 1.2Excluding aircraft and parts 3.0 2.6 3.3 4.4 -3.8 1.3
Office and computing 1.0 .6 10.1 6.3 -7.1 1.0All other categories 3.5 3.1 1.5 3.9 -2.8 1.4
Shipments of complete aircraft1 -25.8 4.6 21.3 38.0 -15.3 n.a.
Sales of heavy weight trucks 2.0 6.8 3.1 7.0 4.1 -.2
Orders of nondefense capital goods -4.0 6.8 .7 -10.9 3.7 -1.1Excluding aircraft and parts 2.1 4.2 4.4 1.0 .4 -2.4
Office and computing 2.5 2.6 9.0 -4.8 -2.5 6.5All other categories 1.9 4.6 3.1 2.8 1.2 -4.8
Nonresidential structures
Construction put-in-place -3.7 .9 1.9 -1.2 .5 n.a.Office -11.2 -2.1 -4.2 -6.2 2.3 n.a.Other commercial -2.0 5.2 3.8 -3.6 1.9 n.a.Industrial -8.2 -1.8 1.6 -.6 -4.1 n.a.Public utilities -2.1 3.2 5.7 .3 -1.3 n.a.All other .9 -1.8 -.9 1.3 3.6 n.a.
Rotary drilling rigs in use 2.6 14.5 -8.2 -8.8 1.9 2.6
Footage drilled2 -2.4 9.7 3.3 -26.9 -5.0 22.4
Memo:Business fixed investment 3 3.1 9.7 13.1 n.a. n.a. n.a.
Producers' durable equipment3 9.5 14.5 18.3 n.a. n.a. n.a.Nonresidential structures 3 -11.3 -1.9 .0 n.a. n.a. n.a.
1. From the Current Industrial Report "Civil Aircraft and Aircraft Engines."Monthly data are seasonally adjusted using FRB seasonal factors constrained toBEA quarterly seasonal factors. Quarterly data are seasonally adjusted usingBEA seasonal factors.2. From Department of Energy.3. Based on constant-dollar data; percent change, annual rate.n.a. Not available.

II-23
SHIPMENTS OF SELECTED COMPONENTS OF NONDEFENSE CAPITAL GOODS(Millions of dollars)
Ratio scale13000
May
Machinery
10000
9000
8000
7000
MaY 6000
Computing Equipment Ma 6 0 0 0
5000
4000
May
Commut 3000Communications Equipment^ A
1987 1988
2000
17001992 1993

II-24
NONRESIDENTIAL CONSTRUCTION AND SELECTED INDICATORS*(Index, Dec. 1982 - 100, ratio scale)
Total Building
Construction------- Permits, Contracts, or
New commitments
1980 1982 1984 1986 1988 1990 1992
Office Other Commercial
1984 1986 1988 1990 1992
Incastrial
1984 1986 1988 1990 1992
Institutional
1984 1986 1988 1990 1992
*Six-month moving average for all series shown. For contracts, individual sectors include private & public buildings. All other include private only.New commitments are te sum of permits and contracts.
1984 1986 1988 1990 1992

II-25
from weakness abroad.1 A number of companies have reported that
demand from Europe, especially Germany, has dropped. By contrast,
industry contacts say that domestic demand still is expanding, and
imports of computing equipment continued to advance at a strong pace
through April.
The upward trajectory in equipment spending over the past year
and a half is a reflection of fundamental improvement in the
economic and financial condition of the business sector. Business
output, profits, and cash flow have increased, and the cost of
capital has declined sharply. Although some of these fundamental
indicators have turned less favorable recently (chart), the overall
situation in the business sector still seems to be conducive to
increased investment. Business profits and cash flow remained well
above year-earlier levels in the first quarter of 1993, and the cost
of capital has continued to decline at a rapid pace, reflecting, in
part, a downtrend in the prices of computers. Moreover, much-
discussed concerns about future increases in mandated labor costs
may be encouraging some firms to undertake labor-saving
investments. By contrast, the accelerator mechanism, which links
investment to changes in the rate of growth of business output,
appears now to be at best a neutral force.
Outlays for nonresidential structures, which plummeted in 1991
and fell 3 percent further in 1992, were about unchanged in the
first quarter of this year. Among components of nonresidential
structures spending, recent performance has been mixed.
Expenditures for the "other commercial" component, which includes
buildings purchased by wholesalers and retailers, has firmed in
1. Exports are very important in the computing equipmentindustry: in 1992, the export share for this industry (that is, theproportion of its shipments that were exported) averaged more than39 percent, compared with an export share for manufacturing as awhole of about 14 percent.

II-26
INDICATORS OF THE MARKET FOR OFFICE SPACE
NOMINAL OFFICE PROPERTY VALUESU.S. total, Russell-NCREIF capital index, not seasonally adjusted Index = 100 in 83:1
1980 1981 1982 1983 1984 1985 1986 1987 1988Ii i 50
1989 1990 1991 1992 1993
EFFECTIVE NOMINAL RENTAL INCOME FOR U.S. OFFICE PROPERTIESU.S. total, calculated from Russell-NCRElF data, seasonally adjusted Index . 100 in 83:1
S I 1 I I I 1 1--- I - I 150
1980 1981 1982 1983 1984 1985 1986 1987 1988 1989 1990 1991 1992 1993
CB COMMERCIAL OFFICE VACANCY RATEU.S. total, downtown market, not seasonally adjusted Percent
I I I I i I I I19921982 1984 1986 1988 1990

II-27
recent quarters, and spending for the utilities component has picked
up. Outlays for industrial construction were little changed in the
first quarter, after trending sharply lower over the previous two
years; however, new commitments for industrial structures have
continued to weaken.
The indicators of conditions in the office sector remain
predominantly negative. Construction expenditures for offices have
continued to decline in 1993, and permits have slumped, reversing
the small gains that were briefly evident in the latter part of
1992. Both the Russell-NCREIF property index, a measure of the
appraised values of income-producing properties, and the National
Real Estate Index (NREI), which measures transactions prices but
includes only downtown areas, indicate that the prices of office
buildings were still falling early this year. A measure of rental
income from these properties, calculated from the Russell-NCREIF
series, turned up in the first quarter, but that measure has been
PRICES OF OFFICE BUILDINGS ACCORDING TO THENATIONAL REAL ESTATE INDEX
(Percent change, national average)
1992 19931990 1991 1992 Q4 Q1
Office buildings -4.1 -7.5 -10.4 -8.0 -18.0
Note: The NREI office price index refers only to downtown areas.Annual changes are from fourth quarter to fourth quarter; quarterlychanges are at annual rates.
volatile in recent quarters, and the rise may not be a reliable
signal. The national vacancy rate for office buildings, according
to CB Commercial (formerly Coldwell Banker), was 18.3 percent in
March. only a slight decline from the average reading of about
19 percent during the previous couple of years. Improvement in
suburban areas more than accounts for the downturn in the national
vacancy rate from its late 1992 peak; the vacancy rate in downtown

II-28
CHANGES IN MANUFACTURING AND TRADE INVENTORIES(Billions of dollars at annual rates;based on seasonally adjusted data)
1992 1993 1993
Q3 Q4 Q1 Mar. Apr. May
Current-cost basis
Total 16.9 20.4 39.9 46.5 14.4 n.a.Excluding auto dealers 19.7 11.7 20.6 27.1 11.7 n.a.Manufacturing 4.4 -19.1 1.2 -2.3 9.2 13.3
Defense aircraft -7.7 -2.0 -4.4 -4.7 -2.0 2.2Nondefense aircraft 2.1 -2.8 .0 -.8 -4.3 .4Excluding aircraft 10.0 -14.3 5.6 3.2 15.5 10.8
Wholesale 3.3 16.5 5.1 8.9 -3.0 n.a.Retail 9.3 23.1 33.6 40.0 8.2 n.a.
Automotive -2.8 8.7 19.3 19.5 2.7 n.a.Excluding auto dealers 12.1 14.4 14.3 20.6 5.5 n.a.
Constant-dollar basis
Total 10.1 7.1 22.4 38.8 -.9 n.a.Excluding auto dealers 8.5 5.0 5.6 17.0 .3 n.a.Manufacturing 3.9 -14.5 1.8 6.2 6.2 n.a.Wholesale -3.5 9.6 -4.1 -1.3 -4.8 n.a.Retail 9.7 12.0 24.7 33.9 -2.3 n.a.Automotive 1.6 2.1 16.8 21.8 -1.2 n.a.Excluding auto dealers 8.1 9.9 7.9 12.1 -1.1 n.a.
INVENTORIES RELATIVE TO SALES1
(Months supply; based on seasonally adjusted data)
1992 1993 1993
Q3 Q4 Q1 Mar. Apr. May
Current-cost basis
Total 1.50 1.48 1.47 1.47 1.48 n.a.Excluding auto dealers 1.48 1.46 1.4 11.44 1.45 n.a.Manufacturing 1.57 1.52 1.48 1.47 1.49 1.50
Defense aircraft 5.26 5.21 5.07 5.04 5.12 5.28Nondefense aircraft 5.10 4.66 5.08 5.00 5.13 5.08Excluding aircraft 1.41 1.37 1.34 1.32 1.35 1.36
Wholesale 1.34 1.35 1.33 1.34 1.34 n.a.Retail 1.56 1.55 1.60 1.61 1.59 n.a.
Automotive 1.89 1.85 1.99 2.00 1.96 n.a.Excluding auto dealers 1.48 1.47 1.49 1.51 1.49 n.a.
Constant-dollar basis
Total 1.59 1.57 1.55 1.56 1.57 n.a.
Excluding auto dealers 1.56 1.54 1.52 1.52 1.53 n.a.
Manufacturing 1.68 1.63 1.59 1.57 1.61 n.a.
Wholesale 1.39 1.41 1.38 1.39 1.40 n.a.
Retail 1.64 1.62 1.66 1.68 1.66 n.a.
Automotive 2.00 1.93 2.06 2.08 2.05 n.a.Excluding auto dealers 1.54 1.53 1.55 1.57 1.55 n.a.
1. Ratio of end of period inventories to average monthly sales for the period.

II-29
markets trended up through the end of last year and declined only
slightly during the first quarter of this year.
Business Inventories
Business inventory accumulation slowed considerably in April,
with manufacturing and trade stocks rising at about a
$14-1/2 billion annual rate (current cost), after runups in February
and March that averaged about $50 billion at an annual rate.
Inventory change in manufacturing picked up a bit in May, in
current-cost terms. Inventory-sales ratios generally showed little
evidence of imbalances through early spring. However, a notable
exception was the non-auto retail sector, where stocks may have been
a bit excessive in the early part of the second quarter. Some of
that accumulation could well be attributable to the surge in imports
in March and April.
In manufacturing, the average rate of accumulation in April and
May amounted to $11-1/4 billion in current-cost terms, after only a
small increase in the first quarter. Excluding the aircraft
industry, in which production has been retrenching and inventories
declining for more than a year. factory inventory accumulation
picked up to a $13-1/4 billion pace in April and May, compared with
an average of $5-1/2 billion in the first quarter. Most of the rise
in manufacturers' stocks over the past two months has consisted of
finished goods and materials and supplies. By contrast, work-in-
process inventories fell substantially in March and April and were
unchanged in May. The inventory-sales ratio in manufacturing edged
up in April and May, but remains below the level in late 1992.
Inventory data for wholesale and retail trade are available
only through April. Although retail sales rebounded in April from
the effects of the March storms, inventory-sales ratios for several
types of retail establishments remained higher at the end of April

II-30
RATIO OF INVENTORIES TO SALES(Current-cost data)
Ratio
1979 1981 1983 1985 1987 1989 1991 1993
Ratio
1979 1981 1983 1985 1987 1989 1991 1993
Ratio Ratio
2.05
1.85
1.65
1.45
1.25
1.5
1.4
1.3
1.2
1.1
1.7
1.6
1.5
1.4
1979 1981 1983 1985 1987 1989 1991 1993

II-31
than they had been at the end of February, and at some types of
stores, end-of-April stocks may have been higher than desired. Most
notably, the April ratio for GAF grouping of stores remained near
the high end of the range of the past two years (chart, lower
panel) 2
Wholesale inventories appear to have been more in line with
sales at the end of April (chart, middle panel). Stocks of
machinery, by far the largest wholesale category, were pared sharply
in April, but weak machinery shipments kept the stock-sales ratio
high. Inventory-sales ratios for most other categories of wholesale
distributors were well within their recent ranges.
Federal Sector
Treasury data for the period from October to May show a
somewhat smaller deficit for the current fiscal year than during the
same part of the previous fiscal year. However, after adjustment
for deposit insurance (DI) and the defense cooperation account
(DCA), the deficit thus far this fiscal year, at about $230 billion,
is little different from that of last year.
Federal receipts through May amounted to $730 billion,
5-1/4 percent higher than a year ago. Receipts through May were
boosted by large increases in corporate tax payments, reflecting
strong corporate profits. However, net receipts from personal
income and social insurance taxes have grown only slightly.
Daily Treasury statements through June 28 show continued
strength in corporate tax receipts. By contrast, the daily data
show receipts from the second quarterly installment of estimated
individual income taxes for 1993 to be down somewhat from the
2. GAF stores are outlets for general merchandise, apparel,furniture, and appliances, including mail-order sales. In additionto the discretionary nature of purchases at these stores, the GAFstores are important also because of their relative size. As agroup they account for about one-third of total retail inventories.and one-fourth of retail sales.

II-32
FEDERAL GOVERNMENT OUTLAYS AND RECEIPTS(Unified basis, billions of dollars, except where otherwise noted)
April-May1992
April-May1993
Fiscal year to date
Dollar PercentFY1992 FY1993 change change
OutlaysDeposit insurance (DI)Defense Cooperation
account (DCA)
Outlays excluding DI and DCANational defenseNet interestSocial securityMedicare and healthIncome securityOther
ReceiptsPersonal income and socialinsurance taxesWithheldNonwithheldRefunds
corporate income taxesOther
Deficit(+)Excluding DI and DCI
232.7 2312.0 -4
-.8
231.649.033.648.134.335.631.0
925.8 942.0 16.2 1.87.9 -18.5 -26.4 nam.
.0 -5.2
236.747.734.050.738.236.329.8
200.5 202.9
121.273.438.916.928.0
127.760.936.920.231.1
32.2 28.931.0 33.8
923.1200.3134.4187.9135.0136.4129.2
.0 5.1
960.6193.7133.3199.2148.7145.4140.2
694.3 730.3
513.2114.0
75.555.287.4
534.5113.9
69.263.487.7
231.5 211.7228.8 230.2
37.5-6.5-1.111.413.79.0
11.1
n.a.
4.1-3.2-0.86.0
10.26.68.6
36.1 5.2
21.3-0.1-6.38.20.4
4.2-0.1-8.314.90.4
-19.8 -8.61.4 0.6
Details may not add to totals due to rounding.n.m. - not meaningful
STATE AND LOCAL GOVERNMENTCONSTRUCTION PUT-IN-PLACE
Billions of 1987 dollars
STATE AND LOCAL GOVERNMENTEMPLOYMENT
Millions of persons
1988 1989 1990 1991 1992 1993 1988 1989 1990 1991 1992 1993

II1-33
comparable June 1992 total. The slight weakness in the June data on
estimated tax payments by individuals does not help to resolve
uncertainty about the trend in individual tax liability. Strong
estimated tax collections in January had lead to speculation that
taxpayers had shifted a substantial portion of their 1993 liability
to 1992. in order to avoid the higher individual tax rates
anticipated for 1993. But weak estimated tax collections in April
suggested that the January increase may have reflected instead new
rules that require many taxpayers to meet more of their tax
liability through either withholding or estimated tax payments. The
slight weakness in the June estimated tax payments could be
consistent with either hypothesis.
Outlays for the current fiscal year through May were
$942 billion, about 2 percent higher than last year. Adjusting for
DI and DCA, outlays are 4 percent higher than last year. A surge in
defense outlays in April was largely reversed in May. Defense
outlays had dropped sharply in the first quarter of 1993, to a level
below the trend implied by scheduled defense cutbacks; outlays in
April and May remained below that trend, at a level only slightly
above their average for the first quarter. Expenditures for health,
which slowed during the first few months of the current fiscal year,
have recently picked up, but the increase is within the range of
normal variability and not necessarily a signal of a return to the
high growth rates that had prevailed until this year.
The Congress continues to work on future budgets. Both the
House and the Senate have approved bills consistent with the deficit
reduction objective of the President's plan, $500 billion over five
years. Both the House and Senate rejected the proposed investment
tax credits. But each would allow small businesses to write off
more equipment purchases than are currently allowed, and each would
II-34
increase the top tax rate on corporations to 35 percent, 1 percent
less than the rate in the President's proposal. The House bill made
the President's proposed increases in income taxes retroactive to
the beginning of 1993, but the Senate bill reduces this
retroactivity by making the increase in 1993 rates only half as
large as the President's proposal. The Senate also eliminated the
proposed "empowerment zones" and small-business capital-gains
relief, extended the 10 percent "millionaire's" surtax to capital
gains income, and rejected the proposed Btu tax in favor of a tax on
transportation fuels of 4.3 cents per gallon. The Senate bill makes
up for revenue-decreasing items relative to the House bill by
shortening extensions of business investment incentives such as the
R&E credit, deepening Medicare cuts, and scaling back food stamps
and the earned income tax credit.
State and Local Government Sector
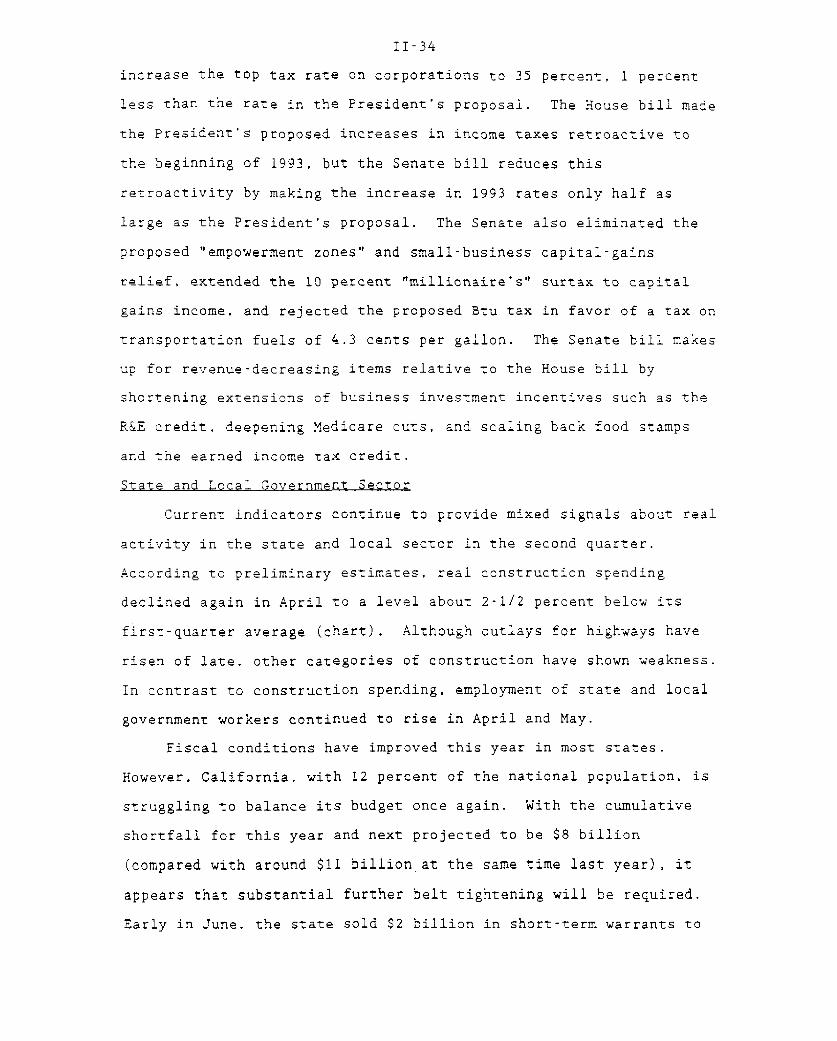
Current indicators continue to provide mixed signals about real
activity in the state and local sector in the second quarter.
According to preliminary estimates, real construction spending
declined again in April to a level about 2-1/2 percent below its
first-quarter average (chart). Although outlays for highways have
risen of late, other categories of construction have shown weakness.
In contrast to construction spending, employment of state and local
government workers continued to rise in April and May.
Fiscal conditions have improved this year in most states.
However, California, with 12 percent of the national population, is
struggling to balance its budget once again. With the cumulative
shortfall for this year and next projected to be $8 billion
(compared with around $11 billion at the same time last year), it
appears that substantial further belt tightening will be required.
Early in June, the state sold $2 billion in short-term warrants to

II-35
tide it over until the budget is passed and to avoid another round
of IOUs, such as those that were issued last year to pay state
bills. The state legislature recently passed a budget that included
a six-month extension of the 1/2 cent temporary sales tax, initiated
two years ago, a shift of $2.6 billion in property tax receipts to
the state treasury, and reductions in funding for welfare and higher
education. Pressures to balance the budget also have intensified in
Maine and Oregon.
Prices
The consumer price index rose 0.1 percent in May, after an
increase of 0.4 percent in April. For items other than food and
energy. the CPI was up 0.2 percent last month. The twelve-month
change in this measure of the "core" rate of inflation was
3.4 percent in May, down from 3.8 percent in the year-earlier
period. However, the twelve-month change has remained in the
neighborhood of 3-1/2 percent since August of last year.
The pattern of price change within the past year actually shows
some acceleration. After rising at an annual rate of 3.1 percent
during the second half of 1992. the core CPI excluding food and
energy moved up at an annual pace of 4.1 percent during the first
five months of 1993. Increases in services prices picked up to a
rate of 4.4 percent in the first five months of 1993, from a rate of
3.8 percent in the second half of last year. The prices of
commodities other than food and energy accelerated from a
1.7 percent rate to one of 3.4 percent.
Whether these intra-year patterns of price change are a
reliable guide to changes in the inflation trend is open to
question, partly because of the difficulties of removing "normal"
seasonal influences from the data. During the past several years,
price increases during the early part of the year have tended to

II-36
RECENT CHANGES IN CONSUMER PRICES(Percent change; based on seasonally adjusted data) 1
Relative 1992 1993 1993importance,Dec. 1992 1991 1992 Q3 Q4 Q1 Apr. May
----- Annual rate------ -Monthly rate-
All items2 100.0 3.1 2.9 2.6 3.2 4.0 .4 .1Food 15.8 1.9 1.5 3.2 1.4 2.6 .4 .4Energy 7.3 -7.4 2.0 1.2 1.9 3.1 .2 -1.0All items less food
and energy 76.9 4.4 3.3 2.5 3.8 4.3 .4 .2Commodities 24.7 4.0 2.5 1.8 1.5 4.6 .3 .0Services 52.2 4.6 3.7 2.9 4.7 4.4 .4 .3
Memo:CPI-W 3 100.0 2.8 2.9 2.3 3.2 4.1 .4 .1
1. Changes are from final month of preceding period to final month of period indicated.2. Official index for all urban consumers.3. Index for urban wage earners and clerical workers.
RECENT CHANGES IN PRODUCER PRICES(Percent change; based on seasonally adjusted data)1
Relative 1992 1993 1993importance, -
Dec. 1992 1991 1992 Q3 Q4 Q1 Apr. May
----- Annual rate------ -Monthly rate-
Finished goods 100.0 -.1 1.6 1.3 -.3 3.9 .6 .0Consumer foods 22.4 -1.5 1.6 4.3 3.3 -2.2 1.4 -.1Consumer energy 13.9 -9.6 -.3 -3.5 -10.2 17.2 .1 -.6Other finished goods 63.7 3.1 2.0 1.2 1.2 3.0 .4 .2
Consumer goods 40.6 3.4 2.1 1.5 1.2 2.9 .4 .2Capital equipment 23.1 2.5 1.7 1.2 .6 3.4 .2 .2
Intermediate materials2 95.4 -2.7 1.1 .7 -2.1 5.3 .1 -.2Excluding food and energy 81.8 -.8 1.2 1.3 -.3 4.3 .2 -.2
Crude food materials 41.2 -5.8 3.0 -4.8 5.1 1.1 2.5 .5Crude energy 39.5 -16.6 2.3 19.8 -17.8 -9.7 -.6 4.8Other crude materials 19.3 -7.6 5.7 2.2 1.9 25.0 1.8 .4
1. Changes are from final month of preceding period to final month of period indicated.2. Excludes materials for food manufacturing and animal feeds.

II-37
INFLATION RATES EXCLUDING FOOD AND ENERGY
Percent change from twelve monthsearlier
May May May1991 1992 1993
CPI 5.1 3.8 3.4
Goods 4.1 3.0 2.3
Alcoholic beverages 10.7 3.3 1.4New vehicles 4.0 2.6 2.5Used cars .1 3.0 9.1Apparel 3.0 2.8 1.2House furnishings 1.3 1.0 .1Housekeeping supplies 3.2 .4 1.4Entertainment 3.6 2.4 1.4Medical commodities 8.1 7.0 3.5
Services 5.5 4.2 4.0
Owners' equivalent rent 4.3 3.5 3.3Tenants' rent 4.0 2.5 2.5Other renters' costs 14.9 6.0 4.1Airline fares 3.3 2.9 13.4Medical care 9.1 7.9 6.9Entertainment 5.6 3.5 2.8Auto financing .8 -11.8 -9.7
PPI finished goods 3.7 2.8 1.7
Consumer goods 3.7 3.5 1.7
Capital equipment excludingcomputers 3.8 2.9 2.4
Computers n.a. -19.4 -14.8
PPI intermediate materials .6 .4 1.5PPI crude materials -5.3 -1.3 9.4
Factors affecting price inflation
ECI hourly compensation 4.4 4.2 3.5Goods-producing 4.4 4.6 4.0Service-producing 4.5 4.0 3.2
Civilian unemployment rate2 6.8 7.4 6.9
Capacity utilization2 77.2 79.1 80.8(manufacturing)
Inflation expections3Mean of responses 4.8 4.2 4.9Median. bias-adjusted4 4.3 4.1 4.7
Non-oil import price 5 2.9 .1 .1Consumer goods, excluding autos.
food, and beverages 1.9 1.8 1.2Autos 4.4 1.1 .5
1. Private industry workers, periods ended in March,2. End-of-period value.3. Michigan Survey one-year ahead expectations. June data.4. Median adjusted for average downward bias of 0.9 percentage
points, relative to actual inflation, since 1978.5. BLS import price index (not seasonally adjusted), periods ended
in March.n.a. Not available.

II-38
PRICE INDEXES FOR COMMODITIES AND MATERIALS1
Percent change 2
Memo:
Last Dec. 92 May 1 1 3 Yearobserv- to to earlier
ation 1991 1992 May 11 date to date
1. PPI for crude materials4
la. Foods and feedslb. Energy1c. Excluding food and energy1d. Excluding food and energy,
seasonally adjusted
2. Commodity Research Bureau2a. Futures prices2b. Industrial spot prices
3. Journal of Commerce industrials3a. Metals
4. Dow-Jones Spot
5. IMF commodity index4
5a. Metals5b. Nonfood agriculture
6. Economist (U.S. dollar index)6a. Industrials
-11.6
-5.8-16.6-7
3.3 5.4 n.a.
3.0 7.2 n.a.2.3 1,5 n.a.5 7 Q A I
May -7.7 6.0 8.1 n.a.
June 29 -6.5 -2.9 3.0 -1.4June 29 -11.3 -.7 -2.6 -1.3
June 29 -7.2 5.0 -1.3 -.8June 29 -7.1 1.9 -3.0 -.4
June 29 -12.1 10.4 -1.2 .3
Apr.Apr.Apr.
.7 -2.6-8.9 -3.11.3 2.4
n.a. n.a.n.a. n.a.n.a. 1. a.
June 22 -9.1 1.6 -1.4 -2.1June 22 -14.9 4.5 -6.4 -. 8
5.0
3.44.79.4
9.5
-2.0-11.0
-3.2-8.2
-9
-3.6-14.25.7
-6.1-10.9
1. Not seasonally adjusted.2. Change is measured to end of period, from3. Week of the May Greenbook.4. Monthly observations. IMF index includes
n.a. Not available
last observation of previous period
items not shown separately.
Index Weights
Energy
PPI for crude materials
CRB futures
CRB industrials
Journal of Commerce index
Dow-Jones
IMF index
Economist
Food Commodities Precious Metals
0 0
41 41 1 18
14 57 14 14
100
12 88
58 17 25
55 45
0 501. Forest products, indusrial metals, and over indusial materials.
Others'U

II-39
exceed rates of increase over the year as a whole, even after
seasonal adjustment by the BLS. In investigating this phenomenon,
the staff has determined that the official seasonally adjusted price
data, in fact, display significant residual seasonality. The CPI is
the aggregate of many subcomponent price series. Among these
components, the BLS does not adjust series that it believes do not
show both stable and statistically significant seasonals. Although
these unadjusted series, considered individually, may not exhibit
significant seasonality, when added together they do. If the price
data are aggregated in a way that adjusts for this apparent residual
seasonality in the unadjusted components, the rate of rise in the
CPI excluding food and energy over the first five months of 1993 is
reduced from the reported 4.1 percent to 3.8 percent, about the same
rate of increase--using these procedures--as in the first five
months of 1992. Thus, price acceleration so far in 1993 may have
been less pronounced than the official data imply. But this
analysis does not suggest that the core CPI currently is on track
for anything better than a repetition of last year's performance--as
opposed to the further slowing that might have been expected in a
slack economy.
The monthly patterns of change in the core CPI were mixed in
May of this year. The price index for goods other than food and
energy was unchanged in May as declines in the prices of apparel and
house furnishings offset higher prices for motor vehicles, tobacco,
and some other items. The drop in apparel prices, which had risen
sharply earlier in the year, reflected larger-than-usual discounting
of spring and summer merchandise, and followed sharp drops in retail
sales at apparel stores. Prices for housefurnishings have recently
reversed sizable hikes earlier in the year. These recent patterns
of price change for apparel and housefurnishings provide some

II-40
COMMODITY PRICE MEASURES *
- Journal of Commerce index, total- - Journal o Commerce index, metals
Ratio scale. index(1980-100)
1993
CRB Spot Industrials
CRB Futures
Ratio scale, index(1967.100)
Jun 29
1983 1984 1985 1986 1987 1988 1989 1990 1991 1992 1993
Weekly data. Tuesdays: Journal of Commerce data monthly before 1985
CRB Future- 212
209
-205
SI 201
Dotted ines indicate week otlast Grerontoot

II-41
support for the notion that consumers are successfully resisting
price increases in markets that remain highly competitive.
Increased competition also is playing a role in the pricing of
tobacco--a category of the CPI that has been rising rapidly for
years. This spring, the major tobacco companies announced
promotional campaigns aimed at fending off the challenge of lower-
priced generic brands. Price cuts were implemented by the companies
in late May and should show up in the June CPI, even though part of
the effect of increased competition will likely be offset by
3increases in state excise taxes.
Prices of nonenergy services were up 0.3 percent last month, as
compared with the rise of 0.4 percent in April. Owners' equivalent
rent was flat in May, after a hefty increase in the previous month.
However, the index for services was boosted by a large May rise in
airline fares. Another round of fare discounting has since been
initiated.
The May rise of 0.1 percent in the overall CPI was held down by
a 1 percent drop in the index for energy, which fell back to its
year-end level. The prices of gasoline and heating oil declined in
May. These prices have been restrained in recent months by heavy
OPEC production and, in the case of gasoline, by ample inventories:
private survey data suggest that seasonally adjusted gasoline prices
fell further in June. In contrast, the CPI for residential natural
gas rose substantially further in May for the third consecutive
month. Although the spot prices for natural gas dropped back in
May, the long-term trend in natural gas prices continues to point
3. For example, New York state increased cigarette taxes by17 cents per pack on June 1. Because New York City alone accountsfor more than 4 percent of the CPI sample, this tax hike is largeenough to have a noticeable effect on the overall CPI for tobacco.Several smaller states are boosting cigarette taxes on July 1.

II-42
Daily Spot and Posted Prices of West Texas Intermediate 1
Dollars per barrel
t di t1
- II . '
Spot
I1%
4
Posted
July Aug Sep Oct Nov Dec Jan Feb Mar Apr May June
1. Posted prices are evaluated as the mean of the range listed in the Wall Street Journal.
MONTHLY AVERAGE PRICES-WEST TEXAS INTERMEDIATE
Year and Month Posted Spot
1292July 20.77 21.76August 20.32 21.35September 20.83 21.90October 20.77 21.69November 19.38 20.34December 18.40 19.41
January 18.01 19.08February 18.92 20.05March 19.20 20.35April 19.24 20.27May 18.91 19.94June' 18,07 19.08
1. Price through June 29.

II-43
upward, reflecting pressure from the shift toward cleaner-burning
fuels.
The CPI for food jumped 0.4 percent in May, the same as the
rise in April, largely because the index for fresh vegetables rose
sharply once again. So far in 1993. food prices have risen at an
annual rate of 3-1/2 percent, twice the rate of rise during 1992.
However, smaller increases appear likely in coming months. The
wholesale prices of fresh vegetables have fallen sharply since early
May. In addition, sharp declines in cattle prices since April
should begin exerting a damping influence on prices at the retail
level before too long. Excluding the two food categories that are
the most volatile--meats and fresh produce--food prices increases
have remained subdued this year, averaging less than 0.2 percent per
month. At the farm level, planting delays have continued to plague
producers in some parts of the country in recent weeks. Soybean
plantings, in particular, remained behind schedule in June, and
soybean prices have moved to a point above the range that had
prevailed over the previous several months. More generally,
however, recent spot and futures prices for farm products do not
seem to be pointing to any major problems in the food price outlook.
The PPI for capital goods rose 0.2 percent in May for the
fourth month in a row; it has risen 1.6 percent over the past year.
During the twelve months ending in May, computer prices dropped
15 percent, and prices of other capital goods continued to
decelerate, rising just 2-1/2, about 1/2 percentage point below the
year-earlier pace. Prices of intermediate materials less food and
energy, which had spurted in the early part of 1993, fell
0.2 percent in May. Some of the rise and subsequent decline in
these prices is attributable to the swing in lumber prices.

II-44
FACTORS INFLUENCING WAGE INFLATION
VACANCY AND UNEMPLOYMENT RATES*Percent Percent
Unemployment rate
1979 1980 1981 1982 1983 1984 1985 1986 1987 1988 1989 1990 1991 1992 1993
*The vacancy rate is the Conference Boards help wanted index divided by total payroll employment
MICHIGAN SURVEY EXPECTED PRICE INFLATION* Twelve-month percent change
1979 1980 1981 1982 1983 1984 1985 1986 1987 1988 1989 1990 1991 1992 1993
Mean expected inflation over the next twelve months.

II-45
Spot prices of industrial materials have dropped back further.
on balance, since the last Greenbook. The Journal of Commerce index
of industrial materials prices has fallen 0.8 percent since the last
Greenbook reflecting declines both for metals and for other
industrial commodities (table). Most other commodity price indexes
also have weakened. The price of gold has fluctuated around a
sideways trend in recent weeks, after rising sharply in April and
early May.
Wages and Labor Productivity
Lower estimated output growth in the first quarter, combined
with upward revisions to employment, led to a downward revision of
first-quarter growth in labor productivity. Output per hour in the
nonfarm business sector is now estimated to have fallen 1.6 percent
at an annual rate in the first quarter, a reduction of
1-1/2 percentage points from the previous estimate. First-quarter
productivity data for the manufacturing sector were not changed
significantly in the revision; they still show an increase in output
per hour of almost 5 percent at an annual rate. With the downward
revision, nonfarm business productivity rose 1.4 percent over the
four quarters ended in the first quarter of 1993; in contrast, the
four-quarter change in manufacturing productivity exceeded
5 percent.
Historical data on productivity and costs also have been
revised since the last Greenbook, but generally by only small
amounts. The BLS's annual benchmark revision to nonfarm payroll
employment left the level of payroll employment on the benchmark
date of March 1992 little changed and had essentially no effect on
productivity estimates over the year preceding the benchmark date.
However, the agency's revision to its bias-adjustment factor boosted
estimates of employment growth from April to December of 1992. and

II-46
LABOR PRODUCTIVITY AND COSTS(Percent change from preceding period at compound annual rate;
based on seasonally adjusted data)
1992 1993 1992-Q1to
1991 1 1992 1 Q2 Q3 Q4 Q1 1993-Q1
Output per hour
Total business 1.4 2.9 .7 3.2 3.4 -1.5 1.4Nonfarm business 1.3 2.8 1.4 2.7 3.2 -1.6 1.4Manufacturing 2.6 5.2 5.3 3.8 7.0 4.8 5.2
Nonfinancial corporations 2 2.3 3.6 2.0 4.4 5.0 -2.4 2.2
Compensation per hour
Total business 4.1 3.5 1.5 3.9 3.8 3.7 3.2Nonfarm business 4.1 3.4 2.0 3.5 3.9 3.3 3.1Manufacturing 4.7 3.0 3.6 3.4 6.3 .7 3.5
Nonfinancial corporations2 3.9 2.5 1.6 3.0 3.1 2.9 2.6
Unit labor costs
Total business 2.7 .5 .8 .7 .5 5.3 1.8Nonfarm business 2.8 .6 .6 .7 .6 5.0 1.7Manufacturing 2.1 -2.0 -1.7 -. 4 -. 6 -3.9 -1.6
Nonfinancial corporations 2 1.5 -1.0 -.4 -1.4 -1.8 5.4 .4
1. Changes are from fourth quarter of preceding year to fourthquarter of year shown.
2. The nonfinancial corporate sector includes all corporations doingbusiness in the United States with the exception of banks, stockand commodity brokers, finance and insurance companies; the sectoraccounts for about two-thirds of business employment.
3. N.A. Not available.
AVERAGE HOURLY EARNINGS(Percentage change; based on seasonally adjusted data)1
1992 1993 1993
1991 1992 Q3 Q4 Q1 Mar. Apr. May
-Annual rate- -Monthly rate-
Total private nonfarm 2.9 2.2 2.3 2.3 3.8 .4 -. 1 .6Finance, insurance
and real estate 4.3 3.5 3.8 -. 3 4.4 . .4 1.7
Total trade 3.0 2.1 3.4 -1.4 4.9 .5 -.1 .6
Services 3.9 2.6 3.1 2.3 3.4 .1 -. 2 .7
1. Annual changes are measured from final quarter of preceding year
to final quarter of year indicated.

II-47
therefore lowered estimated productivity growth commensurately over
that more recent period.4 Reflecting the BLS's corrections to
the historical (1981-1991) data on payroll employment, productivity
growth over the 1980s is now 0.1 percentage point higher than
previously estimated. Finally, the manufacturing data has been
revised to incorporate the gross product originating (GPO) data from
1977 to 1990: the effect of this change generally was to lower
previous estimates of manufacturing productivity.
REVISIONS TO LABOR PRODUCTIVITY AND COSTS(Percent change. Q4/Q4)
1988 1989 1990 1991 1992
Nonfarm Business SectorOutput per hourCurrent .5 -1.4 -.2 1.3 2.8Previous .5 -1.4 .1 1.3 3.1
Compensation per hourCurrent 3.8 3.1 6.0 4.1 3.4Previous 3.8 3.1 6.3 4.2 3.7
ManufacturingOutput per hourCurrent 1.5 -.3 2.1 2.6 5.2Previous 3.2 .0 3.3 2.1 3.5
Compensation per hourCurrent 5.1 3.8 5.3 4.7 3.0Previous 5.0 3.8 5.4 4.4 2.7
The scanty additional data on labor costs that have become
available since the last Greenbook have added to the somewhat
disappointing reports that were already in hand. In the first-
quarter, hourly compensation in the nonfarm business sector
increased 3.3 percent at an annual rate--little changed from the
pace of 3.4 percent recorded in 1992. In addition, in May, average
hourly earnings of production or nonsupervisory workers rose
4. The bias-adjustment factor is used by the BLS to reflectemployment growth in new or small firms that are not adequatelycaptured in the monthly surveys.

II-48
REVISIONS TO LABOR PRODUCTIVITY(All persons; seasonally adjusted)
NONFARM BUSINESS SECTOR$1987 per hour
1981 1983 1985 1987 1989 1991 1993
MAN UFACTURING $1987 per hour
1985 1987 1989
25
24.5
24
23.5
23
22.5
22
21.5
21
20.5
20
19931981 1983 1991

II-49
0.6 percent; this rise boosted the twelve-month change in this
measure to 2.8 percent--up about 1/2 percentage point from the
twelve months ended in May of last year.
The apparent upward tilt in average hourly earnings appears
inconsistent with the degree of slack remaining in labor markets.
The unemployment rate is well above the levels at which upward
pressures on wages began to emerge in the last business cycle, and
other indicators of labor market slack seem to tell a similar story.
For example, a measure of the labor market "vacancy rate," computed
by scaling the Conference Board's help wanted index against total
nonfarm payroll employment, showed only slight improvement as of
April compared with the start of the recovery in the spring of 1991.
Of course, the natural rate of unemployment may have risen,
perhaps as a result of the downsizing of the defense industry and
other structural changes in the economy. Although these
developments likely have had an effect, they probably have not
raised the natural rate from the 5-1/2 to 6 percent range that
seemed to prevail in the late 1980s to 7 percent, the rate during
the recent period when wage and price deceleration apparently
stalled. The economy has undergone substantial structural change
often in the past without producing such large or abrupt increases
in the natural rate.
A partial explanation for the failure of wage growth to
continue decelerating may be the worsening in inflation
expectations. According to recent Michigan Surveys, consumers
expect prices to rise 4.5 percent or more over the coming year, up
noticeably from expectations in the range of 3.5 to 4 percent that
5. The reductions in defense spending after both the Korean warand the Vietnam war were larger and swifter than the currentdecline. Further, an equally disruptive set of shifts was occurringin the early 1980s when exchange rate movements and other forcescaused a major restructuring in manufacturing.

II-50
predominated in the latter part of 1992. If these survey responses
are actually representative of prevailing views, they not only may
help to explain the absence of further wage deceleration but also
may reveal something about the context in which businesses perceive
the risks of losing market share if they post price increases. Of
course, this analysis leaves the increase in inflation expectations
unexplained and thus provides limited insight into prospective
developments.

DOMESTIC FINANCIALDEVELOPMENTS

III-T-1
SELECTED FINANCIAL MARKET QUOTATIONS1
(Percent except as noted)
S 1993FQMC
u__~ 1 o T-_ _ f\n
Change to June 29. 199iFrom From TOMC
Sept. 4 May 18
SHORT-TERM RATES2
Federal funds3
Treasury bills3-month6-month1-year
Commercial paper1-month3-month
Large negotiable CDs1-month3-month6-month
4Eurodollar deposits
1-month3-month
Bank prime rate
INTERMEDIATE- AND LONG-TERM RATES
Treasury (constant maturity)-year
10-year30-year
5Municipal revenue
(Bond Buyer)
Corporate--A utility,recently offered
6Home mortgages
FHLMC 30-yr. fixed rateFHLMC 1-yr. adjustable rate
Dow-Jones IndustrialNYSE CompositeAMEX CompositeNASDAQ (OTC)Wilshire
3554.86251.36440.95708.85
4475.25
3.19
2.922.963.06
3.223.22
3.063.063.11
3.313.31
6.00
4.386.407.29
6.31
8.06
7.845.15
5/27/933/10/936/4/932/4/93
3/10/93
2144.64154.00305.24378.56
2718.59
2.94 3.00
3.01 3.033.11 3.123.26 3.32
3.12 3.213.15 3.26
3.09 3.133.13 3.203.24 3.40
3.00 3.063.13 3.19
6.00 6.00
4.49 4.376.15 5.797.02 6.67
5.90 5.75
7.84 7.48
-. 19
.11
.16
.26
-. 01
.04
.07
.14
.29
-. 25
-,12
.00
-. 01
-. 61
-. 62
- .56
-. 58
-. 12
-. 36
-. 35
-. 15
- .36
7.42 7.34 -. 50 -.084.63 4.59 -.56 -.04
3444.39243.53428.22680.78
4335.06
3518.85249.06433.52701.07
4443.29
1. One-day quotes except as noted.2. Average for two-week reserve maintenance period closest to date shi
average for maintenance period ending May 12. 1993.3. Secondary market.A. Bid rates for Eurodollar deposits at 11 a.m. London time.
Based on one-day Thursday quotes and futures market index changes.2uotes for week ending Friday previous to date shown.
-1.01-. 92
-1.68-1.10-. 71
64.0861.7342.0385.1963.44
2.162.271.242.982.50
own. Last observation is
T c - l bt1992<? .^*» -- /
os rquen ept. 4 May 1 9

Selected Interest Rates*
Percent
1989 1990 1991 1992 1993
Prine Rate
q ---- -
3-morth T-Bil
-,IDismut RaS
5/18 5/27 6&8 &17 621993
1989 1990 1991 1992 1993
* Friday weeks are plotted through Jun 25 statement weeks throughJun 23, 1993.
*" .*...'.... -. -. ..
30-Year T-Bond(Day)
10-Year T-Not(DaiM
5/18 5/27 s 6171993
i| · . l .,.q lj.=....,....., ....*.. J . . *.- --

Domestic Financial Developments
Short-term rates came under considerable upward pressure in
late May, amid reports of the FOMC's adoption of a biased directive,
which would trigger tightening absent any improvement in price
trends. Although short-term rates subsequently fell with the
release of the producer price index report, they have since backed
up some and are slightly higher over the intermeeting period. At
the long end of the market, the concern about monetary tightening
had some adverse effects initially, but interest rates began to
decline in early June; the downward movement gathered momentum on
the price reports, signs of sluggish economic growth, and progress
in maneuvering a deficit-reduction plan through the Congress. Some
longer-term rates have been trimmed as much as 35 basis points since
mid-May, and the thirty-year Treasury rate is at its lowest level
since regular auctions commenced in 1977.
Bouyed by the decline in long-term rates, major stock price
indexes have risen 2-1/4 percent to 3 percent over the past six
weeks, despite early announcements by several major companies
signaling disappointing second-quarter earnings. Prices of
interest-sensitive stocks--utilities, bank holding companies, and
securities firms, in particular--have led the advance.
Overall, debt of nonfinancial businesses, state and local
governments, and households appears to have grown more rapidly over
the past two months than the 4 percent rate estimated for April. In
the business sector, commercial paper of nonfinancial corporations
has increased sharply since April, while loans at banks posted a
large increase in May--after several monthly declines--and appear to
have risen further in June. The strengthening of short- and
intermediate-term business borrowing has come despite fairly strong
III-1

III-2
MONETARY AGGREGATES(Based on seasonally adjusted data except as noted)
1992:Q4 Level1993 1993 1993 1993 1993 to (bil. $)
Aggregate or component 19921 Q12 Q2pe2 Apr. May. Jun.pe Jun.93pe May.93
Percentage change (annual rate)
14.3 6.6 10%1.8 -2.0 2340.3 -3.8 2%
1067.23506.04170.9
Selected components
4. Mi-A
5. Currency6. Demand deposits
7- Other checkable deposits
8. M2 minus M13
9. overnight RPs and Eurodollars,n.s.a.
10. General-purpose and broker-dealer money market funds
11. Commercial banks12. Savings deposits13. Small time deposits14. Thrift institutions15. Savings deposits16. small time deposits
17. M3 minus M23
is. Large time deposits19. At commercial banks'20. At thrift institutions21. Institution-only money market
mutual funds22. Term RPs, n.s.a.23. Term Eurodollars, n.s.a.
13.7 6.2 13 14.4 26.7
9.1 9.4 9%18.0 3.7 16
9.6 10.418.6 41.1
7.3 6% 0.0 29.2
-2.6 -5.5 -I1 -2.9 3.7
1.8
-5.2-0.114.5
-15.8-5.514.8
-21.5
-10.2 -16 -34.4 -47.3
-10.1-2.2
1.6-7.6-9-0-0.2
-19.1
-5.0-1.73.2
-9.1-3-0
2.3-9.0
-6.6 -13.2 2% 11.7
-16.3-15.4-19.6
18.27.9
-22.6
-17.8-18.0-17.5
17.44.3
14-0-10.3
2.89.6
-5.6
7 10% 671.4
11 10 304.03 10% 359.2
6 9 395.8
1 -23 2438.9
35 -10 68.3
3 -33 336.52 -3 1259.49 4% 764.7
-9 -7% 494.7-4 -6 772.1
3 1 429.0-11 -14 343.1
1.4 -16 -6 664.9
-4 9.9 1.0-2% 10.0 4.7-SM £1.:2 -12.9
-14.1 N9.9 28-2.6 32%
-3-0 14.436.4 -5.4-7.2 31-4
-10o 343.6-9% 279.3
-13% 64.4
-8 202.817% 88.014 51.0
Average monthly change (billions of dollars)
Memo
Managed liabilities at com'l.banks (lines 25 + 26)
Large time deposits, grossNondeposit funds
Net due to related foreigninstitutions
Other5
U.S. government deposits atcommercial banks
6
-2.1-4.6
2.5
2.8-0.2
-0.5
-1.0 4-3.6 -12.6 5
7.9 -3.1-0.7 1.28.6 -4.3
2.4 1% 9.2 -5.20.1 33 -0.6 0.9
-0.5 1% 5.4 -5.1
7 . . .
-4 .
11 . . .
10 . . .
S . . .
680.2356.2324.0
83.1240.9
19.1
1. *percentage change" is percentage change in quarterly average from fourth quarter of preceding year tofourth quarter of specified year. 'Average monthly change' is dollar change from December to December,divided by 12-2. 'Percentage change" is percentage change in quarterly average from preceding quarter to specified quarter.
'Average monthly change' is dollar change from the last month of the preceding quarter to the last month ofthe specified quarter, divided by 3.3- Seasonally adjusted as a whole.4. Net of holdings of money market mutual funds, depository institutions, U.S. government, and foreign banks
and official institutions-5. Borrowing from other than commercial banks in the form of federal funds purchased, securities
sold under agreements to repurchase, and other liabilities for borrowed money (including borrowing from theFederal Reserve and unaffiliated foreign banks, loan RPs, and other minor items). Data are partially estimated.6. Treasury demand deposits and note balances at commercial banks.pe Preliminary estimate. n.s.a. Not seasonally adjusted.
i. Ml2- M23. M3
III-3
issuance of bonds and equity, much of which continued to go to debt
refinancing. Boosted by refunding issuance, gross offerings of
long-term municipal bonds were exceptionally heavy in both May and
June. Household net borrowing appears to have risen at a moderate
pace this spring.
The monetary aggregates surged in May, partly owing to
temporary factors, and subsequently slowed again in June. Both M2
and M3 are still well below their annual growth cones.
Monetary Aggregates and Bank Credit
M2 expanded at a 10-3/4 percent annual rate in May--the first
appreciable monthly increase since November--after declining at
nearly a 2 percent rate on average this year through April. The
strength in M2 showed through to M3, which grew at a 9-1/4 percent
rate. Data for June show a considerable slowdown, with M2 growth
estimated at 3 percent and M3 expected to be about flat.
The strength in M2 in May was in liquid deposits. Ml grew at a
27-1/2 percent rate, with the inflows to demand deposits and OCDs
being the largest since last fall. Savings deposits and MMDAs also
grew at a pace not seen since late last year, and money market
mutual funds posted their biggest increase in several years. The
growth in liquid deposits owed partly to a resurgence in mortgage
prepayments in the past couple of months. An added boost in May
came from below-normal nonwithheld tax payments in April that led to
smaller declines in liquid deposits in May than anticipated by
seasonal adjustment factors. These two special factors, however, do
not appear to account entirely for the spurt in liquid deposits in
May, implying that underlying money demand may have strengthened
somewhat.
M2 increased at a substantially reduced rate in June; moreover,
much of June's growth is probably attributable to a further increase

III-4
COMMERCIAL BANK CREDIT AND SHORT- AND INTERMEDIATE-TERM BUSINESS CREDIT1
(Percentage change at annual rate, based on seasonally adjusted data)
Dec. Level,
Type of credit 1991 1992 1993 1993 1993 1993 Mayto Dec. Q4 Q1 Mar. Apr. May 1993
1992 ($ billions)
Commercial bank credit
1. Total loans and securities 3.6 2.7 1.6 5.2 5.0 8.9 2,985.0at banks
2. Securities 13.0 7.1 11.6 21.8 15.8 5.2 873.3
3. U.S. government 17.5 10.6 14.2 24.0 16.2 4.3 694.7
4. Other -1.2 -5.9 2.1 13.8 13.0 10.2 178.7
5. Loans 0.2 1.0 -2.4 -1.5 0.5 10.4 2,111.7
6. Business -3.2 -2.0 -2.0 -5.5 -5.5 7.7 592.7
7. Real estate 2.1 2.4 -2.4 0.4 0.3 7.7 893.7
8. Consumer -1.8 -1.3 6.2 2.0 10.6 8.2 366.9
9. Security 18.2 3.7 -14.8 15.6 -34.6 120.6 66.8
10. Other 1.2 7.3 -14.9 -9.4 15.9 0.0 191.6
Short- and intermediate-term business credit
11. Business loans net of bankers 3.3 3.0 -2.7 -5.7 -6.0 6.6 583.5acceptances
12. Loans at foreign branches2 2.0 11.4 30.0 -34.9 5.1 -10.2 23.3
13. Sum of lines 11 and 12 -3.1 -2.5 -3.9 -7.1 -5.5 6.0 606.8
14. Commercial paper issued by 9.5 16.6 -9.3 -16.1 31.0 17.5 153.3nonfinancial firms
15. Sum of lines 13 and 14 -0.8 1.2 5.0 -8.8 1.8 8.3 760.1
16. Bankers acceptances, U.S. -16.9 -6.8 -10.4 10.8 -10.7 -16.1 22.0
trade-related 3,4
17. Finance company loans to business 4 1. 1.2 -2.5 6.7 5.1 n.a. 306.7
18. Total (sum of lines 15, 16, and 17) -0.5 1.0 -4.4 -4.2 2.4 n.a. 1,083.9
1. Except as noted, levels are averages of Wednesday data and percentage changes arebased on averages of Wednesday data; data are adjusted for breaks caused by reclassifi-cation; changes are measured from preceding period to period indicated.2. Loans to U.S. firms made by foreign branches of domestically chartered banks.3. Acceptances that finance U.S. imports, U.S. exports, and domestic shipment and storageof goods.4. Changes are based on averages of month-end data.
5. April 1993.n.a. Not available.

III-5
in prepayments of mortgage-backed securities and to lingering tax
effects. Renewed underlying weakness accompanied reports of
continued brisk inflows to long-term mutual funds, though probably
not as strong as May's rapid pace.
Bank credit grew at a 9 percent rate in May and appears to have
nearly maintained that pace in June. Unlike earlier months, growth
in May was concentrated in loans rather than securities, though this
pattern may not hold up in June. Among the major components of bank
credit, business loans posted a 7-3/4 percent annual gain in May,
the first positive reading since January, reflecting a turnaround at
large domestic and foreign-related banks. Business loans at small
banks continued to grow in May at roughly the moderate pace seen, on
average, since year-end. Partial data from June point to some
further growth in business loans. Judging from the May Senior Loan
Officer Opinion Survey and spreads on business loans from the May
Survey of Terms of Bank Lending, supply restraints on business
lending appear to have eased further.
Real estate loans, particularly those other than home equity
loans, also have gained strength in the past two months, probably a
reflection of the closings on the large number of refinancings
initiated earlier in the year. The strength also likely reflects
the surge in new-home sales during April, much of the financing for
which probably was not booked until May or June. Bolstering the
case for further growth of real estate loans are recent reports that
some of the larger regional banks have been more aggressively
courting homebuilders for projects to finance, although they remain
focused on highly capitalized builders with proven track records.
Consumer loans grew rapidly in May. Until June, bank
securitizations of credit card loans had been well below the volume
of last year, and thus a large share of their originations had
III-6
remained on their books. Banks, however, have offered a greater
number of asset-backed securities in , ne, and consequently, growth
in consumer loans on bank balance she - has fallen off.
Growth in bank holdings of secur:,ies appears to have picked up
again in June after slowing significantly in May. Results of a
recent survey of 220 banks by Ernst & Young suggested that they plan
to slash investments in fixed-rate mortgage securities in response
to the Financial Accounting Standards Board's new rule on market-
value accounting. The rule, which was formally approved by the FASB
this month, will require banks to value a greater portion of their
securities holdings at market and thereby subject measures of
accounting earnings and book assets to fluctuations in market values
of those securities. To cushion themselves against the resultant
fluctuations in reported capital, surveyed banks plan to cut fixed-
rate mortgage securities held in their investment portfolios from
30 percent to about 20 percent. At the same time, respondents said
they expect to boost the share of adjustable-rate mortgage
securities from about 9 percent to 14 percent. More generally, half
of the surveyed banks--and two-thirds of large banks--said they plan
to shorten durations to reduce potential volatility in their
portfolios. Despite the likelihood of banks restructuring their
portfolios of mortgage-backed securities, market participants have
yet to see any effect on yield spreads. 1
Propelled in part by continued high profitability, both on an
absolute and a return-on-assets basis, equity capital of commercial
banks increased $10 billion (including 6-1/2 billion in retained
1. The market-value accounting rule was developed mainly inresponse to concerns expressed by the SEC about gains trading bybanks and insurance companies. Life insurance companies have alsoindicated that they will shorten the maturities of theirinvestments. Insurance companies invest heavily in medium- andlong-term debt and are concerned about the effect of largefluctuations in reported net worth on policyholder confidence.

III-7
earnings) in the first quarter, to 7.8 percent of total assets, the
highest ratio reported by the industry since 1973. Troubled assets
fell nearly $4 billion to $84 billion in the first quarter, the
lowest level since the second quarter of 1990. The ratio of
reserves to noncurrent loans reached 0.92, the highest level since
banks began reporting noncurrent loans in 1982.
Second-quarter developments largely support the view that bank
balance sheets are in a condition to accommodate future loan demand
by creditworthy borrowers. Spurred by narrow bond spreads, banks
have issued a near-record flow of subordinated debt during the
second quarter. Also, bank holding companies have stepped up
issuance of senior bonds, a move that typically is associated with
increased asset growth. Finally, aside from large offerings by
Citicorp and Chase Manhattan, bank equity issuance has been light
during May and June.
Nonfinancial Business Finance
Net borrowing by nonfinancial corporations appears to have
strengthened in May and June. Commercial and industrial loans
surged in May and have continued to grow in June. Commercial paper
has also grown substantially during the past two months, though some
of the June strength may owe to demands for cash to make unusually
large corporate tax payments. A lull in gross issuance of public
bonds in May likely reflected a falloff in refinancing activity, as
evidenced by the pickup in June after the drop in corporate bond
rates.
May's slowdown in gross public bond issuance by nonfinancial
corporations was concentrated in investment-grade offerings. The
runup in interest rates during May damped interest in new bond
refundings, which have made up more than half of public offerings
this year. Indications in June, however, point to a rebound, as

III-8
GROSS OFFERINGS OF SECURITIES BY U.S. CORPORATIONS(Monthly rates, not seasonally adjusted, billions of dollars)
1992
1991 1992 D1993
Q1 Apr. p Mav Junee
Corporate securities - totalPublic offerings in U.S.
Stocks--totalNonfinancial
UtilityIndustrial
Financial
BondsNonfinancial
UtilityIndustrial
Financial
By qualityAaa and AaA and BaaLess than Baa
No rating (or unknown)Memo items:
Equity-based bondsMortgage-backed bondsOther asset-backedVariable-rate notes
Bonds sold abroad - totalNonfinancialFinancial
Stocks sold abroad - totalNonfinancialFinancial
32.14 40.81 38.33 55.94 43.12 43.51 51.4029.35 38.01 36.12 51.62 39.25 40.70 47.40
5.443.72.42
3.301.72
23.919.522.996.54
14.39
3,12.
1.
6.544.03.87
3.162.51
31.4712.815.337.47
18.67
72 3.7309 14.5003 3.1002 .08
.632.994.07.84
2.331.001.33
.46
.38
.08
.626.074.001.89
2.30.84
1.46
.50
.39
.11
5.843.13.44
2.692.71
30.2910.423.367.06
19.87
3.2611.883.23.16
.686.055.702.47
1.95.63
1.32
.25
.19
.06
8.044.39.63
3.763.66
43.5819.859.1610.7323.73
5.5020.844.92.05
.498.044.232.04
3.79.64
3.15
.53
.37
.16
6.253.67.69
2.982.58
33.0016.508.008.5016.50
3.7817.454.01.03
.334.433.302.35
3.501.801.70
.37
.30
.07
8.705.391.144.253.31
32.0012.605.507.10
19.40
4.8012.663.96.08
.465.435.072.58
2.50.80
1.70
.31
.28
.03
9.404.801.203.604,60
38.0019.008.50
10.5019.00
5.7521.83
4.70.09
1.521.474.16
2.25
3.301.00
2.30
.70
.30
.40
p preliminary.e staff estimate.1. Securities issued in the private placement market are not included.
gross proceeds rather than par value of original discount bonds.2. Excludes equity issues associated with equity-for-equity swaps that
in restructurings. Such swaps totaled $15 billion in 1991.3. Bonds categorized according to Moody's bond ratings, or to Standard
unrated by Moody's. Excludes mortgage-backed and asset-backed bonds.4. Includes bonds convertible into equity and bonds with warrants that
holder to purchase equity in the future.
Total reflects
have occurred
and Poor's if
entitle the

III-9
issuers have taken advantage of falling rates and tighter spreads.
One of these, Ford Motor Company, sold a fifty-year, noncallable
bond at 98 basis points over the thirty-year Treasury bond yield,
the fourth fifty-year bond this year.
In the below-investment-grade sector, spreads have narrowed
substantially since April. New issue yields on B-rated industrial
bonds are now frequently less than 10 percent and, on some BE-rated
bonds, less than 9 percent. In this environment, issuance was
strong in May at about $4 billion and has been robust so far in
June. This year to date, below-investment-grade bond offerings have
totaled $26 billion, which, if continued, would easily surpass the
record issuance of $42 billion set in 1986. Not included in this
figure is another $9 billion of junk bonds issued in the 144A
private placement market, which the issuers either have subsequently
registered or are in the process of registering as public bonds with
the SEC. B-rated firms have accounted for two-thirds of the junk-
grade bonds offered in the public market so far this year, up from
60 percent in 1992 and 36 percent in 1991. Although high this year,
the share of B-rated bonds among below-investment-grade offerings is
still well below the 90 percent share seen from 1987 to 1989.
Fueled by heavy inflows of funds, junk bond mutual funds have been
the principal buyers in both the public and private markets.
Gross public issuance of equity by nonfinancial firms jumped
sharply in May to $5.7 billion, boosted by IBM's $1.1 billion
preferred stock offering. In addition, there were numerous issues
by mid-sized firms in energy-related industries. Initial public
offerings jumped in May to more than $1.5 billion from April's
sluggish pace of $600 million. Issuance by nonfinancial firms fell
off in early June, apparently reflecting a reluctance of firms to
compete for investor interest with the $2.4 billion offering by

III-10
Ratio of Net Interest Payments to Cash FlowPlus Net Interest Payments, Nonfinancial Corporations
(In percent)
Percent-- n 35
S I I I I I I I I I I I I I I I I I I I I
25
20
15
10
5
1972 1974 1976 1978 1980 1982
Note: Cash flow is depreciation (book) plus retained earnings (book).
1984 1986 1988 1990 1992

III-11
Allstate. Nevertheless, at about $5 billion for the month, issuance
remains vigorous.
Cash flow from domestic operations of nonfinancial corporations
declined in the first quarter, as their after-tax profits peaked in
the fourth quarter of 1992. The yearlong climb in profits was
halted by a substantial falloff from the record level of profits
earned in the wholesale and retail trade sector during the fourth
quarter and, more broadly, by an increase in unit labor costs. Also
contributing to the slowdown was a leveling-off of net interest
payments; consequently, the corporate debt service burden, measured
as the ratio of net interest payments over cash flow plus interest
payments, has ticked up (chart). Nonetheless, it stands well below
the levels in 1989 and 1990.
Asset-backed offerings rebounded strongly in May, putting
issuance for the year on a pace close to the record of $49 billion
in 1991. Credit cards and auto loans have been most common in the
asset-backed market lately, and GMAC has been an especially active
issuer of auto-related securities.
Real estate investment trusts have been quite successful in
their equity offerings lately, with nearly $1 billion raised since
the last FOMC meeting. Most of the REITs are based on cash flows of
shopping centers, healthcare facilities, and residential properties;
commercial office space REITs have been conspicuously absent from
the market.
Treasury Financing
The Treasury is estimated to have raised $53 billion in
marketable securities in the second quarter. Somewhat less than
half covers the $22 billion federal deficit, with the remainder used
to build the end-of-quarter cash balance. All of the net marketable
borrowing is expected to be accounted for by coupon auctions.

III-12
TREASURY AND AGENCY FINANCING 1(Total for period; billions of dollars)
1993
Q1 Q2p Apr. May Junep
Treasury financing
Total surplus/deficit (-) -62.4 -22.0 8.1 -37.0 6.9
Means of financing deficit:
Net cash borrowingfrom the public 60.1 60.8 5.5 30.8 24.5
Marketable borrowings/repayments (-) 53.2 53.4 1.8 27.3 24.4
Bills 2.2 -.7 -17.7 15.3 1.7Coupons 51.0 54.2 19.5 12.0 22.7
Nonmarketable 6.9 7.4 3.7 3.6 .1
Decrease in the cashbalance 8.3 -38.6 -18.9 20.2 -39.8
Memo: Cash balanceat end of period 21.6 60.1 40.5 20.3 60.12
Other -6.0 -.3 5.4 14.1 8.4
Federally sponsored creditagencies, net cash
borrowing3 10.5
FHLBs 0.5 -- 2.1FHLMC 11.6 ----
FNMA -0.5 ---
Farm Credit Banks -0.3 -- -0.4 0.3SLMA -0.9 -- --
FAMC .0 -- .0 -
1. Data reported on a not seasonally adjusted, payment basis.2. Includes checks issued less checks paid, accrued items and other
transactions.3. Excludes mortgage pass-through securities issued by FNMA and FHLMC.4. Federal Agricultural Mortgage Corporation.p--projected.Note: Details may not add to totals due to rounding.

III-13
Weekly bill auctions were scaled back in April to $20 billion from
$22 billion in anticipation of tax inflows: since then, the Treasury
has boosted the auctions to $24.4 billion, as nonwithheld tax
payments fell short of expectations.
Since the Treasury's announcement at the May mid-quarter
refunding of its intention to shorten the average maturity of
outstanding debt by eliminating the seven-year note auction and
reducing the thirty-year bond auctions, the size of the monthly two-
year note auction has been increased $750 million, while monthly
five-year note auction sizes have been unchanged. A $15 billion
cash management bill auctioned in mid-May to mature at the end of
September was designed to help smooth the transition to shorter
maturities by making up for the absence of a seven-year note auction
in early July.
Municipal Securities
Gross issuance of long-term municipal bonds has been
exceptionally heavy over the past two months. Bond offerings
jumped in May to nearly $26 billion, the fourth highest monthly
total on record, and the volume in June may have fallen just short
of this figure. The refunding of outstanding debt has continued to
make up the lion's share of long-term issuance, as the advance
refunding of bonds issued between 1988 and 1991 has offered
substantial interest savings at current interest rates. The recent
surge in refunding volume was reported to have been partly prompted
by some issuers' fears of a tightening in monetary policy. 2
2. In addition, the runup in intermediate-term Treasury yieldsbetween May and early June, in conjunction with a slight decrease inlong-term municipal rates, provided an extra incentive to advancerefund outstanding debt. Until the bonds being advance refundedreach their call dates and can be retired, the proceeds from therefunding bonds are invested in Treasury securities. At currentinterest rates, this produces a loss to issuers, because the yieldsearned on intermediate-term Treasury securities are below those paidon longer-term refunding bonds. This so-called negative arbitrage(Footnote continues on next page)

III-14
Because issuance this year has greatly reduced the stock of bonds
likely to be refunded at current bond rates, many municipal bond
dealers expect the pace of refundings to moderate in coming months
unless interest rates drop significantly.
GROSS OFFERINGS OF MUNICIPAL SECURITIES(Monthly rates, not seasonally adjusted, billions of dollars)
1992 1993
1991 1992 Q4 Q1 Apr. May p June
Total offerings 16.68 21.78 19.88 22.67 23.38 27.13 38.00
Total tax-exempt 16.26 21.21 19.34 22.23 23.19 26.21 37.00Long-term 2 12.87 17.93 18.27 21.08 18.66 25.82 25.50Refundings 3.12 7.91 8.34 14.34 13.28 16.43 17.00New capital 9.75 10.02 9.93 6.74 5.38 9.39 8.50
Short-term 3.39 3.28 1.07 1.15 4.53 .39 11.50
Total taxable .42 .57 .54 .44 .19 .92 1.00
p preliminary.f forecast.1. Includes issues for public and private purposes.
2. Includes all refunding bonds, not just advance refundings.
The heavy volume of long-term issuance has been accommodated
without raising tax-exempt bond yields relative to Treasury rates,
in part because investor demand has remained strong in light of the
expected increase in personal income tax rates. Investors have also
recently stepped up bond purchases in advance of the estimated $10
billion to $12 billion of bond redemptions scheduled for July 1.
These redemptions, amounting to about 1 percent of the outstanding
stock of municipal bonds, represent previously refunded bonds now
nearing their first call dates. The redemption of a similar amount
last year caught many investors unprepared, and in the ensuing
(Footnote continued from previous page)
reduces the interest savings from advance refunding outstandingbonds and. on the margin, discourages refinancings. The movement inmunicipal and Treasury rates in May and June, however, reduced the
negative arbitrage.

III-15
scramble to reinvest the proceeds, municipal bond rates dropped
sharply.
California's recently adopted budget for the fiscal year
beginning July 1 has raised two concerns for investors and credit
rating agencies. One concern is the likelihood of projected
revenues covering planned expenditures, as well as providing funds
to retire a portion of the $2.7 billion of debt used to finance
previous deficits. The reasonableness of these projections is
probably crucial to the state's maintenance of its current credit
ratings. The second concern involves the effect of the transfer of
$2.6 billion of property taxes from local governments to the public
school system. Counties, which stand to lose about $2 billion, lack
the diversity of revenue sources to easily recoup the losses. The
state, however, is providing partial relief by earmarking the
revenues from a temporary sales tax surcharge to the counties. A
permanent extension of the surcharge, and thus ongoing relief,
requires voter approval in November. Investors fear that a negative
vote could lead to a significant deterioration in the financial
condition of a number of county governments.
New York City adopted a 1994 budget in June that most analysts
view as relying too heavily upon one-time revenue sources and overly
optimistic revenue projections to balance the budget. Not only are
analysts concerned that the city may be vulnerable to a revenue
shortfall in the 1994 fiscal year but also that insufficient effort
has been made to deal with future budget gaps, which the city
projects to be $6.4 billion over the 1995 to 1997 fiscal years.
Standard & Poor's, which rates the city's long-term bonds at A-, is
reviewing the rating for a possible downgrade. Moody's rates the
city's debt as Baal. Bond dealers report that the new budget had

III-16
little effect on New York City's bond prices, as the outcome had
been anticipated.
Mortgage Markets
Available data on mortgage lending activity in the second
quarter suggest a pickup from the subdued 2-1/2 percent growth in
the first quarter. The Mortgage Bankers Association (MBA) purchase
index, a measure of mortgage loan application volume excluding
refinancing, has been running above its first-quarter range on a
seasonally adjusted basis (chart). In addition, real estate loans
at commercial banks have grown at a seasonally adjusted annual rate
of about 4 percent so far in the second quarter, after declining 2.6
percent in the first quarter.
Commitment rates on thirty-year, fixed-rate mortgages have
decreased about 8 basis points over the intermeeting period and are
at their lowest levels since August 1972. Initial rates on
adjustable rate mortgages indexed to the one-year constant maturity
Treasury are also down slightly over the intermeeting period,
reaching their lowest levels ever. Despite the sizable initial rate
advantage of ARMs, data from the MBA show that ARMS continue to
account for less than 20 percent of loan application volume at
mortgage banking companies.
Although interest rate volatility and mortgage yield spreads
have declined from the levels reached earlier in the year, spreads
have increased slightly in recent weeks. Spreads had widened late
in the first quarter in response to greater uncertainty about
prepayments created by higher levels of volatility (chart).
However, spreads narrowed again as bond yields turned up in late
spring and market sentiment shifted to expect a near-term peak in
mortgage prepayment rates. According to the latest industry data,
prepayment rates in May advanced for the third month in a row with

III-17
MBA Index of Mortgage Loan Applications(Purchase Index)
March 16, 1990 = 100- 180
Weekly June 18
Not seasonally adjusted------ Seasonally adjusted '
I, I' - 150' June 18
-- -- 120
, : ' / -90
S60i
1 I I I I I I I 30
JFMAMJJASONDJFMAMJJASONDJFMAMJJASONDJFMAMJJAS1990 1991 1992 1993
1. Seasonally adjusted by Federal Reserve Board staff.

III-18
Mortgage Yield Spread and Volatility(Weekly)
Percent Basis Points17 10-Year Treasury Note Volatility 2 225
15 - "
June 25
1175
I I IJune 25
I1 1
4 , /, ,, ,
, I , I,
7
Mortgage Yield Spread1
1 l1251989 1990 1991 1992 1993
1, Spread is Freddie Mac primary mortgage market survey rate less 10-year Treasury yield.2. Volatility is the annualized standard deviation of daily percentage changes in yield over previous 60 days.

III-19
the closing of refinancing applications submitted earlier (chart).
Despite the latest increase, however, the May data appear to suggest
that prepayment rates may soon level off.
The increase in prepayment rates since March is expected to
produce a surge in gross issuance of mortgage-backed securities in
June and July. Gross issuance of FRM-backed pass-throughs by the
agencies rose to a seasonally adjusted $37 billion in May, below
January's rapid pace but still exceeding the monthly average pace
for the first quarter as a whole.
Prompted by higher-than-expected FHA and VA mortgage
originations, most likely owing to increases in refinancings,
issuance of Ginnie Mae securities, in particular, has continued at a
rapid pace. As a result, Ginnie Mae already has used roughly
$63 billion of an estimated $78 billion in total commitment
authority for the fiscal year ending September 30, 1993. At its
current monthly pace of about $7.5 billion in gross issuance, Ginnie
Mae will run out of its remaining authority by the end of July, as
the Congress has yet to pass the necessary supplemental
authorization legislation.
According to industry publications, the market for private-
label mortgage securities has outpaced the agency sector in terms of
percentage growth in the past year or so, and recent legal
developments are expected to provide further impetus to growth. Two
recent Supreme Court rulings dealing with secured mortgage lenders'
rights in chapter 13 bankruptcy cases have prompted Moody's to
review its policies on bankruptcy coverage for private-label MBS
deals. In a decision just handed down, the Court ruled that a
3. Legislative changes enacted last fall lowered refinancingcosts under both programs. Changes to the VA mortgage guaranteeprogram lowered the refinancing charge from 1-1/4 percent of theloan amount to 1/2 percent, while FHA borrowers benefited from,among other things, the repeal of the 57 percent limit on theproportion of closing costs that can be financed (imposed in 1991).

III-20
Prepayment Rates on FNMA Mortgage-Backed Securities(Monthly, seasonally adjusted annualized rate)
FNMA 9.0% Coupon MBS
rI
rrrr
rIrIr
I r~
I FNMA 8.5% Coupon MBS
III4I
In1991
1992 1993
Percent- 60
May
' I
'I-1 30
-i 20
I I I I I I I I I I I I I I I I I I I I I I i I I i1991 1992
I
1993

III-21
MORTGAGE-BACKED SECURITY ISSUANCE(Monthly averages, billions of dollars, NSA unless noted)
Pass-through securitiesFederal agency Private Multiclass securities
Total Fixed- ARM- Non- Non- FNMA FHLMC AgencyRate backed agency Total agency REMICs REMICs strips
(SA) (SA) (SA)
1989 r 17.5 14.0 2.8 .7 7.3 .5 3.1 3.2 .31990 r 20.1 17.3 2.2 .6 10.5 1.4 5.1 3.4 .61991 r 23.8 20.3 1.9 1.6 17.9 2.6 8.5 6.0 .91992 r 40.1 34.7 3.2 2.2 30.0 5.3 12.9 11.0 .8
1992-Q2 r 40.0 34.8 3.6 1.6 32.7 5.4 13.9 12.4 .9Q3 r 35.5 29.8 3.4 2.3 35.4 6.1 16.7 11.5 1.1Q4 r 48.4 42.5 3.2 2.8 28.2 4.6 9.9 12.9 .8
1993-Q1 r 39.9 33.3 5.2 1.5 25.3 5.6 10.6 6.8 2.2
1992 Oct. r 48.3 42.4 3.4 2.4 32.7 4.4 14.5 13.5 .3Nov. r 47.5 42.3 3.4 1.8 30.4 5.4 10.7 13.2 1.1Dec. r 49.5 42.6 2.8 4.0 21.5 4.0 4.6 11.9 1.0
1993 Jan. r 50.8 42.0 7.9 .9 18.3 5.9 6.9 5.4 .0Feb. r 39.4 32.6 4.8 2.0 29.4 5.1 10.4 7.5 6.4Mar. r 29.5 25.1 2.7 1.7 28.5 5.9 14.4 7.6 .7Apr. r 37.1 31.9 4.0 1.1 29.2 4.3 10.2 9.9 4.9May p 40.8 36.5 3.7 .6 36.2 4.0 13.8 13.7 4.7
1. Collateralized by adjustable-rate mortgages.2. Collateralized by fixed-rate mortgages.p preliminary. r revised.
June 30, 1993Mortgage & Consumer Finance Section

III-22
lender is entitled to back interest and fees on a home mortgage
involved in a bankruptcy proceeding even though the loan instrument
did not contain explicit language to that effect. In another
ruling, the Court held that chapter 13 of the bankruptcy code does
not allow a debtor to "cram down" a home mortgage into secured and
unsecured portions. In effect, several lower court rulings had in
recent years allowed debtors--usually individuals filing for
bankruptcy--to reduce the principal value of their mortgage holder's
claim to the current (deflated) value of their home. Although the
Court's recent rulings have not resolved whether cramdowns are
permissible under the less frequently used chapter 11 of the
bankruptcy code, Moody's has announced that, in response to the
latest ruling, it likely will cut the bankruptcy premium that it has
required for top ratings on private-label securities backed by home
mortgage collateral. Moody's credit support guidelines have been
the most stringent of the major credit agencies for these
securities, largely owing to its concerns about mortgage
cramdowns.
Consumer Installment Credit
Consumer installment credit grew at a 3-1/2 percent seasonally
adjusted annual rate in April, down a bit from 4-3/4 percent in
March. This marks the sixth consecutive month of growth in the 3
percent to 8 percent range, reflecting both moderate advances in
consumer spending and probably some tapering off of the early
paydowns of loans that restrained growth during much of last year.
While interest rates on consumer loans trended downward over the
three-month period ending May 8, yield spreads against three-year
Treasury notes remained relatively wide (chart).
4. The other major rating agencies have as yet not announcedchanges in their credit support requirements, citing the remaininguncertainty regarding potential cramdowns under chapter 11 of thecode.

III-23
CONSUMER CREDIT(Seasonally adjusted)
Percent change(Annual rate)
LggII 1992 I 1993
S 0 1 r Mar r I Anr-P
Memo:Outstandings(Billions ofdollars)
1993
Anr P
Installment 2.0 -.7 1.0 4.4 5.7 4.7 3.6 754.0Auto -2.7 -8.4 -.5 .3 2.8 2.3 1.9 261.9Revolving 12.1 9.5 4.4 6.1 10.5 7.5 7.5 262.6Other -.8 -1.0 -.8 7.2 3.7 4.4 1.2 229.5
Noninstallment -4.6 -15.1 3.0 18.7 -19.3 -33.7 99.2 53.7
Total 1.5 -1.8 1.2 5.3 4.1 2.3 9.5 807.7
1. Components may not sum to totals because of rounding.r Revised. Reflects annual rebenchmarking and estimation of new seasonal factors.p Preliminary.
CONSUMER INTEREST RATES(Annual percentage rate)
1992 1993
S1990 1991 1992 Nov. Feb. ( Mar. Ap. MayAt commercial banks
New cars (48 mo.) 11.78 11.14 9.29 8.60 8.57 ... .. 8.17Personal (24 mo.) 15.46 15.18 14.04 13.55 13.57 ... ... 13.63Credit cards 18.17 18.23 17.78 17.38 17.26 ... ... 17.15
At auto finance cos.New cars 12.54 12.41 9.93 9.65 10.32 9.95 9.61 ...Used cars 15.99 15.60 13.79 13.37 13.90 13.21 12.74
1. Average of "most common" rate charged for specified type and maturity duringthe first week of the middle month of each quarter.2. For monthly data, rate for all loans of each type made during the month
regardless of maturity.Note: Annual data are averages of quarterly data for commercial bank rates and ofmonthly data for auto finance company rates.
June 22, 1993Mortgage and Consumer Finance
| .......
1QQ7 I

III-24
Spreads between Consumer Loan Rates at Commercial Banks
and Yield on Three Year Treasury Note
Personal
II
'I
'V
1984 1985 1986 1987 1988 1989 1990 1991 1992
Ratio of Household Debt Service to Disposable Personal Income(In Percent)
Percent22
20
Total 418
16
14
~~- --- .- -.- - - -'- N r -
Consumer -1 12
Mortgage
--- " 1993:Q1
- -* - -- -- -- --
,-- 10
SI I tI [11 _II 1 11111111 Ii _I lII Ii 1_JLhrl~lIrII1III;Iill1963 1968 1973 1978 1983 1988 1993
Note: Debt service is a staff extimate of scheduled payments of principal and interest.
Percent
Auto
-e
iL1 1 i f I I I________ 9

III-25
CONSUMER LOAN DELINQUENCY RATES AT COMMERCIAL BANKSPercent
S::::::::::::::::::::: \ All closed-end loans
. . . . .. ..- -1 ..
F i It I il ____ I I I __I___ ilmlmii i51981 1983 1985 1987 1989 1991 1993
SBreak in series between 1986 and 1987Note: Dashed line indicates that series are discontinuous between 1991 and 1992 because of changes in definition and coverage.
Source: American Bankers Association. Loans past due 30 days or more.
HOME MORTGAGE DELINQUENCY RATES AT ALL LENDERS
(Seasonally adjusted, quarterly averages) Percent
2.5
1993:Q1
:: ::::: .:: ... .... 5..-..- ;. .. ......, ,. .. .-°. .÷..%. 15.... .... ....
SCo ve..ntional......... ...... 1
0.5:: "1993:01
1981 1983 1985 1987 1989 1991 1993
Source: Mortgage Bankers Association. Loans past due 60 days or more.

III-26
Despite the growth in consumer credit in the first quarter,
household debt service burdens continued to improve. The ratio of
monthly principal and interest payments to disposable personal
income edged down to its lowest level since early 1986 (chart).5
With the most recent wave of mortgage refinancings, the ratio of
scheduled principal and interest payments on outstanding mortgage
debt slipped to 6.3 percent--a level last recorded in 1987. Most of
the reduction has been in scheduled interest payments, as many
homeowners have refinanced at lower interest rates and adjustable
rate mortgages have repriced downward. The monthly claim on current
income arising from consumer installment debt has also continued to
drop, mainly reflecting the paydown of relatively high-rate loans.
Further evidence of the improvement in consumer balance sheets
were the first-quarter declines in most measures of consumer loan
delinquencies. Delinquencies on closed-end consumer loans at banks
fell 11 basis points to 2.38 percent in the first quarter, according
to data from the American Bankers Association (ABA). The ABA series
for credit card delinquencies dropped 21 basis points in the first
quarter to 2.81 percent (chart). According to data reported by the
Mortgage Bankers Association, home mortgage delinquencies were
little changed in the quarter, remaining at about the lowest rate in
ten years (chart). Call Report data tended to echo these trends for
both consumer and mortgage loans at commercial banks. Finally,
according to the Administrative Office of U.S. Courts, the number of
personal bankruptcy filings decreased in the first quarter, marking
the fourth straight quarterly decline.
5. The level of these data is slightly greater than reportedpreviously, reflecting the general upward revision in the level ofconsumer installment credit in the 1993 benchmark.

INTERNATIONAL DEVELOPMENTS

INTERNATIONAL DEVELOPMENTS
Merchandise Trade
In April, the merchandise trade deficit was $10.5 billion
(seasonally adjusted, Census-basis), the same as recorded in March
but considerably larger than the deficits recorded in January and
February. Data for May will be released July 16.
Imports in April eased back only slightly from the high March
level; declines were recorded in foods, non-oil industrial supplies,
and consumer goods. However, the level of imports in April was 5
percent higher than the first-quarter average; the higher amount was
divided almost equally among oil, capital goods, automotive products
(half from Canada), and consumer goods.
Exports declined slightly in April; most of the decline from
March to April was in machinery and industrial supplies --
categories that had risen in March. Nonetheless, the level of
exports in April was still a bit higher than the first-quarter
average.
For January-April combined, an increase in the value of imports
and a decline in exports widened the deficit to $123 billion at a
U.S. MERCHANDISE TRADE: MONTHLY DATA(Billions of dollars, seasonally adjusted, Census basis)
Exports ImportsTotal Ag. NonAg. Total Oil Non-Oil Balance
1992-Oct 38.9 4.0 34.9 46.1 5.0 41.1 -7.2Nov 37.8 3.7 34.1 45.6 4.6 41.1 -7.8Dec 39.2 3.7 35.5 46.1 4.1 42.0 -7.0
1993-Jan 37.5 3.5 34.0 45.2 4.2 40.9 -7.7Feb 36.9 3.7 33.3 44.8 4.1 40.8 -7.9Mar 38.9 3.6 35.3 49.3 4.5 44.9 -10.5
(Q1 Avg) (37.8) (3.6) (34.2) (46.5) (4.3) (42.2) (-8.7)
Apr 38.4 3.7 34.7 48.9 5.0 43.9 -10.5
Source: U.S. Department of Commerce, Bureau of the Census.

IV-2
MAJOR TRADE CATEGORIES(Billions of dollars, BOP basis, SAAR)
Year 1992 1993 $ Change1992 Q1 _Q2 Q3 04 Jan-Apr J/A-Q1 J/A-Q4
Trade Balance -96.1 -71.1 -99.2 -110.4 -103.8 -123 -52 -19
Total U.S. Exports 440.1 433.4 433.2 438.0 456.0 448 15 -8
Agric. Exports 44.0 43.3 42.6 44.7 45.5 44 1 -2Nonagric. Exports 396.1 390.0 390.6 393.3 410.4 404 14 -6
Industrial Suppl. 101.8 99.6 100.9 102.3 104.5 102 2 -2Gold 4.5 3.8 3.5 3.6 7.2 7 3 0Fuels 13.6 13.6 13.7 13.5 13.4 12 -2 -1Other Ind. Suppl. 83.7 82.2 83.6 85.2 83.8 83 1 -1
Capital Goods 176.9 177.2 175.0 173.3 182.0 179 2 -3Aircraft & Parts 37.7 42.8 37.7 33.4 37.1 34 -9 -3Computers & Parts 28.8 27.5 28.7 28.8 30.0 29 2 -1Other Machinery 110.4 106.9 108.6 111.1 114.9 116 9 1
Automotive Goods 47.1 43.1 46.4 47.8 50.9 52 9 1To Canada 23.8 21.7 23.8 24.2 25.6 27 5 1To Other 23.2 21.4 22.6 23.6 25.4 25 4 0
Consumer Goods 50.4 48.3 49.0 51.0 53.3 51 3 -2Other Nonagric. 20.0 21.8 19.3 19.0 19.7 20 -2 0
Total U.S. Imports 536.3 504.4 532.4 548.4 559.8 571 67 11
Oil Imports 51.6 41.9 52.4 57.2 54.9 53 11 -2Non-Oil Imports 484.7 462.5 480.0 491.2 505.0 518 56 13
Industrial Suppl. 88.6 84.6 88.1 88.3 93.5 95 10 2Gold 3.8 2.3 3.6 2.7 6.7 6 4 -1Other Fuels 4.6 4.1 4.3 5.0 4.7 5 1 0Other Ind. Suppl. 80.3 78.2 80.2 80.6 82.1 84 6 3
Capital Goods 134.2 125.4 131.8 137.8 141.8 144 19 2Aircraft & Parts 12.6 11.8 13.3 12.3 13.0 11 -1 -2Computers & Parts 31,8 28.2 30.8 33.6 34.6 36 8 2Other Machinery 89.8 85.4 87.6 91.9 94.2 97 12 3
Automotive Goods 91.8 89.1 91.2 91.8 95.1 102 13 7From Canada 31.7 31.4 31.6 31.6 32.3 38 7 5From Other 60.1 57.8 59.6 60.2 62.8 64 6 2
Consumer Goods 123.0 117.4 121.3 126.7 126.5 130 13 4Foods 27.9 27.0 28.7 28.1 27.6 27 0 0All Other 19.3 19.0 19.0 18.5 20.6 19 0 2
Source: U.S. Department of Commerce, Bureau of Economic Analysis.

IV-3
seasonally adjusted annual rate (balance of payments basis); this
compares with a fourth-quarter deficit of $104 billion at an annual
rate.
The quantity of imports rose 14 percent at an annual rate in
the first four months of 1993 compared with the fourth-quarter
average. About one-fourth of the increase was computers and another
fourth was automotive products (primarily Big-Three vehicles made in
Canada and shipped to the United States). Another 20 percent of the
rise was consumer goods of which nearly two-thirds was apparel and
footwear. Smaller increases were recorded in the other major trade
categories. By area, most of the increase in the value of non-oil
imports was from Canada, with small increases from Latin America and
Japan; imports from Asia and Western Europe declined.
The quantity of exports declined 8 percent at an annual rate in
the first four months of 1993 compared with the fourth-quarter
average. A drop-back in exported aircraft and parts from an
unusually strong fourth-quarter level accounted for about one-third
of the decline. The remainder of the decrease was largely in
exported consumer goods (primarily tobacco products from strong
third and fourth-quarter levels) and agricultural products
(especially corn). These declines were partly offset by increases
in automotive exports to Canada and in exports of machinery (other
than computers). By area, most of the decline in value from the
fourth quarter was to developing countries in Latin America and
Asia; moderate increases were recorded to Canada and the United
Kingdom.
Oil Imports
The rise in the value of imported oil in April reflected both
higher prices (by 40 cents per barrel from the March average) and an
increase in quantity. The increase in the quantity reflected a rise

IV-4
in consumption and stockbuilding. In contrast, the quantity of oil
imported in the first quarter was little changed from the fourth
quarter as a decline in consumption (mild weather) was about offset
by a slowing in the rate of inventory depletion.
OIL IMPORTS(BOP basis, seasonally adjusted annual rates)
1992 1993 MonthsQ3 Q4 Q1 Jan Feb Mar Apr
Value (Bil. $) 57.19 54.85 51.02 50.80 48.92 53.33 59.41Price ($/BBL) 18.54 17.89 16.42 16.06 16.35 16.86 17.24Quantity (mb/d) 8.45 8.39 8.50 8.66 8.19 8.66 9.44
Source: U.S. Department of Commerce, Bureau of Economic Analysis.
From a low in January, prices of imported oil have risen
steadily, increasing 40 cents per barrel in April; these increases
reflected production restraint by OPEC early in the year.
Nonetheless, the price of imported oil in April was still less than
the fourth-quarter average. On June 10 OPEC agreed to roll over its
second-quarter quota agreement into the third quarter. Kuwait,
however, refused to participate in the agreement stating that it
intends to push its production (1.8 mb/d in May) above 2.1 mb/d by
September. Oil prices have fallen about 60 cents per barrel, on
balance, since the June 10 meeting. Spot WTI now (June 30) stands
at about $19.10 per barrel. These movements in spot prices suggest
that import prices are likely to have fallen to about $16.50 per
barrel in June.
Prices of Non-oil Imports and Exports
Prices (BLS) of U.S. non-oil imports increased 0.4 percent in
May; this was the third consecutive month an increase was reported
and follows declines in three of the previous four months. This
pattern of price changes largely reflects the pattern recorded by
imported capital goods and consumer goods. In May (as in April)
there was also a sharp increase in the price of imported passenger

IV - 5
IMPORT AND EXPORT PRICE MEASURES(percent change from previous period, annual rate)
Year Quarters Months1993-01 1992 1993 19931992-01 Q04 Q1 Q2-e Apr May
(Quarterly Average, AR) (Monthly Rates)
---------------------BLS Prices---------------------
Imports. Total 0.5 0.4 -5.1 4.1 0.4 0.4Foods, Feeds, Bev. -5.1 2.8 -5.5 2.0 1.1 0.5Industrial Supplies 1.7 -4.2 -9.2 9.1 0.8 -0.2
Ind Supp Ex Oil -0.2 -0.5 -1.9 2.0 -0.1 -0.2Capital Goods -0.1 -0.1 -4.4 1.1 0.0 0.7Automotive Products 0.3 3.0 -2.8 4.6 0.7 0.7Consumer Goods 1.3 2.9 -3.2 1.8 0.3 0.3
Memo:Oil 5.3 -11.4 -23.5 21.9 2.1 0.3Non-oil 0.0 1.5 -3.3 2.3 0.3 0.4
Exports, Total 0.6 -1.0 1.3 1.7 0.2 0.4Foods, Feeds, Bev. -3.7 -3.9 5.5 3.8 0.6 1.4Industrial Supplies 2.5 -2.7 1.9 4.8 0.5 0.6Capital Goods 0.3 -0.7 -0.7 -0.2 0.2 -0.1Automotive Products 1.6 2.5 1.2 0.7 0.1 0.2Consumer Goods 2.1 3.3 3.3 0.7 0.1 0.4
Memo:Agricultural -1.3 -2.7 5.6 2.0 0.4 1.1Nonagricultural 1.1 -0.8 0.6 1.6 0.2 0.3
------------- Prices in the NIPA Accounts------------
Fixed-WeightImports, Total 1.4 0.0 -5.2 -
Oil 7.6 -14.0 -29.7
Non-oil 0.6 0.7 -2.4
Exports, Total 0.5 -0.4 0.7
Ag -2.7 -6.0 4.9
Nonag 1.1 0.0 0.7
DeflatorsImports, Total -1.2 -1.5 -7.7
Oil 7.2 -12.7 -30.2
Non-oil -2.0 -0.2 -5.1
Exports, Total -1.3 -1.1 -0.8
Ag 0.3 4.1 5.1
Nonag -1.5 -1.5 -1.4 -

IV-6
cars; these price increases were the largest recorded since October
1992. For April-May combined, prices of non-oil imports rose 2.3
percent at an annual rate. There were increases in all major trade
categories, particularly automotive products; these increases
followed declines in the same categories in the first quarter.
Prices of agricultural exports increased sharply in May;
however, for April-May combined the increase from the fourth quarter
was a moderate 2.0 percent at an annual rate. Prices of exported
nonagricultural products rose by about the same rate in May as in
April; for April-May combined prices rose 1.6 percent at an annual
rate. The increase in May (as in April) was led by a rise in prices
of exported foods and industrial supplies, especially building
materials.
U.S. Current Account
The U.S. current account deficit in the first quarter of 1993
was $84 billion (seasonally adjusted, annual rate), $11 billion
smaller than in the fourth quarter. An increase in the deficit on
goods and services was more than offset by a shift to a surplus from
a small deficit in the balance on investment income and a reduction
in net unilateral transfers.
The deficit on merchandise trade widened in the first quarter
as exports declined from an unusually strong fourth-quarter level
and imports rose. The surplus on services increased. Nearly half
of the increase in service receipts was in travel and passenger
fares; there was little change in service payments as an increase in
payments for travel abroad was offset by decreases in most other
service payments.
A sharp increase in receipts on U.S. direct investment abroad,
mainly related to the operations of manufacturing and of banking and
finance affiliates, was partly offset by a large decrease in other

IV-7
U.S. Current Account(Billions Of dollars, seasonally adjusted annual rates)
Current Acct.Bal.Trade Services Investment Transfers Ex Special
Balance net Income, net net Pub. Grants 1/
Year1990 -109.0 30.7 20.3 -33.8 -91.9 -89.01991 -73.8 45.9 13.0 6.6 -8.3 -45.61992 -96.1 56.4 6.2 -32.9 -66.4 -67.6
Quarters
1991-1 -75.2 33.3 23.1 56.4 37.6 -48.32 -65.3 45.2 11.6 15.5 7.1 -38.93 -78.6 50.9 6.5 -26.3 -47.4 -50.24 -76.2 54.1 10.9 -19.4 -30.6 -45.2
1992-1 -71.1 56.2 17.7 -29.6 -26.7 -28.52 -99.2 54.6 3.6 -32.0 -73.0 -76.03 -110.4 61.1 6.8 -28.6 -71.1 -71.14 -103.9 53.7 -3.2 -41.4 -94.8 -94.8
1993-1 -116.3 58.5 1,0* -32.3 -89.0* -89.0*
*/ Includes an estimate for corrected data. BEA expects to reviseinvestment income by adding about $5 billion at an annual rate topayments. The revision is CONFIDENTIAL until released by BEA inabout 10 days.I/ Includes foreign cash grants to the United States to cover costsof the war in the Persian Gulf. These grants amounted to $4.3billion in 1990, $42.6 billion in 1991, and $1.3 billion in 1992;they are shown in the accounts as positive unilateral transfers.Also excludes special U.S. grants to foreign countries amounting to$7.2 billion in 1990 and $5.2 billion in 1991.Source: U.S. Department of Commerce, Bureau of Economic Analysis.
private receipts caused by a decline in interest rates. Income
payments on foreign assets in the United States decreased primarily
reflecting lower interest rates.
The reduction in net unilateral transfers was more than
accounted for by a decrease in U.S. Government grants. (The high
level of grants in the fourth quarter of last year included the
usual annual payment to Israel plus some grants financing Israeli
military purchases.)
U.S. International Financial Transactions
Foreign official reserve assets in the United States (line 4 of
the Summary of U.S. International Transactions table) rose by almost

IV-8
SUmMARY OF U.S. INTERNATIONAL TRANSACTIONS
(Billions of dollars)
1992 1992
Year Q2 Q 3 Q 4
Private Capital
Banks
1. Change in net foreign
positions of banking offices
in the U.S. (+ = inflow)
Securities
2. Private securities2
transactions, net
a) foreign net purchases
(+) of U.S. corporate bonds
b) foreign net purchases
(+) of U.S. corporate stocks
c) U.S. net purchases (-) of
foreign securities
3. Foreign net purchases (+) of U.S.
Treasury obligations
Official Capital
4. Changes in foreign official
reserves assets in U.S.
(+ - increase)
a) By area
G-10 countries
OPEC
All other countries
b) By type
U.S. Treasury securities4
Other
5. Changes in U.S. official reserve
assets (+ - decrease)
5
Other transactions (Quarterly data)
6. U.S. direct investment (-) abroad
7. Foreign direct investment (+) in U.S.6
8. Other capital flows (+ = inflow)9. U.S. current account balance
10. Statistical discrepancy
39.1 -1.9 36.3 0.4
-19.6 1.7 -11.5 -5.4
34.8 11.8 6.7 8.6
-3.7 -1.2 -3.8 4.2
-50.7 -8.9 -14.5 -18.1
1993 1993
Ol Feb. Mar. Ar.
-7.6
-17.8
-1.3 5.4 -3.9
-6.3 -5.7 -1.2
6.1 3.1 1.2 4.0
3.9 1.8 2.3 -0.2
-27.7 -11.1 -9.2 -4.9
37.5 1203 .. 2 1_. 13.5 2.5 8.4 2.8
38.1 20.3 -8.2 5.0 11.3 1.4 -3.2 129
4.8 3.3 3.B
4.9 -2.6 2.9
28.5 19.6 -14.9
-4.7 -1.9
1.7 0.5
7.9 12.7
-1.6 -5.3 4.9
-1.3 2.3 -1.2
4.3 -0.4 -0.8
18.5 11.2 -0.3 -7.4 1.1 -2.3 -0.7 3.1
19.7 9.1 -7.9 12.4 10.2 3.7 -2.6 -0.2
3.9 1.5 2.0 1.5
-34.7
-2.4
11.9
-66.4
-12.2
-6.9
2.4
8.4
-18.3
-17.5
-2.0
1.0
-6.9
-17.8
2.1
-11.5
3.1
-6.1
-23.7
15.3
-1.0
-10.0
5.8
22.0
-22.2
6.0
-0.3 -0.2 0.1
n.a.
n.a.
n.a.
n.a.
n.a.
MEMO:
U.S. merchandise trade balance -- part
of line 9 (Balance of payments basis,
seasonally adjusted) -96.1 -24.8 -27.6 -26.0 -29.1 n.a. n.a. n.a.
1. Includes changes in positions of all depository institutions, bank-holding companies, and certain transactions
between brokers/dealers and unaffiliated foreigners (particularly borrowing and lending under repurchase agreements.)
2. These data have not been adjusted to exclude commissions on securities transactions and, therefore, do not match
exactly the data on U.S. international transactions as published by the Department of Commerce.
3- Includes all U.S. bonds other than Treasury obligations.
4. Includes deposits in banks, commercial paper, acceptances, borrowing under repurchase agreements, and other
securities.
5. Seasonally adjusted.
6. Includes U.S. government assets other than official reserves, transactions by nonbanking concerns, and other
banking and official transactions not shown elsewhere. In addition, it includes amounts resulting from adjustments to
the data made by the Department of Commerce and revisions to the data in lines 1 through 5 since publication of the
quarterly data in the Survey of Current Business.
*--Less than $50 million.
NOTE: Details may not add to total because of rounding.

IV-9
$3 billion in April, more than accounted for by Japan, which
intervened heavily to resist the appreciation of the yen. Partial
information from FRBNY indicates that G-10 holdings rose
substantially again in May and June, despite substantial declines in
holdings by Germany in May.
Private foreigners continued to add net to their holdings of
U.S. Treasury securities in April (line 3). The United Kingdom and
Japan more than accounted for the net purchases. For the first four
months of 1993, net purchases recorded directly by Japanese
residents amounted to more than $5 billion, about the same average
pace as recorded in 1992.
Private foreigners also added net about $4 billion to their
holdings of U.S. government agency and corporate bonds in April
(line 2a). However, new Eurobond issues by U.S. corporations fell
in May and June from the very high levels reached in March and
April. Foreign purchases and sales of U.S. corporate stock were
about offsetting in April (line 2b), but the volume of transactions
remained relatively high.
U.S. net purchases of foreign securities (line 2c) were
substantial in April, but far below the pace of previous months. In
contrast to the first quarter, in April net purchases of foreign
stocks far outpaced net purchases of bonds. Net stock purchases
were largest in Europe, particularly in the United Kingdom and
Spain, and in Asia, particularly in Hong Kong and Japan.
Banks reported a net outflow in April on a month-end basis
(line 1), but much of this outflow appears to be the result of end-
of-period window dressing by foreign-based banks at the end of
March. In contrast, on a monthly average basis, banks reported a
net inflow from their own foreign offices and IBFs in April and
little net change in May. (See line 1 of the International Banking

INTERNATIONAL BANKING DATA
(Billions of dollars)
1991 1992 1993
Mar. June Sept. Dec. Mar. June Sept. Dec. Feb. Mar. Apr. May
Net Claims of U.S. Banking
Offices (excluding IBFS) on Own
Foreign Offices and IBFS
(a) U.S.-chartered banks
(b) Foreign-chartered banks
SCredit Extended to U.S.
Nonbank Residents by Foreign
Branches of U.S. Banks
i. Eurodollar Holdings of
U.S. Nonbank Residents 1/
-23,8
7.6
-31.3
-13.7
5.4
-19.2
-14.1
11.0
-25.2
-35.8
12.4
-48.3
-41.4
3.2
-44.6
-56.8
8.3
-65.1
-58.0
12.7
-70.9
-71.6
17.0
-88,6
-71.5
12.4
-83.8
-77.1
8.9
-86.0
-82,0
11.2
-93.2
-81.9
11.5
-93.3
26.0 23.9 23.7 23.9 23.3 24.5 24.8 24.8 24.0 23.5 23.4 23.5
114.6 105.8 100.8 102.9 100.3 91.2 86.3 90.0 88.6 89.5 86.5 86.0
L. Includes term and overnight Eurodollars held by money market mutual funds.
iverall banking data incorporated in the international transactions accounts.
teserve by U.S. banking offices. Line 2 is an average of daily data. Line 3
average of Wednesday data for the term component.
Note:
Line 1
These data differ in coverage and timing from the
is an average of daily data reported to the Federal
is an average of daily data for the overnight component and an
I-

IV-11
Data table.) Foreign chartered banks more than accounted for the
net inflow.
Data recently released by the Department of Commerce indicate
that U.S. direct investment abroad continued strong in the first
quarter of 1993 (line 6 of the Summary of U.S. International
Transactions table). The outflows were spread among countries in
Latin America, continental Europe, and Asia. Foreign direct
investment in the United States (line 7) increased somewhat, but
remains far below peak levels reached in 1989.
Inflows of other capital (line 8) were very large in the first
quarter. A substantial part of these inflows was accounted for by
reductions in U.S. nonbanks' holdings of foreign commercial paper,
Eurodollar deposits, and CDs. It should be noted that BEA has
substantially improved its estimates of these holdings by
substituting information from other sources for suspect components
of the Treasury International Capital Reports. Information from
Moody's Investors Service and other sources is now used to estimate
U.S. holdings of foreign commercial paper, and data provided by
foreign central banks, particularly the Bank of England, are used to
estimate holdings of Euro-CDs. These improvements have resulted in
substantial revisions to earlier data.
Foreign Exchange Markets
The weighted average foreign exchange value of the dollar in
terms of the other G-10 currencies, shown in the accompanying chart,
has appreciated just under 2 percent since the last FOMC meeting.
On balance, the U.S. dollar appreciated 4 percent against the German
mark and 1-1/4 percent against the British pound, but depreciated
5-1/2 percent versus the Japanese yen.
Initially the dollar continued its depreciation against the
Japanese yen, falling through a string of record lows until it

IV-12
WEIGHTED AVERAGE EXCHANGE VALUE OF THE DOLLARMarch 1973 = 100
FOMCMay 18
March Aprl May June
SELECTED DOLLAR EXCHANGE RATESMarch 1 = 100
Aonl May
Daily
March june

IV-13
reached 104.80 Y/$ on June 15. The dollar's decline against the yen
was an extension of the previous yen rally, and continued to be
fueled by the belief that Japan's trading partners, and the United
States in particular, desire an appreciation of the yen to reduce
Japan's persistent trade surpluses. Although there were a multitude
of statements from U.S. and Japanese officials to the effect that no
official policy of seeking a yen appreciation existed, and that the
yen was appreciating too quickly, apparently none was convincing
enough to have a significant impact. During this period the Bank of
Japan steadily intervened to retard the yen's rise and bought an
exceptionally large quantity of dollars. The Federal Reserve System
and U.S. Treasury joined the Bank of Japan intervention operations
on three occasions and bought a total of half a billion dollars
each. However, on June 18 Prime Minister Miyazawa lost a vote of no
confidence and dissolved the lower house of the Japanese parliament.
Market consideration of such a vote had only arisen a few days
earlier, and the yen depreciated 3-1/2 percent against the dollar in
the week surrounding the vote. Subsequently news stories and
official comments ahead of the G-7 summit in Tokyo refocused
attention on Japan's trade surplus. This contributed to a rebound
of the yen to the levels it had achieved shortly before the vote of
no confidence.
The course of the German mark continues to be dominated by
seesawing expectations of when and by how much the Bundesbank will
cut German interest rates. In late May, the German mark appreciated
against the U.S. dollar when Bundesbank officials commented that
consumer price inflation data, which showed a rise of 4.2 percent
for the year ending in May, limited the room for further interest
rate cuts in the near future. However, the sentiment changed when,
at the beginning of June, statistics for west Germany showed that

IV-14
first-quarter GDP declined at an annual rate of 5.6 percent.
Additionally, some Bundesbank Council members predicted that German
M3 growth could fall back into the Bundesbank's target range of
4-1/2 to 6-1/2 percent, and market participants once again shortened
their timetables for German interest rate cuts. Furthermore, French
and Japanese officials in late June were openly calling for German
rate cuts. Although official interest rates remain unchanged,
persisting expectations that the Bundesbank may ease at its next
Council meeting, on July 1, contributed to the mark's depreciation.
With the German mark weakening to near the bottom of the ERM
parity grid, a considerable number of central banks in Europe did
not wait to follow a Bundesbank rate cut, but instead led the way to
lower interest rates. The central banks of Sweden, Denmark, the
Netherlands, Belgium, France, Spain, Portugal, Ireland, and Italy
cut their official rates 20 to 250 basis points, with the Bank of
Portugal being the most aggressive after the escudo's ERM parity was
devalued by 6-1/2 percent on May 13 in tandem with an 8 percent
devaluation of the Spanish peseta. While three-month interest rates
in Germany actually rose 25 basis points to 7-1/2 percent, they
declined 60 basis points in France and 30 basis points in the
Netherlands, to 6.9 and 6.5 percent respectively. Short-term
interest rates in the United Kingdom also fell 20 basis points to
5.8 percent. Short-term interest rates are now lower in several ERM
member countries than they are in Germany.
The widespread rate cuts and the continued lack of prospects
for strong recovery helped ease long-term interest rates in Europe.
Ten-year bond yields in Germany and the Netherlands each fell
20 basis points to 6.6 and 6.4 percent respectively, while they
declined 40 basis points to 6.7 percent in France. The long-term
bond yield in France is now 7 basis points above its German

IV-15
counterpart, although it briefly dipped below the German yield in
late June. In the United Kingdom, the ten-year yield declined 45
basis points to 7.7 percent.
Major stock market indices around the world were mixed. Stock
markets in Switzerland, France, the Netherlands and Belgium rose
between 5 and 6-3/4 percent over the intermeeting period, largely
because of lower interest rates, while the Nikkei index in Japan
declined almost 3-1/2 percent, primarily in response to the
uncertainty stemming from the political upheaval. Gold extended its
rise from earlier this spring, albeit at a slower pace and not
without considerable fluctuations. The dollar price of gold rose 2
percent on balance to $375/oz amid continuing reports of strong
demand from China.
Developments in Foreign Industrial Countries
There are signs of recovery in economic activity in some
countries but further deterioration in others. Japan registered a
surprisingly strong rise in first-quarter GDP of 2.7 percent
(s.a.a.r.); however, recent indicators suggest that this strength
did not continue in the second quarter. In the United Kingdom and
Canada, recent data indicate that economic recovery is continuing.
In continental Europe, in contrast, growth remains weak and
unemployment continues to rise. Germany registered a large decline
in GDP of 5.6 percent (s.a.a.r.) in the first quarter, and recent
indicators suggest this weakness persisted in the second quarter.
Inflationary pressures remained subdued in all foreign G-7
countries except Germany. German inflation in June remained above 4
percent largely as a result of price increases in the service and
housing sectors. In the United Kingdom and Italy, recent currency
devaluations do not appear to have added significantly to inflation.

REAL GDP AND INDUSTRIAL PRODUCTION IN MAJOR INDUSTRIAL COUNTRIES(Percentage change from previous period,seasonally adjusted 1/)
Latest1992 1993 1993 three
----. --------------- -----. -----------. ---------.------------ monthsfrom
1991 1992 yearQ2 Q3 Q4 Q1 JAN FEB MAR APR MAY ago 2
JAPAN
GDP 3.0 0.0 -0.2 -0.5 -0.2 0.7 * * * * * -0.3IP -1.6 -7.7 -2.4 0.1 -2.9 -0.1 -0.3 1.5 2.5 -2.5 -2.4 -3.3
WEST GERMANY
GDP 2.0 0.4 -0.3 -0.4 -0.8 -1.4 * * * * * -2.9IP 0.1 -4.7 -1.9 -1.3 -4.2 -2.7 0.2 -1.3 1.5 0.4 NA -9.2
FRANCE
GDP 1.2 0.7 0.2 0.2 -0.4 NA * * * * * 0.7IP 1.8 -2.3 0.0 0.1 -2.6 -0.9 0.3 2.4 -1.0 -0.6 NA -3.4
UNITED KINGDOM
GDP -1.7 0.2 -0.1 0.4 0.3 0.4 * * * * * 1.0IP -0.7 0.5 -0.4 0.8 0.9 0.2 -0.1 1.6 -1.2 0.0 NA 1.4
ITALY
GDP 1.4 -0.3 0.2 -0.5 -0.6 NA * * * * * -0.3IP -0.5 -3.2 -2.8 -2.3 -0.7 NA NA NA NA NA NA -3.2
CANADA
GDP -0.1 0.8 0.0 0.1 0.7 0.9 * * * * * 1.7IP -1.4 2.6 0.4 0.8 1.6 1.9 0.5 0.7 1.5 -0.7 NA 5.1
UNITED STATES
GDP 0.1 3.1 0.4 0.8 1.2 0.2 * * * * * 2.6IP -0.3 3.2 1.2 0.2 1.6 1.4 0.3 0.5 0.2 0.2 0.2 3.8
* Data not available on a monthly or quarterly basis.1/ Yearly data are Q4 to Q4 percent change.2/ For quarterly data, latest quarter from a year ago.

CONSUMER AND WHOLESALE PRICES .tJOR INDUSTRIAL COUNTRIES(Percentage change from previous period 1/)
Latest1992 1993 1993 month
--------------------------- ------ ----- - --------------------------- from1991 1992 year
Q1 Q2 Q3 Q4 Q1 Q2 MAR APR MAY JUN ago 2/
JAPAN
CPIWPI
WEST GERMANY
CPIWPI
FRANCE
CPIWPI
UNITED KINGDOM
CPIWPI
ITALY
CPIWPI
CANADA
CPIWPI
UNITED STATES
CPI (SA)WPI (SA)
3.2-1.7
3.91.6
2.9-3.6
4.24.9
6.51.1
4.1-3.2
3.0-0.1
0.9-1.5
3.7-1.9
1.8NA
3.13.4
5.33.0
1.83.1
3.11.5
-0.3 1.3 -0.1 0.0 0.0 1.1-0.4 0.0 -0.2 -0.9 -0.5 NA
1.2 1.1 0.5 0.9 1.8 1.00.4 0.5 -2.0 -0.8 0.7 NA
0.5 0.8 0.0 0.5 0.8 NA0.2 0.4 -0.5 NA NA NA
0.5 2.2 -0.1 0.4 -0.7 NA1.4 1.1 0.4 0.5 1.7 NA
1.4 1.2 0.7 1.3 1.0 NA0.0 0.8 -0.5 2.8 1,6 NA
0.4 0.5 0.4 0.4 0.7 NA0.5 0.6 0.8 1.2 1.2 NA
0.8 0.8 0.7 0.8 0.9 NA0.1 0.8 0.4 0.2 0.6 NA
0.5 0.6 0.30.5 -0.5 -0.3
0.3 0.3 0.30.2 -0,1 -0.1
0.5 0.1 0.2* * *
0.4 0.9 0.40.7 0.5 0.2
0.2 0.40.8 0.7
-0.1 0.0 0.20.3 -0.2 0.0
0.1 0.4 0.10.4 0.6 0.0
0.0NA
0.1NA
NA
NA
NA
NA
NA
NA
NA
NA
NANA
1.0-3.0
4.1-2.1
2.0-0.9
1-4i
1.34.0
4.15.4
1.83.1
3.22.0
* Data not available on a monthly or quarterly basis.1/ Yearly data are Q4 to Q4 percent change.2/ For quarterly data, latest quarter from year ago.
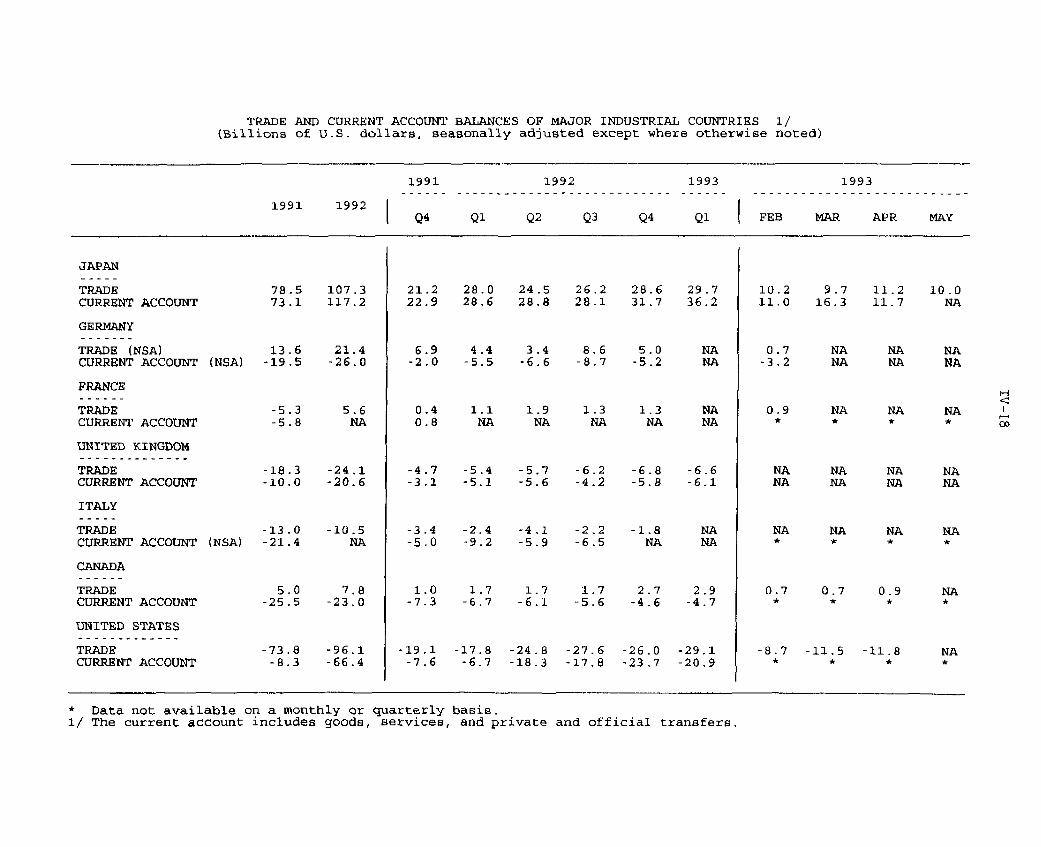
TRADE AND CURRENT ACCOUNT BALANCES OF MAJOR INDUSTRIAL COUNTRIES 1/(Billions of U.S. dollars, seasonally adjusted except where otherwise noted)
1991 1992 1993 1993------ -- - - - ---- -- -- ---- -- ---~~~- - ~-- --- -- - - -~-- - --- - -~-~ ~-- -- - - - - -
1991 1992Q4 QL Q2 Q3 Q4 Q1 FEB MAR APR MAY
JAPAN
TRADECURRENT ACCOUNT
GERMANY
TRADE (NSA)CURRENT ACCOUNT (NSA)
FRANCE
TRADECURRENT ACCOUNT
UNITED KINGDOM
TRADECURRENT ACCOUNT
ITALY
TRADECURRENT ACCOUNT (NSA)
CANADA
TRADECURRENT ACCOUNT
UNITED STATES
TRADECURRENT ACCOUNT
78.5 107.373.1 117.2
13.6 21.4-19.5 -26.0
-5.3-5.8
5.6NA
-18.3 -24.1-10.0 -20.6
-13.0 -10.5-21.4 NA
5.0-25.5
7.8-23.0
-73.8 -96.1-8.3 -66.4
21.2 28.0 24.5 26.2 28.6 29.722.9 28.6 28.8 28.1 31.7 36.2
6.9 4.4 3.4 8.6 5.0-2.0 -5.5 -6.6 -8.7 -5.2
0.40.8
1.1NA
1.9NA
1.3NA
1.3NA
-4.7 -5.4 -5.7 -6.2 -6.8 -6.6-3.1 -5.1 -5.6 -4.2 -5.8 -6.1
-3.4 -2.4 -4.1 -2.2-5.0 -9.2 -5.9 -6.5
-1.8NA
1.0 1.7 1.7 1.7 2.7 2.9-7.3 -6.7 -6.1 -5.6 -4.6 -4.7
-19.1 -17.8 -24.8 -27.6 -26.0 -29.1-7.6 -6.7 -18.3 -17.8 -23.7 -20.9
10.2 9.7 11.2 10.011.0 16.3 11.7 NA
0.7-3.2
0.9*
NANA
NA NA NANA NA NA
NA NA NAN* * *NA
NA NA NANA NA NA
NA NA NA NA* * * *
0.7 0.7 0.9
-8.7 -11.5 -11.8
-8.7 -11.5 -11.8* * *
* Data not available on a monthly or1/ The current account includes goods,
quarterly basis.services, and private and official transfers.

IV-19
France, Italy and Canada all registered trade surpluses in the
early months of 1993. However, the United Kingdom registered
another large trade deficit in the first quarter. Japan's trade
surplus increased to $122 billion (s.a.a.r.) during the five months
through May.
In Japan, real GDP increased 2.7 percent (s.a.a.r.) in the
first quarter following three consecutive quarterly declines. The
strongest component of private domestic demand was consumption,
which rose 4.7 percent. Plant and equipment investment was down 0.7
percent, while housing investment fell 11.6 percent. Government in-
vestment increased 28.6 percent, reflecting the government's fiscal
stimulus program adopted in the second half of 1992. Both inventory
investment and net exports made negative contributions to growth.
Most monthly indicators from the second quarter have been less
positive. In May, industrial production declined 2.4 percent (s.a.)
after falling 2.5 percent in April. New passenger car registrations
(s.a.) recorded a cumulative fall of 20.3 percent during April and
May, while housing starts (s.a.) declined 8 percent over the same
two-month period. New machinery orders (s.a.) fell 23.3 percent
in April. In contrast, the index of leading indicators remained
above the "boom/bust" demarcation level for the fourth consecutive
month in April, and M2+CDs grew at double-digit rates in April and
May on a 12-month basis.
JAPANESE ECONOMIC INDICATORS(percent change from previous period except where noted, s.a.)
1992 1993Q2 Q3 Q4 Q1 Q2 Mar. Apr. May
Machinery Orders -11.4 8.4 -14.8 16.0 -- 9.7 -23.3New Car Registrations -6.6 -1.8 -5.6 10.7 -- 5.0 -11.2Job Offers Ratio -9.6 -9.7 -7.8 -3.2 -- 3.3 -4.5 -3.6
Business Sentiment* (%) -24 -37 -44 -49 -49
* Percent of manufacturing firms having a favorable view of businessconditions minus those with an unfavorable outlook.

IV-20
Inflationary pressure has remained subdued. Consumer prices in
the Tokyo area showed a 12-month increase of only 1 percent in June.
Wholesale prices declined 3 percent in the 12 months to May due in
part to appreciation of the yen. Wage growth has continued to
moderate. Over the first four months of the year, wages, including
bonuses and overtime, were only 1.1 percent above their year-earlier
level.
The trade surplus has continued to increase. Through May, the
trade surplus was $122 billion (s.a.a.r.), compared with $117
billion for 1992 as a whole.
On June 18, Prime Minister Miyazawa lost a no-confidence vote
in the lower house of parliament when a dissident faction of the
ruling Liberal Democratic Party joined opposition parties in voting
against the government over its failure to enact political reform
legislation. New lower house elections have been scheduled for July
18. In the interim, Prime Minister Miyazawa remains the head of a
caretaker government.
Real GDP in western Germany (s.a.a.r.) dropped 5.6 percent
in the first quarter (adjusted for working days), the fourth
consecutive quarterly decline--bringing the cumulative four-quarter
fall of GDP to 3 percent. Real domestic demand declined 7.8 percent
in the first quarter, reversing the temporary expansion at the end
of last year that resulted from a substantial increase in private
consumption in anticipation of the increase in the value-added tax
on January 1. Investment was flat in the first quarter, owing to a
substantial decline in equipment investment that was about offset by
an increase in construction spending. The external sector made a
positive contribution to real GDP growth during the first quarter,
as imports declined more than exports.

IV-21
WESTERN GERMAN ECONOMIC INDICATORS(percent change from previous period except where noted, s.a.)
1992 1993
Q2 Q3 Q4 Q1 Mar. Apr. MayMachinery Orders -4.3 -2.2 -7.4 -0.1 -2.7 -2.1Capacity Utilization -0.7 -2.2 -3.1 -2.5Unemployment Rate (%) 6.5 6.7 7.2 7.6 7.8 8.0 8.0
Production Plans (%) -6 -12 -33.3 -25.7 -28 -24
* Percent of mining and manufacturing firms that expect to increase
production minus those that expect to decrease it.
Total industrial production (s.a.) declined in western Germany
in April after declining 2.7 percent in the first quarter. (Accord-
ing to the government, the initially reported increase of 0.4
percent will be revised to show a decrease in April). Industrial
production excluding construction (s.a.) was up slightly in April
after it declined 2.9 percent in the first quarter. In April, total
orders (s.a.) were up 2 percent relative to March, to stand 0.7
percent below their average in the first quarter. In May, the
unemployment rate (s.a.) was unchanged from April at 8 percent.
West German unemployment remains low compared with levels reached in
previous recessions.
Consumer prices in western Germany increased 4.1 percent in
June on a 12-month basis, as price pressures in services and
housing, in particular, remained strong. The increase in the value-
added tax of 1 percentage point at the beginning of the year is
estimated to have added 0.5 percentage points to the rate of
inflation. Excluding services and housing prices and effects of the
VAT, consumer prices rose at slightly more than 2 percent on a
12-month basis. Wholesale prices (n.s.a.) dropped 2.1 percent, and
producer prices (n.s.a.) were down 2.9 percent for the year ending
in May. In May, import prices (n.s.a.) were about 3.6 percent below
their year-earlier level. In late May, the conflict over wages in
IV-22
the chemicals, metals, and engineering industries in eastern Germany
was resolved. After staging the first strikes in eastern Germany in
60 years, IG-Metall negotiated new contracts that delayed the
equalization of wages between eastern and western Germany until
1996. (Under the old contract, wage parity was scheduled for 1994).
Increases in eastern German wages will be about 15 percent this
year, down from the 25 percent increases called for in the old
contract. Employers retained the clause that allows some opting-out
or renegotiation of contracts under adverse economic circumstances.
Through May, M3 in western and eastern Germany combined
increased 6.7 percent (s.a.a.r.) relative to the fourth quarter of
last year, slightly above the Bundesbank's 1993 target range of
4-1/2 to 6-1/2 percent.
A second supplementary budget for 1993 that has been submitted
to the German parliament would authorize a Federal deficit of DM68
billion this year, an increase of DM38.6 billion compared with the
1992 deficit. On June 29, the cabinet approved a budget for 1994
holding the deficit constant at its 1993 level.
In France, economic activity showed signs of having weakened
further in the second quarter. Industrial production declined 0.6
percent (s.a.) in April after declining 0.9 percent in the first
quarter. Surveys indicate that industrial production probably was
flat in May and probably declined in June. The unemployment rate
continued to rise, reaching 10.9 percent (s.a.) in April from 10.7
percent in March. Weakness was also apparent on the expenditure
side. Consumption of manufactured products, equal to one-third of
total consumption, declined 5.1 percent (s.a.) in May after rising
2.7 percent in the previous month. Retail sales also fell sharply
in May.
IV-23
Inflationary pressures continued to ease. The consumer price
index in May was only 2 percent (n.s.a.) above its year-earlier
level, down from 2.2 percent in the previous month. A temporary
increase in inflation is likely later in the year due to increases
in excise taxes on gasoline and alcohol included in the new govern-
ment's supplementary budget. This good inflation performance was
supported by continued moderation in wage inflation. In April,
wages were only 2.9 percent (n.s.a.) above their year-earlier level,
down from an increase of 3.6 percent in January.
The French trade balance remained in surplus in the first two
months of 1993, registering a combined surplus of $1.1 billion
(s.a.).
On May 25, Prime Minister Balladur announced additional
stimulus measures to support construction and employment. These
measures, plus those in the supplementary budget announced two weeks
earlier, total roughly 0.5 percent of GDP in 1993. Although this
total amounts to only one-half the value of the tax increases and
expenditure cuts in the supplementary budget, fiscal policy remains
expansionary overall due to the operation of automatic stabilizers.
The additional stimulus measures should not add to the 1993 budget
deficit as they are to be financed by revenues from privatization.
A privatization plan, announced on May 26, identified 21 companies
to be privatized and should yield revenues of FF40 billion in 1993.
Recent indicators of U.K. economic activity have been positive.
In May, the purchasing managers' index indicated that manufacturing
activity rose for the fourth consecutive month. Unemployment (s.a.)
has fallen this year to a rate of 10.4 percent in May. Industrial
production (s.a.) was unchanged in April at a level 1 percent above
a year ago, but manufacturing production (s.a.) rose 0.7 percent.

IV-24
After increasing in the first three months of 1993, retail sales
volume (s.a.) declined 0.2 percent in both April and May.
In May, consumer prices (n.s.a.) rose 0.4 percent, and the
12-month inflation rate remained at 1.3 percent. Excluding mortgage
interest rates, consumer prices were 2.8 percent above their level
of May 1992. The recent fall in the 12-month rate of inflation
mainly reflects lower average council tax bills for households
compared with the poll tax. Cost increases associated with the
depreciation of sterling have been offset by continued moderation in
labor costs. The underlying annual rate of inflation in earnings
was 4 percent in April.
In June, the first complete set of trade figures released since
December revealed that in the first quarter of 1993, the United
Kingdom recorded its biggest quarterly trade gap since 1990.
Provisional figures indicated that the visible trade deficit was
£4.5 billion ($6.6 billion) in the first quarter, up slightly from
the £4.35 billion ($6.8 billion) registered in the last quarter of
1992. The deficit in trade with other EC countries remained at $1.6
billion in the first quarter despite depreciation of sterling.
Underlying export volume rose only 0.5 percent between the final
quarter of 1992 and the first quarter of 1993 reflecting the
recession in other EC nations, while import volume was up 3 percent.
On May 27, Prime Minister Major replaced Chancellor of the
Exchequer Norman Lamont with Kenneth Clarke. Chancellor Clarke
delivered the annual Mansion House speech on economic policy on June
15 and announced no new policy initiatives. He stated his
determination to keep inflation down and get public spending under
control; he also stated that it would be several years before
Britain would reenter the ERM.

IV-25
Economic activity in Italy remains weak and recent indicators
are mixed. Provisional data indicate that industrial production
(s.a.) rose 0.3 percent in April following the first quarter's 0.1
percent decline. Survey data suggest that industrial production
rose again in May. In addition, the consumer confidence index
(n.s.a.) fell in April for the third consecutive month.
Despite the lira's depreciation last year and earlier this
year, consumer price inflation has remained restrained due largely
to the weakness in economic activity. Through May, consumer price
inflation averaged 4.0 percent (12-month basis), down from the
average rate of 5.3 percent recorded in 1992. However, consumer
price inflation may rise soon as recent acceleration in producer and
wholesale prices, caused by lira depreciation, feeds through to
consumer prices.
Weakness in economic activity and the lira's depreciation
produced a trade surplus (n.s.a.) of $1.2 billion in the first
quarter. A deficit of $6.6 billion was recorded in the first
quarter of 1992.
On May 21, the Ciampi government announced a 12.5 trillion lire
(0.8 percent of GDP) supplementary budget-reduction package for
1993. The package was needed to prevent Italy's budget deficit from
mushrooming beyond the target of 150 trillion lire (9.4 percent of
GDP) for 1993. The package will also allow Italy to draw the second
tranche of its 8 billion ECU loan from the EC. Parliament is
expected to pass the package by mid-July.
In Canada, GDP (s.a.a.r.) grew.3.8 percent in the first
quarter, as exports of goods and services rose 5.9 percent.
Increases in domestic demand were more modest as a 2.5 percent
increase in private consumption was partially offset by a 3.5
percent fall in investment. Data for the second quarter have been

IV-26
mixed. Canadian industrial production (s.a.) fell 0.7 percent in
April to a level 0.5 percent above the first quarter average. GDP
at factor cost (s.a.) was flat in April, after rising 0.6 percent in
March. The unemployment rate (s.a.) was unchanged in May at nearly
11-1/2 percent. Retail sales (s.a.) rose 1 percent in April.
Recent price data confirm that inflation has remained moderate,
despite significant depreciation of the Canadian dollar last autumn.
The 12-month change in the CPI excluding food and energy (n.s.a.)
declined from 1.9 percent in April to 1.6 percent in May. The
all-items CPI was up 1.8 percent in the 12-month period to May;
producer prices were unchanged in May at a level 3.2 percent above
that of a year earlier. Wage settlements increased 0.5 percent at
an annual rate in the first four months of the year, their smallest
rise in three decades of measurement.
The current account deficit (s.a.a.r.) was virtually unchanged
in the first quarter at $18.8 billion. In April, exports (s.a.)
reached $11.6 billion, a new record, as the merchandise trade
surplus expanded to $0.9 billion.
On June 13, Kim Campbell was chosen by Progressive Conservative
Party delegates to succeed Brian Mulroney as Prime Minister. She
took office on June 25 and named Gilles Loiselle Minister of
Finance. Loiselle announced that he will present a plan to
eliminate the budget deficit in five years. Campbell must call a
general federal election by November 1993. The latest polls suggest
that the election will be a close contest between the Conservatives
and the Liberals, who are led by Jean Chretien.
Implementing legislation for the North American Free Trade
Agreement (NAFTA) was passed in the House of Commons on May 27 and
in the Senate on June 23. The Canadian government does not plan to

IV-27
enter the bill into law until the agreement is ratified by the
United States and Mexico.
In Russia, on May 22 the Government and the Central Bank (CBR)
signed a new Economic Policy Statement. The statement was
negotiated with the participation of IMF staff, and its adoption was
one of the pre-conditions for Russian access to the IMF's new
Systemic Transformation Facility (STF). The statement outlines
policies aimed at reducing monthly inflation to single-digit levels
by the end of the year. It envisions increases in official interest
rates, quarterly ceilings on CBR credit emission, sharp reductions
in the fiscal deficit primarily through expenditure reductions, and
some structural reforms.
Since the policy statement was signed, the Russian government
and the CBR have implemented a number of the anticipated policy
changes: the CBR discount rate has been increased from 100 percent
to 140 percent in three steps; import and grain subsidies have been
cut; and coal prices have been increased as part of a phased
elimination of coal subsidies. On June 30 the IMF Executive Board
is expected to approve the first of two $1.5 billion loans to Russia
from the STF,
Since June 15, the ruble has appreciated 5 percent against the
dollar in interbank auctions, following depreciation of 63 percent
since the beginning of the year. Market commentary has attributed
the ruble's strength to new restrictions on dollar sales in
interbank auctions, high demand for rubles to meet mid-year tax
payments, and the entry of foreign banks into the market on July 1.
The ruble's recent strength may also indicate some tightening of
monetary policy.

IV-28
Economic Situation in Other Countries
Growth in Mexico and Taiwan slowed marginally in the first
quarter, helping to lower inflation in both economies. Upturns were
recorded for Brazil and Korea, but Brazilian growth comes on the
back of a worsening inflation problem and may not be sustainable
(despite the announcement of another new economic plan on June 14).
Questions about the sustainability of rapid growth also plague the
outlook for China, where economic activity continues to be brisk
despite a modest attempt to tighten monetary conditions in May.
Aside from Brazil and China, inflation remains stable or falling in
developing countries. Trade balances declined in several developing
countries as weak world demand depressed exports, while domestic
demand kept import flows up in Brazil and China; Korea's current
account deficit, however, continued to shrink as contractionary
policies take hold. The most important of China's several exchange
rates depreciated 25 percent overnight when authorities decided to
let the rate float on June 1.
Individual country notes. Mexico's real GDP rose 2.4 percent
in the first quarter from a year earlier, only slightly slower than
the 2.6 percent growth recorded for all 1992 but the lowest Ql/Ql
increase since 1989. Declines in the output of clothing, metal
products, and machinery kept overall manufacturing growth to 1.7
percent, but construction activity rose 7.6 percent.
The monthly CPI increase in May was 0.6 percent for the third
straight month. The May CPI stood 10 percent higher than a year
earlier, and 3.9 percent higher than in December 1992; the December-
May increase was the slowest for this period in 21 years.
Mexico's trade deficit in the year through April was $4.7
billion, up only slightly from the same period one year ago; exports
grew 11 percent, while imports rose 8.9 percent from a bigger base.

IV-29
Slower growth has helped to limit Mexican imports, which grew 24.4
percent for all 1992. In the first quarter, Mexico posted a $5.2
billion current account deficit, compared with a $4.9 billion
deficit in the same period last year, while the capital account
recorded an $8.3 billion surplus; international reserves rose $2.3
billion.
After depreciating mildly between mid-April and mid-May, the
peso has regained strength in response to firmer interest rates and
a May 17 presidential proposal to grant autonomy to the Bank of
Mexico. On June 29, the exchange rate was 3.118 pesos per dollar,
4.4 percent above the lower limit of its band. After reaching a
high of 15.8 percent on June 16, the 28-day Treasury-bill rate
turned down and was 14.4 percent on June 30, a low for the year.
A constitutional amendment providing for central bank autonomy
was passed in the Mexican Congress on June 22. Implementing
legislation is likely to be introduced in the November session, and
the proposal is expected to go into effect early next year.
In Brazil, real GDP grew 4.7 percent in the first quarter from
a year earlier, after falling 0.6 percent in 1992 (Q4/Q4). Growth
appears to have remained robust over the second quarter, based on
data on automobile sales, which increased 14 percent in volume terms
between April and May. Monthly inflation rose from 28 percent in
March and April to 30 percent in May, the highest rate since March
1990. The cumulative trade surplus for the year through April was
$4.6 billion, up from a $3.7 billion surplus over the same period in
1992; exports grew 22 percent and imports grew 25 percent.
Finance Minister Eliseu Resende resigned in May and was
replaced by Fernando Henrique Cardoso, who unveiled a new
stabilization plan on June 14. The plan would cut $6 billion of
expenditures in the second half of 1993 (3 percent of yearly GDP).

IV-30
The plan also envisions fundamental reforms in several areas:
1) tax reform, 2) more rapid privatization and fewer obstacles to
foreign investment in privatized firms, 3) transfer of spending
authority.to state and local governments, and 4) strengthened
central bank supervision over federal and state banks (which have
been important sources of fiscal and monetary pressures). Under the
last point, the central bank would be authorized to take
administrative control of banks and to liquidate them if necessary.
Since most of the reforms require congressional approval and
amendments to the 1988 constitution, it is not clear whether they
will attract sufficient political support. This leaves continuing
questions over whether Brazil can qualify for a new IMF stand-by
arrangement that would facilitate the conclusion of negotiations on
a Brady-style restructuring of $44 billion in external commercial
bank debt.
In Argentina, consumer prices rose 1.3 percent in May. The CPI
has risen 12.4 percent over the past 12 months, compared with a 22.4
percent increase over the same period a year earlier. Newly revised
national accounts show that real GDP grew by an estimated 8.7
percent in 1992--about the same as in 1991. However, economic
activity has slowed in recent months. Imports during the first
three months of 1993 were 13 percent higher than a year earlier,
while exports grew by 5 percent over the same period; the trade
deficit widened to $240 million in the first quarter, from only $34
million a year earlier.
In early May, the Argentine government, in an effort to
stimulate investment and productivity growth, eliminated tariffs and
document taxes on imported capital goods, and established a 15
percent tax rebate for domestically produced capital goods. On
June 7, the government launched a public offering of 45 percent of

IV-31
shares in the state oil enterprise, which has an estimated total net
worth of $7 billion. Proceeds from the offering will be used to
repay debts to pensioners and provincial governments.
Real GNP in Taiwan grew 6.2 percent in the first quarter from a
year earlier, down moderately from a 6.9 percent pace for the same
period last year. Export growth continues to slow, with the value
of exports growing about 6 percent in the first five months of 1993
compared with the same period last year. Over the same period,
import growth also slowed to 13 percent, and Taiwan's trade balance
fell $1.7 billion to a $3 billion surplus.
Weaker activity helped lower 12-month consumer price inflation
to 2 percent in May, compared with a 2.7 percent increase in April
and a 3.4 percent rise (Dec./Dec.) for 1992.
The New Taiwan dollar weakened further in June. It stood at
26.39 to the dollar on June 30, a depreciation of 3.9 percent from
the end of 1992. The recent depreciation is a departure from 1990-
92 trends, when the NT dollar appreciated about 6.3 percent. Recent
weakness in the currency, in part, reflects continuing heavy capital
outflows, principally to China. Official data show outflows of more
than $500 million to China in the first five months of 1993, eight
times the total for the similar period last year. Such totals,
moreover, likely understate greatly actual outflows, since the bulk
of these go unreported to evade taxes (on subsequent earnings).
Following elections last December that resulted in a
significant opposition presence in Taiwan's legislature for the
first time, lawmakers on May 28 cut a modest $1.6 billion from
Taiwan's FY94 budget (originally proposing $42.6 billion in
spending), the first time such a cut to central government budget
requests has ever been made.

IV-32
Chinese authorities raised interest rates about 2 percentage
points in mid-May, in an initial attempt to restrain the economy,
but 1-year yields (of slightly more than 9 percent) remain about
half current inflation trends. Industrial production in May rose
27.3 percent from a year earlier, and urban prices in the same month
continued rising at a 17 percent annual rate. China's trade balance
continues to deteriorate sharply, posting a $3 billion deficit in
the first five months of this year. In May, exports were up 10
percent from a year ago, while imports grew 34 percent. China's
exchange authority floated its swap center exchange rate June 1, and
the yuan subsequently depreciated 25 percent overnight in some
markets. Demand for foreign currency (and gold) is high in China as
unauthorized capital outflows continue and households seek inflation
hedges.
In Korea, growth improved somewhat in the first quarter but
remained quite low by historical standards. Real GNP increased 3.3
percent from a year earlier, up from a growth rate of 2.8 percent in
the fourth quarter. Export growth appeared to have accelerated,
while consumption growth held steady; although fixed investment fell
for the fourth consecutive quarter, the dropoff was less than in the
fourth quarter of last year. In the year through May, consumer
price inflation was 4.5 percent, down from 7.1 percent for the first
five months of 1992. The current account deficit narrowed to $518
million in January-May from $4 billion in the same period last year,
reflecting the government's contractionary economic policies;
exports grew about 8 percent, while imports fell 2 percent.
Indicators show U.S. demand accounting for most of the pickup in
exports.