Fomc 19910703 g Bpt 119910626
42
Prefatory Note The attached document represents the most complete and accurate version available based on original copies culled from the files of the FOMC Secretariat at the Board of Governors of the Federal Reserve System. This electronic document was created through a comprehensive digitization process which included identifying the best- preserved paper copies, scanning those copies, 1 and then making the scanned versions text-searchable. 2 Though a stringent quality assurance process was employed, some imperfections may remain. Please note that this document may contain occasional gaps in the text. These gaps are the result of a redaction process that removed information obtained on a confidential basis. All redacted passages are exempt from disclosure under applicable provisions of the Freedom of Information Act. 1 In some cases, original copies needed to be photocopied before being scanned into electronic format. All scanned images were deskewed (to remove the effects of printer- and scanner-introduced tilting) and lightly cleaned (to remove dark spots caused by staple holes, hole punches, and other blemishes caused after initial printing). 2 A two-step process was used. An advanced optimal character recognition computer program (OCR) first created electronic text from the document image. Where the OCR results were inconclusive, staff checked and corrected the text as necessary. Please note that the numbers and text in charts and tables were not reliably recognized by the OCR process and were not checked or corrected by staff.
-
Upload
fraser-federal-reserve-archive -
Category
Documents
-
view
214 -
download
1
Transcript of Fomc 19910703 g Bpt 119910626

Prefatory Note
The attached document represents the most complete and accurate version available based on original copies culled from the files of the FOMC Secretariat at the Board of Governors of the Federal Reserve System. This electronic document was created through a comprehensive digitization process which included identifying the best-preserved paper copies, scanning those copies,1 and then making the scanned versions text-searchable.2 Though a stringent quality assurance process was employed, some imperfections may remain.
Please note that this document may contain occasional gaps in the text. These gaps are the result of a redaction process that removed information obtained on a confidential basis. All redacted passages are exempt from disclosure under applicable provisions of the Freedom of Information Act.
1 In some cases, original copies needed to be photocopied before being scanned into electronic format. All scanned images were deskewed (to remove the effects of printer- and scanner-introduced tilting) and lightly cleaned (to remove dark spots caused by staple holes, hole punches, and other blemishes caused after initial printing). 2 A two-step process was used. An advanced optimal character recognition computer program (OCR) first created electronic text from the document image. Where the OCR results were inconclusive, staff checked and corrected the text as necessary. Please note that the numbers and text in charts and tables were not reliably recognized by the OCR process and were not checked or corrected by staff.

Strictly Confidential (FR) Class II FOMC
June 26, 1991
SUMMARY AND OUTLOOK
Prepared for the Federal Open Market Committee
By the staff of the Board of Governors of the Federal Reserve System
DOMESTIC NONFINANCIAL DEVELOPMENTS
Overview of the Staff Forecast
Evidence has accumulated in recent weeks that the recession has ended
and that the economy is entering the recovery phase of the business cycle.
Real GNP probably has been little changed in the second quarter, and we
expect that it will rise at about a 4-1/2 percent annual rate, on average,
in the second half of the year. The growth of final sales is expected to
remain relatively subdued, but, as typically occurs in the early stages of
an expansion, a swing in inventory investment is projected to provide
considerable impetus to output growth. The swing in inventory investment
from substantial liquidation to modest accumulation accounts for half of the
increase projected for real GNP in the second half of 1991.
Economic activity is projected to decelerate appreciably next year.
The rate of increase in real final sales is expected to change little; but
with sales and production having moved into closer balance, inventory
accumulation will provide a lessening boost to output. On net, real GNP is
expected to increase a little less than 3 percent over the course of 1992--
only moderately above the staff's estimate of the economy's longer-run
growth potential.
The reasons to expect a relatively modest recovery in economic activity
are numerous and familiar. Consumers already have stretched to maintain
their spending in the face of recent declines in real disposable income;
thus their ability to provide impetus to expansion is doubtful.
Construction activity will be held down by the overhang of vacant space and
by the reluctance of lenders to finance new projects. Under the limitations

I-2
set by the new federal budget procedures, fiscal policy will remain
restrictive, and budgetary corrections at the state and local levels will
impose an additional drag on aggregate demand. The stimulus from monetary
policy probably has been less marked to date than in the periods preceding
other upturns, and we have not built in any further easing, in contrast to
what has occurred in the initial phases of some other recoveries. Moreover,
the dollar has strengthened further, reducing the scope for a significant
lift to domestic production from the external sector in the quarters ahead.
The moderate expansion in activity--and the resultant sustained slack
in labor and product markets--should contribute to a significant diminution
in the trend rate of inflation. Year-over-year changes in consumer prices
have remained around 5 percent to date; but month-to-month increases have
been much slower of late, and inflation expectations appear to have edged
down. Increased unemployment evidently is damping wage gains, and the
appreciation of the dollar is restraining increases in the prices of
imported goods and their domestic substitutes. All told, the staff expects
that the underlying trend of price increases will move significantly below
4 percent next year.
Key Assumptions
The policy assumptions underlying this forecast are essentially the
same as in the May Greenbook. With regard to monetary policy, we continue
to assume that the federal funds rate will remain near 5-3/4 percent through
1992. The recent rise in bond yields seems to have reflected in large
measure an adjustment of market expectations of the recovery to something
closer to our forecast than previously was the case, but there remains a
risk that strong economic news will produce some further upward pressure in

I-3
coming months. However, in light of the underlying degree of restraint on
aggregate demand from the sources described above, any significant movement
in that direction appears unlikely to be sustained for long. Indeed, we
have projected that bond yields in 1992 will be significantly below current
levels as the expansion moderates and disinflationary trends are fully
recognized. Credit availability problems are assumed to ease gradually as
the expansion progresses and asset quality improves.
As in the May Greenbook, growth in M2 over 1991 is projected to be
about in line with the growth of nominal GNP, with the effects of declines
in short-term interest rates since the fourth quarter of 1990 about
offsetting the effect of the continuing constriction in depository
intermediation; this would place the aggregate just in the upper half of its
range of 2-1/2 to 6-1/2 percent. The growth of M3 in 1991 is projected at
around the midpoint of its 1 to 5 percent range, as it continues to be held
down by modest growth in bank credit and sizable RTC activity for the year
as a whole. The staff foresees M2 growing slightly more rapidly in 1992
than in 1991; with short-term interest rates flat and no longer boosting
money demands, the pace of M2 growth is still somewhat below the faster
growth of nominal income. M3 will likely maintain its pace of 1991 as the
restructuring of the thrift industry continues.
On the fiscal side, we continue to assume that the FY1992 budget will
adhere closely to the budget act (OBRA) of 1990. As a result, federal
fiscal policy is expected to impose a moderate amount of restraint on
aggregate demand over the next year and a half--and beyond. The staff has
reduced its estimate of the unified budget deficit in FY1991 to
$255 billion, largely because Desert Storm contributions from other

I-4
countries have come in somewhat faster than we had anticipated and outlays
for deposit insurance have been a bit lower. The speedup of Desert Storm
contributions implies an upward revision to the projected deficit for
FY1992; but receipts also have been raised, and the staff's FY1992 deficit
projection, at $304 billion, is little changed from the May Greenbook.
Excluding Desert Storm and outlays for deposit insurance, the deficit is
expected to be $213 billion in FY1991 and $182 billion in FY1992.
The dollar has risen, on net, in recent weeks; while some of the
increase is expected to unwind in the near term, the projected path of the
dollar through next year is now about 5 percent higher, on average, than in
the May forecast. We have made only minor changes to the projections for
economic activity in the other G-10 countries: Output is expected to
strengthen, on average, in the second half of this year after its recent
weakness and to expand at a fairly brisk pace in 1992. Crude oil prices
have fallen slightly since the time of the May Greenbook, resulting in an
average posted price in the second quarter for West Texas Intermediate (WTI)
of about $19.50 per barrel; we expect the WTI price to hold near that level
through next year.
The Current Quarter
The staff still estimates that real GNP has been essentially unchanged
in the second quarter, even though the incoming data on domestic production
and spending have been stronger than we anticipated in the May Greenbook.
The effects of that positive surprise on GNP have been largely offset in
this forecast by a sharp downward revision to the expected growth of the
services component of net exports. This revision is the result of a bulge
in the profits earned abroad by U.S oil companies in the fourth and first

I-5
quarters and the anticipated return to more normal profit levels in the
second quarter. Gross domestic product (GDP) excludes such transactions and
is a measure of the pace of domestic activity; our forecast shows GDP rising
about 1-1/2 percent in the current quarter--up from a forecast of no change
in the May Greenbook.
PROJECTIONS OF NEAR-TERM OUTPUT(Percent change from preceding quarter; annual rate)
1990 1991
Q4 Q1 Q2 Q3
Real GNP -1.6 -2.8 .2 4.8(May Greenbook) -1.6 -2.8 -.2 4.1
Real GDP -2.1 -3.0 1.6 4.7(May Greenbook) -2.1 -2.9 0 4.1
*The first-quarter figures on this and subsequent texttables incorporate the final NIPA estimates released today.
Recent labor market indicators point to a turnaround in the economy.
In May, aggregate hours worked rebounded nearly 1 percent, reflecting both a
small increase in private employment--the first in nearly a year--and a
lengthening in the average workweek. Moreover, after smoothing through the
gyrations in the latest monthly figures, the unemployment rate has been
essentially flat since March. Data on unemployment insurance and other
information suggest a continuation of the firmer labor market conditions in
June.
As in the May Greenbook, the pickup in motor vehicle production from
its first-quarter low is expected to have added about 1 percentage point to
second-quarter real GNP growth. In the terms of GNP expenditure categories,
some of the additional output is reflected in increased purchases of cars

I-6
and trucks, but it shows up mainly as a smaller decumulation of dealer
inventories. In contrast, stocks in other sectors appear to have run off
more rapidly than in the first quarter, and the total nonfarm inventory
liquidation likely was somewhat greater than in the first quarter.
Meanwhile, domestic final purchases appear to have expanded moderately.
In particular, aggregate consumer spending has turned up and is expected to
have risen about 3 percent in the second quarter. Apart from the increase
in sales of motor vehicles, the reports on retail sales in April and May
point to a firming in outlays for other goods. In addition, services have
probably posted a large rise this quarter, given the sizable gains in these
outlays in March and April and the likelihood that the hot weather in May
pushed spending on electricity well above its seasonal norm. Domestic
spending also is expected to have been buoyed by a small increase in
expenditures on residential structures, after an extended period of steep
declines; the effects of the uptrend in starts and sales of single-family
homes are anticipated to have more than offset the continued weakness in the
multifamily area.
Business fixed investment is likely to have fallen a bit further this
quarter. For equipment spending, nominal shipments of office and computing
equipment have declined, on net, in recent months; nonetheless, given the
price cuts announced by the major manufacturers, outlays probably rose in
real terms. Meanwhile, spending for industrial and other equipment has
remained weak. In the nonresidential structures sector, construction put-
in-place reportedly recorded a big gain in April; however, in light of the
weak trends in contracts and permits, we have built in sizable declines over
the balance of the quarter.
I-7
Real net exports of goods and services probably have declined
appreciably in the second quarter, reflecting the aforementioned movement in
the service accounts. Fragmentary data suggest that net exports of goods
are likely to have been little changed.
As for inflation, price increases in recent months have been small, and
for the second quarter as a whole, we expect that the CPI will have risen
only about 2-1/4 percent at an annual rate. With prices advancing
considerably less rapidly than wages, real disposable income is expected to
have turned up--the first quarterly increase since the second quarter of
last year.
The Outlook
Real GNP growth is projected to approach 5 percent at an annual rate in
the third quarter. To be sure, there is only limited evidence at this stage
that so sizable a step-up in production is in train. Perhaps most promising
is the increase in durable goods orders over April and May; this development
is consistent with our assessment that inventory positions are lean enough
to encourage firms to begin bringing production into closer alignment with
sales. Indeed, we anticipate that the pace of liquidation will slow
markedly this summer and that firms will begin to rebuild stocks before
year-end.

PROJECTIONS OF REAL GNP AND FINAL SALES(Percent change from end of preceding comparable period; annual rate)
1991 1992
Ql Q2 Q3 Q4 HI H2
Real GNP -2.8 .2 4.8 4.1 3.0 2.5
Final sales -2.9 .9 2.7 1.7 2.2 2.6
In the motor vehicles sector, where stocks of new cars have dropped to
their lowest levels in many years, automakers have scheduled a hefty
increase in assemblies in the third quarter. Although experience suggests
that discounting these plans somewhat is prudent, we still expect output of
motor vehicles to rise enough to add 1-1/2 percentage points to real GNP
growth in the third quarter. We have also built in a marked slowing in the
run-off of nonauto inventories, and this contributes another 1-1/2 percent-
age points to real growth in the third quarter.
Real GNP growth is expected remain at 4 percent in the fourth quarter
but to taper off thereafter, averaging about 2-3/4 percent for 1992 as a
whole. This upturn would be rather subdued by historical standards, but its
dynamics would be similar in many respects to those of other postwar
expansions. Inventory liquidation ceases and is followed by a resumption of
stock building; this process generates jobs and income that should support
growth in household spending. Lower interest rates and continued income
gains stimulate housing demand and homebuilding. Business investment
strengthens in response to improving sales trends.
The forecast continues to anticipate an appreciable slowing in wage and
price inflation over the next year and a half. Rising productivity should

I-9
account for a good part of the increased output in the near term, and the
unemployment rate is likely to fall only to the vicinity of 6-1/2 percent by
the end of 1991. With real output growing only somewhat faster than its
longer-run potential in 1992, the jobless rate should remain above 6-1/4
percent. As a result of this slack and further reductions in inflation
expectations, increases in hourly compensation are expected to slow
steadily. Consumer price inflation is anticipated to hover around 4 percent
in the second half of 1991 and to slow over the course of 1992, to about
3-1/2 percent in the second half.
PROJECTIONS OF INFLATION(Percent change from end of preceding comparable period; annual rate)
1991 1992
Q1 Q2 Q3 Q4 H1 H2
Consumer price index 3.6 2.2 4.0 3.8 3.9 3.5
CPI ex. food andenergy 6.8 3.2 4.1 4.1 4.0 3.5
ECI hourly compensation 4.6 4.2 3.9 3.8 3.7 3.6
Civilian unemploymentrate (percent) 6.5 6.8 6.8 6.6 6.4* 6.3*
*Final quarter of period.
Consumer spending and income. Real consumer expenditures are expected
to rise less than 2-1/2 percent at an annual rate in the second half of 1991
and to pick up only a little next year. The projection of a mild increase
in consumption largely reflects our assumption that growth in real
disposable income will be quite moderate. The saving rate has fallen since
mid-1990, and, even if it were to be revised upward at some point--as has
happened frequently in the past--it probably would still be low by

I-10
historical standards. Barring a sharp rise in household wealth--not
anticipated in this forecast--a significant decline in the saving rate seems
unlikely.
Among the components of PCE, purchases of cars and light trucks are
expected to increase somewhat further over the next several quarters. In
general, however, we do not expect the surge in outlays for durables that
occurred in some of the previous cyclical upturns; this expectation seems
reasonable in light of our income forecast and of the very high level of
durables outlays during much of the 1980s, but it may constitute something
of an upside risk to the forecast.
Business fixed investment. Real BFI is expected to rise moderately
over the the second half of 1991. Spending on equipment is expected to be
paced by relatively robust real outlays for computers and by increased
business purchases of motor vehicles. Also, given the recent firming in
orders for industrial and other equipment, actual outlays are expected to
improve by late 1991. Construction activity, meanwhile, is anticipated to
stay weak.
In 1992, we project real BFI to increase about 6 percent. Equipment
outlays are expected to rise 8-1/2 percent, as the continued expansion of
aggregate output and improved cash flow prompt a broad advance in spending.
Meanwhile, the decline in structures investment is expected to slow somewhat
over the course of the year. Although a number of major industries are
facing serious excess capacity, rising activity and capacity utilization
likely will stimulate additional plant construction in some sectors.
Furthermore, contracts for nonoffice commercial space have already shown
signs of firming, and absorption in some locales may be sufficient by next

I-11
year to stem the decline in this sector. Construction of office buildings
and hotels, however, is likely to remain depressed because of continued high
vacancy rates, low rents, and reluctant lenders (many of whom have become
reluctant owners recently).
Housing. The projection for housing remains relatively lackluster,
with starts expected to increase only to about 1.2 million units by the end
of 1992--the same as the figure for 1990 as a whole. Virtually all of the
improvement is in the single-family sector. Demand for new homes is
expected to respond gradually to rising employment and incomes and, in 1992,
to declining mortgage interest rates. In addition, declines in house prices
over the past couple of years have made homes much more affordable in some
locales; the perception that prices are weak would, of course, make houses
an unattractive investment, but the staff is expecting that the recent
indications of a bottoming out in prices are presaging a period of moderate
price increases. The outlook for multifamily construction remains poor:
The surplus of unoccupied units should diminish somewhat over the projection
period, but vacancy rates will remain high by historical standards, in part
because of the relatively slow growth in the population of young adults.
Also, lenders are expected to remain cautious in funding new projects.
Government sector. Federal spending on goods and services is expected
to trend downward at an appreciable pace after the second quarter. The Gulf
war temporarily boosted defense purchases, but the cutbacks in
appropriations over the past few years and the nlanned force reductions
point to a sizable decline in procurement and personnel outlays from here
on. Nondefense purchases are expected to rise faster than GNP because of
increases in spending on space exploration, law enforcement, and health

I-12
research. Overall, however, real purchases are projected to fall at a
4 percent annual rate between mid-1991 and the end of 1992.
State and local governments also are taking actions to cope with
budgetary problems stemming from structural imbalances as well as temporary
difficulties brought on by the recession. In our forecast, real purchases
of goods and services are held essentially flat over the next couple of
quarters and post only a small increase next year, despite continued
strong pressures for increases in public services and for infrastructure
improvements; this trajectory for purchases would be unusually weak for a
cyclical upturn. Also, many governments are raising taxes, and we have
built in some further increases in income and sales taxes next year. These
actions, in combination with the recovery in business activity, are expected
to bring the sector's budget--as measured by the NIPA operating and capital
accounts (excluding social insurance)--into balance by late 1992.
Net exports. The external sector now is expected to impart a small
damping influence on the economic expansion over the next six quarters.
Nonagricultural merchandise exports are expected to be fairly robust over
this period, given the pickup in activity abroad. However, non-oil
merchandise imports, which probably have fallen, on net, over the first half
of 1991, are expected to more than retrace these declines during the second
half of this year and to continue to rise briskly in 1992 as the U.S.
business expansion takes hold and import price increases remain small. A
more detailed discussion of these projections is presented in the
International Developments section.
Labor costs and prices. Hourly compensation (as measured by the
employment cost index) has decelerated noticeably to a 4-1/4 percent annual

I-13
rate in recent quarters and is expected to edge below 4 percent in the
second half of 1991. In 1992, with hiring more widespread and unemployment
drifting down, the downward pressure on wages from labor market slack is
expected to diminish a bit. With inflation expectations declining, the ECI
is still anticipated to slow appreciably further--to just over 3-1/2 percent
in the second half.
Consumer price inflation is expected to slow significantly over the
forecast period. Food prices are projected to rise at about the overall
rate of inflation, barring major demand or supply shocks, and retail energy
prices are expected to rise only about 3 percent per year. Excluding food
and energy, CPI inflation is forecast to run about 4 percent over the rest
of 1991 and to move down to 3-1/2 percent in the second half of 1992. This
improvement in underlying price performance reflects the lingering slack in
the labor market and in industrial capacity utilization, as well as
continued intense competition from foreign producers. Pressures on prices
are also expected to be damped to some extent by above-trend growth in labor
productivity. Output per hour is expected to rise at more than a 3 percent
rate, on average, in the second half of 1991. And although productivity
gains are expected to slow in 1992, the trend in unit labor costs should
continue to improve, so that firms can raise their profit margins with only
moderate increases in prices.
A Note on the Forecast in 1987 Prices
As discussed in Part II of the Greenbook, the Commerce Department will
shift the GNP data to a 1987 basis when it releases the benchmark revisions
to the National Income and Product Accounts next fall. Current BEA
estimates indicate a slightly larger drop in real GNP, on net, over the

I-14
fourth quarter of 1990 and the first quarter of 1991, measured in 1987
prices. The implications for the seven quarters of the forecast, however,
appear to be small because growth is expected to be relatively well-balanced
across sectors. Thus, although revisions could complicate the picture, the
rebasing of the data should not itself significantly distort comparisons of
the Committee's July Humphrey-Hawkins projections with the actual outcome to
be discussed next February.
Details of the staff projection are shown on the green sheets, pages
I-15 to I-21. The 1991:Q1 figures shown on these tables do not incorporate
the revised NIPA data released today. To assist the Committee's Humphrey-
Hawkins discussions, the table below shows four-quarter projections that
incorporate today's NIPA data. For the most part, the effects of the
revisions are microscopic and disappear in rounding.
GNP AND RELATED ITEMS(Percent change; fourth quarter to fourth quarter)
1991 1992
Nominal GNP 5.3 6.1
Real GNP (1982 dollars) 1.5 2.8
Real GNP (1987 dollars) 1.6 2.7
Implicit deflator (1982 dollars) 3.7 3.2
Fixed weight GNP price index 3.9 3.5(1982 dollars)

I-15
June 26, 1991CONFIDENTIAL - FR
CLASS II FOMC STAFF GNP PROJECTIONS'-----~I---'------- ~--------~----------- - - - - - - - - - - - - - - - - - - - - - - - - - - - - - - - - - - - - - - - - - - - - -
Percent changes, annual rate
GSP fixed-weight Consumer UnemploymentNominal GNP Real GNP price index Price Index <1> rate
(percent)
5/8/91 6/26/91 5/8/91 6/26/91 5/8/91 6/26/91 5/8/91 6/26/91 5/8/91 6/26/91-- -- -- - ----- --- ---- .. .. . - -- - - - - - - -.. . . . . . . . . . . .-- - - -- - --------- - --- -- -. . --- -- - -- --- -- - -- --- -- - --- .. . .. . . --...---...-_-- ---... . . . .. . .-
Annual changes:
1988 <2> 7.91989 <2> 6.71990 <2> 5.1
1991 3.71992 6.4
Quarterly changes:
1989 01 <2> 7.502 <2> 5.8Q3 <2> 5.1
Q4 <2> 3.9
'90 Q1 <2>02 <2>Q3 <2>Q4 <2>
1991 Q1 <2>Q2Q304
1992 01Q2Q3Q4
1.7.4
1.4-1.6
-2.8-. 24.14.0
3.53.12.82.6
1.7.4
1.4-1.6
-2.6.2
4.84.1
3.32.72.62.5
5.3 5.35.3 5.35.6 5.65.9 5.9
6.5 6.56.8 6,86.8 6.86.6 6.6
6.4 6.56.3 6.46.3 6.46.2 6.3
Two-quarter changes: <3>
1989 02 <2> 6.7 6.7Q4 <2> 4.5 4.5
1990 Q2 <2> 5.9
Q4 <2> 3.1
1991 Q2 2.804 7.4
1992 02 6.6
04 5.3
Four-quarter changes: <4>
1988 Q4 <2> 7.81989 Q4 <2> 5.6"990 Q4 <2> 4.5
91 Q4 5.112 Q4 5.9
1.1 1.1-. 1 -.1
-1.54.0
3.3
2.7
3.51.8
.51.23.0
4.7 4.73.4 3.4
5.3 5.34.4 4.4
-1.24.4
3.02.5
5.6 5.66.9 6.9
3.1 2.93.8 3.9
3.7 3.8
3.1 3.5
<1> For all urban consumers.
<2> Actual.<3> Percent change from two quarters earlier.
<4> Percent change from four quarters earlier.
.0 .0
.0 .0
.0 .0
.6 .6
.9 .9-. 2 -. 2
-. 3 -. 2-. 1 -. 1

I-16
June 26, 1991CONFIDENTIAL - FR GROSS NATIONAL PRODUCT AND RELATED ITEMSCLASS II FOMC (Seasonally adjusted; annual rate)
Projection
Units 1984 1985 1986 1987 1988 1989 1990 1991 1992
EXPENDITURES------------ I INominal GNP Billions of $ 3772.2 4014.9 4231.6 4515.6 4873.7 5200.8 5465.1 5677.0 6052.4Real GNP JBillions of 8256 3501.4 3618.7 3717.9 3845.3 4016.9 4117.7 4157.3 4163.1 4296.0
I IReal GNP iPercent change*l .5.1 3.6 1.9 5.0 . 3.5 1.8 .5 1.6 2.8Gross domestic purchases I 6.4 4.3 2.1 4.2 2.6 1.1 -.5 1.5 3.0
Final sales 4.7 4.6 2.7 3.1 4.5 1.7 1.6 .6 2.4Private dom. final purchases 5.6 4.6 2.9 2.5 4.0 1.2 -.1 .7 3.5
Personal consumption expend. 4.1 4.6 3.8 2.3 4.1 1.2 .1 1.7 2.8Durables 10.8 7.0 11.5 -1.2 9.3 -1.4 -1.8 .9 4.1Nondurables . I 2.3 3.3 2.9 1.3 2.4 .6 -2.4 .2 2.0Services 3.5 5.0 2.1 4.1 3.7 2.4 2.5 2.9 2.8
Business fixed investment I 13.8 3.7 -5.5 6.1 5.3 4.5 2.2 -3.7 5.9Producers' durable equipment. 14.9 4.6 .4 8.2 8.2 5.4 4.6 -2.7 8.6Nonresidential structures 11.8 1.9 -17.7 .8 -2.7 1.7 -5.4 -7.2 -4.0
Residential structures I .1 5.8 11.6 -2.2 -.1 -7.1 -10.2 -.8 8.8
Exports I 5.9 -2.4 10.6 19.8 14.0 10.1 5.8 2.7 6.0Imports 17.4 4.5 10.0 10.4 5.5 4.5 -.5 1.9 7.6
Government purchases 7.9 8.6 3.1 2.0 1.1 .3 3.8 -.5 -1.0Federal 13.0 13.3 .5 1.5 -1.6 -2.8 5.2 -.7 -4.5
Defense | 6.5 7.1 6.0 4.0 -1.8 -2.1 4.0 -2.8 -7.7State and local 4.4 4.9 5.2 2.3 3.1 2.6 2.7 -. 3 1.6
Change in business inventories IBillions of 82$5 62.3 9.1 5.6 22.8 23.6 23.8 -3.6 -12.2 30.4Nonfarm IBillions of 82$1 57.8 13.4 8.0 28.7 26.5 18.7 -5.1 -14.3 28.1
Net exports Billions of 82$1 -84.0 -104.3 -129.7 -118.5 -75.9 -54.1 -33.8 -1.2 -10.71 1
Nominal GNP IPercent change*l 8.6 6.6 4.6 8.2 7.8 5.6 4.5 5.3 6.11 I
EMPLOYMENT AND PRODUCTION I--------------------- I
Nonfarm payroll employment IMillions 94.5 97.5 99.5 102.2 105.5 108.4 110.3 109.2 110.9Unemployment rate IPercent 7.5 7.2 7.0 6.2 5.5 5.3 5.5 6.7 6.4
Industrial production index Percent change*1 4.7 1.9 1.4 6.5 4.5 1.1 .3 .6 4.3Capacity utilization rate-mfg, |Percent 80.4 79.5 79.0 81.4 83.9 83.9 82.3 78.1 79.3
I 1Housing starts Millions 1 1.77 1.74 1.81 1.62 1.49 1.38 1.19 1.01 1.15Auto sales Millions 10.35 11.03 11.44 10.23 10,65 9.89 9.53 8.69 9.43
Domestic IMillions 7.92 8.22 8.22 7.06 7,55 7.06 6.92 6.31 6.85Foreign IMillions . 2.43 2.82 3.22 3.18 3.10 2.83 2.61 2.38 2.58
INCOME AND SAVING- - - - -- -- - -
Nominal personal income iPercent change*l 8.4 6.6 5.8 8.1 7.6 6.8 5.6 4.6 6.8Real disposable income )Percent change*l 4.3. 2.7 3.3 2.7 4.3 1.7 -.4 1.2 2.8Personal saving rate JPercent 1 6.1 4.4 4.1 2.9 4.2 4.6 4.6 3.9 4.0
I ICorp. profits with IVA & CCAdj JPercent change*l 7.4 9.2 -5.6 17.4 8.2 -16.8 -.7 16.4 4.1
Profit share of GNP 1Percent 7.1 7.0 6.7 6.8 6.9 6.0 5.5 5.4 5.7
Federal govt. surplus/deficit IBillions of $ -169.6 -196.9 -206.9 -158.2 -141.7 -134.3 -166.0 -144.5 -149.7State and local govt. surplus I 1 64.6 65.1 62.8 51.0 46.5 46.4 35.4 41.0 70.0Exc. social insurance funds 19.8 13.8 5.6 -8.3 -16.4 -19.9 -34.0 -31.5 -6.1
PRICES AND COSTS--------------- I IGNP implicit deflator 1Percent change*l 3.4 2.9 2.6 3.0 4.1 3.7 4.0 3.7 3.2GNP fixed-weight price index I I 3.7 3.3 2.6 3.8 4.6 4.0 4.8 3.9 3.5Cons. 4 fixed invest, prices I 3.3 3.4 2.5 4.5 4.3 4.3 5.3 3.2 3.4
CPI 4.2 3.5 1.3 4.5 4.3 4.6 6.3 3.4 3.7Exc. food and energy 5.0 4.3 3.9 4.3 4.5 4.3 5.3 4.6 3.7
ECI hourly compensation 4.9 3.9 3.2 3.3 4.8 4.8 4.6 4.1 3.7
Nonfarm business sectorOutput per hour I 1.5 1.6 1.3 2.3 1.8 -1.6 -.3 2.6 1.6Compensation per hour 4.1 4.6 4.9 3.7 4.2 2.2 4.4 4.2 3.8Unit labor costs 2.6 3.0 3.6 1.4 2.3 3.9 4.7 1.5 2.2
* Percent changes are from fourth quarter to fourth quarter.

I-17
CONFIDENTIAL - FRCLASS II FOMC
GROSS NATIONAL PRODUCT AND RELATED ITEMS(Seasonally adjusted; annual rate)
June 26, 1991
1988 1989 1990-nits I Q Q2 Q3 -4 Q1 -2 Q3 -4 Q1 -2
1 Units ( 01 Q2 03 Q4 01 02 Q3 04 01 02
PRICES AND COSTS
GNP implicit deflatorGNP fixed-weight price indexCons. & fixed invest, prices
CPIExc. food and energy
"CI hourly compensation*
3nfarm business sectorOutput per hourCompensation per hourUnit labor costs
IPercent change 1 2.7 4.43.9 4.72.9 4.93.2 4.54.1 4.7
5.2 5.2
4.7 -. 52.4 5.1
-2.2 5.7
4.7 3.94.4 4.95.0 5.04.4 5.14.6 4.9
5.1 - 4.2
3.9 3.2 3.8 4.8 4.74.6 3.1 3.8 6.6 3.95.3 2.3 4.6 6.8 2.66.0 3.3 3.9 7.5 3.84.2 3.8 4.7 5.9 4.9
4.9 5.3 4.4 5.6 5.1
.2 -2.7 -.3 -1.0 -2.5 -1.3 .33.8 3.3 1.7 1.6 2.3 3.9 5.03.6 6.1 2.0 2,6 5.0 5.3 4.7
* Not at an annual rate.** Private industry workers
EXPENDITURES
Nominal GNP Billions of $ 4735.8 4831.4 4917.9 5009.8 5101.3 5174.0 5238.6 5289.3 5375.4 5443.3Real GNP IBillions of 82$1 3970.2 4005.8 4032.1 4059.3 4095.7 4112.2 4129.7 4133.2 4150.6 4155.1
Real GNP (Percent Change 5.1 3.6 2.7 2.7 3.6 1.6 1.7 .3 1.7 .4Gross domestic purchases 1.6 3.0 3.2 2.4 1.2 1.8 2.8 -1.2 .5 1.3
Final sales 7.1 5.1 1.1 4.6 2.4 1.7 1.8 .9 3.8 -.7Private dom. final purchases 6.7 4.8 3.0 1.7 .8 1.4 4.1 -1.5 2.4 -1.2
Personal consumption expend. I' 6.9 2.7 3.5 3.5 -.3 1.3 4.6 -.8 1.1 .2Durables I 21.8 3.7 -1.1 14.1 -6.0 5.6 9.6 -13.0 14.4 -9.5Nondurables I 2.6 2.0 4.1 1.2 .6 -1.7 3.9 -.2 -3.2 -1.9Services 5.6 2.9 4.5 1.9 .9 2.1 3.5 3.1 .1 5.1
Business fixed investment 11.4 15.7 1.6 -6.3 8.9 6.9 6.3 -3.8 5.0 -4.7Producers' durable equipment 20.3 17.9 2.2 -5.5 9.5 12.2 6.1 -5.2 5.7 -3.3Nonresidential structures I -10.5 9.9 -.3 -8.7 7.5 -8.2 7.1 1.3 2.3 -9.0
Residential structures I -6.8 6.8 .4 -.4 -3.6 -11.3 -7.6 -5.5 15.1 -11.2
Exports 31.7 4.4 5.4 16.7 15.8 12.4 -.5 13.5 11.2 -5.0Imports .5 .3 9.2 12.4 -2.3 12.8 6.4 1.7 2.5 .7
Government purchases i 1 -9,2 3.3 -3.8 15.7 -3.3 4.0 -2.4 3.0 2.9 6.2Federal -24.1 3.5 -10.4 33.6 -9.1 7.0 -7.9 -.4 .4 16.4
Defense -5.6 -1.4 -5.0 4.9 -10.9 3.2 7.2 -7.0 -1.7 3.3State and local 3.9 3.2 1.2 4.3 1.3 1.8 1.8 5.6 4.8 -. 6
Change in business inventories IBillions of 82$1 31.0 16.9 32.6 14.0 26.1 25.5 24.6 18.9 -2.2 9.5Nonfarm [Billions of 825$ 28,8 19.2 31.0 27.2 16.4 21.5 21.7 15.3 -8.2 11.6
Net exports (Billions of 82$1 -77.3 -72.2 -78.5 -75.7 -51.1 -53.3 -64.1 -47.9 -35.4 -44.6
Nominal GNP IPercent change 7.8 8.3 7.4 7.7 7.5 5.8 5.1 3.9 6,7 5.1
EMPLOYMENT AND PRODUCTION--------- ---------------- INonfarm payroll employment IMillions 104.3 105.1 105.9 106.8 107,6 108.1 108.5 109.0 109.7 110.2Unemployment rate (Percent* 57 5.5 5.5 5.3 5.2 5.3 5.3 5.3 5.3 5.3
Industrial production index IPercent change I 5.0 4.2 5.9 2.8 2.7 2.8 -1.2 .2 .6 4.2Capacity utilization rate-mfg. (Percent* 1 83.1 83.6 84.3 84.6 84.7 84.5 83.7 82.9 82.7 82.8
Housing starts IMillions 1 1.43 1.49 1.48 1.55 1.46 1.36 1.35 1.35 1.43 1.20Auto sales (Millions 1 10.91 10.67 10.15 10.88 10.03 10.26 10.20 9.09 10.01 9.53Domestic (Millions 7.60 7.50 7.20 7.89 7.08 7.26 7.36 6.56 7.11 6.78Foreign IMillions 3.30 3.17 2.95 2.99 2.95 3.00 2.84 2.53 2.90 2.75
INCOME AND SAVING
Nominal personal income ]Percent change 6.4 8.6 8.1 7.4 11.6 5.8 3.7 6.2 8.6 5.3Real disposable income IPercent change 7.3 2.7 4.9 2,3 4.2 -1.2 2.7 1.2 2.5 .3Personal saving rate IPercent* 4.0 4.1 4.5 4.1 5.2 4.6 4.1 4.6 4.9 5.0
Corp. profits with IVA & CCAdj IPercent change 9.5 6.6 -1.7 19.5 -23.2 -7.0 -17.1 -19.1 8.4 13.9Profit share of GNP IPercent* 7.0 7.0 6.8 7.0 6.4 6.2 5.9 5.5 5.5 5.6
Federal govt. surplus/deficit (Billions of $ -153.7 -136.9 -120.1 -156.3 -132.6 -122.7 -131.7 -150.1 -168.3 -166.0State and local govt. surplus I 45.5 48.3 46.8 45.2 48.9 50.3 48.1 38.5 38.1 38.6Exc. social insurance funds I -15.6 -14.1 -17.0 -19.0 -16.2 -15.6 -18.7 -29.1 -30.2 -30.4

I-18
CONFIDENTIAL - FRCLASS II FOMC
GROSS NATIONAL PRODUCT AND RELATED ITEMS(Seasonally adjusted; annual rate)
EXPENDITURES
Nominal GOPReal On
Real GNPGross doestic purchases
Final salesPrivate dom. final purchasea
Personal consumption expend.DurablesNondurablesServices
Business fixed investmentProducers' durable equipmentNonresidential structures
Residential structures
ExportsImports
Government purchasesFederalDefense
State and local
Projection----------- --------------- --------------------------
1990 1991 1992-- - - - - - - - - - - - - - - - - - - - - --- - - - - - - - - - - - - -
I nit*s 03 Q4 01 Q2 03 Q4 01 02 03 04
IBillions of $ 5514.6 5527.3 5561.7 5606.6 5717.2 5822.3 5925.1 6011.9 6095.1 6177.6SIillions of 82$ 4170.0 4153.4 4126.5 4128.9 4177.3 4219.7 4254.0 4282.9 4310.4 4336.9
Percent Change 1.4 -1.6 -2.6 .2 4.8 4.1 3.3 2.7 2.6 2.51.6 -5.1 -4.0 1.6 4.1 4.4 3.6 3.1 2.6 2.8
1.9 1.4 -2.8 .9 2.7 1.7 2.1 2.3 2.7 2.4
2.3 -3.8 -4.9 2.4 2.6 2.9 3.4 3.5 3.6 3.5
I 2.7 -3.4 -1.3 3.3 2.2 2.5 3.0 2.8 2.7 2.72.6 -12.3 -13.1 7.8 5.2 5.1 6.5 3.5 3.4 3.12.3 -6.5 -1.9 .3 1.2 1.2 1.8 2.2 2.1 2.13.0 1.8 3.0 4.1 2.0 2.5 2.7 2.9 2.9 2.9
8.9 .1 -15.9 -2.8 1.5 3.5 4.4 5.9 6.5 6.8S10.2 6.3 -18.2 -1.8 4.6 6.5 7.6 8.8 9.0 9.0
5.1 -18.2 -8.0 -6.1 -8.3 -6.5 -6.6 -4.7 -3.0 -1.9-19.8 -20.6 -24.1 3.9 12.1 9.5 8.2 9.1 9.5 8.3
6.9 11.0 -2.6 -. 9 6.4 8.3 6.4 6.1 5.8 5.97.6 -11.8 -11.3 8.0 1.9 10.5 8.6 8.2 5.9 7.6
1.2 4.7 -1.5 1.5 -. 4 -1.4 -1.4 -1.1 -. 9 -. 7.1 4.6 -1.3 4.1 -. 8 -4.6 -4.7 -4.6 -4.4 -4.5
2.7 12.1 1.7 -1.3 -3.7 -7.5 -7.8 -7.7 -7.5 -7.72.0 4.9 -1.7 -. 4 -. 1 .9 1.1 1.5 1.7 2.0
Change in business inventories IBllions of 82s$ 4.7 -26.4 -23.7 -30.5 -9.5 14.8 26.9 31.8 31.0 31.7Nonaaram BillionA of 8251 4,7 -28.5 -26.8 -32.6 -10.6 12.9 24.6 29.5 28.7 29.4exports IBilliona of 8261 -46.5 -8.8 6.4 -7.3 -.3 -3.6 -7.1 -10.6 -10.9 -14.1
inal GNP Percent change 5.3 .9 2.5 3.3 8.1 7.6 7.3 6.0 5.6 5.5
EMPLOYMENT AND PRODUCTION I..- „- --------------- INonfarm payroll employment Millions 1 110.2 109.8 109.2 108.8 109.1 109.7 110.2 110.7 111.1 111.5Unemployment rate IPrcent* 5.6 5.9 6.5 6.8 6.8 6.6 6.5 6.4 6.4 6.3
Industrial production index IPercent change 3.9 -7.0 -9.6 .0 7.2 5.7 5.1 4.8 3.8 3.7
capacity utilization rate-mfg. Ifrcent* r 2.9 80.8 78.0 77.4 78.2 78.7 79.0 79.3 79.4 79.5
Housing starts Millions 1.13 1.04 .92 .99 1.05 1.07 1.11 1.13 1.16 1.19Auto sales Millions 9.68 8.93 8.25 8.43 8.96 9.15 9.35 9.40 9.45 9.50
Domea iMillions 7.21 6.59 6.00 6.06 6.55 6.65 6.80 6.83 6.86 4.90Forcin IMillions 2.47 2.34 2.25 2.37 2.41 2.50 2.55 2.57 2.59 2.60
INCOME AND SAVING I------------ 1
Nominal personal income iPercent change f 5.0 3.5 1.6 4.2 5.4 7.3 8.4 6.3 6.2 6.5Real disposable income Percent change 1 -.7 -3.5 -1.8 2.2 1.3 3.2 3.9 2.4 2.4 2.4
Personal saving rate Percent 4.2 4.2 4.1 3.9 3.7 3.9 4.1 4.0 4.0 4.0
Corp. profits with IVA & CCAdj [Percent change -7.5 -14.8 -1.2 -5.2 58.7 23.6 12.3 .2 -1.3 5.8Profit share of GNIP I|ercent* 5.5 5.2 5.2 5.1 5.6 5.8 5.8 5.8 5.7 5.7
Federal govt. surplus/deficit IBillions of S -145.7 -184.3 -118.0 -150.1 -143.3 -166.4 -164.0 -152.6 -141.1 -140.9
State and local oovt. surplus I1 39.3 25.7 30.4 34.3 44.9 54.3 62.0 67.6 72.0 77.6
Exc. social insurance funds I I -30.5 -44.8 -40.7 -37.7 -28.0 -19.5 -12.7 -8.0 -3.7 .2
PRICES AND COSTS I----------------
GNP implicit deflatorGNP fixed-weight price index
Cons. & fixed invest. pricesCPTExc. food and energy
EC _hourly compensation**
m business sectorjut per hour
.rapesation per hourUnit labor costs
IPercent change 3.7 2.8 5.2 3.0 3.2 3.3 3.8 3.2 3.0 3.0S4.2 4.7 5.1 3.1 3.6 3.5 4.1 3.5 3.3 3.3
5.4 6.4 3.1 2.6 3.8 3.5 3.5 3.4 3.3 3.37.0 6.9 3.6 2. 4.0 3.8- 4.1 3.6 3.5 3.56.1 4.2 6.8 3.2 4.1 4.1 4.3 3.7 3.5 3.5
4.3 3.8 4.6 4.2 3.9 3.8 3.8 3.7 3.7 3.6
.6 -.7 .3 3.5 4.4 2.3 1.8 1.6 1.5 1.41 4.7 3.9 4.0 4.5 4.2 3.9 4.3 3.7 3.6 3.6I 4.1 4.7 3.7 1.0 -.2 1.6 2.5 2.1 2.1 2.2
j i
* Not at an annual rate.** Private industry workers
June 26, 1991

CONFIDENTIAL - FRCLASS II FOMC
GROSS NATIONAL PRODUCT AND RELATED ITEMS(Net changes, billions of 1982 dollars)
June 26, 1991
I.1988 1989 1990 1987 1988 1989 1990
------------------------ ------------------------------ ---------- I (fourth quarter to fourth quarter,01 Q2 03 04 01 02 03 04 01 02 net change)
It
Real GNPGross domestic purchases
rinal salesPrivate dom. final purchases
Personal consunption expand.DurablesNondurablesservices
Business fixed investmentProducers' durable equipment
Nonresidential structuresResidential structures
Change in business inventoriesNonfarmFarm
Net exportsExportsImports
Government purchasesFederal
DefenseNondefense
State and local
I 49.5 35.6 26.3 27.2I 15.5 30.5 32.6 24.4
I 66.9 49.7 10.6 45.7I 51.8 38.3 24.4 14.2
42.619.8
5.717.1
17.3 22.3 22.43.8 -1.1 13.94.4 9.1 2.79.1 14.2 6.0
12.7 17.616.0 14.9-3.4 2.9-3.4 3.2
-17.4-26.6
9.1
34.034.7
-7
-18.9-23.2
-3.8-19.4
4.3
-14.1-9.6-4.5
5.15.6
.5
6.32.8-. 9
3.73.5
-8.0-5.2-2.8
-. 2
36.4 16.5 17.5 3.5 17.4 4.511.8 18.7 28.3 -12.7 4.9 13.7
24.4 . 17.0 18.5 9.3 38.4 -7.26.5 11.4 34.1 -12.9 20.2 -10.3
-2.1 8.6 30.0 -5.4 7.4 1.5
-6.6 5.8 9.9 -15.0 14.5 -10.81.4 -3.9 8.8 -. 4 -7.4 -4.43.0 6.7 11.3 10.0 .4 16.6
I.10.5 8.4 7.8 -4.9 6.2 -6.28.4 10.9 5.7 -5.2 5.4 -3.32.2 -2.6 2.1 .4 .7 -2.9
-1.8 -5.7 -3.7 -2.6 6.5 -5.5
15.7 -18.6 12.1 -. 6 -. 9 -5.7 -21.111.8 -3.8 -10.8 5.1 .2 -6.4 -23.53.9 -14.8 22.9 -5.7 -1.1 .7 2.4
-6.3 2.8 24.6 -2.2 -10.87.0 21.0 20.8 17.1 -. 713.3 18.2 -3.7 19.2 10.1
-7.5-8.9-3.3-5.6
1.3
-6.7
-8.1-7.4
-. 8
1.5
-4.8-6.9
4.5-11.4
2.1
11.719.8-8.1
16.2 12.5 -9.219.1 16.5 -8.02.8 4.1 1.2
6.0 5.7 12.3-.3 .3 12.9-4.7 -1.1 2.1 [4.4 1.4 10.86.3 5.5 -. 7
187.1163.0
117.9
78.5
56.4-4.911.749.6
26.625.6
1.0-4.5
69.266.3
3.0
24.180.556. 4
15.3
5.310.2-4.910.0
138.6 73.9 20.2103.0 46.1 -18,9
172.9 69.2 65.4128.7 39.1 -3.8
104.636,421.946.4
31.1 3.7-5.9 -7.55.9 -21.8
31.0 32.9
24.3 21.827.7 19.8-3.4 2.1
-. 2 -13.8
-34.4
-28.2-6.3
35.668.332.7
8.6-5.4-4.9
-. 5
13.9
4.9-11.916.8
27.856.328.4
2.3-9.6-5.6-4.012.0
11.017.7-6.7
-18.5
-45.3-43.8-1.5
39.135.6-3.4
30.117.210.2
7.012.9
- ~-~-

CONFIDENTIAL - FRCLASS II FOMC
GROSS NATIONAL PRODUCT AND RELATED ITEMS(Net changes, billions of 1982 dollars)
June 26, 1991
Projection I Projection
1990 1991 1992 I 1989 1990 1991 1992------- --------------- --- ---- --------------- --- (fourth quarter to fourth quarter,
03 Q4 01 02 03 04 Q1 02 03 04 I net change)I
Real GNPGross domestic purchases
Final salesPrivate dom. final purchases
Personal consurption expend.Durables
NondurablesServices
Business fixed investmentProducers' durable equipmentNonresidential structures
Residential structures
Change in business inventoriesNonfarmFarm
Net exportsExportsImports
Government purchasesFederal
DefenseNondefense
state and local
14.9 -16.6 -26.9
16.8 -54.3 -42.1
19.7 14.5 -29.619.1 -32.8 -41.6
18.0 -23.22.7 -13,95.2 -15.2
10.0 5.9
-8.7-14,3
-4.410.0
.1 -22.06.1 -19.7
-6.0 -2.4-9.7 -10.9
-4.8 -31.1-6.9 -33.22.1 2.1
-1.9 37.720.4 16.712.2 -21.0
15.2-4.2
-19.4
-3.2-1.1
1.1-2.1-2.1
2.4 48.4 42.4 34.3 28.9 27.5 26.516.1 41.3 45,7 37.9 32.3 27.9 29.6
9.2 27.4 .18.1 22.2 24.0 28.3 25.819.9 21.1 24.4 28.7 29.6 30.5 30.3
21.97.6
.713.8
-3.5-1.7-1.81.5
14.8 16.4 20.1 18.7 18.5 18.35.3 5.1 6.7 3.7 3,6 3.32.7 2.7 4.0 4.9 4.7 4.86.9 8.6 9.3 10.1 10.2 20.21
I1.9 4.3 5.4 1.3 8.1 8.64.3 6.1 7.2 8.5 8.9 9.1
-2.4 -1.8 -1.8 -1.3 -. 8 -. 54.5 3.7 3.2 3.6 3.9 3.5
2.7 -6.8 21.0 24.3 12.1 4.91.7 -5.8 22.0 23.5 11.7 4.91.0 1.0 -1.0 .8 .4 .0
-13.7-1.412.3
3,03.5-. 9
4.3-. 5
-. 8 .7-. 8 .7
.0 .0
7.0 -3.3 -3.6 -3.4 -.3 -3.210.1 13.1 10.3 10.1 9.7 9.93.1 16.4 13.9 13.5 10.0 13.1
-. 8-. 7
-2.51.8-. 1
-3.0-4.1-5.1
1.01.1
-2.9-4.2-5.21.01.3
-2.2-4.0-5.01.01.8
-1.8
-3.8-4.8
1.02.0
-1.4-3.8-4.81.02.4
73.946.1
69.239.1
31.1-5.9
5.932.0
21.819.82.1
-13.8
4.9-11.916.8
27.856.328:4
2.3-9.6-5.6
-4.012.0
20.2-18.9
65.4-3.8
3.7-7.5
-21.832.9
11.017.7
S-6.77-18.5
-45.3-43.8
-1.5
39.135,6-3.4
30.117.210.27.0
12.9
66.361.0
25,123.8
117.2127.7
100.3119.1
44.4 75.63.7 17.31.6 18.5
39.2 39.8
-19.3-11.0
-8.4-1.3
41.241.4-.2
5.217.612.4
-4.0-2.4-7.45.0-1.6
29.433.7-4.414.2
16.916.5
.4
-10.540.150.6
-8.3-15.8-19.8
4.07.5
--- -- - --

CONFIDENTIAL CLASS II
FEDERAL SECTOR ACCOUNTS 1
(Billions of dollars)
Fiscal years1990 1991 1992
1989a 1990a 1991 1992 Ia IIa IIIa IVa Xa II III IV I II III IV
BUDGET Not seasonally adjusted
Budget receipts 2 991 1031 1076 1169 229 319 254 249 233 319 274 -261 261 355 292 283Budget outlays2 1144 1252 1331 1473 310 331 312 336 299 336 - 361 379 364 369 362 378Surplus/deficit(-) 2 -153 -220 -255 -304 -80 -12 -58 -86 -66 -17 -86 -117 -104 -13 -70 -95
(On-budget) -206 -277 -314 -372 -94 -41 -65 -96 -80 -42 -95 -130 -117 -46 -79 -108(Off-budget) 53 57 59 67 14 29 7 10 15 26 9, 12 13 33 9 13
Surplus excludingdeposit insurance 3 -131 -162 -187 -197 -74 17 -41 -72 -63 -2 -50 -89 -76 15 -47 -77
Means of financing:Borrowing 140 263 297 291 90 41 69 99 56 42 99 98 91 30 71 87Cash decrease 3 1 -11 12 8 -16 -6 8 0 -13 -6 22 10 -15 -5 10other 4 10 -44 -30 2 -18 -13 -6 -21 9 -12 -6 -2 3 -2 4 -2
Cash operating balance,end of period 41 40 52 40 18 35 40 32 32 45 52 30 20 35 40 30
NIPA FEDERAL SECTOR Seasonally adjusted annual rates
Receipts 1038 1092 1154 1258 1081 1106 1126 1127 1139 1159 1190 1218 1252 1271 1289 1311Expenditures 1174 1249 1302 1414 1249 1272 1272 1311 1257 1309 1333 1385 1416 1424 1430 1452
Purchases 400 415 444 445 411 422 426 438 444 448 448 444 447 445 442 439Defense 301 307 329 319 307 310 313 325 331 331 328 323 322 317 312 307Nondefense 99 107 115 126 103 112 113 113 113 117 119 121 125 128 130 132
Other expend. 774 835 858 969 838 850 846 873 813 862 885 940 969 979 988 1013Surplus/deficit -136 -158 -149 -156 -168 -166 -146 -184 -118 -150 -143 -166 -164 -153 -141 -141
FISCAL INDICATORS5
High-employment (HEB)surplus/deficit(-) -149 -150 -87 -98 -166 -154 -127 -147 -55 -73 -74 -104 -105 -96 -86 -87
Change in HEB, percentof potential GNP 0 0 -1.2 .2 .3 -.2 -.5 .4 -1.6 .3 0 .5 . 0 -.2 -.2 0
Fiscal impetus measure(FI), percent -3.5 * -3.3 * -2.8 -5.1 * -2.3 1.2 -.8 1.8 -4 .6 -.5 -1.3 -2.6 -1 -1 -.9
a--actual *--calendar year
Note: Details may not add to totals due to rounding.
1. Staff projections. CBO's March deficit estimates are $309 billion in FY1991 and $294 billion in FY1992. OMB's February deficit estimatesare $318 billion in FY1991 and $281 billion in FY1992.
2. Budget receipts, outlays, and surplus/deficit include social security (OASDI) receipts, outlays and surplus, respectively. The OASDI surplusis excluded from the "on-budget" deficit and shown separately as "off-budget", as classified under current law. The Postal Service deficit isincluded in off-budget outlays beginning in FY1990.
3. CBO's March deficit estimates, excluding deposit insurance spending, are $205 billion in FY1991 and $196 billion in FY1992. OMB's Februarydeficit estimates, excluding deposit insurance spending, are $207 billion in FY1991 and $193 billion in FY1992.
4. Other means of financing are checks issued less checks paid, accrued items; and changes in other financial assets and liabilities.5. HEB is the NIPA measure in current dollars with cyclically-sensitive receipts and outlays adjusted to a 6 percent unemployment rate and 2.3%
potential output growth in the forecast period. Quarterly figures for change in BEB and FI are not at annual rates. Change in HEB, as a percentof nominal potential GNP, is reversed in sign. FI is the weighted difference of discretionary federal spending and tax changes (in 1982 dollars),scaled by real federal purchases. For change in HEB and FI, (-) indicates restraint.
June 26, 1991

DOMESTIC FINANCIAL DEVELOPMENTS
Recent Developments
Mounting evidence of an end to the recession and the disappearance of
expectations of further System easing have caused market interest rates to
firm during the intermeeting period. While the federal funds rate has
remained around 5-3/4 percent, Treasury and most private market rates have
risen 5 to 25 basis points. At the same time, quality spreads have
narrowed, as yields on investment-grade corporate bonds and asset-backed
securities have risen less than those on Treasuries. Demand for such
securities has been strong, with investors reaching for higher returns and
apparently becoming more confident that corporate financial health will
improve in a growing economy. Share prices rose to record highs in May,
responding positively to signs of a business upturn, but retraced these
gains in June when bond rates jumped; on balance since the May FOMC meeting,
major stock indexes are little changed.
M2 growth picked up moderately in May, but appears to have waned in
June. Although inflows to liquid retail deposits have been brisk, in part
because their rates have lagged the decline in market yields, other
components of M2, including small time deposits and shares of money market
mutual funds, have been notably weak. Rather than rolling over maturing
time deposits at greatly reduced rates, many households evidently have
sought higher returns on assets outside M2. Continued strong inflows to
bond and equity mutual funds indicate these funds have been the frequent
choice. Apparently, the inflows to retail accounts have more than
satisfied depositories' needs for funds to support credit expansion, and
I-22

I-23
domestic institutions have continued to run off large time deposits and
other managed liabilities in recent weeks. As a result, M3 was little
changed in May and June.
Bank credit was unchanged in April and contracted in May owing to a
drop in loans. While all loan categories were weak, the contraction in
business loans was especially sharp in April and May. The decline in
business loans in part may reflect tight standards by banks, but it is
difficult to disentangle this effect from generally weak demands associated
with declining outlays for inventories and fixed capital and with efforts by
firms to strengthen balance sheets.
Total debt of nonfinancial businesses is estimated to have increased at
only a 2 percent annual rate in the first quarter, and growth appears to
have remained subdued in the second. The bulk of the borrowing this year
has been by investment-grade firms in the bond markets; many of these
companies reportedly have used proceeds to pay down commercial paper. Bond
issuance was particularly heavy in April and May, and it dropped only a bit
in June when bond rates backed up. Outstanding commercial paper of
nonfinancial companies dropped sharply in May and, on net this year, is down
about 5 percent at an annual rate. A small but growing number of lower-
rated companies also have been able to issue bonds, suggesting some
improvement in investor sentiment. In addition, equity markets have been
receptive to new offerings, including those of new and smaller corporations.
The volume of initial public offerings in May was the largest since before
the market break in 1987, and the backlog of potential offerings reportedly
is substantial.

I-24
Household debt growth has shown some pickup, judging from the partial
data available for the second quarter. Home mortgage borrowing appears to
have increased somewhat as a result of a step-up in home sales and increased
borrowing against home equity lines. Consumer installment credit increased
in April after four months of decline, with the drag from falling auto loans
much less than in earlier months; however, consumer loans at banks remained
weak in May, even when account is taken of securitization. As in past
recessions, interest rates on consumer loans have remained high in the face
of falling market rates. This has helped to sustain the profitability of
lending despite rising delinquency rates and loan losses. However, the
competitive pressures in the credit card market have been reflected in a
proliferation of nonrate enticements offered customers.
The Treasury has continued to borrow heavily in the second quarter
despite a seasonally small federal deficit. Some proceeds from the debt
issuance are being used to build cash balances in anticipation of large
deficits in coming quarters. In tax-exempt markets, state and local
governments have issued large volumes of long-term debt in recent weeks.
Short-term volume also surged in June owing to note placements by New York
State and Los Angeles, which needed to fund outlays in advance of tax
payments. Quality spreads on municipal debt widened, but only slightly, in
the wake of the bankruptcy filing by Bridgeport, Connecticut.
Outlook
The interest rate forecast associated with the staff's economic and
financial projections is little changed from the May Greenbook. As before,
the federal funds rate and other short-term interest rates are assumed to
remain near their current levels through 1992. Although intermediate- and
I-25
INTEREST RATES IN POSTWAR CYCLES(Monthly levels)
PercentP T
C
N
10-year Treasury Bond
/ _Federal Funds
'^I\ k Federad Funds/
IIllIIIrI lll I lI1959 1960 1961 1962 1963
PercentP T
/\
I/ \
\ / \ 10-year Treasury Bond
Federal Funds
1973 1974 1975 1976 1977
1969 1970 1971 1972 1973
Percent
VII
1979
P T P T
IEf
II II iiI 'irIv
ifI
I
I
'I
11dilil lii1981
10-year Treasury Bond
A
Federal FundsFederal Funds
ltil iIl i Ill1983 1985
CHANGE IN INTEREST RATES(Basis points)
-Trough dateFebruary 1961 November 1970 March 1975 November 1982
Federal 10-year Federal 10-year Federal 10-year Federal 10-yearPeriod funds bond funds bond funds bond funds bond
Peak to trough
Trough + 6 months
Trough + 12 months
Trough + 18 months
-138 -50 -337 -81 -449
-54 26 -97 -45 70
-17 26 -69 -103 -70
)0 -984 -373
70 -57 -17
0 14 114
39 20 -133 -71 -29 -14 112 286

I-26
long-term rates (especially on Treasuries) currently are a shade higher than
projected in May, as noted earlier, we continue to anticipate that they will
fall back over the next year or so.
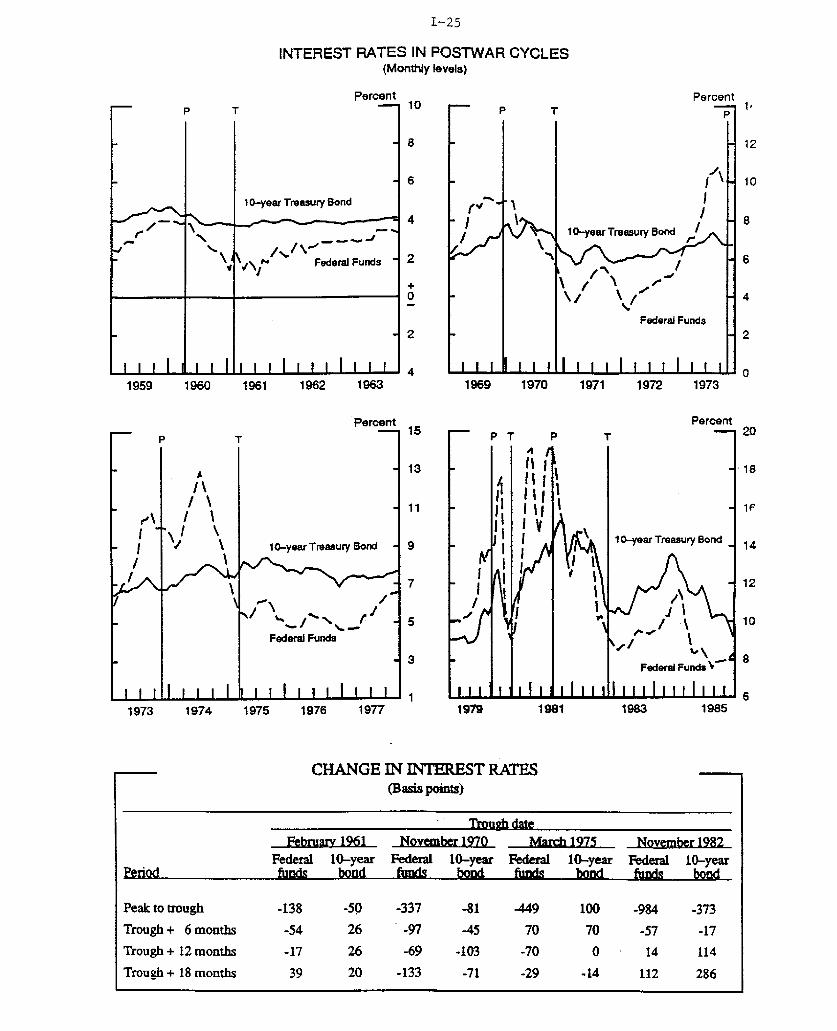
The steepness of the term structure today indicates that the market
perceives a clear risk that short-term rates will come under appreciable
pressure at some point in the next couple of years--a development that
certainly has its precedents in prior business upswings, including the most
recent in 1983-84. But, as may be seen in the chart, there has been a good
deal of variation in cyclical experience--and in some instances short and/or
long rates have been lower a year or 18 months into the expansion than at
the trough.
In the case of the present projection, stable short rates have been
taken as the fundamental conditioning assumption, and long rates have been
predicted along with other facets of the economic forecast. Several
considerations have led us to project lower nominal bond yields in 1992,
prominent among them being: (1) The decline in short rates during the
recession was not especially large by past standards and the behavior of
other policy indicators does not suggest that the economy has received the
kind of monetary impulse recently that it has in some other cycles. (2)
Real long-term interest rates appear still to be fairly high, especially
viewed in the context of the restrictive forces stemming from the real
estate and government sectors. (3) The staff forecast of wages and prices
points to a likelihood that market expectations of inflation will be
declining over the projection period.
Private sector borrowing is expected to increase gradually over the
forecast period. On the demand side, increased spending by households and

I-27
businesses will expand their credit needs. On the supply side, lenders will
become more willing to extend credit as higher income flows lessen credit
quality concerns; moreover, the lenders themselves will be in a better
position to provide financing as they build capital and otherwise strengthen
their own balance sheets. Nonetheless, debt growth of private domestic
nonfinancial sectors is expected to trail that of nominal GNP by more than a
percentage point this year and by three quarters of a point in 1992.
Total debt, however, is projected to rise more rapidly than GNP both
this year and next, given the large borrowing requirements of the federal
sector. An accelerated pace of RTC resolution activity, coupled with
reduced payments by foreign governments to the Defense Cooperation Account,
will add to Treasury borrowing in the second half of this year; federal debt
growth should begin to moderate in 1992 as rising incomes generate higher
tax receipts and RTC spending begins to decline.
In contrast to the federal government, debt growth of state and local
governments is expected to remain moderate. These units continue to grapple
with serious budget problems, as well as a rash of debt downgradings, and
these are likely to inhibit bond-financed capital spending programs.
Borrowing by nonfinancial businesses is expected to pick up in coming
months, largely because of a swing from inventory liquidation to inventory
accumulation. In 1992, capital outlays, including spending on plant and
equipment as well as on inventories, are expected to rise somewhat more
rapidly than corporate cash flows, further adding to financing needs. The
staff also anticipates a modest resumption in debt-financed merger activity
in a more favorable financing environment. Overall, however, the projected
acceleration in business borrowing is quite modest by historical standards,

I-28
reflecting both the moderate rebound in real activity and the lingering
effects of financial strains on borrower and lender behavior.
An obvious uncertainty in the outlook is the willingness and ability of
banks and other intermediaries to accommodate rising credit demands.
Smaller risk spreads on corporate bonds and increased IPO and junk bond
issuance are signs of more positive lender attitudes in capital markets.
Although we expect this trend to continue, insurance companies and other
financial institutions will remain cautious in extending credit to weaker
firms. Bank credit growth, in particular, is likely to be more restrained
than usual in this recovery, although we anticipate some loosening of
lending standards as the economy and borrower balance sheets improve; credit
for real estate acquisition and development is likely to remain hard to come
by, especially for speculative commercial projects, but banks are likely to
become more aggressive in seeking sound business and consumer loans.
In the household sector, growth in consumer credit is expected to show
a gradual rise through 1992. This sluggish pattern reflects the
exceptionally subdued pace of consumer durable spending anticipated in this
recovery. In addition, the distinctly lower after-tax borrowing cost
associated with home equity loans for many borrowers will continue to damp
the growth of consumer credit somewhat. The acceleration in home mortgage
debt also is expected to be relatively restrained, in line with the
unusually small rebound in single-family home building in the staff
forecast. Home mortgage credit is likely to remain readily available to
households, and, with continuing strong investor demand for high-quality
mortgage-backed securities, spreads of mortgage rates over Treasuries should
stay narrow. Mortgage pools are likely to supply a substantial share of
home mortgage financing.
Confidential FR Class IIJune 26, 1991
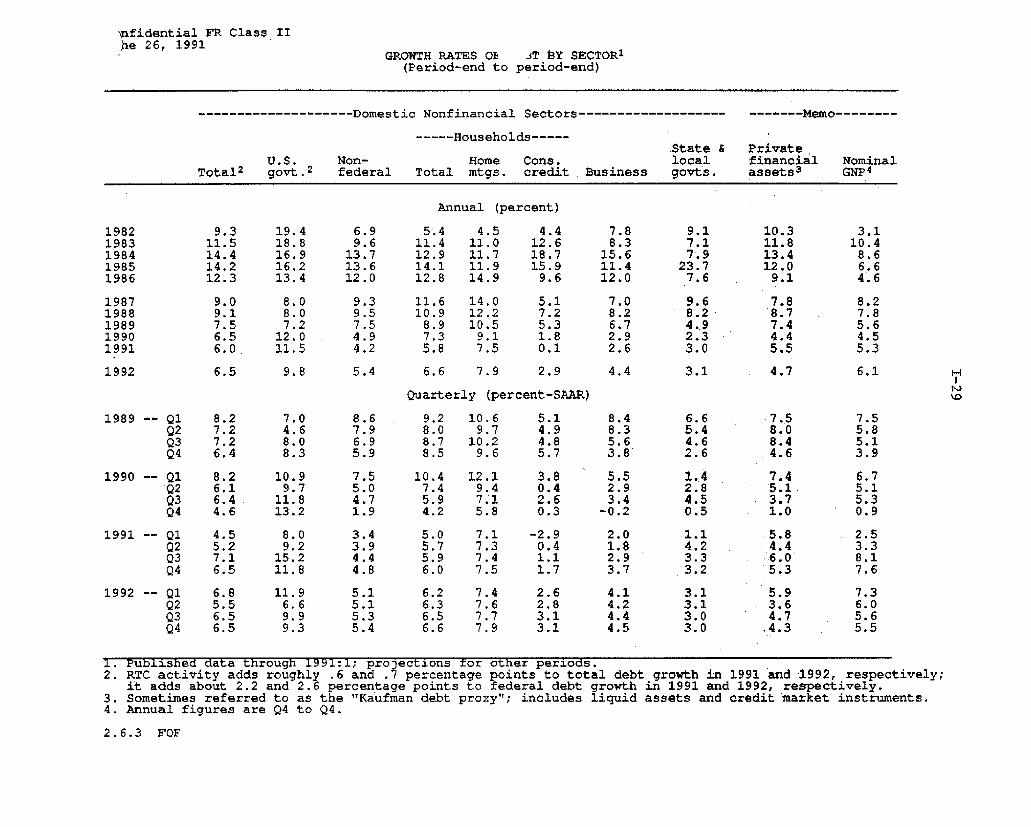
GROWTH RATES OF DEBT BY SECTOR 1(Period-end to period-end)
-------------------- Domestic Nonfinancial Sectors------------------- ------- Memo--------
-----Households-----.State & Private
U.S. Non- Home Cons. local financial NominalTotal 2 govt. 2 federal Total mtgs. credit Business govts. assets 3 GNP4
Annual (percent)
1982 9.3 19.4 6.9 5.4 4.5 4.4 7.8 9.1 10.3 3.11983 11.5 18.8 9.6 11.4 11.0 12.6 8.3 7.1 11.8 10.41984 14.4 16.9 13.7 12.9 11.7 18.7 15.6 7.9 13.4 8.61985 14.2 16.2 13.6 14.1 11.9 15.9 11.4 23.7 12.0 6.61986 12.3 13.4 12.0 12.8 14.9 9.6 12.0 7.6 9.1 4.6
1987 9.0 8.0 9.3 11.6 14.0 5.1 7.0 9.6 7.8 8.21988 9.1 8.0 9.5 10.9 12.2 7.2 8.2 8.2 8.7 7.81989 7.5 7.2 7.5 8.9 10.5 5.3 6.7 4.9 7.4 5.61990 6.5 12.0 4.9 7.3 9.1 1.8 2.9 2.3 4.4 4.51991 6.0 11.5 4.2 5.8 7.5 0.1 2.6 3.0 5.5 5.3
1992 6.5 9.8 5.4 6.6 7.9 2.9 4.4 3.1 4.7 6.1
Quarterly (percent-SAAR)
1989 -- Q1 8.2 7.0 8.6 9.2 10.6 5.1 8.4 6.6 7.5 7.5Q2 7.2 4.6 7.9 8.0 9.7 4.9 8.3 5.4 8.0 5.8Q3 7.2 8.0 6.9 8.7 10.2 4.8 5.6 4.6 8.4 5.1Q4 6.4 8.3 5.9 8.5 9.6 5.7 3.8 2.6 4.6 3.9
1990 -- Q1 8.2 10.9 7.5 10.4 12.1 3.8 5.5 1.4 7.4 6.7Q2 6.1 9.7 5.0 7.4 9.4 0.4 2.9 2.8 5.1 5.1Q3 6.4 11.8 4.7 5.9 7.1 2.6 3.4 4.5 3.7 5.3Q4 4.6 13.2 1.9 4.2 5.8 0.3 -0.2 0.5 1.0 0.9
1991 -- Q1 4.5 8.0 3.4 5.0 7.1 -2.9 2.0 1.1 5.8 2.5Q2 5.2 9.2 3.9 5.7 7.3 0.4 1.8 4.2 4.4 3.3Q3 7.1 15.2 4.4 5.9 7.4 1.1 2.9 3.3 6.0 8.1Q4 6.5 11.8 4.8 6.0 7.5 1.7 3.7 3.2 5.3 7.6
1992 -- Q1 6.8 11.9 5.1 6.2 7.4 2.6 4.1 3.1 5.9 7.3Q2 5.5 6.6 5.1 6.3 7.6 2.8 4.2 3.1 3.6 6.0Q3 6.5 9.9 5.3 6.5 7.7 3.1 4.4 3.0 4.7 5.6Q4 6.5 9.3 5.4 6.6 7.9 3.1 4.5 3.0 .4.3 5.5
1. Published data through 1991:1; projections for other periods.2. RTC activity adds roughly .6 and .7 percentage points to total debt growth in 1991 and 1992, respectively;
it adds about 2.2 and 2.6 percentage points to federal debt growth in 1991 and 1992, respectively.3. Sometimes referred to as the "Kaufman debt proxy"; includes liquid assets and credit market instruments.4. Annual figures are Q4 to Q4.
2.6.3 FOF

ConfidentialJune 26, 1991
FR Class II
FLOW OF FUNDS PROJECTION HIGHLIGHTS 1(Billions of dollars, seasonally adjusted annual rates)
Calendar year ----1990---- -----------1991---------- -----1992----1989 1990 1991 1992 Q3 Q4 Q1 Q2 Q3 Q4 HI H2
Net funds raised by domestic1 nonfinancial sectors 554.0 578.2 616.2 690.3 581.7 421.6 457.7 555.9 766.0 685.1 659.7 720.82 Net equity issuance -124.2 -63.0 -12.5 -35.0 -74.0 -61.0 -17.0 2.0 0.0 -35.0 -35.0 -35.03 Net debt issuance 678.2 641.2 628.7 725.3 655.7 482.6 474.7 553.9 766.0 720.1 694.7 755.8
Borrowing sectorsNonfinancial business
4 Financing gap2 33.9 37.1 13.3 71.6 50.9 33.1 -17.5 8.7 19.8 42.3 63.1 80.15 Net equity issuance -124.2 -63.0 -12.5 -35.0 -74.0 -61.0 -17.0 2.0 0.0 -35.0 -35.0 -35.06 Credit market borrowing 211.9 99.8 92.4 157.3 119.4 -8.3 70.3 64.3 101.9 133.1 149.8 164.7
Households7 Net borrowing, of which: 285.0 254.3 222.0 267.6 221.7 159.4 192.6 222.5 234.2 238.7 256.6 278.68 Home mortgages 221.6 214.1 200.1 226.0 183.7 150.9 189.3 197.5 204.4 209.2 217.0 235.09 Consumer credit 39.1 14.3 0.5 23.8 21.3 2.5 -23.6 3.0 8.7 13.8 21.8 25.8
10 Debt/DPI (percent)3 89.8 93.1 96.6 96.4 95.9 96.1 96.9 97.2 97.3 97.1 96.2 96.5
State and local governments11 Net borrowing 29.6 14.6 19.3 20.7 28.5 3.1 7.1 27.2 22.0 20.9 20.7 20.712 Current surplus4 -25.7 -30.9 -23.3 6.8 -35.7 -36.8 -37.9 -28.4 -19.1 -7.8 2.1 11.5
U.S.government13 Net borrowing from public 151.6 272.5 295.0 279.7 286.1 328.4 204.7 239.9 408.0 327.4 267.6 291.814 Net borrowing from public5 151.6 272.5 295.0 279.7 68.4 98.7 55.8 42.5 98.7 98.0 121.5 158.315 Unified budget deficit5 155.0 236.1 285.9 281.9 57.9 86.2 65.6 16.7 86.5 117.2 117.2 164.7
Funds supplied by16 depository institutions 92.8 -22.1 -42.8 -19.5 -60.6 -92.8 -10.0 -81.7 -38.2 -41.3 -32.7 -6.3
Memoranda: As percent of GNP:17 Dom. nonfinancial debt3 181.7 186.3 191.6 190.9 189.3 191.1 192.0 192.9 192.6 192.2 190.4 191.118 Dom. nonfinancial borrowing 13.0 11.7 11.1 12.0 11.9 8.7 8.5 9.9 13.4 12.4 11.6 12.319 U.S. government 6 2.9 5.0 5.2 4.6 5.2 5.9 3.7 4.3 7.1 5.6 4.5 4.820 Private 10.1 6.7 5.9 7.4 6.7 2.8 4.9 5.6 6.3 6.7 7.2 7.6
1. Published data through 1991:1; projections for other periods.4. NIPA surplus, net of retirement funds.2. For corporations: excess of capital expenditures over 5. Quarterly data at quarterly rates, nsa.
U.S. internal funds. 6. Excludes gov't-insured mortgage pool securities.3. Annuals are average debt levels in the year (computed as the
average of year-end debt positions) divided by annual GNP.
2.6.4 FOF

INTERNATIONAL DEVELOPMENTS
Recent Developments
The foreign exchange value of the dollar, in terms of the other G-10
currencies, has risen 4-1/2 per cent since the May FOMC meeting. The dollar
strengthened during the period with the release of a range of statistical
reports indicating an upturn in U.S. economic activity. Around the time of
the G-7 meeting on June 23, the dollar declined slightly on perceptions that
authorities might act to limit the rise in the dollar. The dollar has risen
strongly against the mark and other European currencies over the
intermeeting period, but has remained little changed against the yen on
balance. This differential performance can be explained in part by
perceived differences in the actual and prospective stances of monetary
policy in Germany and Japan. In the face of strong first-quarter growth in
both countries, Japanese authorities are perceived to have postponed
anticipated monetary easing, while the Bundesbank is perceived to have
postponed anticipated tightening. In addition, the mark has been affected
negatively by market reactions to recent and prospective domestic political
developments in Germany as well as to uncertainties in the Soviet Union.
the Bank of Japan sold $300 million, and the Desk did not
intervene.
Recent indicators of economic activity in the major foreign industrial
countries have been mixed. In Germany and Japan, unusually favorable
I-31

I-32
weather and other transitory factors helped to push GNP to unexpectedly high
levels in the first-quarter. Economic activity in both countries appears to
have declined a bit in the second quarter. In Canada and the United
Kingdom, first-quarter GNP data confirmed the continuation of recessions,
while in France, economic activity was flat in the first quarter. Signs of
improvement have emerged recently, however, at least in Canada and possibly
in France. Recent Canadian data on new orders, shipments, auto sales, and
housing suggest a pick-up, and the Canadian unemployment rate, though still
above 10 percent, has started to edge down.
Inflation has been steady to somewhat lower in most industrial
countries in recent months. Twelve-month inflation in the United Kingdom
has dropped sharply, partly because of special factors; even absent special
tax and interest rate effects the underlying rate of U.K. inflation has
declined to about 6-1/2 percent. Germany is an exception to the general
trend toward easing inflationary pressures.
The U.S. merchandise trade deficit narrowed further in April, from a
substantially improved rate in the first quarter. While lower imports had
accounted for most of the narrowing of the deficit in the first quarter, a
rebound in exports led the improvement in April. Exports in April were
about 5 percent higher than in the first quarter, and imports were about 2
percent higher. Import prices declined further in April; all of the decline
was in non-oil import prices (reflecting the effects of the stronger
dollar), whereas the decline in the first quarter had been concentrated in
oil prices. The current account showed a surplus of $41 billion at an
annual rate in the first quarter, primarily because of an inflow of $91
billion (annual rate) in transfers associated with Operation Desert Storm.
I-33
Outlook
Relative to the May Greenbook, the current forecast incorporates a
higher path for the dollar, stronger near-term growth in the United States,
and slightly weaker near-term growth abroad. As a result, the outlook for
real net exports of goods and services has worsened somewhat. The projected
nominal trade and current account deficits for 1991 remain little changed
from the May forecast, because the initial favorable effects of a stronger
dollar on import prices offset most of the near-term weakening in real net
exports. Next year the current account deficit is projected to widen to
nearly $50 billion, about $5 billion more than in the previous forecast.
The Dollar. In the staff forecast, the foreign exchange value of the
dollar against the other G-10 currencies is projected to decline somewhat
from its recent highs in the near term and then to remain unchanged.
However, over the forecast period on average, the projected value of the
dollar has been revised up by about 5 percent compared with the May
Greenbook, largely in response to the persistent strength of the dollar.
Against the currencies of eight developing countries, the dollar is expected
to show a small depreciation in real terms over this year and next.
Foreign Industrial Countries. Average real GNP growth among the
foreign G-7 countries (weighted by their shares in U.S. nonagricultural
exports), which is expected to have been essentially zero during the first
half of the year, is projected to pick up to 2 percent in the second half
and to strengthen to 3 percent next year. Differences in growth rates among
countries are expected to narrow significantly over the next year as Canada
and the United Kingdom recover from recessions and growth in France picks
up.
The outlook for inflation in the G-6 countries has been lowered
slightly from that in May, to an average rate of about 4 percent for 1991.

I-34
The revision reflects recent improvements in inflation performance in the
United Kingdom and, to a lesser extent, Japan and Canada. In 1992, average
inflation is expected to slow by an additional 1/2 percentage point to a
rate of 3-1/2 percent.
The outlook for interest rates in the major foreign industrial
countries remains consistent with a cautious easing of monetary policy in a
context of slowing inflation and weak, but recovering, real demand. Short-
term interest rates are expected to move down gradually by another 1/2
percentage point from current levels on average by the end of 1992. German
short-term interest rates are expected to rise slightly in coming months in
response to mounting inflationary pressures, and then to return to about
present levels by the second half of next year. Japanese authorities are
expected to allow short-term interest rates to decline somewhat during the
second half of this year as growth of aggregate demand eases; Japanese rates
are expected to level off thereafter. Foreign long-term interest rates are
expected to decline slightly on average over the forecast period.
Developing Countries. Growth in developing countries that are major
U.S. trading partners is projected to increase moderately in 1991 to about
5-1/4 percent, on average, and to rise slightly further in 1992. All
countries in this group are expected to be affected negatively by the
decline in growth in industrial countries this year. However, government
policies are sufficiently expansionary in several key developing countries
to offset expected slower growth in external demand. Lower average oil
prices expected for this year also will be a net positive factor.
U.S. Real Net Exports of Goods and Services. After having improved
dramatically through the first quarter of this year, real net exports of
goods and services are expected to decline fairly steadily through the end
of next year. The decline reflects primarily the effects of a faster pickup

I-35
in growth at home than abroad. The trajectory of net exports is more
negative in the current forecast than in the previous one, primarily because
of the higher projected value of the dollar.
TRADE QUANTITIES(Percent change from end of preceding comparable period, annual rate)
------ Projection -----1990 1991 1992
Q1 Q2 H2
Nonagricultural exports 8.6 6.5 11.4 9.4 8.7Agricultural exports -6.1 13.1 2.1 1.5 0.6
Non-oil imports 1.4 -10.2 5.4 9.4 9.2Oil imports -12.3 21.2 45.0 4.9 9.9
* GNP basis, 1982 dollars.
The growth of real exports of goods is projected to increase to more
than 9 percent at an annual rate during the second half of this year as
growth abroad recovers. Export growth is then projected to decline to about
a 7 percent rate in the second half of 1992 as the negative effects of the
recent rise in the dollar begin to outweigh the positive effects of the
earlier decline in the dollar. Because of the stronger dollar, the export
growth rate over the next year and a half is more than 1 percentage point
below the previous forecast. The quantity of computer exports is expected
to continue to expand rapidly, adding nearly 2 percentage points to the
growth rate for total export volume over the projection period.
Agricultural exports are expected to pick up somewhat in the near term,
largely because of the recent provision of credit guarantees to the Soviet
Union, but to remain sluggish over the rest of the forecast period.
The quantity of non-oil imports of goods is projected to rise at about
a 5 percent rate in the second quarter and then to expand at an average
annual rate of 9-1/4 percent over the next six quarters. The U.S. economic
recovery and recent declines in the relative price of imports associated

I-36
with the rise in the dollar are expected to stimulate demand for imports.
Constant-dollar imports of computers are expected to grow especially
rapidly, as in the case of exports, and will add several percentage points
to the growth rate for total non-oil imports. Oil imports are expected to
jump in the current quarter as stocks are rebuilt and to expand steadily
thereafter, in line with growing domestic consumption and gradually receding
domestic production.
Oil Prices. The outlook for oil prices in the near term has been
lowered somewhat since the May forecast, reflecting the market's response to
OPEC's agreement in early June not to cut its production quotas, and to
continued strong increases in petroleum stocks. We now assume that oil
import prices will remain under $18 per barrel through the summer, before
returning to a flat $18 per barrel path by the end of the year (a level
consistent with a posted price of $19.25 per barrel for West Texas
Intermediate crude).
SELECTED PRICE INDICATORS(Percent change from the end of preceding comparable period, annual rate)
------ Projection -----1990 1991 1992
Q1 2 H2
PPI (export-share wts.) 4.8 -2.0 -2.5 1.8 2.3Nonagric exports (Fx-Wt) 4.0 -1.0 -1.6 0.5 2.0
Non-oil imports (Fx-Wt) 2.9 4.0 0.3 1.5 2.0Oil imports ($/barrel) 20.57 20.33 17.68 17.92 18.00
Prices of Exports and Non-oil Imports. The fixed-weight price index
for U.S. nonagricultural exports is projected to decline further in the
second quarter, owing primarily to recent declines in domestic producer
prices (particularly among industrial supplies and materials). The rise in
the dollar may restrain U.S. exporters from raising their prices as well.

I-37
Moderate growth in export prices should resume by the end of this year with
the projected turnaround in domestic materials prices. Non-oil import
prices are projected to remain about unchanged in the current quarter, and
to rise only slowly through the end of the forecast period; the recent rise
in the dollar is expected to depress import prices for much of this year.
Nominal Trade and Current Account Balances. The merchandise trade
deficit is projected to narrow further in the second quarter, to less than
$70 billion (annual rate), as a result of sluggish imports and expanding
exports. Thereafter, the deficit is projected to widen gradually, returning
to a level of close to $80 billion next year. Excluding the effects of
transfer payments associated with the Gulf War, the current account deficit
this year is projected to be roughly $45 billion, or about $25 billion less
than the trade deficit. Next year, the widening of the trade deficit is
expected to be only slightly offset by net improvements in the non-trade
portions of the current account (other than transfers), resulting in a
current account deficit approaching $50 billion.
NOMINAL EXTERNAL BALANCES(Billions of dollars, SAAR)
------ Projection -----1990 1991 1992
Q1 Q2 H2
Trade Balance -108.1 -73.5 -67.0 -69.5 -80.3Current Account excl.
Gulf War Cash Grants -87.8 -49.9 -48.7 -42.8 -47.7
Gulf War Cash Grants 4.3 90.8 48.0 16.0 0.0Current Account -92.1 40.9 -0.7 -26.8 -47.7
Within the non-trade portions of the current account, net service
receipts are expected to expand steadily in the near term; this growth will
be depressed somewhat over time by the effects of the higher dollar. Net

I-38
investment income receipts are expected to decline from a level in the first
quarter that had been pushed to abnormal heights by a transitory surge in
the earnings of U.S. oil companies abroad. Through the forecast period, net
investment income receipts are projected to make a small positive
contribution to the current account, as they did in 1990; that contribution
is expected to increase slightly over the next few quarters as recent
declines in dollar interest rates show through to lower net payments on U.S.
debt to foreigners.
With respect to transfer payments, total cash grants from foreign
governments to support Operation Desert Storm are expected to amount to $43
billion this year. Payments received in the first quarter this year totaled
$23 billion (not at an annual rate). An additional $12 billion is expected
in the second quarter, and a remaining $8 billion in the third quarter. As
a result, a current account surplus of $41 billion was recorded in the first
quarter and a near zero balance is expected in the second quarter. The
current account is then projected to move significantly into deficit in the
second half of the year.

I-39
June 26, 1991
STRICTLY CONFIDENTIAL - FRCLASS II FOMC
REAL GNP AND CONSUMER PRICES, SELECTED COUNTRIES, 1988-92(Percent change from fourth quarter to fourth quarter)
Projection
Measure and country 1988 1989 1990 1991 1992
REAL GNP
CanadaFranceWestern GermanyItalyJapanUnited Kingdom
Average, weighted by 1987-89 GNP
Average, weighted by share ofU.S. nonagricultural exports
Total foreignG-6Developing countries
CONSUMER PRICES
CanadaFranceWestern GermanyItalyJapanUnited Kingdom
Average, weighted by 1987-89 GNP
Average, weighted by share ofU.S. non-oil imports
3.14.03.53.75.63.3
4.2
4.13.85.3
4.13.01.65.21.56.5
3.2
-1.62.15.31.14.8-1.3
2.5
1.80.74.7
5.23.63.16.62.97.6
4.4
4.93.63.06.33.5
10.0
4.9
-0.21.22.81.93.60.3
2.1
2.21.15.6
5.32.63.86.23.14.7
4.0
2.72.42.92.83.62.0
2.9
3.42.85.6
3.42.92.85.23.04.6
3.5
4.5 4.1 3.33.0 4.2

Strictly Confidential (FR) Class II-FOMC
OUTLOOK FOR U.S. CURRENT ACCOUNT AND REAL NET EXPORTS
(Billions of dollars, seasonally adjusted annual rates)
June 26, 1991
1. GNP Real Net Exports (82$)
a. Exports of O+SMerchandiseServices
b. Imports of G+SMerchandise
OilNon-oil
Services
MemotPercent Changes (AR) 1/
Exports G+Sof which* Merchandise
Imports G+Sof whicht Non-oil Merch.
2. U.S. Current Account Balance
a. Merchandise Trade, net
ExportsAgriculturalNonagricultural
ImportsOilNon-oil
ANNUAL
1990 1991-P 1992-P
-33.8 -1.2 -10.7
631.5 650.3 690.1423.9 457.0 496.1207.6 193.3 194.0
665.3 651.5 700.7517.0 518.8 569.295.5 94.2 104.3421.5 424.5' 464.9148.3 132.7 131.6
1990
91 Q2 03 Q4
-35.4 -44.6 -46.5 -8.8
628.1 620.1 630.5 647.2422.4 418.4 421.0 433.8205.7 201.7 209.5 213.4
663,5 664.7 677.0 656.0517.8 515.2 526.5 508.4100.8 96.9 100.9 83.3417.1 418.3 425.5 425.1145.6 149.4 150.5 147.6
1991
l1 Q2-P Q3-P 94-P
6.4 -7.3 -0.3 -3.6
643.0 641.6 651.7 664.8441.3 452.5 462.5 471.8201.7 189.1 189.2 193.1
636.6 648.9 652.0 668.4501.2 515.2 522.0 536.787.4 95.9 95.5 98.2413.8 419.3 426.5 438.6135.4 133.7 130.0 131.7
5.8 2.7 6.0 11.2 -5.0 6.9 11.0 -2.6 -0.9 6.4 8.3 5.97.1 8.8 8.0 18.1 -3.7 2.5 12.7 7.1 10.6 9.2 8.2 7.0
-0.5 1.9 7.6 2.5 0.7 7.6 -11.8 -11,3 8.0 1.9 10.5 7.61.4 3.2 9.2 -2.1 1.2 7.1 -0.4 -10.2 5.4 7.1 11.8 7.9
-92.1 -3.3 -47.7 -90.7 -88.7 -95.5 -93.6 40.9 -0.7 -8.2 -45.3 -52.4
-108.1 -69.8 -80.3 -110.1 -96.4 -115.0 -110.9 -73.5 -67.0 -66.1 -72.9 -83.6
389.5 416.9 453.4 381.0 388.4 386.6 402.3 403.4 412,9 421.5 429.9 466.340.2 40.3 41.8 43.0 40.8 39.3 37.8 39.7 40.4 40.9 40.1 42.8
349.3 376.7 411.6 338.0 347.5 347.3 364.5 363.7 372.5 380.7 389.8 423.5
497.7 486.8 533.7 491.1 484.7 501.6 513.2 476.9 479.8 487.7 502.7 549.962.1 52.6 57.6 63.2 51.3 62.8 72.1 52.6 51.7 52.0 54.0 59.7435.6 434.2 476.1 427.9 433.4 439.8 441.1 424.3 428.1 435.7 448.7 490.2
b. Other Current Account 16.0 66.5 32.7 19.5 7.6 19.5 17.3 114.3 66.3 57.9 27.6 31.2
Investment Income, net 11.9 8.7 5.6 12.0 0.0 11.2 24.5 18.6 3.3 6.5 6.5 4.1Direct, net 52.7 48.7 43.0 51.9 43.6 53.5 61.7 60.6 45.8 43.9 44.6 42.7Portfolio, net -40.7 -40.0 -37.4 -39.8 -43.6 -42.3 -37.2 -42.0 -42.5 -37.4 -38.1 -38.6of whichi Gov't Payments 37.9 36.5 35.9 36.8 37.4 38.1 39.1 38.5 36,5 35.7 35.2 36.5
Military Transactions, net -7.2 -5.6 -2.1 -6.9 -6.2 -6.7 -9.0 -8.7 -6.8 -4.8 -2.0 -1.2Other Services, net 33.6 40.0 46.9 30.5 32.6 32.3 38.9 36.7 38.8 41.2 43.1 48.4Unilateral Transfers, net -22.3 23.4 -17.8 -16.1 -18.8 -17.3 -37.1 67.8 31.0 15.0 -20.0 -20.0
1/ Percent change from previous period; percent changes for annual data are calculated Q4/Q4.
1992
Q4-P
-14.1
704.9509.7195.2
719.0586.7107.9478.8132.3