Fluorescent nanodiamond tracking reveals intraneuronal ...
40
HAL Id: pasteur-02873510 https://hal-pasteur.archives-ouvertes.fr/pasteur-02873510 Submitted on 22 Dec 2020 HAL is a multi-disciplinary open access archive for the deposit and dissemination of sci- entific research documents, whether they are pub- lished or not. The documents may come from teaching and research institutions in France or abroad, or from public or private research centers. L’archive ouverte pluridisciplinaire HAL, est destinée au dépôt et à la diffusion de documents scientifiques de niveau recherche, publiés ou non, émanant des établissements d’enseignement et de recherche français ou étrangers, des laboratoires publics ou privés. Distributed under a Creative Commons Attribution - NonCommercial| 4.0 International License Fluorescent nanodiamond tracking reveals intraneuronal transport abnormalities induced by brain-disease-related genetic risk factors Simon Haziza, Nitin Mohan, Yann Loe-Mie, Aude-Marie Lepagnol-Bestel, Sophie Massou, Marie-Pierre Adam, Xuan Loc Le, Julia Viard, Christine Plancon, Rachel Daudin, et al. To cite this version: Simon Haziza, Nitin Mohan, Yann Loe-Mie, Aude-Marie Lepagnol-Bestel, Sophie Massou, et al.. Fluorescent nanodiamond tracking reveals intraneuronal transport abnormalities induced by brain- disease-related genetic risk factors. Nature Nanotechnology, Nature Publishing Group, 2017, 12 (4), pp.322-328. 10.1038/nnano.2016.260. pasteur-02873510
Transcript of Fluorescent nanodiamond tracking reveals intraneuronal ...

HAL Id: pasteur-02873510https://hal-pasteur.archives-ouvertes.fr/pasteur-02873510
Submitted on 22 Dec 2020
HAL is a multi-disciplinary open accessarchive for the deposit and dissemination of sci-entific research documents, whether they are pub-lished or not. The documents may come fromteaching and research institutions in France orabroad, or from public or private research centers.
L’archive ouverte pluridisciplinaire HAL, estdestinée au dépôt et à la diffusion de documentsscientifiques de niveau recherche, publiés ou non,émanant des établissements d’enseignement et derecherche français ou étrangers, des laboratoirespublics ou privés.
Distributed under a Creative Commons Attribution - NonCommercial| 4.0 InternationalLicense
Fluorescent nanodiamond tracking reveals intraneuronaltransport abnormalities induced by brain-disease-related
genetic risk factorsSimon Haziza, Nitin Mohan, Yann Loe-Mie, Aude-Marie Lepagnol-Bestel,Sophie Massou, Marie-Pierre Adam, Xuan Loc Le, Julia Viard, Christine
Plancon, Rachel Daudin, et al.
To cite this version:Simon Haziza, Nitin Mohan, Yann Loe-Mie, Aude-Marie Lepagnol-Bestel, Sophie Massou, et al..Fluorescent nanodiamond tracking reveals intraneuronal transport abnormalities induced by brain-disease-related genetic risk factors. Nature Nanotechnology, Nature Publishing Group, 2017, 12 (4),pp.322-328. �10.1038/nnano.2016.260�. �pasteur-02873510�
1
Fluorescent nanodiamond tracking reveals intraneuronal transport
abnormalities induced by brain disease-related genetic risk factors
Simon HAZIZA1,2*, Nitin MOHAN1,10, Yann LOE-MIE2, Aude-Marie LEPAGNOL-BESTEL2,
Sophie MASSOU1,11, Marie-Pierre ADAM1,12, Xuan Loc LE1, Julia VIARD2, Christine PLANCON3,
Rachel DAUDIN2, Pascale KOEBEL4, Emilie DORARD2, Christiane ROSE2, Feng-Jen HSIEH5, Chih-
Che WU6, Brigitte POTIER2, Yann HERAULT4, Carlo SALA7, Aiden CORVIN8, Bernadette
ALLINQUANT2, Huan-Cheng CHANG5, François TREUSSART1*† and Michel SIMONNEAU1,2,9*†
1 Laboratoire Aimé Cotton, CNRS, Univ. Paris-Sud, ENS Cachan, Université Paris-Saclay, 91405 Orsay, France
2 Centre de Psychiatrie et Neurosciences, INSERM U894, Université Paris-Descartes, 75014 Paris, France
3 Centre National de Génotypage, 91057 Evry, France
4 Institut de génétique et de biologie moléculaire et cellulaire, CNRS UMR 7104, INSERM U 964, Université de Strasbourg, 67400 Illkirch-Graffenstaden, France
5 Institute of Atomic and Molecular Sciences, Academia Sinica, Taipei 106, Taiwan
6 Department of Applied Chemistry, National Chi Nan University, Puli, Nantou Hsien 545, Taiwan
7 Neuroscience Institute, CNR, 20129 Milano, Italy
8 Department of Psychiatry, Institute of Neuroscience, Trinity College Dublin, Dublin 2, Ireland
9 Department of Biology, ENS Cachan, Université Paris-Saclay, 94235 Cachan, France
10 Current address: Institut de Ciències Fotòniques (ICFO), 08860 Castelledefels, Spain
11 Current address: Institut Interdisciplinaire de Neurosciences, CNRS, Université de Bordeaux, 33077 Bordeaux, France
12 Current address: European Laboratory for Non-Linear Spectroscopy, University of Florence, 50019 Sesto Fiorentino, Italy
†These authors contributed equally to this work.
*emails: [email protected] (M.S.), [email protected] (F.T.) and
[email protected] (S.H.)
2
Brain diseases such as autism and Alzheimer’s disease (each inflicting >1% of the
world population) involves a large network of genes displaying subtle changes in
their expression1 Abnormalities in intraneuronal transport have been linked to
genetic risk factors found in patients2,3, suggesting the relevance of measuring this
key biological process. However, current techniques are not sensitive enough to
detect minor abnormalities. Here, we report a sensitive method to measure
changes in intraneuronal transport induced by brain disease-related genetic risk
factors using fluorescent nanodiamonds (fNDs). We show that the high brightness,
photostability and absence of cytotoxicity4 allow fNDs to be tracked inside the
branches of dissociated neurons with 12 nm spatial and 50 ms time resolutions. As
proof-of-principle, we applied the fND-tracking assay on two transgenic mouse
lines that mimic the slight changes in protein concentration (~30%) found in brains
of patients. In both cases, we show that the fND assay is sufficiently sensitive to
detect these changes.
A polygenic architecture of brain diseases as diverse as autism spectrum disorders,
schizophrenia and late-onset Alzheimer’s disease is emerging, with the discovery of
interplay between hundreds of genetic variants and subtle changes in gene expression,
later referred as genetic risk factors1. The modelling of human brain diseases to
understand the function of related genes usually relies on the establishment of transgenic
mouse mimicking the effects of genetic changes5. As intraneuronal transport
abnormalities have long been recognized to be linked to neuropsychiatric and
neurodegenerative diseases2,3, we decided to mimic in vivo the changes induced by brain
disease-related genetic variants and subsequently quantify their impact on the
intraneuronal transport using primary cultures of mouse hippocampal neurons.
Previous attempts to quantify intraneuronal transport have been based on cargo
labelling with genetic constructs of chimeric fluorescent proteins6. Limitations of this
strategy are low transfection yield, uncontrolled protein overproduction, photobleaching
of the reporters, and substantial cytotoxicity. Fluorescent semiconductor nanocrystals
(quantum dots, QDs) have been widely used to probe a variety of cellular events7, owing
to their high photoluminescence yield and good photostability. However, attempts to use
QDs to study intraneuronal transport have been limited to the specific model of long axons
of dorsal root neurons cultured in microfluidic devices8. Moreover, QDs blinking impedes
high spatiotemporal resolution tracking and therefore biases transport parameter
3
measurements as we show in this letter. Considering these intrinsic limitations, there is a
need for developing new generic approaches able to screen the functional impact of brain
disease-related genetic modifications.
Here, we developed a quantitative assay based on tracking of fluorescent diamond
nanocrystals (fluorescent NanoDiamond, fND) in mouse hippocampal neurons (Fig. 1,
Supplementary Videos 1 and 2). We used 30 nm-sized fNDs (see Methods and
Supplementary Fig. 1a), whose fluorescence stems from nitrogen-vacancy colour centres
created within the nanocrystals and acting as perfectly photostable and non-blinking
emitters in the far-red spectral domain9 (Supplementary Fig. 1b). Such remarkable
properties have been already exploited in bio-applications requiring long-term tracking10.
Moreover, fNDs have been reported to show a notably low cellular toxicity in primary
neurons11.
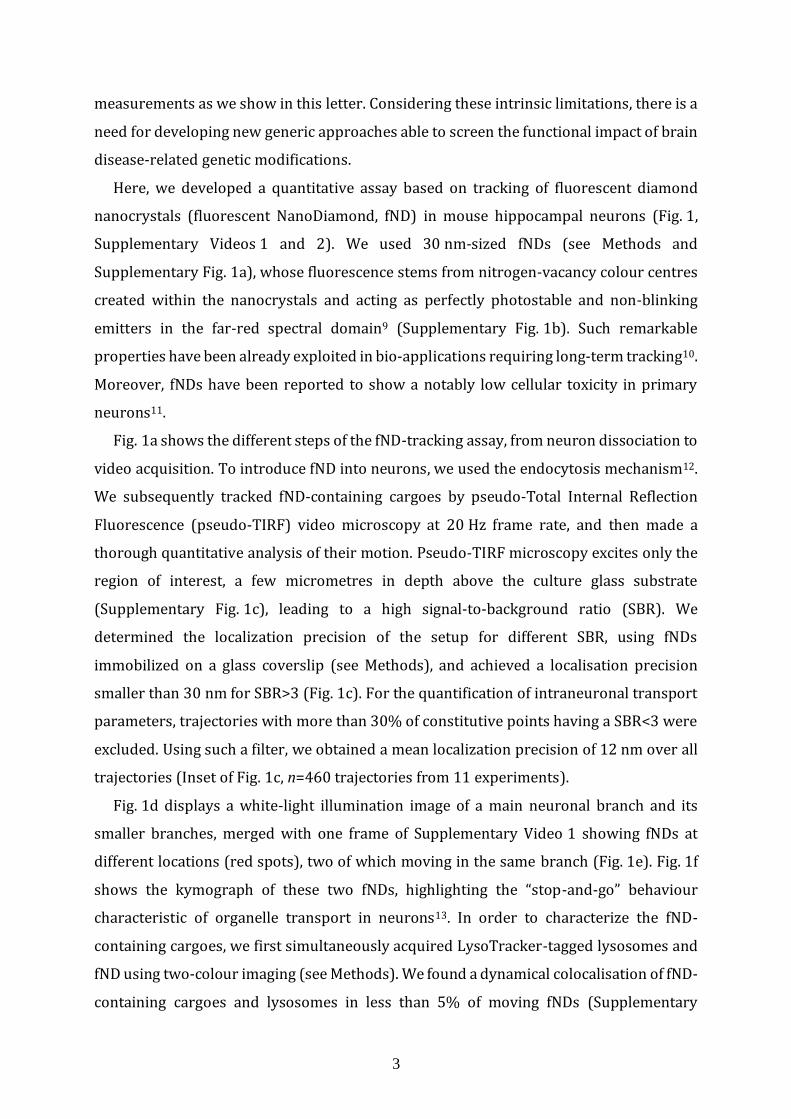
Fig. 1a shows the different steps of the fND-tracking assay, from neuron dissociation to
video acquisition. To introduce fND into neurons, we used the endocytosis mechanism12.
We subsequently tracked fND-containing cargoes by pseudo-Total Internal Reflection
Fluorescence (pseudo-TIRF) video microscopy at 20 Hz frame rate, and then made a
thorough quantitative analysis of their motion. Pseudo-TIRF microscopy excites only the
region of interest, a few micrometres in depth above the culture glass substrate
(Supplementary Fig. 1c), leading to a high signal-to-background ratio (SBR). We
determined the localization precision of the setup for different SBR, using fNDs
immobilized on a glass coverslip (see Methods), and achieved a localisation precision
smaller than 30 nm for SBR>3 (Fig. 1c). For the quantification of intraneuronal transport
parameters, trajectories with more than 30% of constitutive points having a SBR<3 were
excluded. Using such a filter, we obtained a mean localization precision of 12 nm over all
trajectories (Inset of Fig. 1c, n=460 trajectories from 11 experiments).
Fig. 1d displays a white-light illumination image of a main neuronal branch and its
smaller branches, merged with one frame of Supplementary Video 1 showing fNDs at
different locations (red spots), two of which moving in the same branch (Fig. 1e). Fig. 1f
shows the kymograph of these two fNDs, highlighting the “stop-and-go” behaviour
characteristic of organelle transport in neurons13. In order to characterize the fND-
containing cargoes, we first simultaneously acquired LysoTracker-tagged lysosomes and
fND using two-colour imaging (see Methods). We found a dynamical colocalisation of fND-
containing cargoes and lysosomes in less than 5% of moving fNDs (Supplementary
4
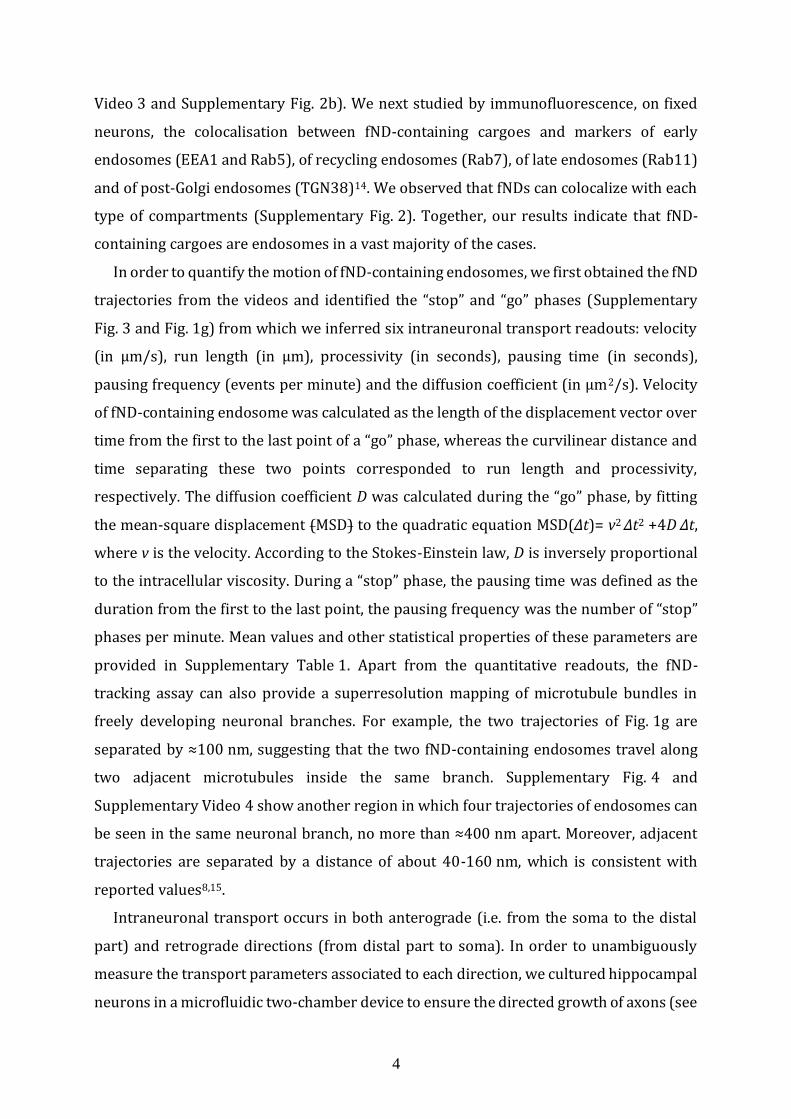
Video 3 and Supplementary Fig. 2b). We next studied by immunofluorescence, on fixed
neurons, the colocalisation between fND-containing cargoes and markers of early
endosomes (EEA1 and Rab5), of recycling endosomes (Rab7), of late endosomes (Rab11)
and of post-Golgi endosomes (TGN38)14. We observed that fNDs can colocalize with each
type of compartments (Supplementary Fig. 2). Together, our results indicate that fND-
containing cargoes are endosomes in a vast majority of the cases.
In order to quantify the motion of fND-containing endosomes, we first obtained the fND
trajectories from the videos and identified the “stop” and “go” phases (Supplementary
Fig. 3 and Fig. 1g) from which we inferred six intraneuronal transport readouts: velocity
(in µm/s), run length (in µm), processivity (in seconds), pausing time (in seconds),
pausing frequency (events per minute) and the diffusion coefficient (in µm2/s). Velocity
of fND-containing endosome was calculated as the length of the displacement vector over
time from the first to the last point of a “go” phase, whereas the curvilinear distance and
time separating these two points corresponded to run length and processivity,
respectively. The diffusion coefficient D was calculated during the “go” phase, by fitting
the mean-square displacement (MSD) to the quadratic equation MSD(Δt)= v2 Δt2 +4D Δt,
where v is the velocity. According to the Stokes-Einstein law, D is inversely proportional
to the intracellular viscosity. During a “stop” phase, the pausing time was defined as the
duration from the first to the last point, the pausing frequency was the number of “stop”
phases per minute. Mean values and other statistical properties of these parameters are
provided in Supplementary Table 1. Apart from the quantitative readouts, the fND-
tracking assay can also provide a superresolution mapping of microtubule bundles in
freely developing neuronal branches. For example, the two trajectories of Fig. 1g are
separated by ≈100 nm, suggesting that the two fND-containing endosomes travel along
two adjacent microtubules inside the same branch. Supplementary Fig. 4 and
Supplementary Video 4 show another region in which four trajectories of endosomes can
be seen in the same neuronal branch, no more than ≈400 nm apart. Moreover, adjacent
trajectories are separated by a distance of about 40-160 nm, which is consistent with
reported values8,15.
Intraneuronal transport occurs in both anterograde (i.e. from the soma to the distal
part) and retrograde directions (from distal part to soma). In order to unambiguously
measure the transport parameters associated to each direction, we cultured hippocampal
neurons in a microfluidic two-chamber device to ensure the directed growth of axons (see

5
Methods, Fig. 2 and Supplementary Video 5). We observed that transport parameters are
identical for anterograde and retrograde direction (Fig. 2c, p>0.05, 3 microfluidic
chambers and 3 cultures, n=22 and n=51 trajectories for anterograde and retrograde
direction respectively), as already reported for primary culture of hippocampal neurons6.
For this reason, we applied the assay to all freely-developing branches of neurons. This
approach contributed to get a high throughput in transport parameters measurements
(Fig. 1b). Finally, we checked that these readouts remained constant during the 45-minute
recordings for each culture well (Supplementary Fig. 5), and that there were no significant
differences between the readout values for two independent experiments
(Supplementary Fig. 6).
Next, as a comparison to a reference label for nanoscale tracking, we tested quantum
dots with similar charge, size and fluorescence spectrum than fNDs (see Methods). We
observed that QDs are less efficiently internalized (Supplementary Table 2) and that all
the moving QDs display ON-OFF fluorescence blinking, indicating that there is only a
single QD per cargo (see Supplementary Video 6). This ON-OFF random blinking impacts
the trajectory reconstruction and leads to biased transport parameters (Supplementary
Fig. 7). As a consequence, the transport parameters inferred from the QD-tracking assay
were not identical for technical duplicates, contrary to fNDs (Supplementary Fig. 8 and
Supplementary Table 2 for a comparison of QD and fND in term of tracking performance).
Altogether, these results demonstrate that perfect photostability of fND is the key for a
reliable transport measurement.
We then checked the sensitivity of the fND-tracking assay using a pharmacological drug
impacting the microtubule-based intraneuronal transport, at nanomolar concentrations.
This transport is dependent on the microtubule cytoskeleton integrity, and microtubule
can be depolymerized by extracellular application of nocodazole. Here, we used 2 nM and
5 nM nocodazole concentration during the course of the 1 h-experiment, whereas this
drug is standardly applied at micromolar concentrations for several hours16. As shown in
Fig. 3a (4 embryos, n=39, 33 and 40 trajectories for 0 nM, 2 nM and 5 nM respectively),
we observed (i) a decrease in velocity (p=3.8×10⁻⁴ and p=1.4×10⁻⁷ for 2 nM and 5 nM
respectively), in run length (p=3.4×10⁻⁴, p=5.3×10⁻⁶) and in processivity (p = 4.5×10⁻³,
p=9.8×10⁻⁵), and (ii) an increase in pausing time (p=0.003, p=6.4×10⁻⁵). Conversely, we
observed a decrease in pausing frequency only for 5 nM (p=0.016) and the diffusion
coefficients were not significantly affected (Supplementary Fig. 9). The increase in
6
pausing time and decrease in run length and processivity are consistent with motors
unable to overcome the interruptions caused by microtubule depolymerisation. The
constancy of the diffusion coefficient indicates that the viscosity is not affected inside
neuronal branches. Altogether, intraneuronal transport parameters vary in a drug
dosage-dependent manner and change as expected for microtubule depolymerisation.
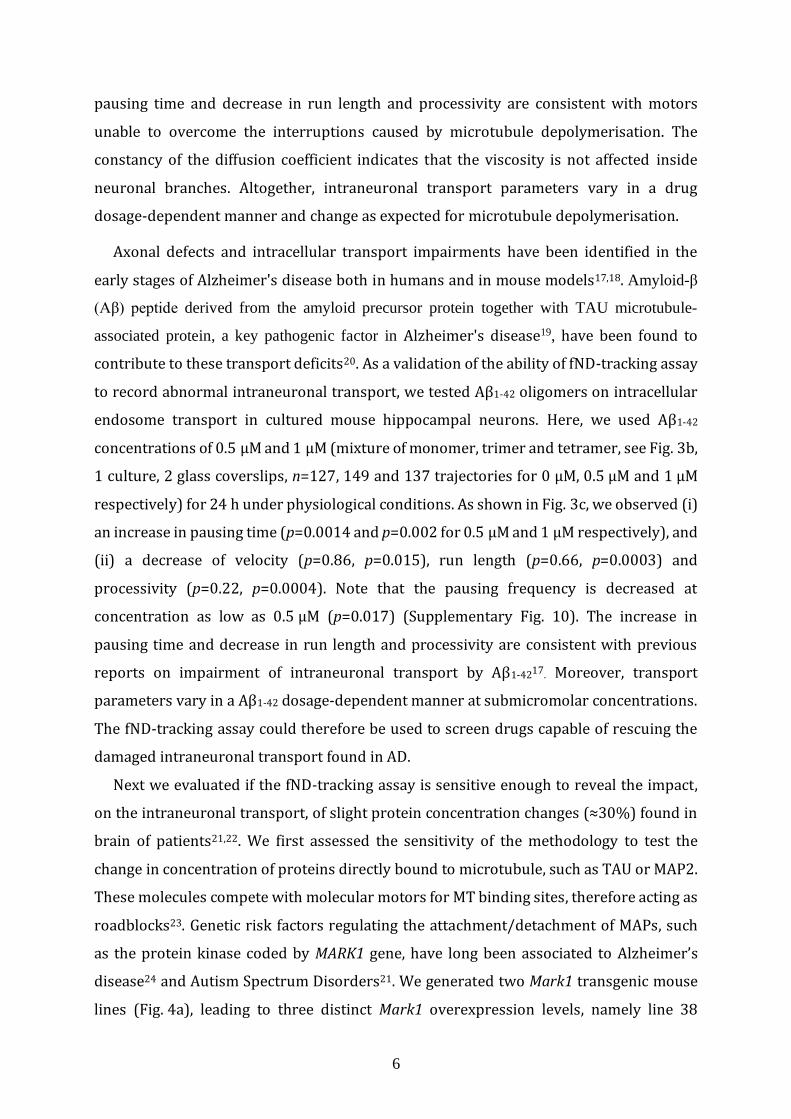
Axonal defects and intracellular transport impairments have been identified in the
early stages of Alzheimer's disease both in humans and in mouse models17,18. Amyloid-β
(Aβ) peptide derived from the amyloid precursor protein together with TAU microtubule-
associated protein, a key pathogenic factor in Alzheimer's disease19, have been found to
contribute to these transport deficits20. As a validation of the ability of fND-tracking assay
to record abnormal intraneuronal transport, we tested Aβ1-42 oligomers on intracellular
endosome transport in cultured mouse hippocampal neurons. Here, we used Aβ1-42
concentrations of 0.5 µM and 1 µM (mixture of monomer, trimer and tetramer, see Fig. 3b,
1 culture, 2 glass coverslips, n=127, 149 and 137 trajectories for 0 µM, 0.5 µM and 1 µM
respectively) for 24 h under physiological conditions. As shown in Fig. 3c, we observed (i)
an increase in pausing time (p=0.0014 and p=0.002 for 0.5 µM and 1 µM respectively), and
(ii) a decrease of velocity (p=0.86, p=0.015), run length (p=0.66, p=0.0003) and
processivity (p=0.22, p=0.0004). Note that the pausing frequency is decreased at
concentration as low as 0.5 µM (p=0.017) (Supplementary Fig. 10). The increase in
pausing time and decrease in run length and processivity are consistent with previous
reports on impairment of intraneuronal transport by Aβ1-4217. Moreover, transport
parameters vary in a Aβ1-42 dosage-dependent manner at submicromolar concentrations.
The fND-tracking assay could therefore be used to screen drugs capable of rescuing the
damaged intraneuronal transport found in AD.
Next we evaluated if the fND-tracking assay is sensitive enough to reveal the impact,
on the intraneuronal transport, of slight protein concentration changes (≈30%) found in
brain of patients21,22. We first assessed the sensitivity of the methodology to test the
change in concentration of proteins directly bound to microtubule, such as TAU or MAP2.
These molecules compete with molecular motors for MT binding sites, therefore acting as
roadblocks23. Genetic risk factors regulating the attachment/detachment of MAPs, such
as the protein kinase coded by MARK1 gene, have long been associated to Alzheimer’s
disease24 and Autism Spectrum Disorders21. We generated two Mark1 transgenic mouse
lines (Fig. 4a), leading to three distinct Mark1 overexpression levels, namely line 38
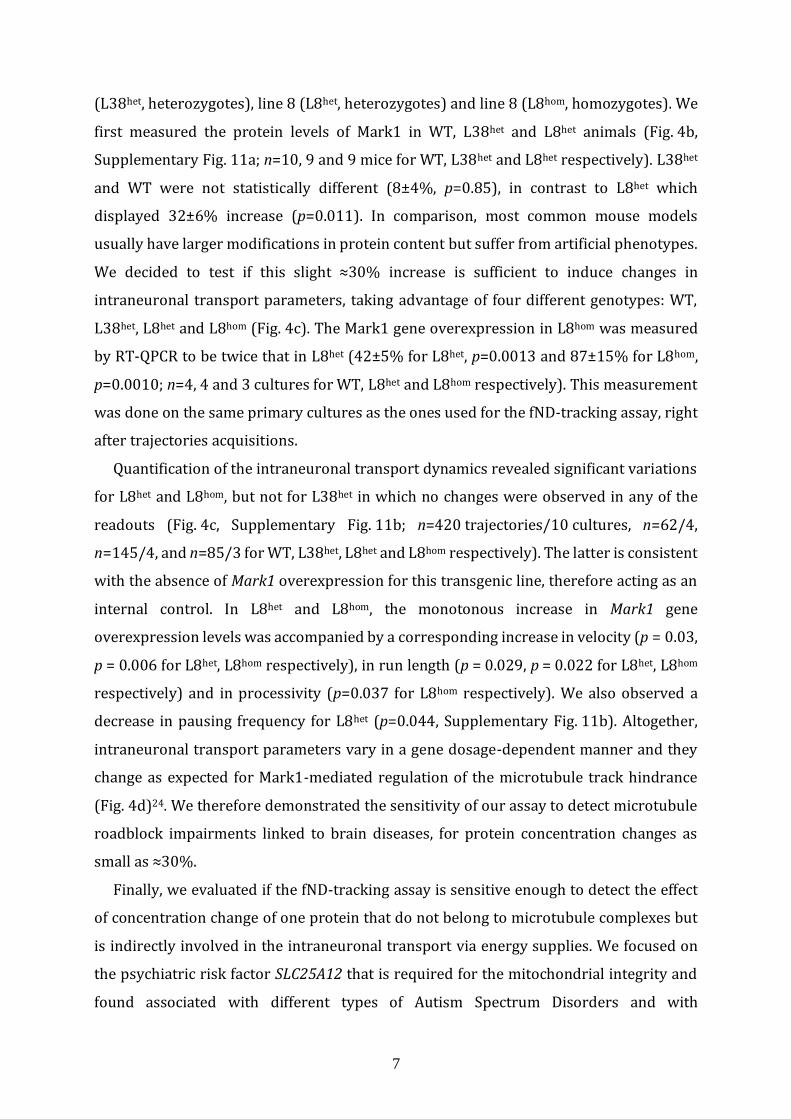
7
(L38het, heterozygotes), line 8 (L8het, heterozygotes) and line 8 (L8hom, homozygotes). We
first measured the protein levels of Mark1 in WT, L38het and L8het animals (Fig. 4b,
Supplementary Fig. 11a; n=10, 9 and 9 mice for WT, L38het and L8het respectively). L38het
and WT were not statistically different (8±4%, p=0.85), in contrast to L8het which
displayed 32±6% increase (p=0.011). In comparison, most common mouse models
usually have larger modifications in protein content but suffer from artificial phenotypes.
We decided to test if this slight ≈30% increase is sufficient to induce changes in
intraneuronal transport parameters, taking advantage of four different genotypes: WT,
L38het, L8het and L8hom (Fig. 4c). The Mark1 gene overexpression in L8hom was measured
by RT-QPCR to be twice that in L8het (42±5% for L8het, p=0.0013 and 87±15% for L8hom,
p=0.0010; n=4, 4 and 3 cultures for WT, L8het and L8hom respectively). This measurement
was done on the same primary cultures as the ones used for the fND-tracking assay, right
after trajectories acquisitions.
Quantification of the intraneuronal transport dynamics revealed significant variations
for L8het and L8hom, but not for L38het in which no changes were observed in any of the
readouts (Fig. 4c, Supplementary Fig. 11b; n=420 trajectories/10 cultures, n=62/4,
n=145/4, and n=85/3 for WT, L38het, L8het and L8hom respectively). The latter is consistent
with the absence of Mark1 overexpression for this transgenic line, therefore acting as an
internal control. In L8het and L8hom, the monotonous increase in Mark1 gene
overexpression levels was accompanied by a corresponding increase in velocity (p = 0.03,
p = 0.006 for L8het, L8hom respectively), in run length (p = 0.029, p = 0.022 for L8het, L8hom
respectively) and in processivity (p=0.037 for L8hom respectively). We also observed a
decrease in pausing frequency for L8het (p=0.044, Supplementary Fig. 11b). Altogether,
intraneuronal transport parameters vary in a gene dosage-dependent manner and they
change as expected for Mark1-mediated regulation of the microtubule track hindrance
(Fig. 4d)24. We therefore demonstrated the sensitivity of our assay to detect microtubule
roadblock impairments linked to brain diseases, for protein concentration changes as
small as ≈30%.
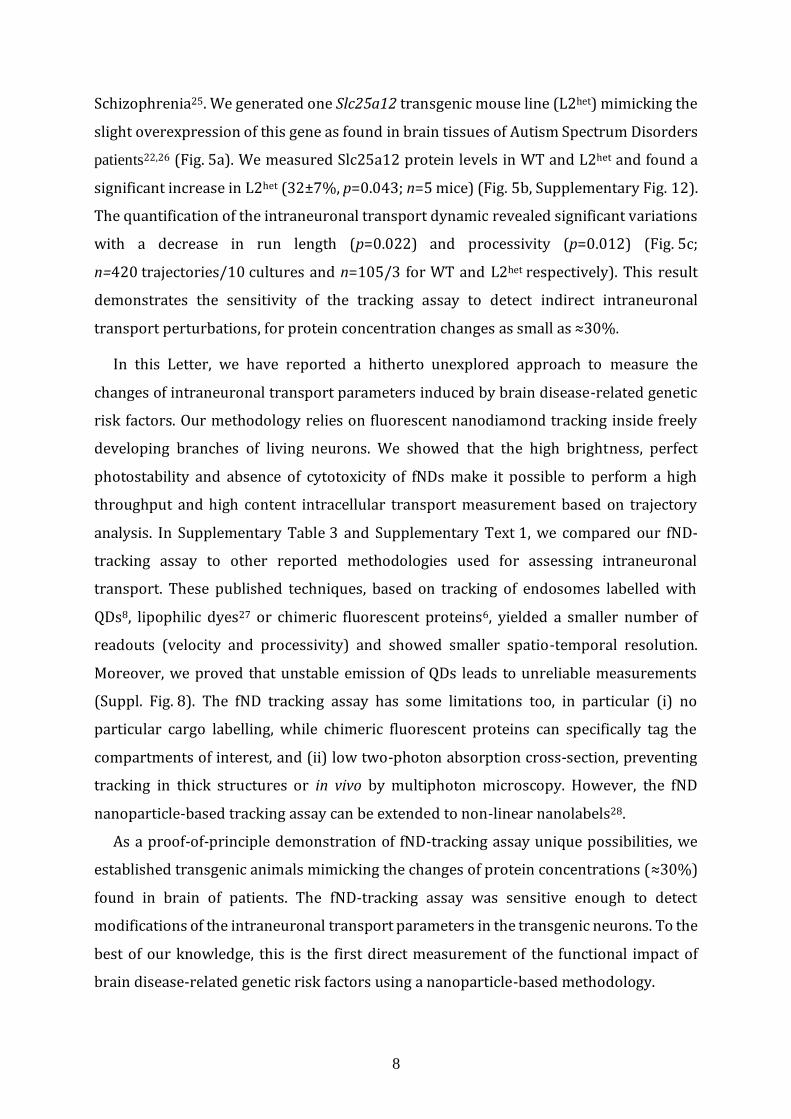
Finally, we evaluated if the fND-tracking assay is sensitive enough to detect the effect
of concentration change of one protein that do not belong to microtubule complexes but
is indirectly involved in the intraneuronal transport via energy supplies. We focused on
the psychiatric risk factor SLC25A12 that is required for the mitochondrial integrity and
found associated with different types of Autism Spectrum Disorders and with
8
Schizophrenia25. We generated one Slc25a12 transgenic mouse line (L2het) mimicking the
slight overexpression of this gene as found in brain tissues of Autism Spectrum Disorders
patients22,26 (Fig. 5a). We measured Slc25a12 protein levels in WT and L2het and found a
significant increase in L2het (32±7%, p=0.043; n=5 mice) (Fig. 5b, Supplementary Fig. 12).
The quantification of the intraneuronal transport dynamic revealed significant variations
with a decrease in run length (p=0.022) and processivity (p=0.012) (Fig. 5c;
n=420 trajectories/10 cultures and n=105/3 for WT and L2het respectively). This result
demonstrates the sensitivity of the tracking assay to detect indirect intraneuronal
transport perturbations, for protein concentration changes as small as ≈30%.
In this Letter, we have reported a hitherto unexplored approach to measure the
changes of intraneuronal transport parameters induced by brain disease-related genetic
risk factors. Our methodology relies on fluorescent nanodiamond tracking inside freely
developing branches of living neurons. We showed that the high brightness, perfect
photostability and absence of cytotoxicity of fNDs make it possible to perform a high
throughput and high content intracellular transport measurement based on trajectory
analysis. In Supplementary Table 3 and Supplementary Text 1, we compared our fND-
tracking assay to other reported methodologies used for assessing intraneuronal
transport. These published techniques, based on tracking of endosomes labelled with
QDs8, lipophilic dyes27 or chimeric fluorescent proteins6, yielded a smaller number of
readouts (velocity and processivity) and showed smaller spatio-temporal resolution.
Moreover, we proved that unstable emission of QDs leads to unreliable measurements
(Suppl. Fig. 8). The fND tracking assay has some limitations too, in particular (i) no
particular cargo labelling, while chimeric fluorescent proteins can specifically tag the
compartments of interest, and (ii) low two-photon absorption cross-section, preventing
tracking in thick structures or in vivo by multiphoton microscopy. However, the fND
nanoparticle-based tracking assay can be extended to non-linear nanolabels28.
As a proof-of-principle demonstration of fND-tracking assay unique possibilities, we
established transgenic animals mimicking the changes of protein concentrations (≈30%)
found in brain of patients. The fND-tracking assay was sensitive enough to detect
modifications of the intraneuronal transport parameters in the transgenic neurons. To the
best of our knowledge, this is the first direct measurement of the functional impact of
brain disease-related genetic risk factors using a nanoparticle-based methodology.
9
In a near future, with the swift development of the CRISPR/Cas9 genome editing
technology29, it is possible to model multiple brain disease-related genetic risk factors in
transgenic animals. Our fND tracking methodology is adapted to understand how these
multiple genetic variants interact with each other to impair the intraneuronal transport.
Furthermore, powerful methodologies to dissect the molecular basis of complex brain
diseases are emerging such as 3D-human neuron cultures derived from induced
pluripotent stem cells obtained from patients30,31. In the long run, this method can be
instrumental to develop an unbiased diagnosis of neuropsychiatric and
neurodegenerative diseases, with potential applications in translational nanomedicine.

10
References
1. McClellan, J. & King, M.-C. C. Genetic heterogeneity in human disease. Cell 141, 210–7 (2010).
2. Hirokawa, N., Niwa, S. & Tanaka, Y. Molecular motors in neurons: transport mechanisms and roles in brain function, development, and disease. Neuron 68, 610–38 (2010).
3. Millecamps, S. & Julien, J.-P. Axonal transport deficits and neurodegenerative diseases. Nat. Rev. Neurosci. 14, 161–76 (2013).
4. Schirhagl, R., Chang, K., Loretz, M. & Degen, C. L. Nitrogen-Vacancy Centers in Diamond: Nanoscale Sensors for Physics and Biology. Annu. Rev. Phys. Chem. 65, 83–105 (2014).
5. de Angelis, M. H. et al. Analysis of mammalian gene function through broad-based phenotypic screens across a consortium of mouse clinics. Nat. Genet. 47, 969–978 (2015).
6. Kwinter, D. M., Lo, K., Mafi, P. & Silverman, M. A. Dynactin regulates bidirectional transport of dense-core vesicles in the axon and dendrites of cultured hippocampal neurons. Neuroscience 162, 1001–1010 (2009).
7. Pinaud, F., Clarke, S., Sittner, A. & Dahan, M. Probing cellular events, one quantum dot at a time. Nat. Methods 7, 275–285 (2010).
8. Mudrakola, H. V, Zhang, K. & Cui, B. Optically Resolving Individual Microtubules in Live Axons. Structure 17, 1433–1441 (2009).
9. Chang, Y.-R. et al. Mass production and dynamic imaging of fluorescent nanodiamonds. Nat. Nanotechnol. 3, 284–288 (2008).
10. Wu, T. et al. Tracking the engraftment and regenerative capabilities of transplanted lung stem cells using fluorescent nanodiamonds. Nat. Nanotechnol. 8, 682–689 (2013).
11. Huang, Y.-A. et al. The effect of fluorescent nanodiamonds on neuronal survival and morphogenesis. Sci. Rep. 4, 6919 (2014).
12. Blanpied, T., Scott, D. & Ehlers, M. Dynamics and regulation of clathrin coats at specialized endocytic zones of dendrites and spines. Neuron 36, 435–449 (2002).
13. Overly, C. C., Rieff, H. I. & Hollenbeck, P. J. Organelle motility and metabolism in axons vs dendrites of cultured hippocampal neurons. J. Cell Sci. 109, 971–980 (1996).
14. Rodriguez-Boulan, E., Kreitzer, G. & Müsch, A. Organization of vesicular trafficking in epithelia. Nat. Rev. Mol. Cell Biol. 6, 233–247 (2005).
15. Chen, J., KANAI, Y., Cowan, N. J. & HIROKAWA, N. Projection Domains of Map2 and Tau Determine Spacings Between Microtubules in Dendrites and Axons. Nature 360, 674–676 (1992).
16. Courty, S., Luccardini, C., Bellaiche, Y., Cappello, G. & Dahan, M. Tracking Individual Kinesin Motors in Living Cells Using Single Quantum-Dot Imaging. Nano Lett. 6, 1491–1495 (2006).
17. Stokin, G. B. et al. Axonopathy and transport deficits early in the pathogenesis of

11
Alzheimer’s disease. Science 307, 1282–8 (2005).
18. Encalada, S. E. & Goldstein, L. S. B. Biophysical Challenges to Axonal Transport: Motor-Cargo Deficiencies and Neurodegeneration. Annu. Rev. Biophys. 43, 141–169 (2014).
19. Querfurth, H. W. & LaFerla, F. M. Alzheimer’s disease. N. Engl. J. Med. 362, 329–44 (2010).
20. Vossel, K. A. et al. Tau Reduction Prevents A -Induced Defects in Axonal Transport. Science 330, 198–198 (2010).
21. Maussion, G. et al. Convergent evidence identifying MAP/microtubule affinity-regulating kinase 1 (MARK1) as a susceptibility gene for autism. Hum. Mol. Genet. 17, 2541–51 (2008).
22. Lepagnol-Bestel, A. M. et al. SLC25A12 expression is associated with neurite outgrowth and is upregulated in the prefrontal cortex of autistic subjects. Mol. Psychiatry 13, 385–97 (2008).
23. Lakadamyali, M. Navigating the cell: how motors overcome roadblocks and traffic jams to efficiently transport cargo. Phys. Chem. Chem. Phys. 16, 5907–16 (2014).
24. Mandelkow, E.-M. E., Thies, E., Trinczek, B. & Biernat, J. MARK/PAR1 kinase is a regulator of microtubule-dependent transport in axons. J. Cell Biol. 167, 99–110 (2004).
25. Fromer, M. et al. De novo mutations in schizophrenia implicate synaptic networks. Nature 506, 179–84 (2014).
26. Palmieri, L. et al. Altered calcium homeostasis in autism-spectrum disorders: evidence from biochemical and genetic studies of the mitochondrial aspartate/glutamate carrier AGC1. Mol. Psychiatry 15, 38–52 (2010).
27. Nakamura, H. et al. Quantitative analysis of intraneuronal transport in human iPS neurons. J. Pharmacol. Sci. 128, 170–178 (2015).
28. Mayer, L. et al. Single KTP nanocrystals as second-harmonic generation biolabels in cortical neurons. Nanoscale 5, 8466–71 (2013).
29. Doudna, J. A. & Charpentier, E. The new frontier of genome engineering with CRISPR-Cas9. Science 346, 1258096–1258096 (2014).
30. Choi, S. H. et al. A three-dimensional human neural cell culture model of Alzheimer’s disease. Nature 515, 274–278 (2014).
31. Paşca, A. M. et al. Functional cortical neurons and astrocytes from human pluripotent stem cells in 3D culture. Nat. Methods 12, 671–678 (2015).
12
Acknowledgments
We thank Paul Tchénio for his comments on the manuscript, Alain Lombard for his contribution to data processing, Joanna Lipecka for her help with western blotting. This
work was supported by a public grant overseen by the French National research Agency
(ANR) as part of the « Investissement d’Avenir » program IDEX Paris-Saclay ANR-11-
IDEX- 0003-02 (S.H.); the ANR and the Ministry of Science and Technology (Taiwan) through grant ANR-2010-INTB-1002 (M.S., F.T., H.C.C., C.C.W.); the ANR through the
Eranet Euronanomed project 2011-ERNA-006 (F.T., M.S., C.S., A.C.); the Fondation Jérôme
Lejeune (M.S.), the European Union FP7-Health “AgedBrainSysBio” grant (M.S.); grant
n°12018592 from Region Ile-de-France (F.T.); CNRS “Programme interdisciplinaire” (F.T., M.S.) and Triangle de la Physique contract no. 2012-038T (F.T., M.S.). Authors contributions SH, FT and MS conceived and designed the experiments; SH, NM, YLM, AMLB, MPA, SM, XLL, JV, CP, ED, CR and RD performed the experiments; SH, NM, SM, MPA and XLL analyzed the data; PK, FJH, CCW, BP, YH, CS, AC, BA and HCC contributed to materials/analysis tools; SH, FT and MS wrote the paper. Additional information Supplementary information is available in the online version of the paper. Reprints and permissions information is available online at www.nature.com/reprints. Correspondence and requests for materials should be addressed to F.T. or M.S. Competing financial interests The authors declare no competing financial interests.

13
Figures
Figure 1 | Intraneuronal transport monitoring by fluorescent nanodiamond
tracking. fNDs internalise spontaneously and efficiently in neuronal branches. Their
tracking by fluorescence video-microscopy at high spatio-temporal resolution allows to
reconstruct their trajectories. STOP and GO phases detection make it possible to extract
several transport parameters. a, Experimental pipeline from hippocampal neuron culture
dissociated from E18.5 mouse embryo to endosome trajectory acquisition using pseudo-
TIRF microscopy. DIV: day in vitro. b, Histogram of dataset sizes, i.e. number of trajectories
exploited for readouts quantification. The mean value is 37 trajectories/run (n=56 runs).
c, Localization precision versus signal-to-background ratio (SBR) of fNDs immobilized on
a glass coverslip (from ~100 fNDs imaged over 200 frames; data plotted as mean+/-
standard deviation). By applying a cut-off at SBR=3, we obtained a localization precision
better than 30 nm. Inset: distribution of the mean localization precision for each fND-
containing endosome trajectory (n=460 trajectories from 11 wild type experiments). d,
Transmission white-light illumination image of the neuronal branches merged with the
fluorescence channel (extracted from Supplementary Video 1) showing four fNDs moving
within dendrites (yellow arrows). The cell soma associated with the main branch is on the
left (not visible). During the two-minute movie, two fND-containing endosomes, labelled
#1 and #2 (solid white line box) were observed moving towards the cell soma, in the same
branch. e, Superimposition onto a white light image of the positions of these two fNDs
(#1, in yellow; #2 in green), determined by particle tracking, with a persistence of 10 s, at
different times. Scale bars: 5 µm in (d) and 1 µm in (e). f, Kymograph of the motion of fNDs
#1 and #2 shown in (e)(white box), illustrating their “stop-and-go” behavior. Scale bars:
15 µm (space) and 10 s (time). g, Top: trajectories of fND #1 and #2 extracted from the

14
fluorescence video (dashed line rectangle in (e)). The two colours in each trajectory
correspond to “go” phases (in green for fND #1 and yellow for fND #2) and “stop” phases
(in blue for fND #1 and red for fND #2), as identified by our trajectory analysis algorithm
(see Methods); bottom: two-state (“stop” and “go”) representation of the same
trajectories over time: fND #1 moved faster than fND# 2 (scale bar: 1 s).
Figure 2 | Transport parameter quantification for anterograde and retrograde
motions in axons of neurons grown in microfluidic chamber. a, DIC image of axons
emerging from one microfluidic channel. Scale Bar: 5 µm. b, Colour-coded kymograph
showing anterograde (green) and retrograde (red) motions. Scale bars: time (horizontal)
5 s, space (vertical) 10 µm. c, Quantification of the transport readouts. No significant (ns)
differences between both directions of motion were observed (Wilcoxon and Mann-
Whitney two-tailed test p>0.05). Data are displayed as mean values ± s.e.m. Figures
written inside the bars represent the total number of trajectories from n=3 microfluidic
chambers from n=3 cultures.
soma axons
0
0.5
1
1.5
2
1 2
Ve
locity (
µm
/s)
0
0.2
0.4
0.6
0.8
1 2
Ru
n L
en
gth
(µ
m)
0
0.1
0.2
0.3
0.4
0.5
1 2
Pro
ce
ssiv
ity (
s)
0
0.1
0.2
0.3
0.4
0.5
0.6
1 2
Pau
sin
g T
ime (
s)
0
20
40
60
80
100
1 2
Pau
sin
g F
req
(eve
nts
/min
)
0
0.05
0.1
0.15
0.2
1 2
Diffu
sio
n C
oe
f(µ
m²/
s)
ns
ns ns nsns
ns
Anterograde Retrograde
a b
c
22
51
22
51
22
51
22
51
22
51 22
51
15
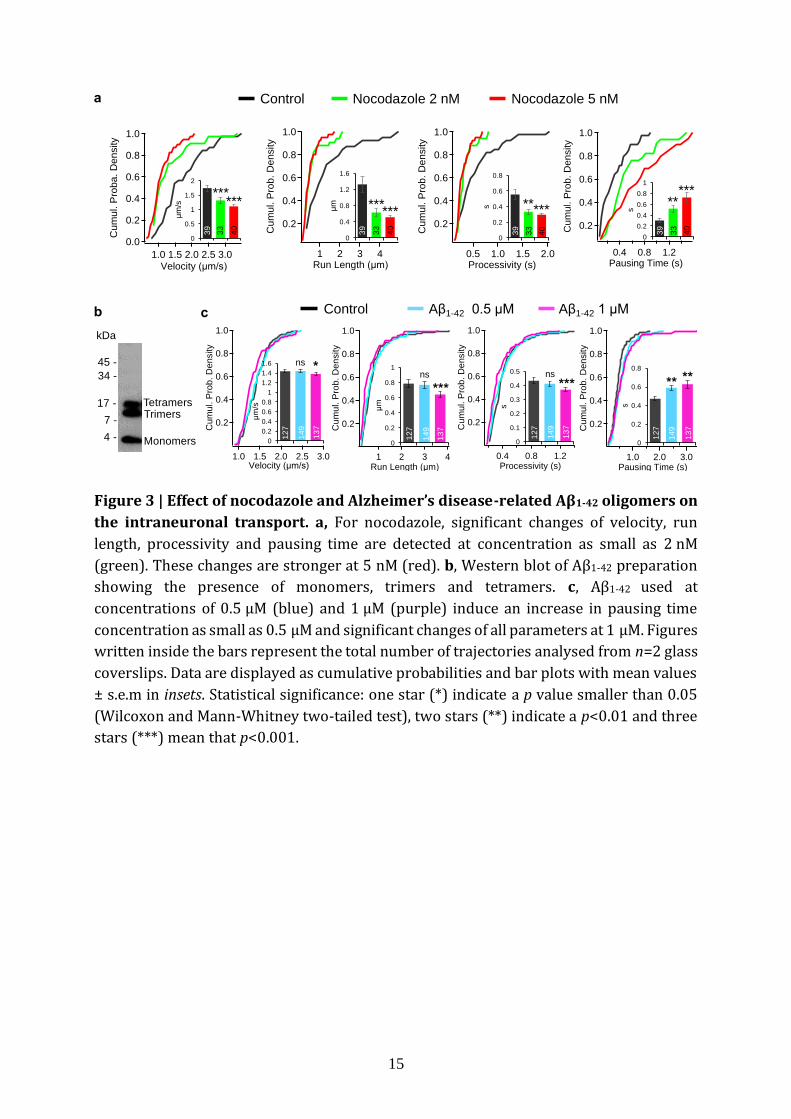
Figure 3 | Effect of nocodazole and Alzheimer’s disease-related Aβ1-42 oligomers on
the intraneuronal transport. a, For nocodazole, significant changes of velocity, run
length, processivity and pausing time are detected at concentration as small as 2 nM
(green). These changes are stronger at 5 nM (red). b, Western blot of Aβ1-42 preparation
showing the presence of monomers, trimers and tetramers. c, Aβ1-42 used at
concentrations of 0.5 µM (blue) and 1 µM (purple) induce an increase in pausing time
concentration as small as 0.5 µM and significant changes of all parameters at 1 µM. Figures
written inside the bars represent the total number of trajectories analysed from n=2 glass
coverslips. Data are displayed as cumulative probabilities and bar plots with mean values
± s.e.m in insets. Statistical significance: one star (*) indicate a p value smaller than 0.05
(Wilcoxon and Mann-Whitney two-tailed test), two stars (**) indicate a p<0.01 and three
stars (***) mean that p<0.001.
1.0
0.8
0.6
0.4
0.2
Cu
mu
l. P
rob.
De
nsity
4321Run Length (µm)
0
0.4
0.8
1.2
1.6
µm
******
1.0
0.8
0.6
0.4
0.2
Cu
mu
l. P
rob
. D
en
sity
2.01.51.00.5Processivity (s)
1.0
0.8
0.6
0.4
0.2
0.0
Cum
ul. P
rob
a.
Den
sity
3.02.52.01.51.0Velocity (µm/s)
1.0
0.8
0.6
0.4
0.2Cu
mu
l. P
rob
. D
en
sity
1.20.80.4Pausing Time (s)
0
0.5
1
1.5
2µ
m/s
0
0.2
0.4
0.6
0.8
1
s
*****
0
0.2
0.4
0.6
0.8
s *****3
9
33
40
39
33
40
39
33
40
39
33
40
a
b c
Nocodazole 5 nMNocodazole 2 nMControl
Control Aβ1-42 0.5 µM Aβ1-42 1 µM
1.0
0.8
0.6
0.4
0.2
Cu
mul. P
rob
. D
en
sity
3.02.52.01.51.0Velocity (µm/s)
1.0
0.8
0.6
0.4
0.2
Cu
mul. P
rob
. D
en
sity
1.20.80.4Processivity (s)
1.0
0.8
0.6
0.4
0.2Cu
mu
l. P
rob
. D
ensity
3.02.01.0Pausing Time (s)
1.0
0.8
0.6
0.4
0.2Cu
mu
l. P
rob
. D
en
sity
4321Run Length (µm)
0
0.2
0.4
0.6
0.8
1
1.2
1.4
1.6
µm
/s
0
0.2
0.4
0.6
0.8
1
µm
0
0.1
0.2
0.3
0.4
0.5
s
0
0.2
0.4
0.6
0.8
s
***nsns
ns
** *****
*
12
7
14
9
13
7
12
7
14
9
13
7
12
7
14
9
13
7
12
7
14
9
13
7
4 -
7 -
17 -
34 -
45 -
kDa
TetramersTrimers
Monomers
******
16
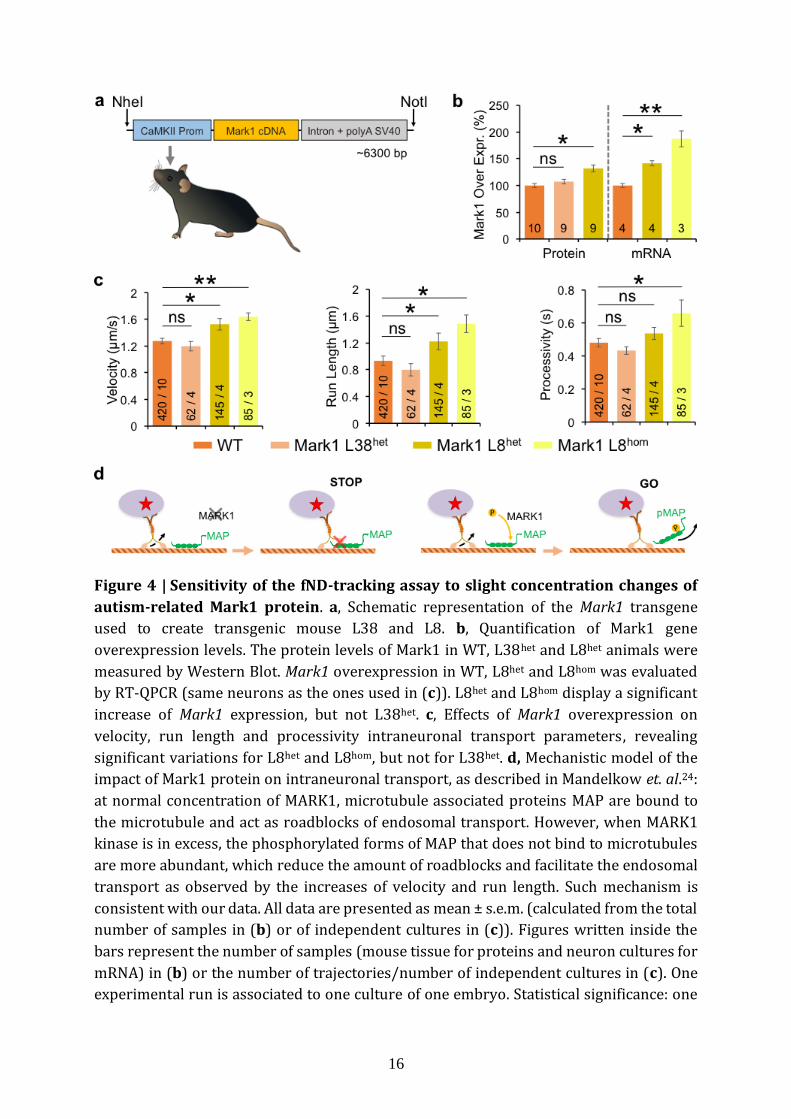
Figure 4 | Sensitivity of the fND-tracking assay to slight concentration changes of
autism-related Mark1 protein. a, Schematic representation of the Mark1 transgene
used to create transgenic mouse L38 and L8. b, Quantification of Mark1 gene
overexpression levels. The protein levels of Mark1 in WT, L38het and L8het animals were
measured by Western Blot. Mark1 overexpression in WT, L8het and L8hom was evaluated
by RT-QPCR (same neurons as the ones used in (c)). L8het and L8hom display a significant
increase of Mark1 expression, but not L38het. c, Effects of Mark1 overexpression on
velocity, run length and processivity intraneuronal transport parameters, revealing
significant variations for L8het and L8hom, but not for L38het. d, Mechanistic model of the
impact of Mark1 protein on intraneuronal transport, as described in Mandelkow et. al.24:
at normal concentration of MARK1, microtubule associated proteins MAP are bound to
the microtubule and act as roadblocks of endosomal transport. However, when MARK1
kinase is in excess, the phosphorylated forms of MAP that does not bind to microtubules
are more abundant, which reduce the amount of roadblocks and facilitate the endosomal
transport as observed by the increases of velocity and run length. Such mechanism is
consistent with our data. All data are presented as mean ± s.e.m. (calculated from the total
number of samples in (b) or of independent cultures in (c)). Figures written inside the
bars represent the number of samples (mouse tissue for proteins and neuron cultures for
mRNA) in (b) or the number of trajectories/number of independent cultures in (c). One
experimental run is associated to one culture of one embryo. Statistical significance: one
17
star (*) indicates p value smaller than 0.05 (Wilcoxon and Mann-Whitney two-tailed test),
two stars (**) are for p <0.01.
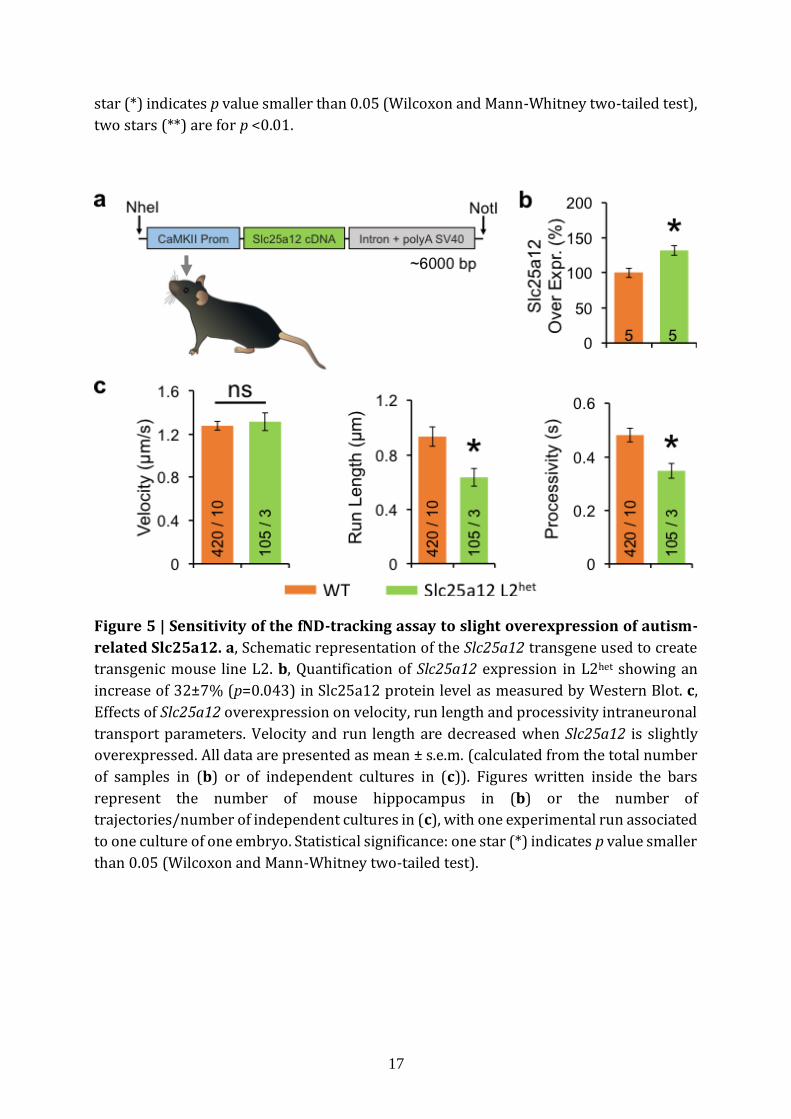
Figure 5 | Sensitivity of the fND-tracking assay to slight overexpression of autism-
related Slc25a12. a, Schematic representation of the Slc25a12 transgene used to create
transgenic mouse line L2. b, Quantification of Slc25a12 expression in L2het showing an
increase of 32±7% (p=0.043) in Slc25a12 protein level as measured by Western Blot. c,
Effects of Slc25a12 overexpression on velocity, run length and processivity intraneuronal
transport parameters. Velocity and run length are decreased when Slc25a12 is slightly
overexpressed. All data are presented as mean ± s.e.m. (calculated from the total number
of samples in (b) or of independent cultures in (c)). Figures written inside the bars
represent the number of mouse hippocampus in (b) or the number of
trajectories/number of independent cultures in (c), with one experimental run associated
to one culture of one embryo. Statistical significance: one star (*) indicates p value smaller
than 0.05 (Wilcoxon and Mann-Whitney two-tailed test).

18
Methods
Fluorescent nanodiamond production.
The nanodiamonds were radiation-damaged with a high-energy (3 MeV) proton beam, as
detailed in Su et al.32 A thin diamond film (thickness<50 µm) was prepared by depositing ≈5 mg of nanodiamond powder on a silicon wafer (1×1 cm2 size) and subsequently
subjected to the ion irradiation at a dose of ≈2×10¹⁶ H+.cm-2. Afterwards, the radiation-
damaged nanodiamonds were annealed at 800°C for 2 h to form fNDs. To remove graphitic carbon atoms on the surface, the freshly prepared fNDs were oxidized in air at
490°C for 2 h and microwave-cleaned in concentrated H2SO4–HNO3 (3:1, v/v) at 100°C for
3 h. The average number of nitrogen vacancy colour centres per fND is 15.
Pseudo-TIRF Microscopy setup and video acquisition TIRF illumination was implemented on a two-stages inverted microscope (Eclipse Ti-E,
Nikon, Japan), equipped with 100x magnification and 1.49 numerical aperture immersion
oil objective (CFI Apo TIRF 100X Oil, Nikon, Japan). The excitation beam from a
continuous-wave diode-pumped solid-state laser emitting at the wavelength of 561 nm with a maximum power of 100 mW (SLIM-561-100, Oxxius S.A., France) was expanded
16x and then focused on the back focal plane of the microscope objective, off the
propagation axis to ensure partial internal reflection at the culture dish glass - medium
interface. This configuration results in wide-field illumination of a volume confined to
≈2 µm above this interface and to an in-plane disc of ≈40 µm diameter, ensuring a larger
signal-to-background ratio than in epifluorescence configuration. The maximum laser
intensity was 20 kW/cm2 in the sample plane. We used filters adapted to the spectral characteristics of nitrogen vacancy colour centres in diamond: a dichroic beamsplitter
with a steep edge at 561 nm and a 97% flat transmission above this wavelength (zt561rdc,
Chroma Corp., USA) and a band-pass filter centred on 697 nm wavelength with a full-
width at half maximum (FWHM) of 75 nm (HC 697/75, Semrock, USA), on the detection channel. White-light illumination observations were done with the differential
interference contrast mode of the microscope without changing the microscope objective.
The whole microscope was enclosed in a cage incubator (Okolab, Italy) allowing to
maintain a temperature of 37°C, 5% partial CO2 pressure and 100% hygrometry,
necessary for live neuron imaging. Images and videos were recorded with a cooled
electron multiplied CCD array detector (iXon-DU885, Andor Technology, Ireland), having
a pixel size in the sample plane of 80 nm.
Video processing, trajectory extraction and analysis.
We recorded videos of total duration of 120 s, at a time resolution of 50 ms/frame with
Nikon NIS software in the proprietary ND2 format (Fig. 1a). A filtering pretreatment was
done with Fiji software (version 1.46j; NIH, USA), which consists in subtracting to each frame the median intensity of the whole stack in order to remove static fluorescent spots.
For each dynamic fND-containing endosome, we reconstructed the full trajectory using
the Spot Detector plugin of ICY image analysis software (GPLv3 open source) developed
by the Quantitative Image Analysis team at Institut Pasteur (Paris, France)33. Using the
Track Manager plugin, we exported a text file containing the spot (X,Y) coordinates and
the signal amplitude and background (based on a 2D-gaussian fitting of fluorescence
spots), and we processed these data with a home-made program written for Igor Pro
19
software (WaveMetrics Inc., USA). Detection of “stop” and “go” phases relies on two main
steps, namely a coarse “stop” phase detection based on the confinement ratio function,
and a refine “go” detection based on three different sequential filters as detailed in
Supplementary Fig. 3. Transport readouts for each trajectory are then computed and the program finally makes a statistical report for the entire run set corresponding to one
experiment, namely one LabTek well. The IgorPro program is available upon request.
Localization precision. We calibrated the localization precision of our set-up by tracking
the position of more than 100 fNDs immobilized on a glass coverslip and imaged over 100
frames. We then analysed the video with the same tracking software parameters as for
the intraneuronal trajectories. Movies were background-subtracted using Fiji plugin with
a rolling ball of 20 pixels, in order to mimic the effect of a median subtraction. For each fND, the localization precision was measured as the standard deviation of the center
positions of the fluorescent spot over time. We then plotted all localization precisions with
respect to the signal-to-background ratio (SBR) associated to each fND (Fig. 1c). SBR was
determined as the ratio of the maximum fluorescence intensity of the fND (amplitude minus residual background) over the residual background intensity. Therefore,
trajectories containing more than 30% of points having a SBR smaller than 3 were not
considered, so that according to the calibration, we achieved a localization precision
better than 30 nm.
Primary hippocampal neuron cultures.
For wild type neuron cultures, hippocampi from E18.5 OF1 mouse embryos were isolated
in a dissecting medium (HBSS-Hepes) and hippocampus from at least four embryos were pooled together. Hippocampal neurons were then enzymatically dissociated (0.25%
trypsin), mechanically triturated and plated on LabTek II (Nunc, USA) dishes (2x10⁵ cells
per well) coated with poly-DL-ornithin (Sigma-Aldrich, USA), in DMEM (Invitrogen, USA)
supplemented with 10% foetal bovin serum (FBS), 0.1% GlutaMAX (Invitrogen) and 1% PenStrep (Invitrogen). Two hours after plating, DMEM was replaced by Neurobasal
phenol-free medium (Invitrogen) supplemented with 0.1% GlutaMAX (Invitrogen), 2%
B27 (Invitrogen) and 1% PenStrep (Invitrogen). Cultures from C57Bl6 transgenic mouse
were conducted separately for each embryo and genotyping was performed elsewhere.
Cultures in microfluidic devices (RD450 from Xona Microfluidics, USA) were performed
on coated 22 mm coverslip, plated with 5.106 cells/chambers. Neurons were grown until
DIV 17/18.
fNDs internalization in hippocampal neuron cultures.
We conducted fNDs internalization in neurons at DIV15/16. The maintaining medium was
set aside and replaced by 0.5 ml of Neurobasal phenol-free medium (Invitrogen) to which
we added 5 µl of ≈30 nm-sized fND stock solution, reaching a final concentration of
5 µg/ml. After 10 min incubation, the medium was replaced by the old maintaining
medium and neurons were placed 20 min in the incubator before starting the video
acquisition. The same internalization procedure was applied to QD (ref. Q21361MP from
ThermoFisher, USA) but with 1:105 dilution of the stock solution i.e. 0.1 nM final.
fND-containing cargos staining and colocalisation analysis.
20
For lysosomes labelling, live neurons were stained using LysoTracker Green DND-26
(ref. L7526, ThermoFisher) applied at 100 nM concentration at least 1 h prior to
acquisition. We only considered internalized fNDs, i.e. having either a directed motion or
a static colocalisation with a lysosome (Supplementary Fig. 2b). For endosomes immunostaining, neurons were fixed with 4% PFA for 20 min at room temperature. EEA1,
Rab5, Rab11, Rab7 and TGN38 were labelled overnight at 4°C using Cell Signaling (USA)
ref. C45B10, C8B1 and D4F5, and Santa Cruz (USA) Ref. sc-271608, sc-271624
respectively as primary antibodies. Secondary antibodies tagged with AlexaFluor 488 dye (Ref. 111-545-144 and 715-547-003, from Jackson ImmunoResearch Inc., USA) were then
applied for 1 h at room temperature. Fluorescence acquisitions were performed in two
colours with the same electron multiplied CCD array detector array as for videomicroscopy, with a DualView DV2 system placed in front of the detector
(Photometrics, USA). The DualView splits the image vertically in two parts: on one half of
the sensor surface green light emitted by LysoTracker and AlexaFluor 488 is detected, and
red light from fNDs is recorded on the other half (Supplementary Video 3). Fluorophores are excited with solid-states lasers: Sapphire 488 (Coherent, USA) at 488 nm wavelength
for LysoTracker and AlexaFluor 488, and SLIM 561 (Oxxius S.A., France) at 561 nm
wavelength for fNDs. The two laser beams are combined with a dual-band dichroic filter
(Ref. Di01-R488/561, from Semrock, USA). The DualView contains another green/red dichroic filter followed on each channel by a bandpass filter (Ref. D535/40M for green
emitters and ET-BandPass-700-75 for fND, both from Chroma Technology, USA). The
excitation laser powers were adjusted for each channel so that dynamic range was identical at given camera settings (EMgain=60, preamp gain=3.8, and digitalization speed
35 MHz). The slight shift between both channels was measured using 100 nm TetraSpeck
fluorescent beads (Ref. T7279, ThermoFisher). For colocalisation study of fixed cultured,
z-stack (7 planes with 0.25 µm step, total of 1.75 µm displacement) were recorded for
each field of view and maximum intensity projections were carried out. As for video
microscopy, we used ICY Spot Detector33 plugin to extract spot coordinates (in pixels),
spot maximum intensity (in counts) and spot size (surface in pixels#). Then, a custom
program was written with IGOR Pro to count colocalised spots between each half of the image within 1.5 pixels uncertainty (equivalent to one standard deviation) in x and y
directions. To filter out non-specific labelling, we only considered spots composed of 15
pixels (≈350 nm in diameter, compatible with the convolution of the microscope point spread function and 100 nm sized endosomes) and being at least three times brighter
than the dimmer spot (values empirically determined). Moreover, as fNDs are located
inside endosomes, we rejected colocalisation candidates having a fNDs spot size larger
than the labelled-endosome one. This led to colocalisations statistics in the z-stack
volume, but in this volume, only fNDs that were moving at the time of fixation would have
been considered for transport parameters measurement. From transport quantification
videos, we estimated to 9.0 ± 0.6 % this fraction of fNDs moving. However, all videos have
been recorded at a single focused plane that only displays part of all fNDs spots detected in the whole z-stack volume. Considering that fNDs are homogeneously distributed in the
sample volume, the single-plane detectable fraction corresponds to the ratio of the depth
of field (nλ/NA²=0.42 µm, for n=1.33) over the 1.75 µm z-stack thickness, which yields
24%. Therefore, assuming that one detects moving fNDs with the same yield in a single
focused plane than in the z-stack volume (but out-of-focused), we infer a fraction of
21
possibly moving fNDs in the analysed z-stack volume to be only 24%×9%=2.2%. We
applied this correction factor of 2.2% to z-stack raw colocalisation data to obtain the
proportion (≈10-40%) of each type of moving fND-cargoes displayed in Supplementary
Fig. 2c.
Microtubule destabilizing-drug experiment.
Nocodazole powder were purchased from Sigma-Aldrich (St Louis, MO, USA) and
resuspended in dimethylsulfoxide (DMSO). Nocodazole was added to the cultures after
fND protocol internalization and the DMSO volume added to each well was adjusted to be
0.5% of the total medium volume per well.
Preparation of oligomeric Aβ1-42 peptides.
1 mg of synthetic Aβ1-42 (Bachem AG, Switzerland) was dissolved in 500 µL trifluoroacetic acid (Sigma Aldrich) and sonicated during 10 min. After evaporation under nitrogen, the
preparation was processed according to Klein et al34. The pattern of oligomers was
checked by Western blot (see Fig. 3b), with the following gel composition: 10-20% Tris-
Tricine, 5 µL Aβ1-42 preparation at 100 µM concentration, and Anti-Human sAPP alpha
(clone 2B3) Mouse IgG MoAb antibody (IBL/Tecan AG, Switzerland).
Mark1 and Slc25a12 transgenic mice constructs. We used a 3,200 bp mouse CamKIIα
and a regulatory sequence of 711 bp intron and polyA SV40 in a pGL3-basic vector. The
pGL3-modified vector was realized in two steps: (i) the regulating sequence “intron+polyA SV40” (711 bp) was amplified by PCR from pCDNA1.1 vector with the
following primers: forward 5’-TATATCTAGACCCGGGTGGACAAACTACCTACAGAG (XbaI
site underlined) and reverse 5’-TATAGGATCCGCGGCCGCAGAAATATGGCGTTGATACC (BamHI site underlined); (ii) the specific promoter “mouse minimal promoter CamKIIα”
(3,200 bp) was amplified by PCR from mouse brain cDNA with the following primers:
forward 5’-TATAGCTAGCGAGATTCTTCCAGCTAGTTC-3’ (NheI site underlined) and
reverse 5’-TATAAAGCTTCCGTGCTCCTGAGTGCAAAC-3’ (HindIII site underlined). The
XbaI/BamHI and then the NheI/HindIII digestion products of the amplicon were inserted
into the two multiple cloning site of the pGL3 basic vector. E. coli DH5α cells were co-
transformed with these constructs. The coding regions of the mouse Mark1 gene
(2,386 bp) and mouse Slc25a12 gene (2,034 bp) were amplified by PCR (sequences of primers and probes are available on request. The two HindIII/SmaI digestion products of
the amplicons were inserted into the multiple cloning site of the pGL3 modified vector. E.
coli DH5α cells were co-transformed with this shuttle construct. Transgenes were injected in C57/Bl6 fertilized eggs for random integration into the mouse genome (CNRS
SEAT/TAAM UPS 44, Villejuif, France).
Mark1 and Slc25a12 DNA extraction & genotyping. Tissue from mouse hippocampus embryo was digested overnight at 55°C in the digesting buffer: Tris HCl pH=8 (50 mM),
EDTA pH=8 (100 mM), NaCl (60 mM), SDS (1% w/v), complemented with 15 µl of
proteinase K (Qiagen N.V., Netherlands). Inactivation was done at 99°C for 10 min and 3 µl
of 1% (w/v) RNaseA (Thermo Fisher Scientific, USA) was added prior to incubation at
37°C for 90 min. DNA was then extracted in 300 µl of Phenol/Chloroform, and after 5 min
centrifugation at 13200 rpm, aqueous phase was diluted elsewhere with 10% of sodium
22
acetate (3 M concentration). Then, 800 µl of cold ethanol were added before freezing the
solution at -80°C for 30 min, followed by 30 min of 13200 rpm centrifugation at 4°C.
Supernatant was removed and the pellet was rinsed at least once with ethanol 70%. The
pellet was finally dried at room temperature and resuspended in sterile water. PCR was then performed using primers for Mark1 and Slc25a12 as follow: UPCamKIIα
GACTAAGTTGTTCGCATCC; DW_Mark1: TGACGTAATGGAGTTTCTACAC; DW_Slc25a12:
TTTCAAATGTCACCTCTCCA. Each PCR amplification was prepared by mixing 0.5 U Hifi
taq DNA polymerase (Life Technologies, USA) 1 μL of 10x Buffer, 2 mM MgSO4, each deoxynucleoside triphosphate at a concentration of 0.2 mM, 1 µM of each of the
corresponding primer, and 50 ng of genomic DNA A final volume of 10 μL was achieved
using water. A negative control using all reagents except template DNA was also included. Reactions were carried out in a Mastercyler® pro S thermocycler (Eppendorf, Germany)
using the following cycling conditions: 2 min at 95°C followed by 28 cycles of 95°C for
15 sec, 58°C (for Mark1) or 56°C (for Slc25a12) for 30 s, and 72°C for 30 s. A final
extension step at 72°C for 7 min was performed after the cycles. After this step, samples were kept at 4°C until being electrophoresed in 1.5% agarose 1xTBE gels. For
visualization of electrophoresed PCR products, gels were stained with 1xSYBR® Safe DNA
Gel Stain (Life Technologies) and digital images were captured in a InGenius 3 (Syngene,
UK).
Mark1 RNA extraction and RT-qPCR.
Primary neuronal cells were collected in Trizol® (Life Technologies) for RNA extraction as described by the manufacturer. Reverse transcription (RT) was carried out at 50°C for
30 min in a 20 μl RT mixture containing 1 μg total RNA in Maxima First Strand Synthesis
kit (Thermo Fisher Scientific) as described by the manufacturer. The cDNAs generated
were amplified by real-time PCR, using probes (obtained from Merck Serono, Germany)
labeled at their 5’ ends with a fluorogenic reporter dye (FAM) and at their 3’ ends with a
quencher dye (TAMRA). Sequences of primers and probes are available on request. PCR
assays had a final reaction volume of 20 μl, and contained 2 U of Taq polymerase (Applied
Biosystems, USA), 10 μM primers and fluorogenic probe. PCR was carried out over 40 cycles of 95°C for 15 s, 60°C for 1 min and 50°C for 1 min. We used the DNA Engine
Opticon 2 sequence detection system (Bio-rad, USA), with the Opticon Monitor software
for data analysis. For each group, the cDNAs synthesized from total RNA were serially diluted to cover the 0.19 ng to 50 ng range for specific mRNAs and 0.98 pg to 250 pg range
for 18S rRNAs. These serial dilutions were used to construct standard curves for 18S and
for each gene of interest and to calculate the amounts of RNA. Each qPCR signal was
normalized with respect to 18S and expressed in arbitrary units.
Mark1 and Slc25a12 proteins extraction and Western Blot.
Hippocampus were dissected from P15 Mark1 and Slc25a12 transgenic mice and proteins
were extracted in 100 µl of lysis buffer: Tris HCl pH7.4 (20 mM), NaCl (100 mM), NP40
(1% v/v) and protease phosphatase inhibitor dose (Thermo Fisher Scientific). After milling and restoring for 30 min on ice, centrifugation was performed at 13200 rpm at 4°C
for 10 min. Supernatant was then removed and kept at -80°C until Western Blots were
performed. Protein electrophoresis migration was performed in 4-20% Mini-PROTEAN Tetra TGX gels (Bio-Rad, USA) in a TGS buffer (Tris, 5 mM; Glycine, 192 mM; 0.1% SDS, pH
23
8.3) with 40 µg of protein lysate after denaturation for 10 min at 95°C. Nitrocellulose
membranes (Trans-Blot Turbo, Bio-Rad) were used for protein transfer. Membrane was
then blocked in TBS 1X Tween 0.1%, 5% non-fat milk for 1 hour at RT under shaking.
Primary antibody Mark1 (ref. 3319S, Cell Signaling, USA) and Slc25a12 (ref. ab107436, Abcam, UK) were incubated overnight at 4°C either in 5% BSA and in 5% milk
respectively. Normalization was performed using Actin (ref A3854, Sigma Aldrich, USA)
staining. Secondary HRP-conjugated antibodies were used in corresponding species and
enzyme reaction was activated using Clarity Western ECL Substrate (GE Healthcare, USA), and imaged with ChemiDoc XRS (Bio-Rad). Slc25a12 and Mark1 quantification
normalized to Actin were performed using images acquired at the best dynamic range
(very few saturated pixels).
Statistical analysis.
Comparison between two data sets was performed with the statistical analysis tools
integrated in Igor Pro (WaveMetrics, USA). The pipeline analysis first applies a
Kolmogorov-Smirnoff rank test of the null hypothesis “data follow a Gaussian (normal)
distribution”. In most cases, normality hypothesis was rejected and thus a Mann-Whitney-
Wilcoxon comparison two-tailed test was performed. When the normality hypothesis
could not be rejected, two-sample two-tailed t-test was performed, after evaluating the
null hypothesis of equal variance. Data collection for nocodazole and transgenic mouse
experiments were performed blind to the conditions of the experiments. No statistical
methods were used to predetermine sample sizes, but our sample sizes are similar to
those generally employed in the field20. Stars are referred to the following significance
level: * for p<0.05; ** for p<0.01; *** for p<0.001.
References
32. Su, L.-J. et al. Creation of high density ensembles of nitrogen-vacancy centers in nitrogen-rich type Ib nanodiamonds. Nanotechnology 24, 315702 (2013).
33. Chenouard, N., Bloch, I. & Olivo-Marin, J. C. Multiple hypothesis tracking for cluttered biological image sequences. IEEE Trans. Pattern Anal. Mach. Intell. 35, 2736–2750 (2013).
34. Klein, W. L. Aβ toxicity in Alzheimer’s disease: globular oligomers (ADDLs) as new vaccine and drug targets. Neurochem. Int. 41, 345–352 (2002).

24
Supplementary Information
“Fluorescent nanodiamond tracking reveals intraneuronal transport
abnormalities induced by brain disease-related genetic risk factors”
Simon HAZIZA, Nitin MOHAN, Yann LOE-MIE, Aude-Marie LEPAGNOL-BESTEL,
Sophie MASSOU, Marie-Pierre ADAM, Xuan Loc LE, Julia VIARD, Christine PLANCON,
Rachel DAUDIN, Pascale KOEBEL, Emilie DORARD, Christiane ROSE, Feng-Jen HSIEH,
Chih-Che WU, Brigitte POTIER, Yann HERAULT, Carlo SALA, Aiden CORVIN, Bernadette
ALLINQUANT, Huan-Cheng CHANG, François TREUSSART and Michel SIMONNEAU
1. Supplementary Videos
Supplementary Video 1 | Video from which Fig.1d-e snapshots were extracted. The
white frame delimits the neuronal branch in which the endosomes containing fND #1 or fND #2 (same as in Fig. 1f kymographs) are moving. The fND locations are indicated
during short periods of time by their number. Real time of 20 frames/s.
Supplementary Video 2 | Video of a typical field of view of primary neuron culture after
fluorescent nanodiamonds internalization. a, Video at real speed (20 frames/s) showing
only the nanodiamonds motion (in red) with some persistence. b, Merge of the video
(without persistence) with the bright field DIC image of the same field of view, showing
the neuronal branch in which the nanodiamonds move in a directed manner. The yellow
star points a nanodiamond that has a fast erratic motion confined around a branch, and which may be bound to a membrane receptor moving back and forth along the branch.
Supplementary Video 3 | Video related to the study of the colocalization of fNDs and
lysosomes (labeled with LysoTracker green emitter) recorded by two-colors/dual-view live imaging. The three examples considered correspond to the different situations
analyzed in Suppl. Fig. 2. (i) Top: fNDs and lysosomes moving independently (moving fND
located outside lysosome); (ii) Middle: one fND inside a lysosome (pointed by the orange
arrow) and moving together as evidenced by the yellow color in the merged video on the
right; (iii) Bottom: fNDs inside an almost static lysosome (pointed by the pink arrow).
Scale bar: 5 µm; real time, 20 frames/s.
Supplementary Video 4 | Video of fND-containing endosomes having either retrograde
or anterograde motion. a, Merged of DIC and TIRF (in red) images, the latter being formed from the accumulation of each TIRF video frame. Most fND traces are connected to a
neuron soma located in the upper part of the field of view. b, TIRF video showing four
fND-containing endosomes having either a retrograde (fND going up) or anterograde (fND going down) motion in the neuronal branch of a neuron with its soma on further up and
not shown (real time, 20 frames/s). The yellow traces left correspond to the trajectories
as inferred from our data processing.
Supplementary Video 5 | Video of anterograde and retrograde motions of fND-containing endosomes inside the axon of hippocampal neurons cultured in microfluidic
chambers. Real time: 20 frames/s.

25
Supplementary Video 6 | Video showing one moving QD-containing cargoes (top) and
one moving fNDs-containing endosomes (bottom) in neuronal branches of cultured
hippocampal neurons. QDs display strong ON-OFF blinking, including the moving one,
indicating that they are internalized individually in their cargoes. In contrast fNDs display a very stable fluorescence owing to the perfect photostability of the embedded nitrogen-
vacancy color centers. The maximum intensity projections are presented at the end of the
movie, evidencing more clearly QDs dark periods. Real time: 20 frames/s.
2. Supplementary Tables
Supplementary Table 1 | Statistical analysis of intraneuronal transport
parameters. All trafficking parameters were extracted from n=460 trajectories acquired from n=11 C57Bl6 mouse embryos. The range and interquartile range correspond to the
0-100% and 25-75% percentiles, respectively.
Supplementary Table 2 | Comparison between fND-tracking assay and QD-tracking
assay, in terms of the nanolabel physical properties, and of the tracking-assay
performance index (localization precision, fraction of moving labels, number of trajectories per field of view and number of missed points in trajectory reconstruction).
For the localization precision, fNDs and Qdots were deposited on a coverslip and tracked
over 100 frames to measure the standard deviation of (X;Y) coordinates over time.
Because of QDots blinking, we considered the maximum of emission signal to measure the
SBR for each particle. Altogether, the table shows that QDs and fNDs have similar physical
properties but that the performance indices of fNDs are all more favorable than the ones
of QDs. All tracking data have been acquired at the same excitation wavelength (561 nm)
and the same laser power for both nanolabels.
26
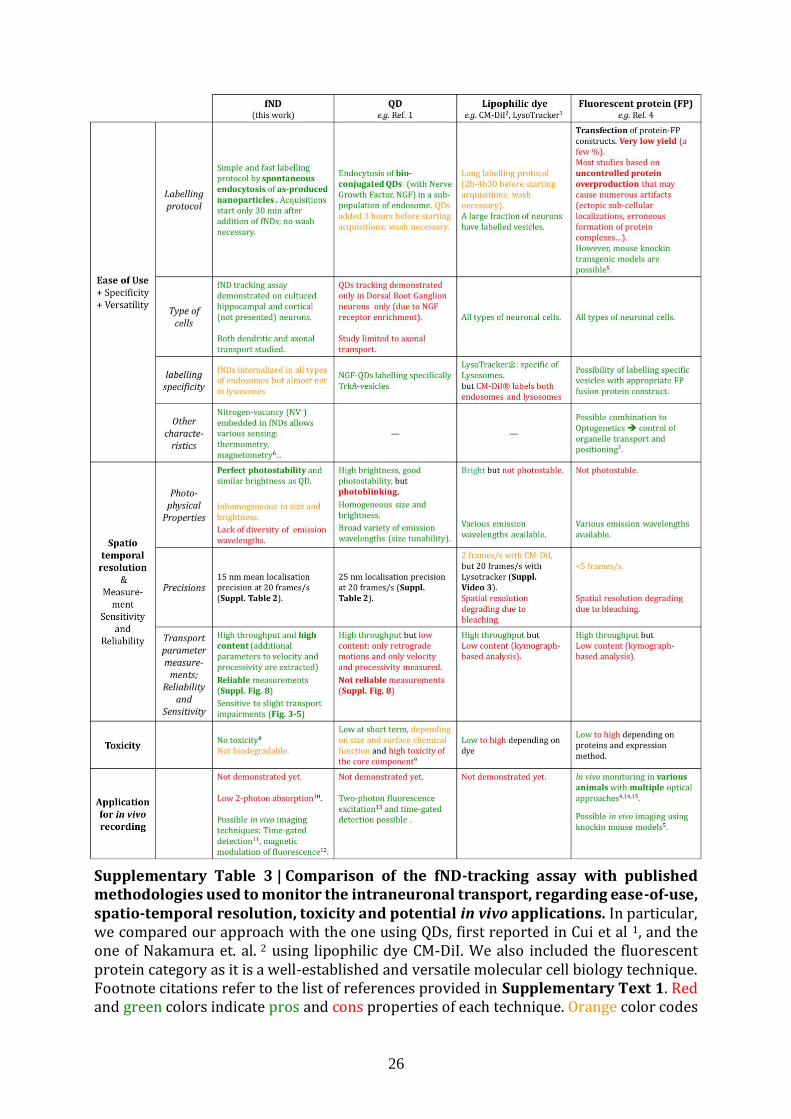
Supplementary Table 3 | Comparison of the fND-tracking assay with published methodologies used to monitor the intraneuronal transport, regarding ease-of-use, spatio-temporal resolution, toxicity and potential in vivo applications. In particular, we compared our approach with the one using QDs, first reported in Cui et al 1, and the one of Nakamura et. al. 2 using lipophilic dye CM-DiI. We also included the fluorescent protein category as it is a well-established and versatile molecular cell biology technique. Footnote citations refer to the list of references provided in Supplementary Text 1. Red and green colors indicate pros and cons properties of each technique. Orange color codes

27
for what we consider as a moderate drawback in the context of intraneuronal transport measurement. Supplementary Text 1 | List of references cited in Supplementary Table 3
1. Cui, B. et al. One at a time, live tracking of NGF axonal transport using quantum dots. Proc. Natl. Acad. Sci. U. S. A. 104, 13666–71 (2007).
2. Nakamura, H. et al. Quantitative analysis of intraneuronal transport in human iPS neurons. J. Pharmacol. Sci. 128, 170–178 (2015).
3. Ori-McKenney, K. M., Xu, J., Gross, S. P. & Vallee, R. B. A cytoplasmic dynein tail mutation impairs motor processivity. Nat. Cell Biol. 12, 1228–1234 (2010).
4. Yau, K. W. et al. Dendrites In Vitro and In Vivo Contain Microtubules of Opposite Polarity and Axon Formation Correlates with Uniform Plus-End-Out Microtubule Orientation. J. Neurosci. 36, 1071–1085 (2016).
5. Park, H. Y. et al. Visualization of Dynamics of Single Endogenous mRNA Labeled in Live Mouse. Science. 343, 422–424 (2014).
6. van Bergeijk, P., Adrian, M., Hoogenraad, C. C. & Kapitein, L. C. Optogenetic control of organelle transport and positioning. Nature 518, 111–114 (2015).
7. Schirhagl, R., Chang, K., Loretz, M. & Degen, C. L. Nitrogen-Vacancy Centers in Diamond: Nanoscale Sensors for Physics and Biology. Annu. Rev. Phys. Chem. 65, 83–105 (2014).
8. Huang, Y.-A. et al. The effect of fluorescent nanodiamonds on neuronal survival and morphogenesis. Sci. Rep. 4, 6919 (2014).
9. Oh, E. et al. Meta-analysis of cellular toxicity for cadmium-containing quantum dots. Nat. Nanotechnol. 11, 479–486 (2016).
10. Wee, T.-L. et al. Two-photon excited fluorescence of nitrogen-vacancy centers in proton-irradiated type Ib diamond. J. Phys. Chem. A 111, 9379–86 (2007).
11. Hui, Y. Y. et al. Wide-field imaging and flow cytometric analysis of cancer cells in blood by fluorescent nanodiamond labeling and time gating. Sci. Rep. 4, 5574 (2014).
12. Sarkar, S. K. et al. Wide-field in vivo background free imaging by selective magnetic modulation of nanodiamond fluorescence. Biomed. Opt. Express 5, 1190–202 (2014).
13. Biermann, B. et al. Imaging of molecular surface dynamics in brain slices using single-particle tracking. Nat. Commun. 5, 3024 (2014).
14. Zala, D. et al. Vesicular glycolysis provides on-board energy for fast axonal transport. Cell 152, 479–491 (2013).
15. Drerup, C. M. & Nechiporuk, A. V. In vivo analysis of axonal transport in zebrafish. Methods Cell Biol. 131, (2015).
28
3. Supplementary Figures
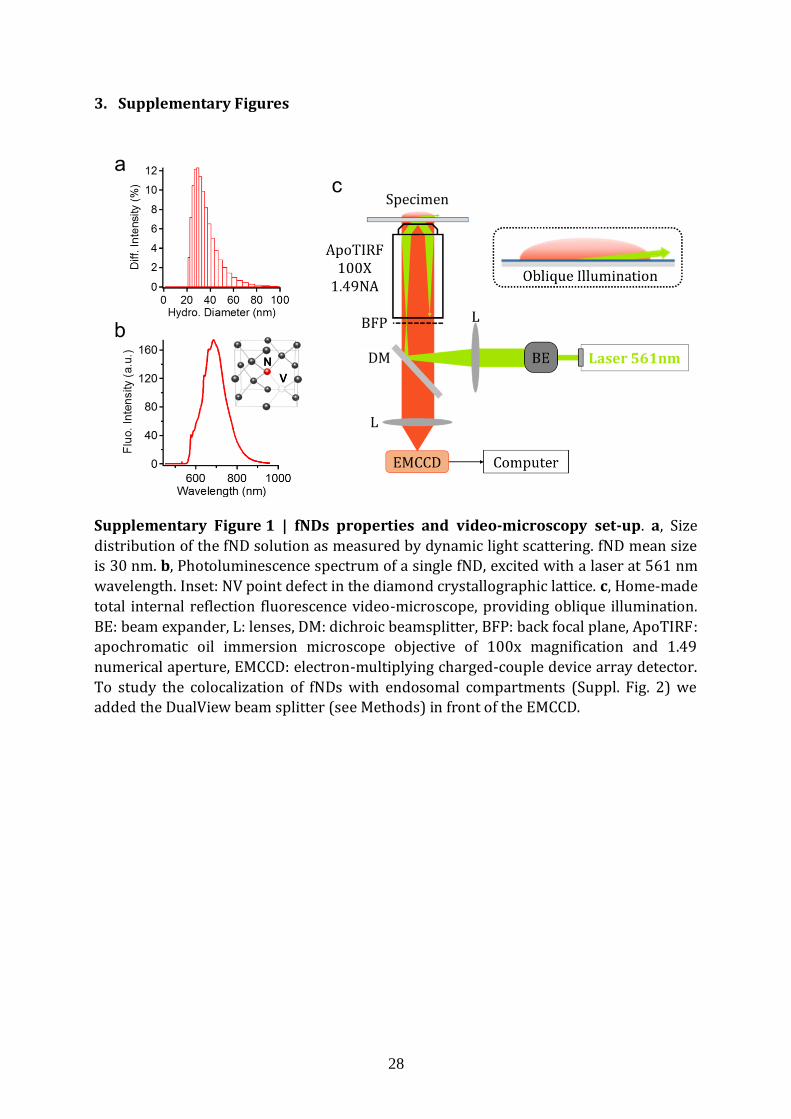
Supplementary Figure 1 | fNDs properties and video-microscopy set-up. a, Size
distribution of the fND solution as measured by dynamic light scattering. fND mean size is 30 nm. b, Photoluminescence spectrum of a single fND, excited with a laser at 561 nm
wavelength. Inset: NV point defect in the diamond crystallographic lattice. c, Home-made
total internal reflection fluorescence video-microscope, providing oblique illumination.
BE: beam expander, L: lenses, DM: dichroic beamsplitter, BFP: back focal plane, ApoTIRF: apochromatic oil immersion microscope objective of 100x magnification and 1.49
numerical aperture, EMCCD: electron-multiplying charged-couple device array detector.
To study the colocalization of fNDs with endosomal compartments (Suppl. Fig. 2) we added the DualView beam splitter (see Methods) in front of the EMCCD.
29
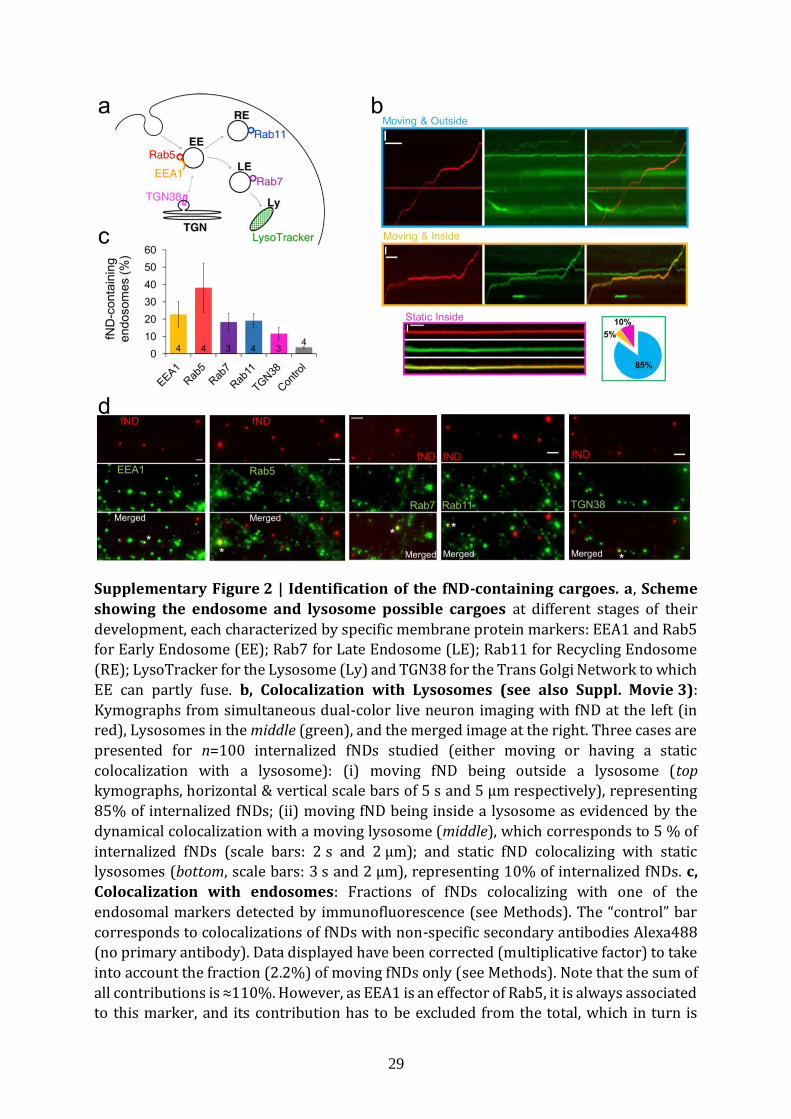
Supplementary Figure 2 | Identification of the fND-containing cargoes. a, Scheme
showing the endosome and lysosome possible cargoes at different stages of their
development, each characterized by specific membrane protein markers: EEA1 and Rab5 for Early Endosome (EE); Rab7 for Late Endosome (LE); Rab11 for Recycling Endosome
(RE); LysoTracker for the Lysosome (Ly) and TGN38 for the Trans Golgi Network to which
EE can partly fuse. b, Colocalization with Lysosomes (see also Suppl. Movie 3):
Kymographs from simultaneous dual-color live neuron imaging with fND at the left (in
red), Lysosomes in the middle (green), and the merged image at the right. Three cases are
presented for n=100 internalized fNDs studied (either moving or having a static
colocalization with a lysosome): (i) moving fND being outside a lysosome (top
kymographs, horizontal & vertical scale bars of 5 s and 5 µm respectively), representing
85% of internalized fNDs; (ii) moving fND being inside a lysosome as evidenced by the
dynamical colocalization with a moving lysosome (middle), which corresponds to 5 % of
internalized fNDs (scale bars: 2 s and 2 µm); and static fND colocalizing with static lysosomes (bottom, scale bars: 3 s and 2 µm), representing 10% of internalized fNDs. c,
Colocalization with endosomes: Fractions of fNDs colocalizing with one of the
endosomal markers detected by immunofluorescence (see Methods). The “control” bar
corresponds to colocalizations of fNDs with non-specific secondary antibodies Alexa488
(no primary antibody). Data displayed have been corrected (multiplicative factor) to take
into account the fraction (2.2%) of moving fNDs only (see Methods). Note that the sum of
all contributions is ≈110%. However, as EEA1 is an effector of Rab5, it is always associated to this marker, and its contribution has to be excluded from the total, which in turn is

30
≈90%. d, Examples of colocalizations (shown by white stars in merged images) between
fND and the different endosomal markers. Scale bars: 2 µm.
Supplementary Figure 3 | Detection of the “stop-and-go” motion phases. a-b, Coarse detection of “go” phases. a, The confinement ratio function Rconf is calculated for each
trajectory point, using a forward sliding window of four consecutive points, as the relative
distance drel between extreme positions i=1 and i=4 over the absolute distance Σdi
(i=1,…,4). Rconf is used to discriminate between static (“stop”) and directed (“go”) phases of motion, where Rconf ≈ 1 corresponds to an endosome in a directed motion “go” state,
and Rconf ≈ 0 corresponds to the “stop” state. b, Graphic representation of Rconf function
applied to trajectory #2 (Fig. 1), revealing the presence of these two phases, with a
histogram for Rconf distribution on the right. In the trajectory analysis algorithm, a “go” or
“stop” state is assigned to each trajectory point as a function of its Rconf value relative to a
cutoff fixed at Rconfcutoff=0.9 (horizontal dashed black line). Green and blue stars referred
to short GO and STOP phase respectively. c, Kymograph of trajectory#1 and #2 showing
green and blue arrow heads pointing out the same position as stars in (b). These events
are usually missing when kymograph is used to infer velocity, run length and pausing
time, leading to erroneous measurements. (d-f) Refined detection of “stop” phases. d, If
two consecutive “go” state positions (depicted in green) are separated by a distance too small to be determined with precision (below the resolution of this method), the first is
considered to be a “stop”. Scale bar: 100 nm. e, If the angle between two consecutive
segments of motion is larger than 70 degrees, the point separating the two segments is
considered to correspond to a “stop”. Scale bar: 50 nm. f, If a point within a “stop” region
but is identified as a “go”, it is considered to be a positive false and is reassigned as a “stop”.
Scale bar: 100 nm.
31
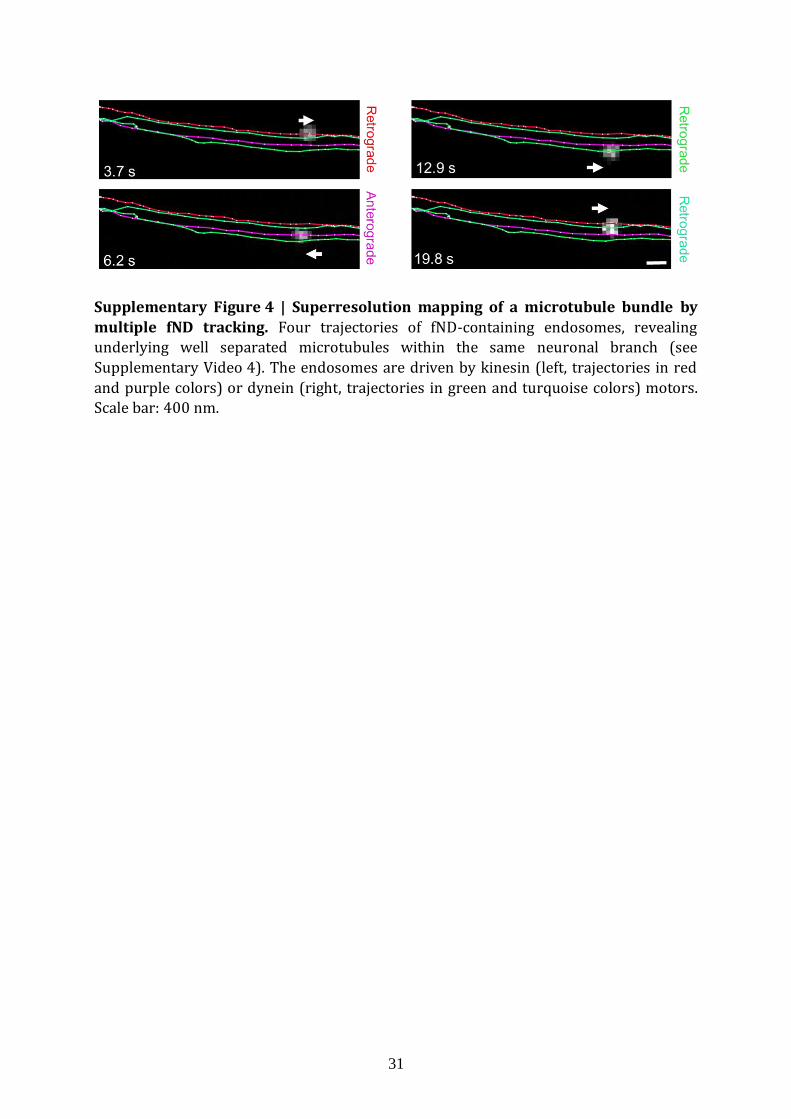
Supplementary Figure 4 | Superresolution mapping of a microtubule bundle by
multiple fND tracking. Four trajectories of fND-containing endosomes, revealing underlying well separated microtubules within the same neuronal branch (see
Supplementary Video 4). The endosomes are driven by kinesin (left, trajectories in red
and purple colors) or dynein (right, trajectories in green and turquoise colors) motors. Scale bar: 400 nm.
32
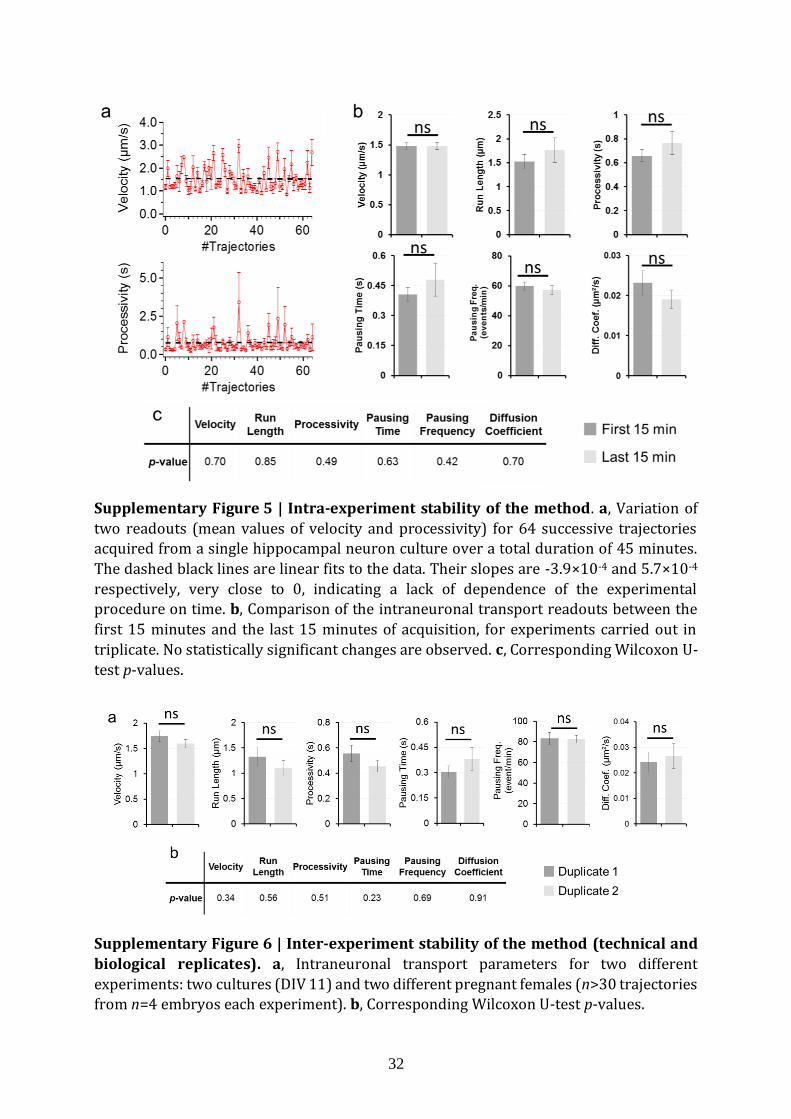
Supplementary Figure 5 | Intra-experiment stability of the method. a, Variation of
two readouts (mean values of velocity and processivity) for 64 successive trajectories acquired from a single hippocampal neuron culture over a total duration of 45 minutes.
The dashed black lines are linear fits to the data. Their slopes are -3.9×10⁻⁴ and 5.7×10⁻⁴
respectively, very close to 0, indicating a lack of dependence of the experimental procedure on time. b, Comparison of the intraneuronal transport readouts between the
first 15 minutes and the last 15 minutes of acquisition, for experiments carried out in
triplicate. No statistically significant changes are observed. c, Corresponding Wilcoxon U-
test p-values.
Supplementary Figure 6 | Inter-experiment stability of the method (technical and
biological replicates). a, Intraneuronal transport parameters for two different
experiments: two cultures (DIV 11) and two different pregnant females (n>30 trajectories from n=4 embryos each experiment). b, Corresponding Wilcoxon U-test p-values.
33
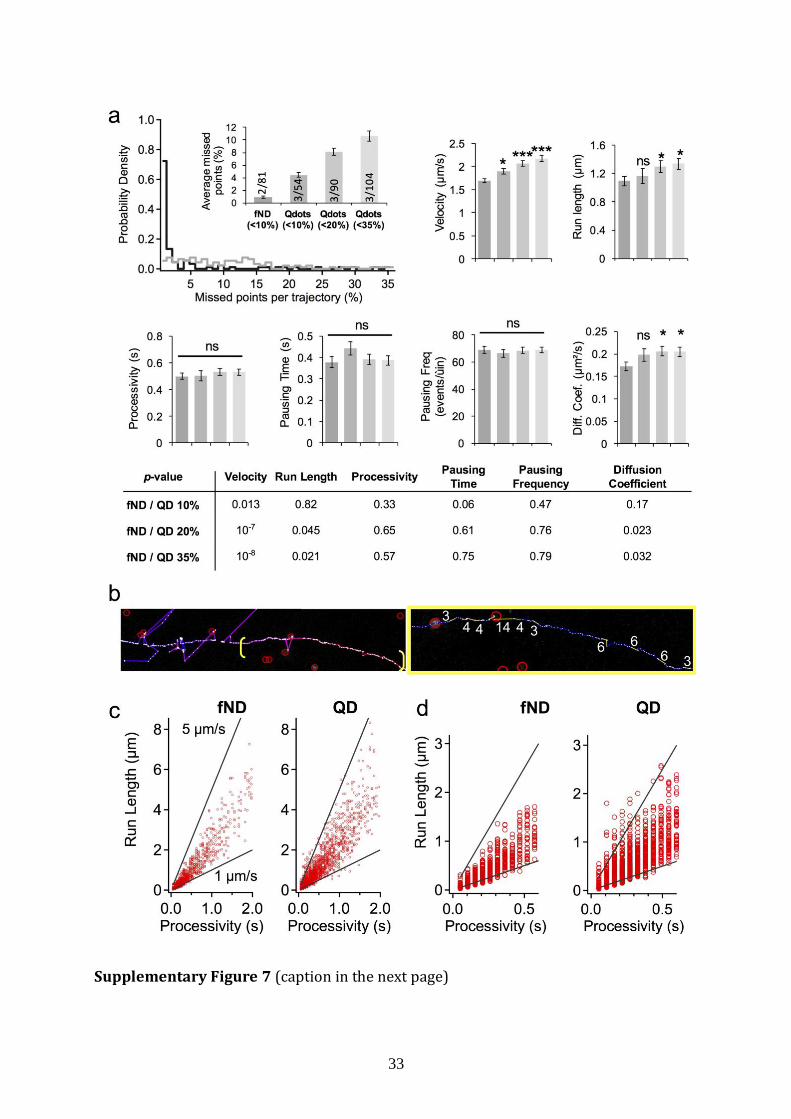
Supplementary Figure 7 (caption in the next page)

34
Supplementary Figure 7 | Failure of QDs to provide reliable transport parameters.
a, Distributions of missed points (absence of nanoparticle signal either due to defocus and
due to blinking in the case of QDs) per trajectory in tracking analysis of QDs (grey) and
fNDs (black) labeled cargoes. For QDs, the missed-point fraction is mostly homogeneously distributed in a broad range (0-35%) while it is peaked around zero for fNDs. The
histogram in inset shows the average fraction of missed detections for a given dataset. The
trajectories from the three QD datasets were selected based on a maximum fraction of
missed points/trajectory accepted (low-pass filtering with 10, 20 and 35% cutoffs). Vertical figures in the bars correspond to: # of experiments/# of filtered trajectories. To
get a larger number of filtered trajectories from QDs analysis than from fNDs at 10%
cutoff, the QDs missed-points/trajectory cutoff has to be set at 20%. Note that for similar size of datasets, 3 experiments need to be conducted for QDs against only 2 for fNDs, due
to a lower internalization efficiency of QDs, as summarized in Suppl. Table 2. Moreover,
the fNDs 10% cutoff corresponds to an average of only ≈1% missed points/trajectory
(cargoes going out of focus), while the 20% cutoff for QDs is associated to ≈8% missed points/trajectory due to blinking. When performing the transport parameter calculation
from the filtered trajectories, we observed that space-dependent parameters (velocity,
run length and diffusion coefficient) increased with increasing missed-point fraction
cutoff, and differed from values inferred from fND-tracking (considered as ground truths). This can be interpreted as the direct consequence of ICY Spot Tracker algorithm which
infers missed points (QD dark period) and creates aberration. Bottom: p-values from
Wilcoxon U-test. fND/QDs mm% corresponds to the comparison of fND to QD data for different missed-point fractions (mm=10-35%).
b, Left: Portion of a QD trajectory (purple lines) as determined with ICY Spot Tracker. The
red circles indicate QDs spots as detected by ICY Spot Detector plugin in a single frame. In
the left part of the trajectory, where the QD has long dark periods, the tracking algorithm
is not able to connect spots from the moving QD together and therefore create aberrant
segments. In the opposite, the right portion in yellow brackets shows full connectivity.
Right: despite the continuity, a significant fraction of the trajectories is made of inferred
segments (in yellow; white numbers are in pixel unit). These aberrant segments are only one time-frame long (50 ms) and can be as large as 14 pixels (i.e. ≈1.1 µm), which
correspond to an aberrant velocity of 22 µm/s.
c, Comparison of scattered plot of run length vs processivity for fNDs (left) and QDs (right). Black lines indicate extremal cargoes velocities (1 µm/s and 5 µm/s lower and
upper bounds respectively) as reported in the literature (e.g. D. Zala et al., Cell 152, 479
(2013)) and consistent with fNDs measurements. The QD scattered plot shows a
significant fraction of velocities larger than the upper bound, especially at short
processivities (as displayed in the zoom of panel d). Therefore, the more we increase the
fraction of missed point per trajectory (from 10 % to 35 %), the more we increase the
proportion of such aberrant spatial displacements. This will thus affect upward the values
of the run length, the velocity and the diffusion coefficient, as observed in a. Altogether, these results demonstrate that QDs cannot be used to measure the intraneuronal
transport parameters as it will lead to biologically irrelevant values.

35
Supplementary Figure 8 | Comparison of the inter-experiment stability of QD and
fND tracking assays (technical replicates). a, Average missed points/trajectory and
intraneuronal transport parameters as inferred from fNDs tracking for two different
experiments (fND#1 and #2) corresponding to two different coverslips from the same neuron culture (at DIV 15), contrary to Suppl. Fig. 5 (two different cultures). The number
n of trajectories taken into account is indicated in bracket. b, Average missed
points/trajectory and intraneuronal transport parameters as inferred from QDs tracking
for three different experiments (QD#1, #2 and #3), corresponding to three different
coverslips from the same neuron culture (at DIV 15). We observe that most transport
parameters differ from one coverslip to the other, indicating that we cannot apply our
nanoparticle-tracking assay with QDs for intraneuronal transport measurements. c, Corresponding Mann-Whitney-Wilcoxon test p-values.
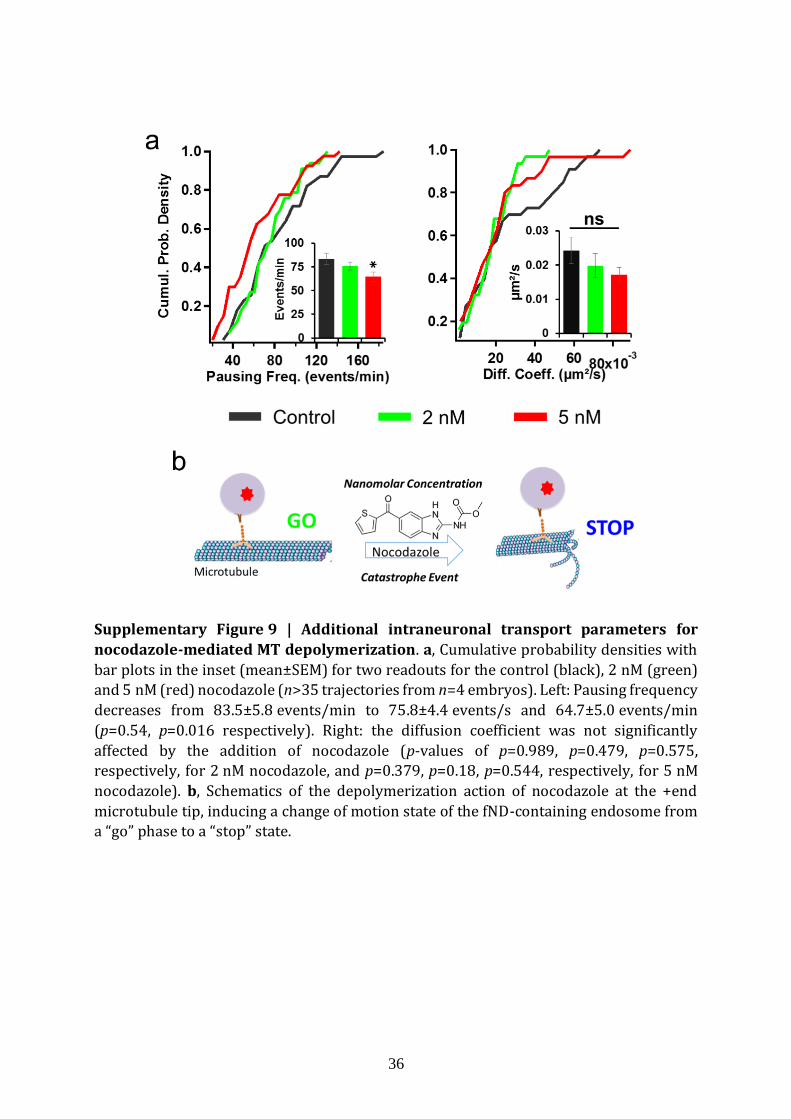
36
Supplementary Figure 9 | Additional intraneuronal transport parameters for
nocodazole-mediated MT depolymerization. a, Cumulative probability densities with
bar plots in the inset (mean±SEM) for two readouts for the control (black), 2 nM (green)
and 5 nM (red) nocodazole (n>35 trajectories from n=4 embryos). Left: Pausing frequency
decreases from 83.5±5.8 events/min to 75.8±4.4 events/s and 64.7±5.0 events/min
(p=0.54, p=0.016 respectively). Right: the diffusion coefficient was not significantly
affected by the addition of nocodazole (p-values of p=0.989, p=0.479, p=0.575, respectively, for 2 nM nocodazole, and p=0.379, p=0.18, p=0.544, respectively, for 5 nM
nocodazole). b, Schematics of the depolymerization action of nocodazole at the +end
microtubule tip, inducing a change of motion state of the fND-containing endosome from a “go” phase to a “stop” state.
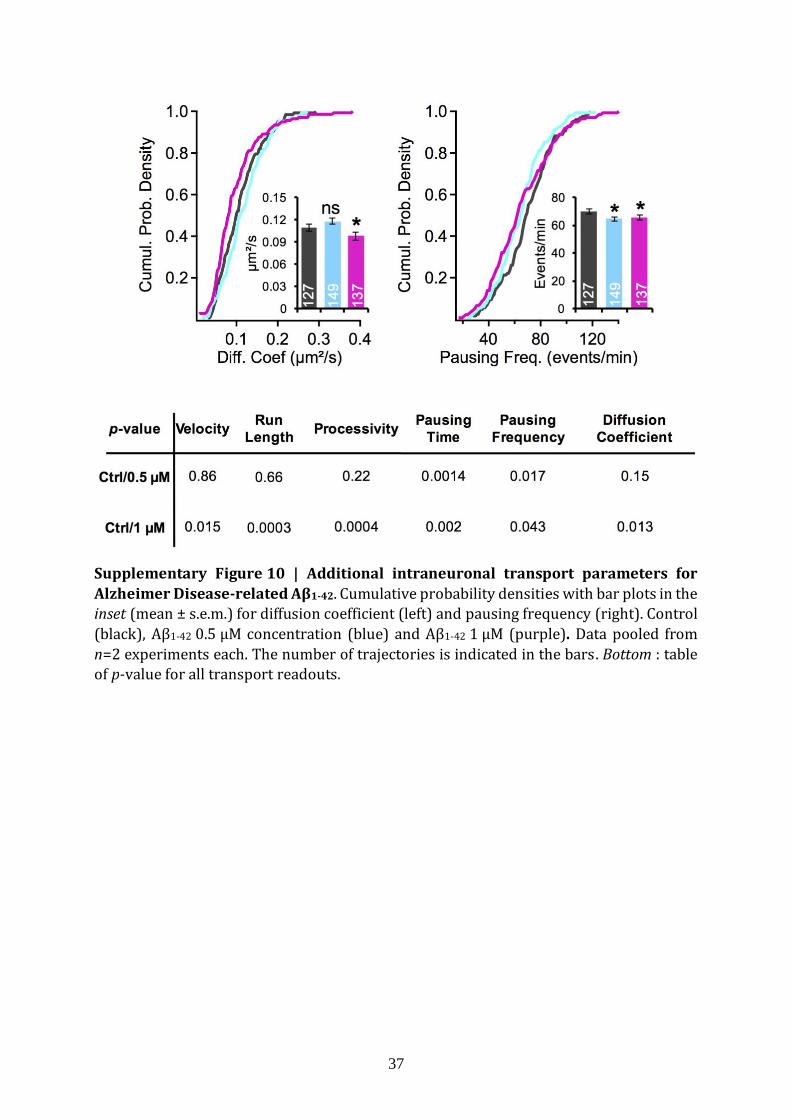
37
Supplementary Figure 10 | Additional intraneuronal transport parameters for
Alzheimer Disease-related Aβ1-42. Cumulative probability densities with bar plots in the
inset (mean ± s.e.m.) for diffusion coefficient (left) and pausing frequency (right). Control
(black), Aβ1-42 0.5 µM concentration (blue) and Aβ1-42 1 µM (purple). Data pooled from
n=2 experiments each. The number of trajectories is indicated in the bars. Bottom : table of p-value for all transport readouts.
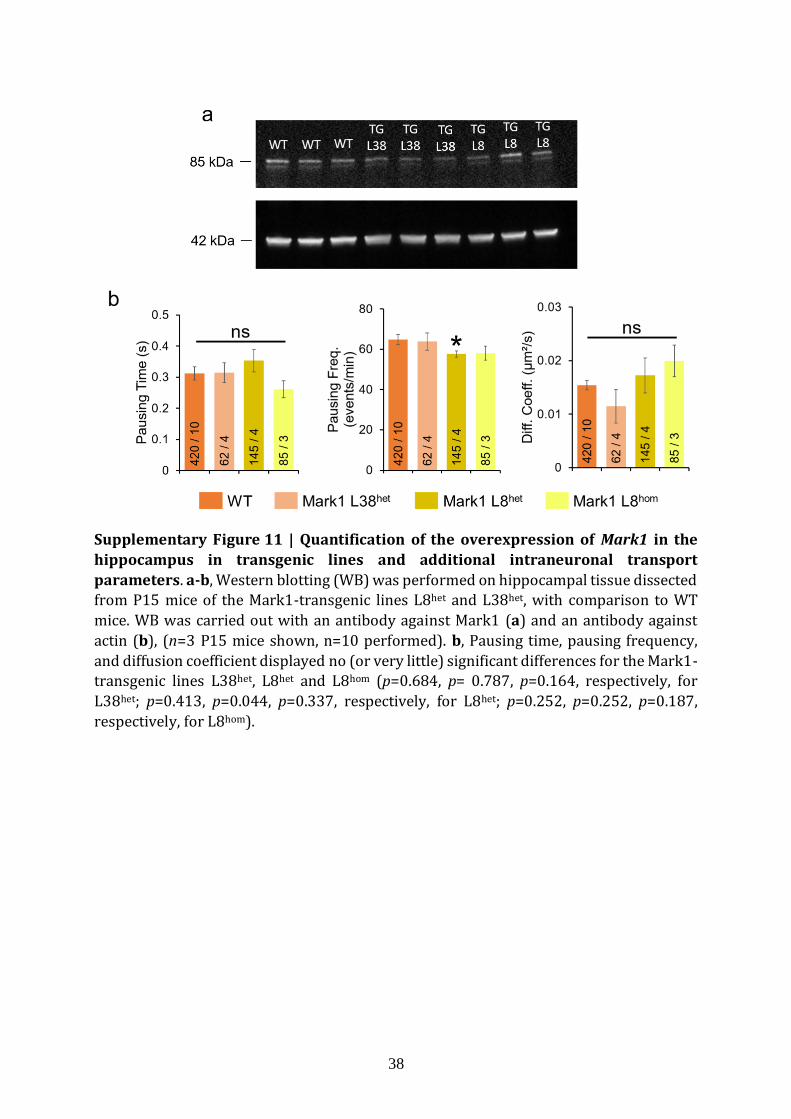
38
Supplementary Figure 11 | Quantification of the overexpression of Mark1 in the
hippocampus in transgenic lines and additional intraneuronal transport
parameters. a-b, Western blotting (WB) was performed on hippocampal tissue dissected from P15 mice of the Mark1-transgenic lines L8het and L38het, with comparison to WT
mice. WB was carried out with an antibody against Mark1 (a) and an antibody against
actin (b), (n=3 P15 mice shown, n=10 performed). b, Pausing time, pausing frequency,
and diffusion coefficient displayed no (or very little) significant differences for the Mark1-
transgenic lines L38het, L8het and L8hom (p=0.684, p= 0.787, p=0.164, respectively, for
L38het; p=0.413, p=0.044, p=0.337, respectively, for L8het; p=0.252, p=0.252, p=0.187,
respectively, for L8hom).
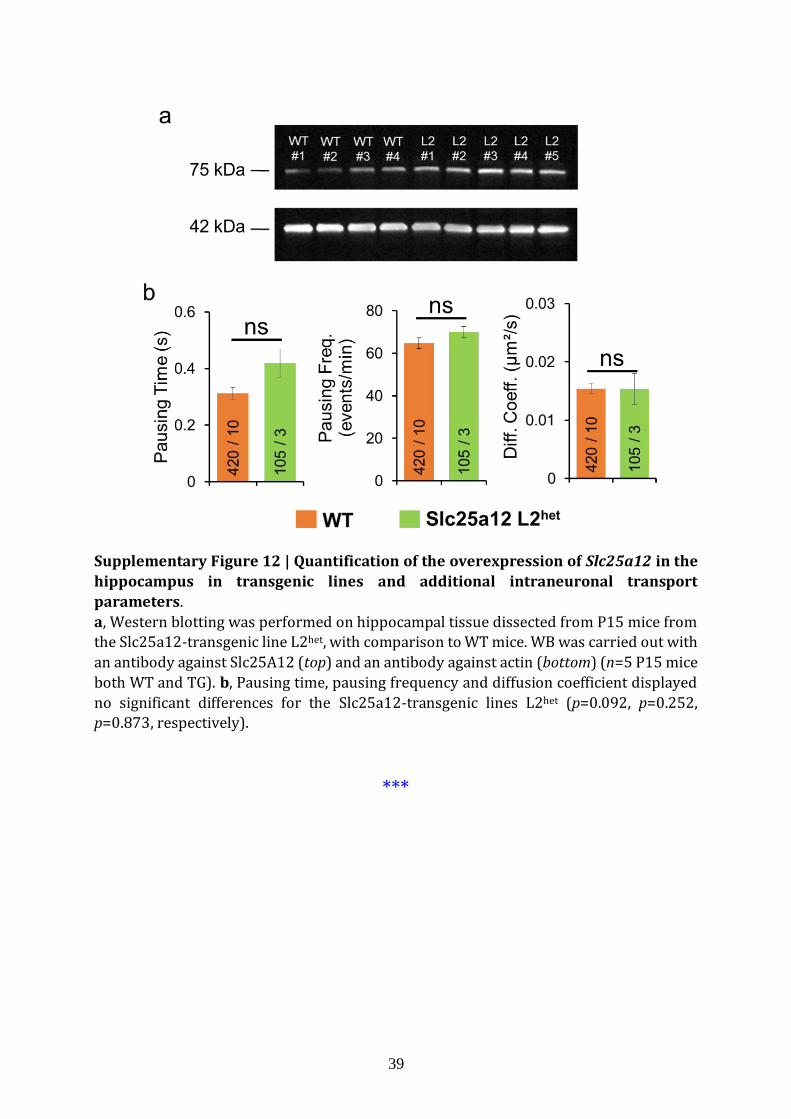
39
Supplementary Figure 12 | Quantification of the overexpression of Slc25a12 in the
hippocampus in transgenic lines and additional intraneuronal transport
parameters.
a, Western blotting was performed on hippocampal tissue dissected from P15 mice from the Slc25a12-transgenic line L2het, with comparison to WT mice. WB was carried out with
an antibody against Slc25A12 (top) and an antibody against actin (bottom) (n=5 P15 mice
both WT and TG). b, Pausing time, pausing frequency and diffusion coefficient displayed
no significant differences for the Slc25a12-transgenic lines L2het (p=0.092, p=0.252, p=0.873, respectively).
***