
FLUID STRUCTURE SIMULATION OF A LEFT VENTRICLE WITH...
78
FLUID STRUCTURE SIMULATION OF A LEFT VENTRICLE WITH DILATED CARDIOMYOPATHY CHAN BEE TING DISSERTATION SUBMITTED IN FULFILMENT OF THE REQUIREMENTS FOR THE DEGREE OF MASTER OF ENGINEERING SCIENCE DEPARTMENT OF BIOMEDICAL ENGINEERING FACULTY OF ENGINEERING UNIVERSITY OF MALAYA KUALA LUMPUR 2013
Transcript of FLUID STRUCTURE SIMULATION OF A LEFT VENTRICLE WITH...

FLUID STRUCTURE SIMULATION OF A LEFT VENTRICLE
WITH DILATED CARDIOMYOPATHY
CHAN BEE TING
DISSERTATION SUBMITTED IN FULFILMENT OF THE
REQUIREMENTS FOR THE DEGREE OF
MASTER OF ENGINEERING SCIENCE
DEPARTMENT OF BIOMEDICAL ENGINEERING
FACULTY OF ENGINEERING
UNIVERSITY OF MALAYA
KUALA LUMPUR
2013

ii
ABSTRACT
Dilated cardiomyopathy (DCM) is the most common myocardial disease which not only
leads to systolic dysfunction but also diastolic deficiency. In the present work, the effect
of DCM on the intraventricular fluid dynamics and myocardial wall mechanics were
investigated. In addition, the individual effect of parameters related to DCM on several
important fluid dynamics and myocardial wall mechanics variables during ventricular
filling were also studied. Intraventricular fluid dynamics and myocardial wall
deformation are significantly impaired under DCM conditions, which were
demonstrated by low vortex intensity, flow propagation velocity (Vp), intraventricular
pressure difference (IVPD), and strain rates, but high end diastolic pressure (EDP) and
wall stress. The sensitivity analysis results showed that Vp substantially decreases with
an increase in wall stiffness, and is relatively independent of preload at low peak E-
wave velocity. Early IVPD is mainly affected by the rate of change of the early filling
velocity and end systolic volume (ESV) which changes the ventriculo:annular
proportion. Regional strain rate, on the other hand, is significantly correlated with
regional stiffness, and therefore forms a useful indicator for myocardial regional
ischemia. This study enhanced understanding of the mechanisms leading to clinically
observable changes in patients with DCM.

iii
ABSTRAK
“Dilated cardiomyopathy” (DCM) adalah merupakan penyakit miokardium yang paling
umum di mana bukan sahaja membawa kepada ketidakcekapan sistolik tetapi juga
diastolik. Dalam kajian ini, kesan DCM pada dinamik bendalir intraventrikel dan
mekanik dinding miokardium telah diselidiki. Di samping itu, kesan parameter yang
berkaitan dengan DCM kepada individu berkaitan dengan beberapa dinamik bendalir
yang penting dan pembolehubah miokardium mekanik semasa pengisian ventrikel turut
dikaji. Dinamik bendalir dalam ventrikel dan perubahbentukan miokardium terjejas
dengan ketara di bawah keadaan DCM, yang telah ditunjukkan oleh keamatan vorteks
yang rendah, halaju penyebaran aliran (Vp), perbezaan tekanan dan kadar terikan
intraventrikel (IVPD), tetapi menunjukkan tekanan akhir diastolic (EDP) dan tegasan
dinding yang tinggi. Keputusan sensitiviti analisis menunjukkan bahawa halaju
penyebaran aliran berkurangan secara ketara dengan peningkatan kekukuhan dinding,
dan agak tidak bergantung kepada prabeban pada halaju puncak “E-wave” yang rendah.
IVPD awal terutamanya dipengaruhi oleh kadar perubahan halaju pengisian awal dan
kelantangan sistolik akhir (ESV) yang mengubah perkadaran “ventriculo:annular”.
Sebaliknya, kadar terikan kawasan mempunyai hubungan yang signifikan dengan
kekukuhan kawasan, dan oleh itu membentuk petunjuk yang berguna untuk iskemia
kawasan miokardium. Kajian ini meningkatkan pemahaman tentang mekanisme yang
membawa kepada perubahan klinikal yang dapat dilihat pada pesakit DCM.

iv
ACKNOWLEDGEMENT
I would like to express gratefulness to my thesis supervisor, Dr. Lim Einly for
her abundance knowledge and passion in guiding me throughout this research. Without
her help and persistent motivation, this research will surely be a difficult task for me to
carry out. Furthermore, I would like to thank my other supervisor, Dr. Noor Azuan Abu
Osman, for his supervision throughout this project despite his full schedule.
Special thanks to Dr. Socrates Dokos from Graduate School of Biomedical
Engineering, University of New South Wales (UNSW) for his patience in consulting
computational modelling and simulation implementation which is an important guide to
succeed this project. Also, I am in debt to Prof. Nigel Lovell and Amr Al Abed from
UNSW for kindly contributing professional opinions and comments to the current
works.
My appreciation goes to Dr. Chee Kok Han from the Medicine Department,
University of Malaya. Despite his busy schedule, he is willing to spend time providing
me with valuable cardiac disease information.
Last but not least, I would like to show my appreciation to my beloved parents,
colleagues, and friends who are always giving me endless encouragement and support.

v
TABLE OF CONTENTS
ABSTRACT ...................................................................................................................... ii
ABSTRAK ....................................................................................................................... iii
ACKNOWLEDGEMENT ............................................................................................... iv
TABLE OF CONTENTS .................................................................................................. v
LIST OF EQUATIONS ................................................................................................. viii
LIST OF FIGURES ......................................................................................................... ix
LIST OF TABLES ........................................................................................................... xi
LIST OF ABBREVIATIONS ......................................................................................... xii
LIST OF SYMBOLS ..................................................................................................... xiv
Chapter 1. INTRODUCTION ...................................................................................... 1
1.0. Research motivation ........................................................................................... 1
1.1. Research objectives ............................................................................................ 3
1.2. Research Question .............................................................................................. 4
1.3. Thesis organization ............................................................................................. 4
Chapter 2. LITERATURE REVIEW............................................................................ 5
2.0. Introduction ........................................................................................................ 5
2.1. Clinical imaging studies ..................................................................................... 6
2.2. CFD simulation studies ...................................................................................... 8
2.2.1. Geometry-prescribed approach ................................................................... 9
2.2.2. FSI approach ............................................................................................. 10
2.3. Conclusion ........................................................................................................ 11
Chapter 3. METHODOLOGY .................................................................................... 12
3.0. Introduction ...................................................................................................... 12

vi
3.1. Investigation on transmitral spatial velocity profile ......................................... 12
3.2. Investigation on CFD simulation approach ...................................................... 13
3.2.1. Geometry-prescribed method .................................................................... 14
3.2.2. FSI method ................................................................................................ 14
3.3. Simulation of DCM conditions ........................................................................ 15
3.3.1. Disease conditions ..................................................................................... 16
3.3.2. Geometry of LV ........................................................................................ 16
3.3.3. Material properties of LV wall .................................................................. 17
3.3.4. Transmitral filling pattern ......................................................................... 20
3.4. Sensitivity analysis ........................................................................................... 22
3.4.1. Vortex identification ................................................................................. 23
3.5. Mesh dependency test ...................................................................................... 23
3.6. Numerical result validation .............................................................................. 24
Chapter 4. RESULTS ................................................................................................. 25
4.0. Introduction ...................................................................................................... 25
4.1. Uniform vs. parabolic velocity profile ............................................................. 25
4.2. Geometry-prescribed vs. FSI method ............................................................... 29
4.3. Normal, IDCM, and ICM conditions ............................................................... 32
4.3.1. Intraventricular flow distribution .............................................................. 32
4.3.2. Intraventricular pressure, wall stress, and strain distribution .................... 34
4.3.3. PV relationship .......................................................................................... 37
4.4. Sensitivity analysis ........................................................................................... 38
Chapter 5. DISCUSSION ........................................................................................... 41
5.0. Introduction ...................................................................................................... 41
5.1. Comparison between uniform and parabolic velocity profile .......................... 41
5.2. Comparison between geometry-prescribed and FSI method............................ 43

vii
5.3. Simulation of normal, IDCM, and ICM conditions ......................................... 45
5.4. Sensitivity analysis ........................................................................................... 47
Chapter 6. CONCLUSION ......................................................................................... 49
6.0. Conclusion ........................................................................................................ 49
6.1. Limitation and recommendation for future works ........................................... 50
REFERENCES ................................................................................................................ 52
APPENDIX ..................................................................................................................... 61
PUBLICATONS ............................................................................................................. 63

viii
LIST OF EQUATIONS
Equation 3.1: = 0.v ...................................................................................................... 13
Equation 3.2: 2( . ) pt
vv v v ..................................................................... 13
Equation 3.3: 2 2
3 3
3 ( ) 2
10 4
dR Q t H R
dt H R HR
........................................................................... 14
Equation 3.4: 3 2 2
2 3 3 3
3 ( ) 2
2 10 4
dH Q t H H R
dt H R R H R HR
......................................................... 14
Equation 3.5: f su u ................................................................................................ 15
Equation 3.6: f s n n ........................................................................................ 15
Equation 3.7: passive LinYin HumphreyW W mW .................................................................. 18
Equation 3.8: 1( 1)Q
LinYinW c e ................................................................................... 18
Equation 3.9: 1 1 1
2 3 22 2 21 4 2 4 3 1 4 1 4 5 1( 1) ( 1) ( 3) ( 3)( 1) ( 3)Humphrey h h h h hW c I c I c I c I I c I ..... 18
Equation 3.10: 2( )S
.............................................................................. 19
Equation 3.11: ΓI=A
................................................................................... 23

ix
LIST OF FIGURES
Figure 3.1: Spatial profile of inlet velocity at the mitral valve during peak of E wave,
using different settings: uniform flow (left) and parabolic flow (right). ...... 13
Figure 3.2: Stress-strain relationship. ............................................................................. 19
Figure 3.3: Relationship between nominal stress and strain for the normal, IDCM and
ICM (basal and apical region) models. Semi-log plot (y-axis) is on the right.
...................................................................................................................... 20
Figure 3.4: Temporal waveforms of the inlet velocity for normal, impaired relaxation,
pseudonormal, and restrictive filling patterns. ............................................. 21
Figure 4.1: Vortex formation patterns obtained using uniform velocity profile as inlet
boundary condition, instantaneous vorticity at t = 0.15 s (left), 0.25 s
(middle) and 0.35 s (right), vorticity levels (1/s) from 5 to 100, step 10. .... 26
Figure 4.2: Vortex formation patterns obtained using parabolic velocity profile as inlet
boundary condition, instantaneous vorticity at t = 0.15 s (left), 0.25 s
(middle) and 0.35 s (right), vorticity levels (1/s) from 5 to 100, step 10. .... 26
Figure 4.3: Vortex strength in a DCM ventricle with different spatial velocity profile. 29
Figure 4.4: Instantaneous vorticity in the normal, moderately dilated and severely
dilated LV at t = 0.36 s in the geometry-prescribed (top) and FSI
implementation (bottom), vorticity levels (1/s) from 5 to 100, step 10. ...... 30
Figure 4.5: Vorticity magnitude in normal (solid line), moderately dilated (dashed line)
and severely dilated LV (dotted line). .......................................................... 31
Figure 4.6: Total displacement (right) of normal (solid line), moderately dilated (dashed
line) and severely dilated LV (dotted line) obtained from FSI
implementation. ............................................................................................ 32

x
Figure 4.7: Instantaneous vorticity (contour plot) in normal LV, IDCM (impaired
relaxation) and ICM (impaired relaxation). ................................................. 33
Figure 4.8: Temporal waveforms of the IVPD for normal, IDCM, and ICM with
impaired relaxation, pseudonormal and restrictive filling patterns. ............. 35
Figure 4.9: vMs (top) and strain (bottom) distribution for (a) normal, (b) IDCM
(impaired relaxation) and (c) ICM (impaired relaxation) during end of the
filling phase. ................................................................................................. 36
Figure 4.10: PV relationship for normal, IDCM and ICM conditions throughout the
filling phase. ............................................................................................... 38
Figure 4.11: Effects of DCM parameters on fluid dynamic measurements. ................... 39
Figure 4.12: Effect of DCM parameters on wall mechanics measurement. ................... 39

xi
LIST OF TABLES
Table 3.1: List of parameter values for normal, IDCM and ICM conditions. ................ 22
Table 4.1: Quantitative comparison of various intraventricular fluid dynamics and
myocardial wall mechanics measurements for normal, IDCM and ICM with
impaired relaxation, pseudonormal and restrictive filling patterns. ............... 37

xii
LIST OF ABBREVIATIONS
ALE Arbitrary Lagrangian-Eulerian
CFD Computational Fluid Dynamics
DT Deceleration Time
DCM Dilated Cardiomyopathy
EDP End Diastolic Pressure
EF Ejection Fraction
EDV End Diastolic Volume
ESV End Systolic Volume
FSI Fluid Structural Interaction
Vp Flow Propagation Velocity
ICM Ischemic Dilated Cardiomyopathy
IDCM Idiopathic Dilated Cardiomyopathy
IVPD Intraventricular Pressure Difference
IVPDE Early Intraventricular Pressure Difference
IVPDL Late Intraventricular Pressure Difference
LV Left Ventricle

xiii
LVAD Left Ventricular Assist Device
PV Pressure-Volume
SI Sphericity Index
vMs Von Mises Stress

xiv
LIST OF SYMBOLS
Ωs Antisymmetric velocity gradient tensor
Average vorticity
Circumferential wall stress
µ First material constant of Ogden constitutive equation
ρ Fluid density
uf Fluid displacement vector
p Fluid pressure
σf Fluid stress tensor
v Fluid velocity vector
η Fluid viscosity
Meridional wall stress
S Nominal stress
α Second material constant of Ogden constitutive equation
us Solid displacement vector
σs Solid stress tensor
W Strain energy function

xv
Stretch
Ωs Symmetric velocity gradient tensor
n Unit normal vector
ΓI Vortex intensity
Vorticity
1
Chapter 1. INTRODUCTION
This chapter provides a preface of the present work. The introduction is initiated by
research motivation and extends to the objectives of this research. An outline of thesis
organisation and synopsis of each chapter are available in the last part of introduction.
1.0. Research motivation
Heart failure is characterized by the inability of the heart to supply adequate
blood flow and therefore oxygen delivery to tissues and organs in the body.
Cardiovascular disease is the most commonly reported cause of mortality and it
contributes to approximately 30 percent of deaths. In order to maintain cardiac output,
compensatory mechanisms take place, including geometrical modifications of the heart
(remodelling). The heart is stretched to hold more blood in the diastole so that it is able
to generate stronger force of contraction during systole, following the Frank Starling’s
law (Patterson et al., 1914; Sarnoff & Berglund, 1954; Starling & Visscher, 1926).
Furthermore, to overcome high afterload pressure normally experienced by these
patients, yet with reasonable wall stress, the muscle wall thickens. Over a long period,
the gradual declination of cardiac performance is no longer compensable which then
develops into heart failure. Dilated cardiomyopathy (DCM) is the most common
cardiomyopathy disease which has been frequently reported incidence of morbidity and
mortality, with a mortality rate of up to 50% annually in patients with idiopathic DCM
(IDCM) (Zipes & Wellens, 1998).
Numerous methods have been used to diagnose and differentiate various types
of heart failure conditions in order to plan for the best treatment strategies for the

2
patients. These involve examining the heart’s morphology (Altbach et al., 2007; Amano
et al., 2004; Somauroo et al., 2001), electrical activity (Narayana, 2011; Rosen et al.,
1979), mechanics (Altbach et al., 2007; Augenstein et al., 2001; Kirkpatrick & Lang,
2008) and hemodynamics (Feintuch et al., 2007; Thomas, J. D. & Popovic, 2006). With
the advancement of medical technologies, non-invasive imaging modalities, such as
chest x-ray, electrocardiogram, computed tomography, magnetic resonance imaging
(MRI) are gradually becoming more popular. Among these, MRI and echocardiography
are the most commonly used diagnostic tools to assess cardiac function through
geometric and flow measurements, such as left ventricle (LV) volume, wall mass, stroke
volume, ejection fraction (EF), wall motion and wall thickness. The global LV function
depends on both systolic and diastolic function. As in DCM case, clinical imaging
modalities report systolic dysfunction by EF reduction (Dahm et al., 2002; Persson et
al., 1995) however the gauge of diastolic dysfunction is not yet well-founded.
Alternatively, Computational Fluid Dynamics (CFD) method which involves the
study of cardiovascular blood flow pattern has emerged as a reliable tool in enhancing
the understanding of the pathophysiology and progression of the heart disease, by easily
allowing reproducible numerical experiments under identical conditions. Both of the
global and regional hemodynamic variables are feasible through the simulations.
Regional hemodynamic variables are, for instance, pressure distributions, myocardial
strains, and stresses. The velocity fields and shear stress have a complicated relationship
in thrombus formation (Taylor & Draney, 2004) which is important in identification of
cardiac disease. Hereby various physical flow conditions can be predicted while induce
early recognition of disease stage helps to reduce patient’s risk. As a result, CFD

3
simulation has been extensively applied in the investigation of ventricle pathological
flow (del Alamo, 2009; Ge & Ratcliffe, 2009) and evaluation of surgical treatment and
cardiac assist device. Thereby strong comprehension in pathophysiology of DCM is to
be developed through CFD study in the present work.
1.1. Research objectives
The aim of this work is to investigate the effect DCM LV on intraventricular fluid
dynamics and myocardial wall mechanics. The overall objective of this work is to
perform a simulation of DCM LV during diastolic filling phase. In addition, the
individual effects of parameters related to DCM are also to be evaluated through
sensitivity analysis. They are the peak E-wave velocity, end systolic volume (ESV),
wall stiffness and sphericity index (SI) on intraventricular fluid dynamics and
myocardial wall mechanics during LV filling. In order to achieve the aim of the study,
the following objectives were established:
1. To develop a simplified model of the LV with DCM,
2. To simulate the diastolic filling of LV with DCM,
3. To investigate fluid and mechanical variables in the LV with DCM during the
diastolic filling phase and compare the results to the published studies,
4. To conduct sensitivity analysis and evaluate the effect of individual parameter
which contribute towards DCM.

4
1.2. Research Question
The study attempts to answer the following research questions:
1. What velocity profile characterizes the blood travelling through mitral valve during
filling phase?
2. Which CFD method is more suitable to be used for the investigation of
intraventricular hemodynamic and wall mechanics of a LV with DCM?
3. What are the impacts on intraventricular hemodynamic and wall mechanics in LV
with DCM compared to a normal LV?
4. What are the effects of individual parameters which contribute towards DCM?
1.3. Thesis organization
The thesis is composed of six chapters. Chapter 2 provides the literature review
done on DCM in both clinical and simulation situations. Chapter 3 explains the
implementation of this work in full details; from the selection of boundary condition (i.e.
transmitral velocity profile) and CFD method either geometry-prescribed or fluid-
structure interaction (FSI), to the complete DCM simulation which incorporates both
blood flow and myocardial properties. Chapter 4 describes the simulation outcome
where the different sets of results were compared and analyzed. Chapter 5 compares the
results in Chapter 4 to previous studies and discuss then. Chapter 6 concludes the
findings of the present work and provides suggestions for future improvements.
5
Chapter 2. LITERATURE REVIEW
2.0. Introduction
DCM is one of the most common cardiac diseases characterized by myocardial
contractile dysfunction and ventricular dilatation with a change of sphericity (from an
elliptical to a spherical shape) (Douglas et al., 1989; Jefferies & Towbin, 2010). In
addition, patients with DCM have a stiffer myocardial wall, caused by increased
myocardial mass and alteration in the extracellular collagen network (Gunja-Smith et
al., 1996). The measureable functional deficiencies of DCM include low EF and
decreased wall motion (Plein et al., 2001).
DCM can be caused by many factors, such as genetic, infection, alcohol abuse as
well as other cardiac diseases. Generally, the etiology of DCM is classified into
ischemic and non-ischemic. The IDCM, primary myocardial damage, is the most
common among the non-ischemic group. It arises spontaneously and has unknown
causes. Ischemic DCM (ICM) experiences secondary myocardial damage as a result of
poor perfusion of the myocardial wall caused by the coronary disease. Irrespective of
the disease etiology, all DCM patients experience similar mechanical compensation.
Despite having a similar mechanical compensation and global hemodynamics, Parodi et
al. (1993) observed a more heterogeneous transmural blood flow distribution in patients
with ICM and a higher percentage of fibrosis in these patients in their clinical studies as
compared to patients with IDCM (Parodi et al., 1993). Not limited to clinical studies,
this chapter also traced the findings of DCM through computational models which are
described in the sections below.

6
2.1. Clinical imaging studies
The structural ventricular remodelling processes associated with DCM, including
chamber enlargement, alterations in shape and decreased wall compliance significantly
affect the intraventricular filling dynamics. Commonly under measurement of MRI
(Imai et al., 1992) and echocardiography (Donal et al., 2009; Rihal et al., 1994; Thomas,
D. E. et al., 2009), it shows increased EDV (greater than 112 percent) and ESV with
thinner wall in anatomical data while functionally with low EF (less than 45 percent)
and decrease wall motion with fractional shortening less than 25 percent. Mitral
regurgitation flow was found as hemodynamic disorders (Donal et al., 2009).
Experimental study (Ohno et al., 1994) has reported that transmitral filling
pattern revealed progression of heart disease due to gradual decrease of wall compliance
and increase of LV pressure. The impaired relaxation filling pattern indicates an early
stage of diastolic dysfunction (Grade I), followed by a more severe pseudonormal filling
pattern (Grade II). The restrictive filling pattern (Grade III-IV) implies the most
advanced disease stage (Nishimura & Tajik, 1997).
Extensive clinical studies have investigated the difference between normal
subjects and DCM patients with regards to the intraventricular fluid dynamics (e.g. flow
propagation velocity, Vp (Garcia et al., 1998), intraventricular pressure difference
(IVPD) (Yotti et al., 2005), vortex area and intensity (Hong et al., 2008)) as well as
myocardial wall mechanics (e.g. principal strain (Tibayan et al., 2003) and strain rate
(Støylen et al., 2001; Wang et al., 2007)) using different imaging modalities, including
phase contrast magnetic resonance imaging (MRI) (MacGowan et al., 1997; Veress et

7
al., 2005), colour M mode echocardiography (Garcia et al., 1998), contrast
echocardiography (Hong et al., 2008), and tissue Doppler imaging (Park et al., 2006;
Støylen et al., 2001).
One limitation of these studies is that controversial findings often exist as there is
a high variability among patient characteristics, and it is difficult to ascertain the effect
of individual physiological variables on the parameters of interest (Garcia et al., 1998).
For example, an increase in Vp was found in patients with moderate hypertrophy
(Støylen et al., 2001), as opposed to other studies which demonstrated reduced Vp in
patients with reduced diastolic function (Rodriguez et al., 1996). Furthermore,
limitations in the measurement methods also contribute to the inconsistent findings. For
an instance, strain measurements using Doppler-derived analysis face the problem of
angle dependency (Gjesdal et al., 2008) while IVPD measurements using colour
Doppler M-mode images may yield high error when applied on severely dilated
ventricles (Yotti et al., 2005).
To overcome this problem, CFD and computational structural mechanics, which
quantify the spatial and temporal distributions of the velocity, pressure, stress and strain
in the heart, have emerged as reliable tools in enhancing the understanding of the
pathophysiology and progression of structural heart disease.

8
2.2. CFD simulation studies
CFD approach provides approximate solution of velocity and pressure fields
through Navier-Stokes equation (Discacciati & Quarteroni, 2009). For its strength over
current imaging diagnostic tools, CFD is able to further provide insights into
significance of hemodynamic factors such as intraventricular flow dynamics, wall shear
stress, mass transport and stagnation region (Nanduri et al., 2009). Early CFD
techniques for hemodynamic simulations were mostly carried out on simplified
geometries (Domenichini et al., 2009; Vierendeels et al., 2000). With the development
of cardiac imaging techniques, patient-specific morphology and flow has been
progressively used (Long et al., 2008; Saber et al., 2001; Schenkel et al., 2008), which
provides valuable clinical information. Recently, FSI models which take into account
the interaction between the blood and the cardiac wall have been developed (Cheng et
al., 2005; Krittian et al., 2010; Lemmon & Yoganathan, 2000; Nordsletten et al., 2011;
Watanabe et al., 2004b).
Prescribed geometry (Baccani et al., 2002b; Doenst et al., 2009; Domenichini &
Pedrizzetti, 2011; Loerakker et al., 2008) and FSI method (Watanabe et al., 2004a) in
CFD approach were used to study hemodynamic within LV chamber where the
outcomes are both representatively. The geometry-prescribed method uses prescribed
moving boundaries to simulate movement of the cardiac wall. On the other hand, the
FSI approach takes into account the interaction between the fluid and the structure and
provides additional important parameters such as myocardial deformation and wall
stress.

9
2.2.1. Geometry-prescribed approach
One of the few DCM studies include the geometry-prescribed model by Baccani
et al. (2002b), who analyzed the vortex dynamics in an axisymmetrical LV with DCM
during filling. The pulsatile flow rate obtained from clinical data is applied as inlet
boundary condition. The wall motion is prescribed with change of diameter and height
of LV according to the pulsatile flow rate. It was observed that geometrical alteration of
the LV in DCM decreases Vp which may lead to the formation of apical thrombus.
In another study, Loerakker et al. (2008) developed an axisymmetrical fluid
dynamics model of the LV, coupled to a lumped parameter model of the complete
circulation, to investigate the influence of a ventricular assist device on the vortex
dynamics in a ventricle with DCM. The lumped parameter model consists of systemic
and pulmonary circulation make up by ventricular chamber, valves, venous and arteries
in electrical circuit. A left ventricular assist device (LVAD) was modelled by
connecting a flow pump between LV and aorta. The volume change in LV was derived
from circulatory model and used to obtain fluid or wall velocity. With increasing flow
rate in LVAD, it was found that ventricular volume decreased and EF raised up which
shift the pressure-volume (PV) loop to the left. With assistance of LVAD in DCM heart,
the flow field was corrected to be similar as in normal heart. The increase of LVAD
flow rate decreased the LV volume and vortex formation is more effective. The vortex
strength, area and vorticity are also improved.

10
The major limitation of the previous work is the interaction between blood flow
and myocardial wall deformation, which significantly affects the various parameters of
interest, has not been taken into account.
2.2.2. FSI approach
It is known that CFD greatly contributes to cardiac diagnosis with condition that
accuracy of simulation result is promised. Due to limitation in certain aspect,
assumptions always are made in CFD method. As such, result validation is important
where well-matched outcome with imaging modalities and experiment helps in
justification. In order to have acceptably accurate result, the CFD settings should be as
realistic as possible. Cardiovascular CFD studies have progressively step forward to FSI
method which tends to provide more realistic cardiac flow analysis.
In most of ventricular studies, the condition of normal LV is assessed by using
FSI approach (Cheng et al., 2005; Krittian et al., 2010; Watanabe et al., 2002). Both of
fluid and wall mechanics match closely with the reported outcome from clinical studies.
Although numerous models of ventricular biomechanics for the ventricles have been
published (Khalafvand et al., 2011), they have not been widely used in the study of
diseased states. One of the few diseased ventricle models includes myocardial infarction
ventricle modelled by Watanabe et al. (2004a). To the best of author’s knowledge, there
is no DCM model that has been presented using FSI approach.

11
2.3. Conclusion
Due to the limitations of current cardiac imaging modalities, CFD has been
widely used in cardiac function assessment and heart disease diagnosis as it can provide
further insight into cardiac flow field. The understanding of ventricular hemodynamics
and pathological severities were explored through CFD method. However, assumptions
are always made in CFD method. As such, the result validation is important where well-
matched outcome with imaging modalities and experiment help in justification. In order
to have exact compatible results, the CFD boundary conditions should be as realistic as
possible. However, the existing DCM studies were confined on standalone study of
blood flow dynamics and wall mechanics instead of more realistic two ways interaction
between blood and myocardium. Thus, this research study will develop more insight in
DCM investigation by using FSI approach in CFD implementation.
12
Chapter 3. METHODOLOGY
3.0. Introduction
Before the simulation of DCM state, the selection of boundary conditions (uniform
versus parabolic transmitral velocity profile) and CFD method (geometry-prescribed
versus FSI approach) were compared in order to confirm the precise simulation
conditions. As such, the methodology was divided into four parts. The first two sections
involved investigation of transmitral spatial velocity profile and CFD simulation
approach, respectively. Subsequently, the complete simulation of DCM conditions,
including the detailed blood flow settings and myocardial properties, were described.
The last part of methodology explained the sensitivity analysis used to evaluate
individual factors which weaken the DCM LV. All the simulations were performed by
the commercial simulation software, COMSOL Multiphysics Inc.
3.1. Investigation on transmitral spatial velocity profile
The laminar flow model is applied due to the relatively low intraventricular blood
flow velocity (Cheng et al., 2005), which cause to a low Reynolds number (≈ 150). In
order to verify the spatial velocity profile, two different laminar transmitral velocity
profiles were imposed across the mitral orifice, i.e. uniform velocity profile and
parabolic velocity profile. Figure 3.1 shows the spatial velocity profile at the mitral
orifice during peak of E wave. In the figure, only half of the valve diameter is shown
due to the axisymmetric representation, where left side of x-axis represents middle of
the valve while right side of x-axis represents edge of the valve. The velocity is constant

13
throughout the mitral valve using the uniform velocity profile setting while the
parabolic velocity profile setting shows the highest velocity occurring at the middle of
the mitral valve where the peak velocity magnitude is about two-fold of uniform
velocity profile. The transmitral flow velocity was directed to the mitral inlet of a
dilated LV with ESV of 150 mL. For the purpose of this investigation, the geometry-
prescribed approach was used as the LV wall properties were not decided yet at this
stage of study.
Figure 3.1: Spatial profile of inlet velocity at the mitral valve during peak of E wave, using different
settings: uniform flow (left) and parabolic flow (right).
3.2. Investigation on CFD simulation approach
Theoretically, the quantitative blood flow dynamics was solved using the
continuity (Equation 3.1) and incompressible Navier-Stokes equation (Equation 3.2):
= 0.v (3.1)
2( . ) pt
vv v v (3.2)
where v (m/s) is the fluid velocity vector and p (Pa) is the pressure. Blood is assumed to
be Newtonian with constant density, ρ (1050 kg/m3) and viscosity, η (0.0035 Pa.s).

14
In this investigation section, three LV models with ESV of 50 mL, 150 mL and
300 mL were simulated and each LV represented size of normal, moderately dilated,
and severely dilated correspondingly. A constant transmitral temporal velocity and
uniform spatial velocity profile was imposed.
3.2.1. Geometry-prescribed method
The geometry-prescribed method proposed by Baccani et al. (2002b) was
adapted, where the wall motion was derived from the instantaneous blood flow rate, Q (t)
(m3/s) through the mitral valve on the basis of a simple elastic membrane model. The
rate of change of the ventricular base equatorial radius, R (m), and the ventricular height,
H (m) are as shown in the Equation 3.3 and 3.4, respectively:
2 2
3 3
3 ( ) 2
10 4
dR Q t H R
dt H R HR
(3.3)
3 2 2
2 3 3 3
3 ( ) 2
2 10 4
dH Q t H H R
dt H R R H R HR
(3.4)
The derivation of Equation (3.3) and (3.4) are shown in the Appendix.
3.2.2. FSI method
By using the FSI method, the LV wall deformed accordingly when blood filled
the ventricular chamber, depending on the wall properties and the load imposed by the
blood. The coupling between the blood and the myocardial wall was taken into account
at the fluid-solid interface through the following relationship:

15
f su u (3.5)
f s n n (3.6)
where uf, us (m) represents the displacements, σf, σs (Pa) represents the stress tensors of
the blood and myocardial wall, respectively, at the fluid solid interface, and n represents
the unit normal vector.
In numerical scheme, an arbitrary Lagrangian-Eulerian (ALE) method was used to
syndicate the blood flow formulated using an Eulerian description and a spatial frame,
with myocardial wall mechanics formulated using a Lagrangian description and a
material frame. To achieve model convergence, the myocardial wall mechanics
formulation allowed large wall deformations, or also known as geometric nonlinearity.
The blood flow spatial frame deformed with a mesh deformation that was equal to the
myocardial wall displacements, us. The wall motion was adjusted according to the free
moving mesh inside the blood domain. This geometric change of the blood domain was
automatically accounted for in COMSOL Multiphysics by the ALE method.
3.3. Simulation of DCM conditions
The complete DCM conditions were simulated using FSI approach, where the LV
wall deformation was dependent on the wall properties and the load imposed by the
fluid. However, it was noted that LV basal wall was fixed in all directions while other
parts of the wall were allowed to move freely in the model settings. A 2D
axisymmetrical model was used in the simulation. The assumptions made in this
simulation study include:

16
1. The LV is a symmetrical half truncated prolate ellipsoid.
2. The mitral valve is a fixed opening orifice.
3. The LV wall is hyperelastic, incompressible and transverse isotropic.
4. Blood is incompressible and behaves as Newtonian fluid.
3.3.1. Disease conditions
In the present work, two DCM conditions were simulated in respective model:
IDCM and ICM where the infarction was located at the apical wall region. The
infarction region occupied 60 percent of the total wall region. The wall compliance of
whole myocardial wall region was decreased homogeneously in IDCM. A normal LV
was modelled in order to serve as baseline model for comparison with DCM conditions.
3.3.2. Geometry of LV
An axisymmetrical half truncated prolate ellipsoid was used to represent a
normal LV while the half truncated prolate spheroid characterized DCM LVs. The SI
was characterized by a ratio of ventricular radius at the equator plane to ventricular
height from base to apex. The normal and DCM LVs appeared in SI of 0.52 and 0.62,
respectively (Zhong et al., 2009). At the ventricular base, the mitral valve was modelled
as a fixed opening orifice with 0.6 ventriculo:annular proportion for normal LV whereas
0.4 ventriculo:annular proportion for DCM LV. The ventriculo:annular proportion
refers to the ratio of the LV radius to the radius of the mitral valve (or mitral annular
ring). The aortic valve was closed throughout the filling phase. The LVs were modelled
at the end systole initially and experience expanding volume during filling phase. The

17
normal LV was in ESV of 50 mL whereas 150 mL illustrated the DCM LVs. All LVs
had wall thickness decreased along the ventricular wall from the base to the apex, with
11 mm at the base and 9 mm at the apex. The tetrahedral mesh was used in the
simulation in COMSOL Multiphysics.
3.3.3. Material properties of LV wall
A hyperelastic wall with constant density of 1366 kg/m3 (Watanabe et al., 2002)
was used to represent the LV muscle in the passive state. As mentioned in Sub-section
3.3.2, the wall stiffness is constant throughout the whole ventricular wall for the normal
and IDCM models. On the contrary, it is much higher at the apical region in the ICM
model (60 percent of the total wall region) compared to other areas of the LV to simulate
myocardial infarction. The parameter values were determined so that a predetermined
EDP can be achieved for each condition.
The passive material model of Lin & Yin (1998) was adapted to represent
ventricular biaxial stretch properties in this study. The Lin-Yin model was proposed
based on the biaxially stretched rabbit specimens, by assuming the myocardium is
hyperelastic, incompressible and transverse isotropic (Lin & Yin, 1998). It should be
noted that the Lin & Yin (1988) model involved deduction of the functional form of
strain energy function directly from the experimental data. The deduced strain energy
function has been widely used because it was proven to give reproducible satisfactory
stress-strain curve fits with the experimental data.

18
The material parameters (C1-C4) of Lin & Yin (1998) passive model were
determined so that an EDP of 9 mmHg is obtained in the normal LV. As a result, the
material parameters were adjusted to 45 percent of reported average values. The
material parameters were assumed as C1= 46.34 Pa, C2= 4.11, C3= 1.044, and C4=
0.036. Meanwhile, the DCM wall properties were characterized by adapting the passive
material properties in diseased ventricles which have been employed by Watanabe et al.
(2004a). The total strain energy density function as given in the Equation 3.7 is a
combination of passive material model proposed by Lin & Yin (1998), (Equation 3.8)
and Humphrey et al. (1990), (Equation 3.9):
passive LinYin HumphreyW W mW (3.7)
1( 1)Q
LinYinW c e (3.8)
2 2
2 1 3 1 4 4 4( 3) ( 3)( 1) ( 1)Q c I c I I c I
1 1 1
2 3 22 2 21 4 2 4 3 1 4 1 4 5 1( 1) ( 1) ( 3) ( 3)( 1) ( 3)Humphrey h h h h hW c I c I c I c I I c I (3.9)
In order to produce EDP of 20 mmHg in both DCM ventricles, the stress-strain
relationship was adjusted through a scale factor, m in Equation 3.7. The scale factor, m
= 0, 3.5, 14 and 100 were corresponded to ventricular wall properties of normal, ICM
(base), IDCM, and ICM (apex), respectively. The material parameters of Humphrey et
al. (1990) passive model were adopted (C1h= 1.97 kPa, C2h= 6.212 kPa, C3h= 0.164 kPa,
C4h= -2.7 kPa, and C5h= 2.35 kPa) (Humphrey et al., 1990). Figure 3.2 shows the LV
wall stiffness (stress-strain curve) of normal LV, IDCM and ICM by comparing to Lin
& Yin (1998) passive model and Watanabe et al. (2004a) infarction models.

19
Figure 3.2: Stress-strain relationship.
Due to the fiber orientation in ventricular model not taken into consideration in
the simulation, first-order Ogden constitutive relation in Equation 3.10 (Ogden et al.,
2004) was selected to represent the biaxial stress-strain relationship of normal and DCM
models for its advantages of simplicity as well as best curve fits with Lin-Yin passive
model.
2( )S
(3.10)
where S (kPa) represents nominal stress, λ represents principal stretch, while µ and α
are material constants. The Ogden fitted curves were shown in Figure 3.3 where the
semi-log plot (y-axis) on the right side was plotted in purpose for better visualization of
different LV material properties.

20
Figure 3.3: Relationship between nominal stress and strain for the normal, IDCM and ICM (basal and
apical region) models. Semi-log plot (y-axis) is on the right.
3.3.4. Transmitral filling pattern
Blood was assumed to be incompressible and Newtonian, with a viscosity of
0.0035 Pa.s and a density of 1050 kg/m³ (Cheng et al., 2005). To simulate transmitral
flow, a uniform velocity profile was applied at the inlet boundary representing the mitral
valve. The time-varying profile of the filling phase comprised the E-wave, diastasis and
A-wave, which represented the 3 main phases of the transmitral inflow.
Experimental study (Ohno et al., 1994) had reported that transmitral filling
pattern revealed progression of heart disease due to gradual decrease of wall compliance
and increase of LV pressure. The impaired relaxation filling pattern indicated an early
stage of diastolic dysfunction (Grade I), followed by a more severe pseudonormal filling
pattern (Grade II). The restrictive filling pattern (Grade III-IV) implied the most
advanced disease stage (Nishimura & Tajik, 1997). Therefore, all four types of filling
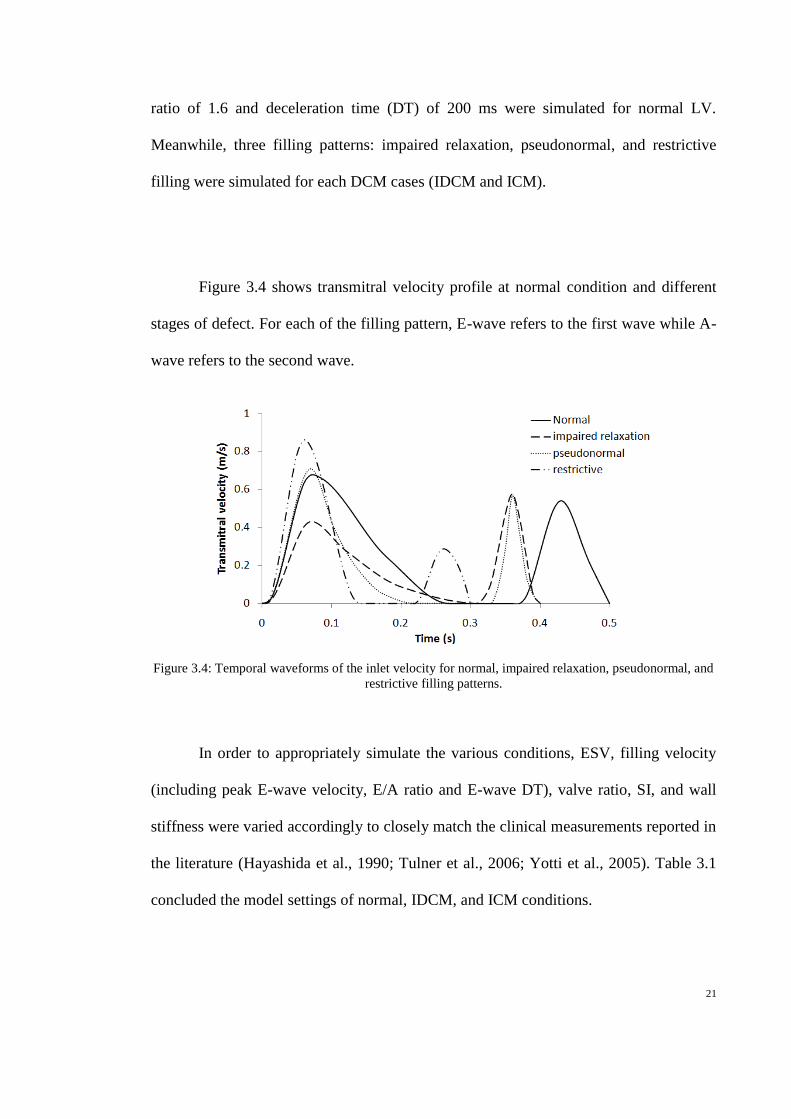
pattern were included in the present simulation study. A normal filling pattern with E/A
21
ratio of 1.6 and deceleration time (DT) of 200 ms were simulated for normal LV.
Meanwhile, three filling patterns: impaired relaxation, pseudonormal, and restrictive
filling were simulated for each DCM cases (IDCM and ICM).
Figure 3.4 shows transmitral velocity profile at normal condition and different
stages of defect. For each of the filling pattern, E-wave refers to the first wave while A-
wave refers to the second wave.
Figure 3.4: Temporal waveforms of the inlet velocity for normal, impaired relaxation, pseudonormal, and
restrictive filling patterns.
In order to appropriately simulate the various conditions, ESV, filling velocity
(including peak E-wave velocity, E/A ratio and E-wave DT), valve ratio, SI, and wall
stiffness were varied accordingly to closely match the clinical measurements reported in
the literature (Hayashida et al., 1990; Tulner et al., 2006; Yotti et al., 2005). Table 3.1
concluded the model settings of normal, IDCM, and ICM conditions.

22
Table 3.1: List of parameter values for normal, IDCM and ICM conditions.
ESV
(mL)
EDV
(mL)
IV
(mL)
VA SI EDP (mmHg)
E
peak
(m/s)
A
peak
(m/s)
DT
(ms)
E/A µ α
Normal
(baseline)
50
120
70
0.6
0.52
9.5
0.7
0.56
200
1.25
39.3
15.7
IDCM (IR)
150
194
44
0.4
0.62
20.3
0.45 0.6 250 0.75
3310
10.7
IDCM (PS) 0.74 0.59 160 1.25
IDCM (RE) 0.9 0.3 70 3.0
ICM (IR)
150
194
44
0.4
0.62
20.3
0.45 0.6 250 0.75 23705
(I)
843.2
(NI)
10.5
(I)
11.1
(NI)
ICM (PS) 0.74 0.59 160 1.25
ICM (RE) 0.9 0.3 70 3.0
IR = impaired relaxation, PS = pseudonormal, RE = restrictive. ESV = end systolic volume, EDV = end
diastole volume, IV = total inflow volume, VA = ventriculo:annular proportion, SI = sphericity index,
EDP = end diastolic pressure, E peak = peak E-wave velocity, A peak = peak A-wave velocity, DT = E-
wave deceleration time, E/A = ratio of the peak E-wave velocity to the peak A-wave velocity, µ and α =
material constants of the Ogden constitutive equation, NI = non-ischemic, I = ischemic.
3.4. Sensitivity analysis
The effects of a two-fold increase in the baseline normal value of peak E-wave
velocity, ESV, wall stiffness, and SI on intraventricular fluid dynamics and myocardial
wall mechanics were investigated. The outcomes to be compared include vortex
parameters (average vorticity, vortex area, and vortex intensity), Vp, IVPD, as well as
wall stress and strain rate.

23
3.4.1. Vortex identification
Average vorticity, (1/s), was defined as the mean value of the out-of-plane
vorticity ( )v in the LV. On the other hand, quantitative evaluation of the vortex
area (ΓA) and intensity ΓI were carried out by first identifying the vortical regions in the
LV using the λ2 criterion proposed by Jeong et al. (1995). The eigenvalues (λ1, λ2, λ3) of
the tensor Ωs 2
+ Ωa2 are computed, where Ωs and Ωa are the symmetric and anti-
symmetric parts of the velocity gradient tensor ( ) respectively. Assuming that
, vortical regions were identified as regions with 2 0 . Vortex intensity, ΓI was
thus calculated as in Equation 3.11:
ΓI=
A
(3.11)
where A (m2) is the area of the vortical regions. The vortex area, ΓA (m
2), is defined as
the total area of the vortical regions. Vp (m/s) is calculated as the average travelling
velocity of the peak E-wave velocity mid-way into the LV axis from the inlet.
3.5. Mesh dependency test
The mesh dependency was conducted in order to ensure selection of appropriate
mesh to produce significant simulation results in addition to reduce simulation time
consumption. The mesh used in the current study composed of 1331 elements. The
number of elements was increased to 2143 and 5505 extreme fine mesh elements. It was
found that the differences in maximum vorticity between 1331 to 2143 and 5505 mesh
elements (during peak filling wave) were 2.9 percent and 4.3 percent, respectively. The
reduction of mesh elements to 840 caused 5.6 percent maximum vorticity reduction

24
compared to 1331 mesh elements. Thus, tetrahedral mesh with 1331 elements was
chosen for the study because the result variation with finer mesh elements was within 5
percent.
3.6. Numerical result validation
According to mass conservation law, the transfers of matter in a close system
must maintain a constant mass over time. The difference between inflow blood volume
and changes of LV volume during filling phase was inspected and the volume
difference was within 2 percent. Hence, the simulation results were validated as
conforming to the mass conservation law.

25
Chapter 4. RESULTS
4.0. Introduction
The result is presented into four parts. The first part described the results obtained from
two different spatial velocity profiles, i.e. uniform vs. parabolic transmitral velocity
profile. The second part compared the results obtained from two different CFD
implementations, i.e. prescribed geometry vs. FSI method. Section 4.3 is the core of
current work which showed the result of the complete simulation of DCM conditions.
Finally, the findings of sensitivity analysis including effects of peak E-wave velocity,
ESV, wall stiffness, as well as SI on fluid dynamics and wall mechanics were presented.
4.1. Uniform vs. parabolic velocity profile
In order to confirm the spatial velocity profile of transmitral blood flow, two
types of laminar inlet velocity profiles were simulated during the filling phase: uniform
and parabolic velocity profiles using geometry-prescribed approach. The results were
analysed based on vortex evolution pattern and vortex strength.
Distinctive vortex evolution patterns were observed between the two cases:
transmitral flow velocity with uniform (Figure 4.1) and parabolic transmitral velocity
profiles (Figure 4.2). In the ventricle with a uniform inlet velocity profile, the incoming
flow stream is rolled up immediately after travelling through a short distance away from
the mitral valve (t= 0.15 s). The redirected blood stream forms a vortex ring, preserving
the kinetic energy of the incoming flow through the fast spinning velocity. The

26
attachment of the vortex ring attached at the mitral edge restricts its propagation.
Although the attached vortex ring is still able to move closer to the lateral wall in the
meantime towards the apex, its low vortex strength does not help to break the wake
attachment at the mitral edge. The uniform flow stream hanging at the basal region
experiences a small convective acceleration that is unable to overcome the local
deceleration effect.
Figure 4.1: Vortex formation patterns obtained using uniform velocity profile as inlet boundary condition,
instantaneous vorticity at t = 0.15 s (left), 0.25 s (middle) and 0.35 s (right), vorticity levels (1/s) from 5
to 100, step 10.
Figure 4.2: Vortex formation patterns obtained using parabolic velocity profile as inlet boundary
condition, instantaneous vorticity at t = 0.15 s (left), 0.25 s (middle) and 0.35 s (right), vorticity levels
(1/s) from 5 to 100, step 10.

27
During deceleration of the transmitral velocity (t= 0.25 s), kinetic energy
decreases at the basal region while pressure decreases at the apical region. The change
in the pressure and the velocity encourages the growth of the vortex ring and facilitates
its detachment from the attached wake at a later time. The free vortex ring starts to
propagate at self-induced convection against the higher pressure at the apical region.
Meanwhile, it interacts with the ventricular wall and induces the formation of another
small vortex ring which developed from a boundary layer. The high pressure energy at
the apical region and low vortex strength or kinetic energy of the propagating flow
stream restricts the penetration of the vortex ring to the end of the apex in the enlarged
chamber. As a result, the vortex ring halts at the mid ventricular region (t= 0.35 s). The
region beneath the vortex ring remains in a low velocity condition. The same vortex
evolution process reprises during late filling, but with a smaller size secondary vortex
ring because of lesser inflow volume during the late filling wave.
Conversely, the parabolic flow stream containing high kinetic energy propels the
flow stream towards the apex. The parabolic flow stream travels under great inertial
influence and is therefore able to approach the middle region of the LV during the
acceleration phase (t= 0.15 s). No vortex ring is developed in the early filling phase as
the flow stream is able to overcome the high pressure at the apical region without being
redirected towards the base. The incoming fluid propagates against the resistance of the
resting fluid and develops shear layer. During deceleration of the transmitral velocity
(t= 0.25 s), the parabolic flow stream is decelerated progressively by the accumulated
pressure energy deposited in the resting fluid as well as local deceleration at the down-
stroke of the E wave. However, at this moment, the parabolic flow stream, which has

28
already reached the lower part of the ventricle, experiences a convective acceleration at
the same time due to the decreasing diameter of the ventricle at the apex (t= 0.25 s).
Once the energetic parabolic flow comes in contact with the myocardial wall at the end
of the apex, the flow stream is reflected and redirected towards the basal region. As a
consequence of the interaction between the flow stream and the myocardial wall, a
boundary layer is formed near the wall which contains vorticity rotating in opposite
direction with that of the parabolic flow. This boundary layer develops into small
vortices which interact among each other and with the ventricular wall to produce
strong vorticity as observed during diastasis (t = 0.35 s). The same process is repeated
during the late filling phase.
The instantaneous vortex strength in both the uniform and parabolic flow studies
is shown in Figure 4.3, where the maximum vortex strength in the LV with a parabolic
inlet velocity profile (0.38 m2/s) is almost 2 times greater than that using a uniform inlet
velocity profile (0.22 m2/s). The maximum vortex strength occurs during early filling in
the first scenario (using a parabolic inlet velocity profile) but during late filling in the
second scenario (using a uniform inlet velocity profile).

29
Figure 4.3: Vortex strength in a DCM ventricle with different spatial velocity profile.
4.2. Geometry-prescribed vs. FSI method
In order to compare different implementation of CFD method, three LV models
with different ESV, i.e. normal (50 mL), moderate dilated (150 mL) and severely dilated
(300 mL) were simulated using both geometry-prescribed and FSI methods. The result
similarity and disparity obtained from the two different methods were evaluated.
Figure 4.4 shows a comparison of the vortex distribution in the ventricle under
the three different cardiac conditions through implementation of geometry-prescribed
and FSI method. In both simulations, the propagating vortex ring in dilated ventricles has
less interaction with the ventricular wall, thereby producing a thinner boundary layer.
The most notable difference between the two implementations lies in the vortex
attachment to the edge of the mitral orifice. In the FSI implementation results, the vortex
ring was attached to the edge of the mitral orifice for a longer period. In addition, a

30
thinner boundary layer was observed, and less interaction occurred between the vortex
and the wall. Dissimilar with the geometry-prescribed method, wall expansion of the FSI
model depends on the fluid force exerted on it. Furthermore, due to the fixed constraint
at the basal wall, there is a slight difference between the two methods in regards to the
geometry, especially at the basal region of the ventricle, which leads to the difference in
the result.
Figure 4.4: Instantaneous vorticity in the normal, moderately dilated and severely dilated LV at t = 0.36 s
in the geometry-prescribed (top) and FSI implementation (bottom), vorticity levels (1/s) from 5 to 100,
step 10.

31
As expected in both methods, vortex strength in the more dilated ventricles is
lower as compared to the normal condition. Comparing the three different cardiac
conditions, the normal ventricle has the greatest vortex strength (maximum strength of
0.04378 m2/s) as compared to the moderately (maximum strength of 0.03782 m
2/s) and
severely dilated ventricle (maximum strength of 0.03513 m2/s), as shown in Figure 4.5.
Figure 4.5: Vorticity magnitude in normal (solid line), moderately dilated (dashed line) and severely
dilated LV (dotted line).
Compared to the geometry-prescribed method, FSI approach provides additional
parameters such as myocardial displacement and wall stress, which serve as useful
prognostic determinants of heart disease. The wall movement depends on the wall
properties and the fluid force exerted on it. Figure 4.6 shows that the wall displacement
and velocity were significantly reduced by ventricular dilatation at the same inflow
volume and wall properties.

32
Figure 4.6: Total displacement (right) of normal (solid line), moderately dilated (dashed line) and
severely dilated LV (dotted line) obtained from FSI implementation.
4.3. Normal, IDCM, and ICM conditions
4.3.1. Intraventricular flow distribution
Figure 4.7 shows the vorticity contour plot in the normal LV, IDCM (impaired
relaxation), and ICM (impaired relaxation) conditions during the peak E-wave, end of
E-wave, and end of filling phase. In all cases, as blood flows across the mitral orifice to
the larger ventricular chamber, it decelerates and thus pressure increases. The higher
pressure downstream opposes the incoming blood flow and redirects it, forming a
recirculation structure known as vortex ring. Meanwhile, the vortex induces the
formation of boundary layers at the ventricular wall due to viscous adherence condition
at the wall. The vortex creates local velocity gradient along the wall and this
perturbation gives rise to a vortex-induced separation of the boundary layer, which
rotates in the opposite direction. At end of E-wave, the vortex has travelled mid way
into the LV axis in all cases. A secondary vortex ring induced by the atrial contraction
can be observed in all cases at end of filling.

33
Notable differences can be observed between the normal and the DCM cases in
terms of the vorticity distribution (Figure 4.7). However, the vorticity distribution in the
IDCM condition is similar to that in the ICM condition. It can be seen that the vortices
in the DCM cases have a more spherical shape, as compared to that in the normal
condition, where they are more elongated in shape. Furthermore, the relative area
occupied by the vortices compared to that of the total LV area is much higher in the
normal condition. Although the propagation velocity of the vortices is similar among
the three conditions, the vortex did not reach the apical region during end filling in both
DCM cases, in contrary to that in the normal case, due to a difference in their LV size.
Normal IDCM ICM
Peak of
E-wave
End of
E-wave
End of
filling
Figure 4.7: Instantaneous vorticity (contour plot) in normal LV, IDCM (impaired relaxation) and ICM
(impaired relaxation).

34
Among the different filling patterns, the restrictive filling pattern yields the
highest , followed by pseudonormal and impaired relaxation filling patterns. Both
DCM conditions have a higher ΓA as compared to the normal LV condition. On the
other hand, DCM conditions with a restrictive filling pattern has the highest ΓI, followed
by the normal LV condition, DCM conditions with a pseudonormal filling pattern, and
lastly DCM conditions with an impaired relaxation pattern. Vp is higher in the normal
LV compared to the DCM conditions. Meanwhile, among the various filling patterns,
DCM condition with a restrictive filling pattern has the greatest Vp, followed by
pseudonormal and impaired relaxation.
4.3.2. Intraventricular pressure, wall stress, and strain distribution
Figure 4.8 illustrates the temporal waveforms of the IVPD for normal, IDCM,
and ICM conditions with different filling patterns. Generally, normal LV shows the
greatest fluctuations throughout the filling phase. It can be observed that early peak
IVPD occurs during the acceleration phase of E-wave (peak acceleration) in all cases.
DCM conditions with a restrictive filling pattern have the highest early peak IVPD,
followed by DCM conditions with a pseudonormal filling pattern, normal LV, and lastly
DCM conditions with impaired relaxation. On the contrary, among the different
conditions, DCM conditions with a restrictive filling pattern have the lowest late peak
IVPD.

35
Figure 4.8: Temporal waveforms of the IVPD for normal, IDCM, and ICM with impaired relaxation,
pseudonormal and restrictive filling patterns.
Figure 4.9 shows the von Mises stress (vMs) and strain distribution in the
normal LV, IDCM (impaired relaxation), and ICM (impaired relaxation) cases during
end of the filling phase. The findings indicate a decreasing transmural stress distribution
from the endocardial to the epicardial wall in all cases during the filling phase. On the
other hand, average transmural stress at the mid-height level is higher as compared to
the apical region. ICM condition demonstrates high wall stress at the border zone
between the ischemic and the non-ischemic region.

36
Normal IDCM ICM
Figure 4.9: vMs (top) and strain (bottom) distribution for (a) normal, (b) IDCM (impaired relaxation) and
(c) ICM (impaired relaxation) during end of the filling phase.
Table 4.1 shows the quantitative result of intraventricular fluid dynamics and
wall mechanics. Compared to the normal LV case, the average wall stress for the DCM
conditions is much higher (Table 4.1). On the contrary, normal LV exhibits the greatest
strain and strain rate in all directions, i.e. longitudinal, circumferential, and radial
directions (Figure 4.9 & Table 4.1). The ischemic region in the ICM condition has much
lower strain level as compared to other regions along the myocardial wall (Figure 4.9).

37
Table 4.1: Quantitative comparison of various intraventricular fluid dynamics and myocardial
wall mechanics measurements for normal, IDCM and ICM with impaired relaxation, pseudonormal and
restrictive filling patterns.
Normal IDCM ICM
Impaired Pseudo Restrictive Impaired Pseudo Restrictive
(1/s) 8.90 3.47 5.52 7.29 3.66 5.74 7.49
ΓA (m2) 2.21 2.26 2.72 2.71 2.31 2.64 2.67
ΓI (m2/s) 0.011 0.006 0.010 0.013 0.006 0.010 0.013
Vp (m/s) 0.445 0.150 0.286 0.357 0.098 0.259 0.357
IVPDE
(mmHg)
0.833 0.548 0.828 1.17 0.543 0.841 1.14
IVPDL
(mmHg)
0.644 0.908 0.979 0.306 0.788 0.871 0.196
vMS
(kPa)
0.844 3.06 3.60 3.682 2.849 3.57 3.667
SRL 0.655 0.21 0.208 0.281 0.230 0.231 0.308
SRC 0.509 0.154 0.152 0.207 0.0756 0.0754 0.1002
SRR -0.574 -0.246 -0.244 -0.329 -0.165 -0.166 -0.221
= average vorticity, ΓA = vortex area, ΓI = vortex intensity, Γave = average vorticity, Vp = flow
propagation velocity, IVPDE = early peak intraventricular pressure difference (IVPD), IVPDL = late peak
IVPD, average vMS = average von Mises stress, SRL = average longitudinal strain rate, SRC = average
circumferential strain rate, SRR = average radial strain rate.
4.3.3. PV relationship
Figure 4.10 shows the LV PV curve obtained throughout the filling phase in all
cases. It is shown that the PV curve is shifted to the right in the DCM cases, with an
increase in slope. Although both DCM cases have the same initial and end PV points,
they traverse a slightly different path, with the ICM appearing to be more compliant
within the range used in the current study.

38
Figure 4.10: PV relationship for normal, IDCM and ICM conditions throughout the filling phase.
4.4. Sensitivity analysis
Figure 4.11 and Figure 4.12 illustrate the percentage change in vortex intensity,
ΓI, Vp, early peak IVPD, EDP, as well as vMS, SRL, SRC, and SRR of the myocardial
wall with a two times increase in the peak E-wave velocity (maintaining E/A ratio and
DT), ESV, wall stiffness and SI from their respective baseline values. In Figure 4.11,
the baseline values of E peak = 0.7 m/s, ESV = 50 mL, SI = 0.52 and wall stiffness are
the same as the normal condition as demonstrated in Section 4.3.

39
Figure 4.11: Effects of DCM parameters on fluid dynamic measurements.
Figure 4.12: Effect of DCM parameters on wall mechanics measurement.

40
Peak E-wave velocity contributes the most to ΓI, with a percentage increase of
151.6%, which is far higher than the other factors. Wall stiffness causes the most
significant effect on Vp (-30%), followed by peak E-wave velocity (14.4%), ESV (-9%)
and SI (3%). On the other hand, IVPD increases with an increase in the peak E-wave
velocity (80.3%) and wall stiffness (17%), but decreases with increasing SI (-30.9) and
ESV (-14.3%). EDP and vMS follow similar trends, with peak E-wave velocity
contributing the most (431.5% and 371.6%), followed by wall stiffness (113.1% and
149.8%), ESV (-83% and -73.4%), and SI (13.3% and 28.9%). With regards to peak
strain rates, an increase in the peak E-wave velocity causes a substantial increase in the
strain rates (SRL: 140.7%, SRC: 131.1%, SRR: 80.0%). To the contrary, increasing ESV
significantly decreases strain rates (SRL: -44.5%, SRC: -46.4%, SRR: -28.0%). SI and
wall stiffness, on the other hand, have negligible effects on strain rates.

41
Chapter 5. DISCUSSION
5.0. Introduction
The discussion part is divided into four sections. Firstly, the vortex evolution of uniform
and parabolic transmitral velocity profile is discussed. It is followed by the comparison
between two CFD methods, i.e. geometry-prescribed and FSI implementation. The
comparison among normal and DCM LVs were discussed in the subsequent section.
The last section of discussion concentrates on sensitivity analysis of individual factors
which have been observed in DCM LV.
5.1. Comparison between uniform and parabolic velocity profile
While blood flows across the narrow mitral orifice to the broader ventricular
chamber, blood decelerates and pressure increases simultaneously in the direction of
flow according to the conservation of mass and Bernoulli’s principle. The higher
pressure at the downstream opposes the incoming flow stream, leading to a fan-like
flow towards the ventricular wall. As a result, the flow stream tends to roll up and
redirect towards the mitral valve (Pasipoularides et al., 2003).
The vortex formation pattern in the LV with a uniform inlet velocity profile
agrees with that reported in the literature, where the vortex ring is attached to the mitral
edge until the diastasis phase. In addition, instead of moving vertically downward
towards the apex as observed in the LV with a parabolic inlet velocity profile, the vortex
ring is enlarged in the dilated LV and extended axially towards the side wall of the

42
ventricle (Baccani et al., 2002b; Garcia et al., 1998). As a result, the vortex ring is not
able to reach the end of the apex to wash out the apical stagnant flow, leading to an
increase in the risk of thrombus formation at the apex. Conversely, simulation study
using a parabolic inlet velocity profile yields a deviated vortex pattern compared to that
observed clinically, where the incoming flow travels straight down to the end of the
apex with higher vortex strength.
The difference in the vortex formation pattern and vortex strength using the two
different spatial inlet velocity profiles can be explained through the use of the kinetic
energy factor, α (Cengel & Cimbala, 2006), i.e. the ratio of the actual kinetic energy.
With identical average inflow rate, parabolic flow stream travels with a maximum
velocity (2 m/s, at the middle of the LV) of about twice that of the uniform flow stream
(1 m/s), although both velocity profiles have comparable average velocity. In a laminar
flow condition, the kinetic energy factor, which is associated with the spatial velocity
profile, is extremely important because it affects the kinetic energy and the velocity of
the flow stream. The parabolic inlet velocity profile produces a kinetic energy factor
which is two-fold higher compared to that using the uniform inlet velocity profile.
The vortex evolution pattern acts as an important cardiac health assessment
because it reveals the risk of apical thrombosis in the dilated (Maze et al., 1989).
Several studies have been carried out to investigate the effect of the intra-ventricular
vortex flow pattern on the normal (Baccani et al., 2002a; Vierendeels et al., 2000) and
the diseased ventricles (Baccani et al., 2002b; Domenichini & Pedrizzetti, 2011;
Pasipoularides et al., 2003), using echocardiography (D'cruz & Sharaf, 1991) and

43
magnetic resonance imaging (Schenkel et al., 2008) as validation tools. In a normal
ventricle, the incoming flow is redirected towards the base by the higher pressure at the
downstream, thus forming a vortex ring attaching to the mitral edge. During
deceleration of the E-wave, this vortex ring is detached from the mitral edge and moves
freely towards the apex region with a high vortex strength. As a result, the vortex ring is
able to reach the end of the LV apex during the filling phase (Baccani et al., 2002b;
Vierendeels et al., 2000). On the contrary, the vortex movement is restricted in a DCM
ventricle due to a longer period of vortex attachment at the mitral edge. The DCM
ventricle produces a lower vortex strength which is insufficient to propagate the vortical
flow towards the bottom of the LV (Chan et al., 2012).
In short, by comparing to parabolic velocity profile, the uniform velocity profile
demonstrated vortex evolution process which strongly agreed with published studies as
mentioned above. Hence the uniform velocity profile was confirmed and selected as
boundary condition in the simulation of DCM conditions.
5.2. Comparison between geometry-prescribed and FSI method
By using prescribed geometry approach, the vortex formation and movement
patterns in the simulations generally agreed with that shown in the published literature
(Baccani et al., 2002b; Cheng et al., 2005). Generally, the results obtained from the FSI
implementation show a good agreement with the geometry-prescribed approach. The
vorticity result generally agrees with data from published simulations (Loerakker et al.,
2008) and experimental results (Hong et al., 2008), which provided quantitative vortex

44
measurements. The vorticity magnitude shown in Figure 4.5 was contributed by both the
primary (peak of E wave) and secondary vortices (peak of A wave), as well as the
growing boundary layer. A high vorticity magnitude helps the propagation of the vortex
ring towards the apex. Due to the weaker vortex strength in a more dilated ventricle, the
vortex ring is propelled towards the apex by weaker convective acceleration and thus has
less energy. As a result, vortex washout is reduced, leading to the stagnation of the apical
flow region. In an experimental study, Maze et al. (1989) reported that thrombus
formation was commonly found in dilated ventricles associated with cardiomyopathy.
Compared to the geometry-prescribed method, FSI approach provides additional
parameters such as myocardial displacement and wall stress, which serve as useful
prognostic determinants of heart disease. An increase in wall stress increases the risk for
arrhythmia and energy metabolism, which forces the dilated ventricle to work even
harder. The wall movement depends on the wall properties and the fluid force exerted
on it. The wall displacement and velocity were significantly reduced by ventricular
dilatation at the same inflow volume and wall properties. The decreasing wall velocity
indicated loss of elastic recoil energy which contribute to impaired diastolic suction and
contractile function for blood ejection during systole (Sonnenblick, 1980; Yotti et al.,
2005). By comparing CFD implementation method, FSI method is chosen for this DCM
study because of equally important roles of both blood flow and myocardial wall
mechanics in the DCM defects.

45
5.3. Simulation of normal, IDCM, and ICM conditions
The abnormal flow pattern in diseased LV is often associated with thrombus
formation where flow stasis region promotes blood clot formation and contributes to
low Vp. Thrombus formation, particularly at the apical region of the LV, has frequently
been reported in patients with DCM (Falk et al., 1992). It is believed that this is
associated with low vortex intensity (Loerakker et al., 2008) and Vp (Baccani et al.,
2002b). During the filling phase, the formation of vortex ring aids in preserving the
kinetic energy of the incoming flow through fast rotating motion (Pasipoularides et al.,
2003) and induces blood exchange to prevent flow stagnation (Eriksson et al., 2012). As
the vortex ring rotates around its center of mass while translating from the base to the
apex, the total kinetic energy of the incoming blood flow is converted into rotational
and translational energy (Hanc & Taylor, 2004). The translational energy allows
penetration of the vortex ring to the stagnant flow region at the apex, while blood
mixing is enhanced by the rotational energy.
Despite the importance of vortex on intraventricular flow dynamics, not many
studies have quantitatively analyzed vortex-related parameters in a LV computational
model. While Loerakker et al. (2008) observed a decreased vortex area and vortex
intensity in a computational model of LV with DCM, opposite results were obtained by
Baccani et al. (2002b) which used the same filling velocity for both normal and DCM
conditions. The above contradictory result can be explained by the current study, which
shows that filling velocity is the prime determinant of vortex intensity due to its close
relationship with kinetic energy. On the other hand, an increase in the LV size as in
(Baccani et al., 2002b) causes an increase in the vortex area and a minor increase in the

46
vortex intensity, due to a larger space for growth of the vortex ring. Although it was
observed lower vortex intensity in the normal LV in the simulation results when
compared to DCM with a restrictive filling pattern, stronger vorticity field and thus
higher average vorticity is obtained in the normal LV, due to a larger vortex-LV relative
area. Furthermore, as the vortex approaches the compliant LV wall, it induces a
substantial perturbation in the pressure field near the wall which causes a significant
deformation of the wall (Alben, 2011), thereby preventing flow stagnation.
With the availability of myocardial deformation imaging technology, diastolic
strain rate, which characterizes the speed of myocardial deformation during the diastolic
phase, has become increasingly popular for the assessment of diastolic function (active
relaxation) (Zeng et al., 2009) as well as the identification of myocardial infarct size and
location (Zhang et al., 2005). The simulation results agree with the published literature
(Duan et al., 2012; Park et al., 2006), which reported reduced longitudinal and
circumferential diastolic strain rates in patients with DCM. A decrease in the diastolic
strain rate leads to impaired filling efficiency and potentially reduces the contraction
force during ejection. Since myocardial deformation (LV expansion) is directly related
to the filling velocity, peak E-wave velocity contributes the most to strain rates in all
directions as compared to other factors. This is in agreement with clinical findings,
which reported that strain rate measurements are significantly dependent on preload
(Voigt et al., 2002). A major advantage of the diastolic strain rate over filling velocity in
the assessment of diastolic function is its ability to describe regional myocardial
function. The simulation results showed that strain rate along the infarcted region (apex)
of the myocardial wall is substantially lower than other regions of the wall. This is in

47
agreement with clinical findings (Pislaru et al., 2004), which reported significant
correlation between early strain rate and regional stiffness, and proposed that segmental
diastolic strain rate can indicate the presence and extent of regional ischemia (Hung et
al., 2008).
5.4. Sensitivity analysis
While Vp has been proven to be a relatively preload-independent index of
diastolic function through various clinical studies (Garcia et al., 1998), its value is still
debated in patients with hypertrophic (Buakhamsri et al., 2009) and restrictive DCM
(Garcia et al., 1996). The current study reveals that Vp is substantially (30%) decreased
by a twofold increase in wall stiffness, thus it forms a useful index for passive chamber
compliance. This agrees with De Boeck et al. (2005), who suggested that an increase in
wall stiffness lead to an increase in pressure wave propagation velocity (principle of
acoustic conduction) which in turn slows down the propagation of the velocity wave.
On the other hand, a decrease in LV size (ESV) causes an increase in Vp, as it provides
a narrow path which directs the propagation of flow velocity downwards. The results
may explain the high Vp values obtained in patients with hypertrophic LV. With regards
to the effect of preload on Vp, the results showed a positive correlation between peak E-
wave velocity and Vp. Upon closer investigation, it was found that Vp increases
exponentially with peak E-wave velocity, i.e. an increase in peak E-wave velocity
causes a minor increase in Vp at low values, but significantly increases Vp at high
velocity. Consequently, preload-independency may be weakened in patients with high
E-wave velocity.

48
Generation of sufficient IVPD improves the efficiency of early diastolic LV
filling (Yotti et al., 2005). Extensive studies have reported that the prime determinant of
early peak IVPD is elastic recoil and myocardial relaxation rate (Firstenberg et al.,
2001). In the present study, it was found that early peak IVPD coincides with peak
acceleration of the E-wave in all cases, with its magnitude correlates positively with the
rate of change of the filling velocity, which is in turn dependent on the myocardial
relaxation rate in a real clinical setting. On the other hand, an increase in ESV decreases
peak early IVPD. The results is in agreement with Yotti et al. (2005), who proposed that
early peak IVPD is influenced mainly by inertial acceleration (rate of change of the
filling velocity) and convective deceleration which depends on the ventriculo:annular
disproportion.
With regards to EDP and vMS, the simulation results showed that both
parameters are substantially raised in the DCM conditions, mostly due to an increase in
wall stiffness. An increase in ESV and SI, which is associated with adverse ventricular
remodelling process, causes opposite effects on EDP and vMS, with the former
decreases EDP and vMS while the latter causes an increase in both EDP and vMS. High
stress is found near the border zone between the ischemic and the non-ischemic region,
as observed by Jackson et al. (2003), and it is believed that this may further worsen the
myocardial function around the region (Jackson et al., 2003).

49
Chapter 6. CONCLUSION
6.0. Conclusion
When blood enters the LV from the mitral valve, the change of the geometrical
dimensions and the short mitral valve length disables the laminar blood flow to be fully
developed into a parabolic profile. As a result, incoming blood enters the LV with a
uniform velocity profile during the filling phase. It is shown from the current study that
the transmitral velocity profile significantly affects the intra-ventricular vortex flow
pattern. The resulting vortex evolution pattern using the uniform inlet velocity profile
agreed with that reported in the literature, which revealed an increase in thrombus risk
in a ventricle with DCM. On the other contrary, the application of a parabolic velocity
profile at the inlet yields a deviated vortical flow pattern and overestimates the
propagation velocity of the vortex ring towards the apex of the ventricle. The present
work confirmed that the transmitral spatial velocity profile appears in uniform velocity
profile rather than parabolic velocity profile.
The effects of geometrical modification in a ventricle on the intraventricular
flow distributions were simulated using two different models, i.e. the geometry-
prescribed and FSI method. Although similar simulation results were obtained from the
two methods, FSI approach provides additional information such as wall stress and
strain, which are important predictors of ventricular function. Moreover, cardiac
diseases can be more easily and realistically modelled using the FSI method compared
to the geometry-prescribed method, which may involve more complicated equations and
50
assumptions that often results in convergence problem. As such, FSI implementation
was selected for further simulation study of DCM disease.
A 2D axisymmetrical FSI model of a LV under normal and DCM conditions
(IDCM and ICM) have been presented in this work, and the effect of DCM on
intraventricular fluid dynamics and myocardial wall mechanics were investigated.
Intraventricular flow dynamics and myocardial wall deformation are significantly
impaired in the DCM conditions, with low vortex intensity, Vp, IVPD and strain rates,
but high EDP and wall stress.
The sensitivity analysis results show that Vp substantially decreases with an
increase in wall stiffness, and is relatively independent of preload at low peak E-wave
velocity. Early IVPD is influenced mainly by the rate of change of early filling velocity
and ESV which changes ventriculo:annular disproportion. Regional strain rate, on the
other hand, is significantly correlated with regional stiffness, and therefore forms a
useful indicator for myocardial regional ischemia. The present work forms an important
framework for the investigation of mechanisms leading to observable changes in
patients with DCM which is important for the clinical management of these patients.
6.1. Limitation and recommendation for future works
There are several limitations in the current study which requires further
improvements. During LV filling simulation, the implementation of fixed constraint at
the basal location of the FSI boundary causes exceptionally high stress around that point
51
as the wall movement was restricted at the constrained boundary. This may result in an
inaccurate stress analysis at the basal region, especially near the constrained site thus
instant improvement is needed to sort out this limitation.
The use of axisymmetrical model in this study may affect the pathway of blood
flow and vortex propagation as well. It is suggested that an asymmetrical LV geometry
or patient specific model should be incorporated in future studies. Aside from
interaction between blood and heart muscle, an integration of electrophysiology model
present a more complete computational heart model. Furthermore, the integration with
other heart chambers, such as left atrium and right ventricle, provides the full pathway
of cardiac blood flow and produce a more precise interaction analysis.
In this study, the mitral valve was modelled as an opening orifice and non-
moving structure, which should be further developed into a moving structure.
Additionally, incorporation of myocardial fiber in the LV wall is suggested to be
developed, in order to produce a more realistic regional strain and stress distributions
along the LV wall.

52
REFERENCES
Alben, S. (2011). Interactions between vortices and flexible walls. International Journal
of Non-Linear Mechanics, 46(4), 586-591.
Altbach, M. I., Squire, S. W., Kudithipudi, V., Castellano, L., & Sorrell, V. L. (2007).
Cardiac MRI is complementary to echocardiography in the assessment of
cardiac masses. Echocardiography, 24(3), 286-300.
Amano, Y., Takayama, M., Amano, M., & Kumazaki, T. (2004). MRI of cardiac
morphology and function after percutaneous transluminal septal myocardial
ablation for hypertrophic obstructive cardiomyopathy. American Journal of
Roentgenology, 182(2), 523-527.
Augenstein, K. F., McVeigh, E. R., & Young, A. A. (2001). Magnetic resonance
imaging and ventricle mechanics. Philosophical Transactions of the Royal
Society of London A, 359, 1263-1275.
Baccani, B., Domenichini, F., Pedrizzetti, G., & Dirk L., B. (2002a). Vortex dynamics
in a model left ventricle during filling. European Journal of Mechanics
B/Fluids, 21, 527-543.
Baccani, B., Domenichini, F., Pedrizzetti, G., & Tonti, G. (2002b). Fluid dynamics of
the left ventricular filling in dilated cardiomyopathy. Journal of Biomechanics,
35, 665-671.
Buakhamsri, A., Popović, Z. B., Lin, J., Lim, P., Greenberg, N. L., Borowski, A. G.,
Tang, W. H. W., Klein, A. L., Lever, H. M., Desai, M. Y., & Thomas, J. D.
(2009). Impact of left ventricular volume/mass ratio on diastolic function.
European Heart Journal, 30(10), 1213-1221.
Cengel, Y. A., & Cimbala, J. M. . (2006). Fluid Mechanics: Fundamentals and
Applications. New York: McGraw-Hill Education
Chan, B. T., Ong, C. W., Lim, E., Abu Osman, N. A., Al Abed, A., Lovell, N. H., &
Dokos, S. (2012). Simulation of left ventricle flow dynamics with dilated
cardiomyopathy during the filling phase. Paper presented at the Engineering in
Medicine and Biology Society (EMBC), 2012 Annual International Conference
of the IEEE.
Cheng, Y. G., Oertel, H., & Schenkel, T. (2005). Fluid-Structure Coupled CFD
Simulation of the Left Ventrivular Flow During Filling Phase. Annals of
Biomedical Engineering, 33(5), 567-576.

53
D'cruz, I. A. , & Sharaf, I. S. (1991). Patterns of flow within the dilated
cardiomyopathic left ventricle: color Flow foppler observations.
Echocardiography, 8(2), 227-231.
Dahm, J. B., Hummel, A., Kuon, E., Voelzke, H., & Vogelgesang, D. (2002). Doppler
echocardiography in dilated cardiomyopathy: diastolic and combined
systolic/diastolic parameters offer more detailed Information on left ventricular
global dysfunction than systolic parameters. Journal of Clinical and Basic
Cardiology, 5(2), 189-192.
del Alamo, J. C. (2009). Recent advances in the application of computational mechanics
to the diagnosis and treatment of cardiovascular disease. Revista Española de
Cardiología, 62(7), 781-805.
Discacciati, M., & Quarteroni, A. (2009). Navier-Stokes/Darcy coupling: modeling,
analysis, and numerical approximation. Revista Matemática Complutense, 22(2),
315-426.
Doenst, T., Spiegel, K., Reik, M., Markl, M., Hennig, J., Nitzsche, S., Beyersdorf, F., &
Oertel, H. (2009). Fluid-Dynamic Modeling of the Human Left Ventricle:
methodology and application to surgical ventricular reconstruction. Annals of
Thoracics Surgery, 87.
Domenichini, F., & Pedrizzetti, G. (2011). Intraventricular vortex flow changes in the
infarcted left ventricle: numerical results in an idealised 3D shape. Computer
Methods in Biomechanics and Biomedical Engineering, 14(1), 95-101.
Domenichini, F., Pedrizzetti, G., & Baccani, B. (2009). Three-dimensional filling flow
into a model left ventricle. Journal of Fluid Mechanics, 539, 179-198.
Donal, E., De Place, C., Kervio, G., Bauer, F., Gervais, R., Leclercq, C., Mabo, P., &
Daubert, J. C. (2009). Mitral regurgitation in dilated cardiomyopathy: value of
both regional left ventricular contractility and dyssynchrony. European Journal
of Echocardiography, 10, 133-138.
Douglas, P. S., Morrow, R., Ioli, A., & Reichek, N. (1989). Left ventricular shape,
afterload and survival in idiopathic dilated cardiomyopathy. Journal of the
American College of Cardiology, 13(2), 311-315.
Duan, F. X., Xie, M. X., Wang, X. F. , Li, Y. M., He, L., Jiang, L., & Fu, Q. (2012).
Preliminary clinical study of left ventricular myocardial strain in patients with
non-ischemic dilated cardiomyopathy by three-dimensional speckle tracking
imaging. Cardiovascular Ultrasound, 10(1), 8.

54
Eriksson, J., Bolger, A. F., Ebbers, T., & Carlhäll, C. (2012). Four-dimensional blood
flow-specific markers of LV dysfunction in dilated cardiomyopathy. European
Heart Journal – Cardiovascular Imaging. doi: 10.1093/ehjci/jes159
Falk, R. H., Foster, E., & Coats, M. H. (1992). Ventricular thrombi and
thromboembolism in dilated cardiomyopathy: a prospective follow-up study.
American Heart Journal, 123(1), 136-142.
Feintuch, A., Ruengsakulrach, P., Lin, A., Zhang, J., Zhou, Y. Q., Bishop, J., Davidson,
L., Courtman, D., Foster, F. S., Steinman, D. A., Henkelman, R. M., & Ethier,
C. R. (2007). Hemodynamics in the mouse aortic arch as assessed by MRI,
ultrasound, and numerical modeling American Journal of Physiology, 292(2),
H884-H892.
Firstenberg, M. S., Smedira, N. G., Greenberg, N. L., Prior, D. L., McCarthy, P. M.,
Garcia, M. J., & Thomas, D. J. (2001). Relationship between early diastolic
intraventricualr pressure gradients, an index of elastic recoil, and improvements
in systolic and diastolic function. Circulation, 104(suppI I), I-330-335.
Garcia, M. J., Rodriguez, L., Ares, M., Griffin, B. P., Thomas, J. D., & Klein, A. L.
(1996). Differentiation of constrictive pericarditis from restrictive
cardiomyopathy: assessment of left ventricular diastolic velocities in
longitudinal axis by doppler tissue imaging. Journal of the American College of
Cardiology, 27(1), 108-114.
Garcia, M. J., Thomas, J. D., & Klein, A. L. . (1998). New doppler echocardiograhpy
applications for the study of diastolic function. Journal of the American College
of Cardiology, 32, p. 865-875.
Ge, L., & Ratcliffe, M. (2009). The use of computational flow modeling (CFD) to
determine the effect of left ventricular shape on blood flow in the left ventricle.
The Annals of Thoracic Surgery, 87, 993-994.
Gjesdal, O., Helle-Valle, T., Hopp, E., Lunde, K., Vartdal, T., Aakhus, S., Smith, H. J.,
Ihlen, H., & Edvardsen, T. (2008). Noninvasive separation of large, medium,
and small myocardial infarcts in survivors of reperfused ST-elevation
myocardial infarction: a comprehensive tissue doppler and speckle-tracking
echocardiography study. Circulation. Cardiovascular imaging, 1(3), 189.
Gunja-Smith, Z., Morales, A. R., Romanelli, R., & Woessner, J. F. (1996). Remodeling
of human myocardial collagen in idiopathic dilated cardiomyopathy. Role of
metalloproteinases and pyridinoline cross-links (Vol. 148, pp. 1639-1648).
Hanc, J., & Taylor, E.F. (2004). From conservation of energy to the principle of least
action: A story line. American Journal of Physics, 72, 514-521.

55
Hayashida, W., Kumada, T., Nohara, R., Tanio, H., Kambayashi, M., Ishikawa, N.,
Nakamura, Y., Himura, Y., & Kawai, C. (1990). Left ventricular regional wall
stress in dilated cardiomyopathy. Circulation, 82(6), 2075-2083.
Hong, G. R., Pedrizzetti, G., Tonti, G., Li, P., Wei, Z., Kim, J. K., Baweja, A., Liu, S.,
Chung, N., Houle, H., Narula, J., & Vannan, M. A. (2008). Characterization and
quantification of vortex flow in the human left ventricle by contrast
echocardiography using vector particle image velocimetry. Journal of the
American College of Cardiology, 1(6), 705-717.
Humphrey, J. D., Strumf, R. K., & Yin, F. C. P. . (1990). Determination of a
constitutive relation for passive myocardium: II. Parameter estimation. Journal
of Biomechanical Engineering, 112, 340-346.
Hung, C. L., Lo, C. I., Yen, C. H., Hung, T. C., Hou, C. J., Yeh, H. I., & Tsai, C. H.
(2008). Pattern and impact of altered regional myocardial excursion on global
ventricular performance after first-time acute anterior wall myocardial infarction
by real-time three-dimensional echocardiography. International Journal of
Gerontology, 2(4), 196-205.
Imai, H., Kumai, T., Sekiya, M., Kobayashi, S., Sakakibara, M., Imazeki, Y., Watanabe,
S., Masuda, Y., & Inagaki, Y. (1992). Left ventricular trabeculae evaluated with
MRI in dilated cardiomyopathy and old myocardial infarction. Journal of
Cardiology, 22(1), 83-90.
Jackson, B. M., Gorman, J. H., Salgo, I. S., Moainie, S. L., Plappert, Th., St. John-
Sutton, M. G., Edmunds, L. H., & Gorman, R. C. (2003). Border zone geometry
increases wall stress after myocardial infarction: contrast echocardiographic
assessment. American Journal of Physiology - Heart and Circulatory
Physiology, 284(2), H475-H479.
Jefferies, J. L., & Towbin, J. A. (2010). Dilated cardiomyopathy. Lancet, 375(9716),
752-762.
Khalafvand, S. S., Ng, E. Y. K., & Zhong, L. (2011). CFD simulation of flow through
heart: a perspective review. Computer Methods in Biomechanics and Biomedical
Engineering, 14(01), 113-132.
Kirkpatrick, J. N., & Lang, R. M. (2008). Insights into myocardial mechanics in normal
and pathologic states using newer echocardiographic techniques. Current Heart
Failure Reports, 5(3).
Krittian, S., Janoske, U., Oertel, H., & Bohlke, T. (2010). Partitioned fluid-solid
coupling for cardiovascular blood flow. Annals of Biomedical Engineering,
38(4), 1426-1441.

56
Lemmon, J. D, & Yoganathan, A. P. (2000). Three-Dimensional Computational Model
of Left Heart Diastolic Function With Fluid-Structure Interaction. Journal of
Biomechanical Engineering, 122, 109-117.
Lin, D. H., & Yin, F. C. (1998). A multiaxial constitutive law for mammalian left
ventricular myocardium in steady-state barium contracture or tetanus. Journal of
biomechanical engineering, 120(4), 504-517.
Loerakker, S., Cox, L.G.E., van Heijst, G.J.F., de Mol, B.A.J.M., & van de Vosse, F.N.
. (2008). Influence of dilated cardiomyopathy and a left ventricular assist device
on vortex dynamics in the left ventricle. Computer Methods in Biomechanics
and Biomedical Engineering, 11(6), 649-660.
Long, Q, Merrifield, R, Xu, XY, Kilner, P, Firmin, DN, & Yang, GZ. (2008). Subject-
specific computational simulation of left ventricular flow based on magnetic
resonance imaging. Proceedings of the Institution of Mechanical Engineers,
Part H: Journal of Engineering in Medicine, 222(4), 475-485.
MacGowan, G. A., Shapiro, E. P., Azhari, H., Siu, C. O., Hees, P. S., Hutchins, G. M.,
Weiss, J. L., & Rademakers, F. E. (1997). Noninvasive measurement of
shortening in the fiber and cross-fiber directions in the normal human left
ventricle and in idiopathic dilated cardiomyopathy. Circulation, 96(2), 535-541.
doi: 10.1161/01.cir.96.2.535
Maze, S. S., Kotler, M. N., & Parry, W. R. (1989). Flow characteristics in the dilated
left ventricle with thrombus: qualitative and quantitative doppler analysis.
Journal of the American College of Cardiology, 13(4), 873-881.
Nanduri, J. R., Pino-Romainville, F. A., & Celik, I. (2009). CFD mesh generation for
biological flows: geometry reconstruction using diagnostic images. Computers
& Fluids, 38, 1026-1032.
Narayana, K. V. L. (2011). Wavelet based QRS detection in ECG using MATLAB
Innovative Systems Design and Engineering 2(7), 60-69.
Nishimura, R. A., & Tajik, A. J. (1997). Evaluation of diastolic filling of left ventricle
in health and disease: doppler echocardiography is the clinician’s rosetta stone.
Journal of the American College of Cardiology, 30(1), 8-18.
Nordsletten, D., McCormick, M., Kilner, P. J., Hunter, P., Kay, D., & Smith, N. P.
(2011). Fluid-solid coupling for the investigation of diastolic and systolic human
left ventricular function. International Journal for Numerical Methods in
Biomedical Engineering, 27, 1017-1039.
57
Ogden, R. W., Saccomandi, G., & Sgura, I. (2004). Fitting hyperelastic models to
experimental data. Computational Mechanics. doi: 10.1007/s00466-004-0593-y
Ohno, M, Cheng, C P, & Little, W C. (1994). Mechanism of altered patterns of left
ventricular filling during the development of congestive heart failure.
Circulation, 89(5), 2241-2250. doi: 10.1161/01.cir.89.5.2241
Park, T. H., Nagueh, S. F., Khoury, D. S., Kopelen, H. A., Akrivakis, S., Nasser, K.,
Ren, G. F., & Frangogiannis, N. G. (2006). Impact of myocardial structure and
function postinfarction on diastolic strain measurements: implications for
assessment of myocardial viability. American Journal of Physiology - Heart and
Circulatory Physiology, 290(2), H724-H731. doi: 10.1152/ajpheart.00714.2005
Parodi, O., De Maria, R., Oltrona, L., Testa, R., Sambuceti, G., Roghi, A., Merli, M.,
Belingheri, L., Accinni, R., & Spinelli, F. (1993). Myocardial blood flow
distribution in patients with ischemic heart disease or dilated cardiomyopathy
undergoing heart transplantation. Circulation, 88(2), 509-522.
Pasipoularides, A., Shu, M., Shah, A., Womack, M. S., & Glower, D. D. (2003).
Diastolic right ventricular filling vortex in normal and volume overload states.
American Journal of Physiology - Heart and Circulatory Physiology, 284,
H1064-H1072.
Patterson, S. W., Piper, H., & Starling, E. H. (1914). The regulation of the heartbeat. J
Physiol, 48, 357-379.
Persson, H., Linder-Klingsell, E., Eriksson, S. V., & Erhardt, L. (1995). Heart failure
after myocardial infarction: the importance of diastolic dysfunction: A
prospective clinical and echocardiographic study. European Heart Journal,
16(4), 496-505.
Pislaru, C., Bruce, C. J., Anagnostopoulos, P. C., Allen, J. L., Seward, J. B., Pellikka, P.
A., Ritman, E. L., & Greenleaf, J. F. (2004). Ultrasound strain imaging of
altered myocardial stiffness. Circulation, 109(23), 2905-2910.
Plein, S., Smith, W.H.T., Ridgway, J.P., Kassner, A., Beacock, D.J., Bloomer, T.N., &
Sivananthan, M.U. (2001). Qualitative and quantitative analysis of regional left
ventricular wall dynamics using real‐time magnetic resonance imaging:
comparison with conventional breath‐hold gradient echo acquisition in
volunteers and patients. Journal of Magnetic Resonance Imaging, 14(1), 23-30.
Rihal, C. S., Nishimura, R. A., Hatle, L. K., Bailey, K. R., & Tajik, A. J. (1994).
Systolic and diastolic dysfunction in patients with clinical diagnosis of dilated
cardiomyopathy relation to symptoms and prognosis. Circulation, 90(6), 2772-
2778.

58
Rodriguez, L., Garcia, M., Ares, M., Griffin, B.P., Nakatani, S., & Thomas, J.D. (1996).
Assessment of mitral annular dynamics during diastole by doppler tissue
imaging: comparison with mitral doppler inflow in subjects without heart
disease and in patients with left ventricular hypertrophy. American Heart
Journal, 131(5), 982-987.
Rosen, A., Inouye, G. T., Morse, A. L., & Judge, D. L. (1979). Magnetic recordings of
the heart's electrical activity with a cryogenic magnetometer Journal of Applied
Physics, 42.
Saber, N. R., Gosman, A. D., Wood, N. B., Kilner, P. J., Charrier, C. L., & Firmin, D.
N. (2001). Computational flow modeling of the left ventricle based on in vivo
MRI data: initial experience. Annals of Biomedical Engineering, 29, 275-283.
Sarnoff, S. J., & Berglund, E. (1954). Ventricular function: Starling's law of the heart
studied by means of simultaneous right and left ventricular function curves in
the dog. Circulation, 9, 706-718.
Schenkel, T., Malve, M., Reik, M., Markl, M., Jung, B., & Oertel, H. (2008). MRI-
based CFD analysis of flow in a human left ventricle methodology and
application to a healthy heart. Annals of Biomedical Engineering, 37(3), 503-
515.
Somauroo, J., Pyatt, J., Jackson, M., Perry, R., & Ramsdale, D. (2001). An
echocardiographic assessment of cardiac morphology and common ECG
findings in teenage professional soccer players: reference ranges for use in
screening. Heart 85(6), 649-654.
Sonnenblick, E. H. (1980). The structural basis and importance of restoring forces and
elastic recoil for the filling of the heart. European Heart Journal, 1(Supplement
A), 107-110.
Starling, E. H., & Visscher, M. B. (1926). The regulation of the energy output of the
heart. J Physiol, 62, 243-261.
Støylen, A., Slørdahl, S., Skjelvan, G. K., Heimdal, A., & Skjaerpe, T. (2001). Strain
rate imaging in normal and reduced diastolic function: comparison with pulsed
doppler tissue imaging of the mitral annulus. Journal of the American Society of
Echocardiography : official publication of the American Society of
Echocardiography, 14(4), 264-274.
Taylor, C., & Draney, M. (2004). Experimental and computational methods in
cardiovascular fluid mechanics Annual Review of Fluid Mechanics, 36, 197-231.

59
Thomas, D.E., Wheeler, R., Yousef, Z. R., & Masani, N. D. (2009). The role of
echocardiography in guiding management in dilated cardiomyopathy. European
Heart Journal, 10(8), p.iii15-iii21.
Thomas, J. D., & Popovic, Z. B. (2006). Assessment of left ventricular function by
cardiac ultrasound. Journal of the American College of Cardiology, 48(10),
2012-2025.
Tibayan, F. A., Lai, D. T. M., Timek, T. A., Dagum, P., Liang, D., Zasio, M. K.,
Daughters, G. T., Miller, D. C., & Ingels, N. B. (2003). Alterations in left
ventricular curvature and principal strains in dilated cardiomyopathy with
functional mitral regurgitant. The ICR Journal of Heart Valve Disease, 12, 292-
299.
Tulner, S. A. F., Steendijk, P., Klautz, R. J. M., Bax, J. J., Schalij, M. J., van der Wall,
E. E., & Dion, R. A. E. (2006). Surgical ventricular restoration in patients with
ischemic dilated cardiomyopathy: evaluation of systolic and diastolic ventricular
function, wall stress, dyssynchrony, and mechanical efficiency by pressure-
volume loops. The Journal of Thoracic and Cardiovascular Surgery, 132(3),
610-620.
Veress, A.I., Gullberg, G.T., & Weiss, J.A. (2005). Measurement of strain in the left
ventricle during diastole with cine-MRI and deformable image registration.
Journal of Biomechanical Engineering, 127(LBNL--54632).
Vierendeels, J. A., Riemslagh, K., & Dick, E. (2000). Computer simulation of
intraventricular flow and pressure gradients during diastole. Journal of
Biomechanical Engineering, 122, 667-674.
Voigt, J.U., Lindenmeier, G., Werner, D., Flachskampf, F.A., Nixdorff, U., Hatle, L.,
Sutherland, G.R., & Daniel, W.G. (2002). Strain rate imaging for the assessment
of preload-dependent changes in regional left ventricular diastolic longitudinal
function. Journal of the American Society of Echocardiography, 15(1), 13-19.
Wang, J. W., Khoury, D. S., Thohan, V., Torre-Amione, G., & Nagueh, S. F. (2007).
Global diastolic strain rate for the assessment of left ventricular relaxation and
filling pressures. Circulation, 115(11), 1376-1383.
Watanabe, H., Hisada, T., Sugiura, S., Okada, J., & Fukunari, H. (2002). Computer
simulation of blood flow, left ventricular wall motion and their interrelationship
by fluid-structure interaction finite element method. JSME International
Journal, 45(4), 1003-1011.

60
Watanabe, H., Sugano, T., Sugiura, S., & Hisada, T. (2004a). Finite element analysis of
ventricular wall motion and intra-ventricular blood flow in heart with
myocardial infarction. JSME International Journal Series C, 47(4), 1019-1026.
Watanabe, H., Sugiura, S., Kafuku, H., & Hisada, T. (2004b). Multiphysics simulation
of left ventricular filling dynamics using fluid-structure interaction fnite element
method. Biophysical Journal 87, 2074-2085.
Yotti, R., Bermejo, J., Antoranz, J. C., Desco, M. M., Cortina, C., Rojo-Alvarez, J. L.,
Allue, C., Martin, L., Moreno, M., Serrano, J. A., Munoz, R., & Garcia-
Fernandez, M. A. (2005). A noninvasive method for assessing impaired diastolic
suction in patients with dilated cardiomyopathy. Circulation, 112, 2921-2929.
Zeng, S., Zhou, Q. C., Peng, Q. H., Cao, D. M., Tian, L. Q., Ao, K., & Liang, X. (2009).
Assessment of regional myocardial function in patients with dilated
cardiomyopathy by velocity vector imaging. Echocardiography, 26(2), 163-170.
Zhang, Y., Chan, A. K. Y., Yu, C. M., Yip, G. W. K., Fung, J. W. H., Lam, W. W. M.,
So, N. M. C., Wang, M., Wu, E. B., Wong, J. T., & Sanderson, J. E. (2005).
Strain rate imaging differentiates transmural from non-transmural myocardial
infarction: a validation study using delayed-enhancement magnetic resonance
imaging. Journal of the American College of Cardiology, 46(5), 864-871.
Zhong, L., Su, Y., Yeo, S. Y., Tan, R. S., Ghista, D. N., & Kassab, G. (2009). Left
ventricular regional wall curvedness and wall stress in patients with ischemic
dilated cardiomyopathy. American Journal of Physiology - Heart and
Circulatory Physiology, 296(3), H573-H584.
Zipes, D. P., & Wellens, H. J. J. (1998). Sudden cardiac death. Circulation, 98(21),
2334-2351.
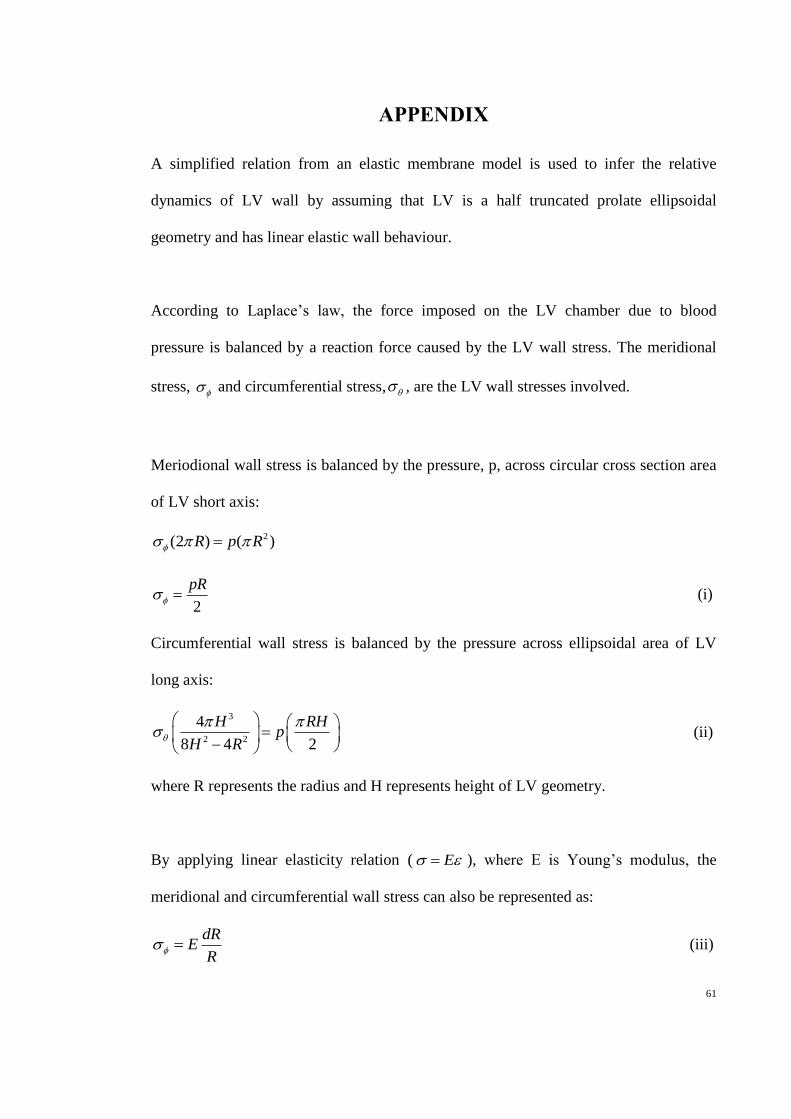
61
APPENDIX
A simplified relation from an elastic membrane model is used to infer the relative
dynamics of LV wall by assuming that LV is a half truncated prolate ellipsoidal
geometry and has linear elastic wall behaviour.
According to Laplace’s law, the force imposed on the LV chamber due to blood
pressure is balanced by a reaction force caused by the LV wall stress. The meridional
stress, and circumferential stress, , are the LV wall stresses involved.
Meriodional wall stress is balanced by the pressure, p, across circular cross section area
of LV short axis:
2(2 ) ( )R p R
2
pR (i)
Circumferential wall stress is balanced by the pressure across ellipsoidal area of LV
long axis:
3
2 2
4
8 4 2
H RHp
H R
(ii)
where R represents the radius and H represents height of LV geometry.
By applying linear elasticity relation ( E ), where E is Young’s modulus, the
meridional and circumferential wall stress can also be represented as:
dRE
R (iii)

62
dHE
H (iv)
Mathematically, substituting Equation (iv) into (iii), Equation (v) is obtained as:
2
2 2
4
8
dH H dR
H H D R
(v)
By differentiation, the relationship of rate changes of radius (dt
dR) and height (
dt
dH) are:
2
2 2
4
8 4
dH H H dR
dt R H R dt
(vi)
However, the independent equations of the rate change of radius and height are required
in the model application. The independent equations can be established through LV
volume equation by assuming LV is a half truncated prolate ellipsoidal geometry:
22
3V R H
(vii)
According to mass conservation law, blood inflow rate, Q(t), equals to the rate change
of LV volume:
22( ) 2
3
dV dH dRQ t R RH
dt dt dt
(viii)
After the mathematical substitution involving Equation (vi) into (viii), the independent
equations of the rate changes of LV radius and height are therefore obtained as:
2 2
3 3
3 ( ) 2
10 4
dR Q t H R
dt H R HR
Equation (3.3)
3 2 2
2 3 3 3
3 ( ) 2
2 10 4
dH Q t H H R
dt H R R H R HR
Equation (3.4)

63
PUBLICATONS
1. Chan, B. T., Lim, E., Chee, K. H., & Abu Osman, N. A. Review on CFD
simulation in heart with dilated cardiomyopathy and myocardial infarction.
(2013). Computers in Biology and Medicine, 43(4), 377-385. (ISI-cited
publication)
2. Chan, B. T., Lim, E., Ong, C. W., & Abu Osman, N. A. (2013). Effect of
Spatial Inlet Velocity Profiles on the Vortex Formation Pattern in a Dilated Left
Ventricle. Computer Methods in Biomechanics and Biomedical Engineering,
(ahead-of-print), 1-7. (ISI-cited publication)
3. Chan, B. T., Abu Osman, N. A., Lim, E., Chee, K. H., Abdul Aziz, Y. F., Al
Abed, A., Lovell, N. H., & Dokos, S. (2013). Sensitivity analysis of left
ventricle with dilated cardiomyopathy in fluid structure simulation. PloS One,
8(6), e67097. (ISI-cited publication)
4. Ong, C. W., Dokos, S., Chan, B. T., Lim, E., Al Abed, A., Abu Osman, N. A., &
Lovell, N. H. (2013). Numerical investigation of the effect of cannula placement
on thrombosis. Theoretical Biology and Medical Modelling, 10(1), 35. (ISI-cited
publication)
5. Chan, B. T., Ong, C. W., Lim, E., Abu Osman, N. A., Al Abed, A., Lovell, N.
H., & Dokos, S. (2012). Simulation of left ventricle flow dynamics with dilated
cardiomyopathy during the filling phase. Engineering in Medicine and Biology
Society (EMBC), 2012 Annual International Conference of the IEEE, 6289-6292.
IEEE.
6. Ong, C. W., Chan, B. T., Lim, E., Abu Osman, N. A., Al Abed, A., Dokos,
S., & Lovell, N. H. (2012). Fluid Structure Interaction Simulation of Left
Ventricular Flow Dynamics under Left Ventricular Assist Device Support.
Engineering in Medicine and Biology Society (EMBC), 2012 Annual
International Conference of the IEEE, 6293-6296. IEEE.


![EMH 222 – Fluid Dynamics [Dinamik Bendalir] · 2019. 11. 5. · EMH 222 – Fluid Dynamics [Dinamik Bendalir] Duration : 3 hours [Masa : 3 jam] Please check that this paper contains](https://static.fdocuments.in/doc/165x107/60e5330b1224a937e15bb88b/emh-222-a-fluid-dynamics-dinamik-bendalir-2019-11-5-emh-222-a-fluid-dynamics.jpg)