Flour Milling Template 4-5-2004
26
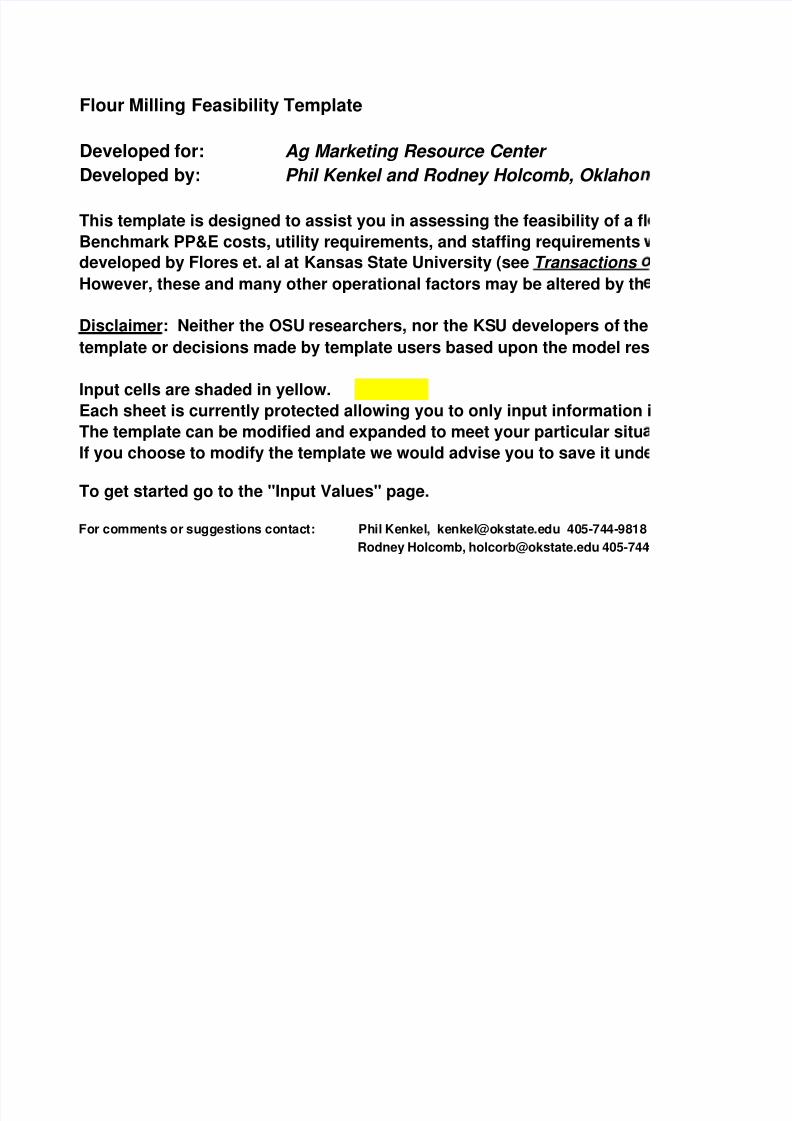
Flour Milling Feasibility Template Developed for: Ag Marketing Resource Center Developed by: Phil Kenkel and Rodney Holcomb, Oklaho This template is designed to assist you in assessing the feasibility of a fl Benchmark PP&E costs, utility requirements, and staffing requirements developed by Flores et. al at Kansas State University (see Transactions However, these and many other operational factors may be altered by th Disclaimer: Neither the OSU researchers, nor the KS U developers of the template or decisions made by template users based upon the model res Input cells are shaded in yellow. Each sheet is currently protected allowing you to only input information i The template can be modified and expanded to meet your particular situ If you choose to modify the template we would advise you to save it und To get started go to the "Input Values" page. For comments or suggesti ons cont act: Phil Kenkel, kenkel @okstate.edu 405- 744- 9818 Rodney Holcomb, [email protected] 405-744
-
Upload
marzuki-muhammad-nur -
Category
Documents
-
view
230 -
download
0
Transcript of Flour Milling Template 4-5-2004
8/3/2019 Flour Milling Template 4-5-2004
http://slidepdf.com/reader/full/flour-milling-template-4-5-2004 1/26
Flour Milling Feasibility Template
Developed for: Ag Marketing Resource Center
Developed by: Phil Kenkel and Rodney Holcomb, Oklaho
This template is designed to assist you in assessing the feasibility of a fl
Benchmark PP&E costs, utility requirements, and staffing requirements
developed by Flores et. al at Kansas State University (see Transactions
However, these and many other operational factors may be altered by th
Disclaimer: Neither the OSU researchers, nor the KSU developers of the
template or decisions made by template users based upon the model res
Input cells are shaded in yellow.Each sheet is currently protected allowing you to only input information i
The template can be modified and expanded to meet your particular situ
If you choose to modify the template we would advise you to save it und
To get started go to the "Input Values" page.
For comments or suggestions contact: Phil Kenkel, [email protected] 405-744-9818
Rodney Holcomb, [email protected] 405-744
8/3/2019 Flour Milling Template 4-5-2004
http://slidepdf.com/reader/full/flour-milling-template-4-5-2004 2/26
a State University
ur mill.
ere taken from the Mill Management Economic Model
f the ASAE vol. 36(4):1143-1149, July-August 1993).
users of this template.
MMEM, accept responsibility for the accuracy of this
ults.
n the input cells.
tion by turning off the protection.
r another name and retain the original for reference.
6272
8/3/2019 Flour Milling Template 4-5-2004
http://slidepdf.com/reader/full/flour-milling-template-4-5-2004 3/26
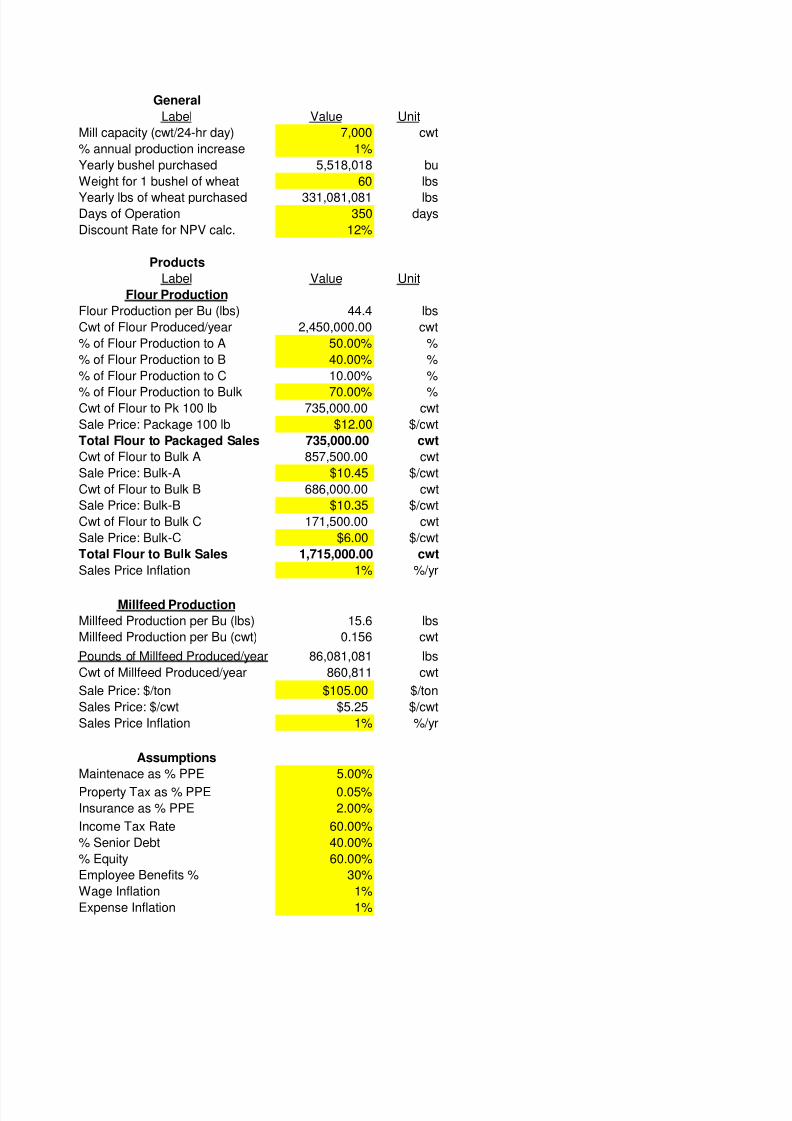
General
Label Value Unit
Mill capacity (cwt/24-hr day) 7,000 cwt
% annual production increase 1%
Yearly bushel purchased 5,518,018 bu
Weight for 1 bushel of wheat 60 lbs
Yearly lbs of wheat purchased 331,081,081 lbsDays of Operation 350 days
Discount Rate for NPV calc. 12%
Products
Label Value Unit
Flour Production
Flour Production per Bu (lbs) 44.4 lbs
Cwt of Flour Produced/year 2,450,000.00 cwt
% of Flour Production to A 50.00% %
% of Flour Production to B 40.00% %
% of Flour Production to C 10.00% %
% of Flour Production to Bulk 70.00% %Cwt of Flour to Pk 100 lb 735,000.00 cwt
Sale Price: Package 100 lb $12.00 $/cwt
Total Flour to Packaged Sales 735,000.00 cwt
Cwt of Flour to Bulk A 857,500.00 cwt
Sale Price: Bulk-A $10.45 $/cwt
Cwt of Flour to Bulk B 686,000.00 cwt
Sale Price: Bulk-B $10.35 $/cwt
Cwt of Flour to Bulk C 171,500.00 cwt
Sale Price: Bulk-C $6.00 $/cwt
Total Flour to Bulk Sales 1,715,000.00 cwt
Sales Price Inflation 1% %/yr
Millfeed Production
Millfeed Production per Bu (lbs) 15.6 lbs
Millfeed Production per Bu (cwt) 0.156 cwt
Pounds of Millfeed Produced/year 86,081,081 lbs
Cwt of Millfeed Produced/year 860,811 cwt
Sale Price: $/ton $105.00 $/ton
Sales Price: $/cwt $5.25 $/cwt
Sales Price Inflation 1% %/yr
Assumptions
Maintenace as % PPE 5.00%Property Tax as % PPE 0.05%
Insurance as % PPE 2.00%
Income Tax Rate 60.00%
% Senior Debt 40.00%
% Equity 60.00%
Employee Benefits % 30%
Wage Inflation 1%
Expense Inflation 1%

8/3/2019 Flour Milling Template 4-5-2004
http://slidepdf.com/reader/full/flour-milling-template-4-5-2004 4/26
Year 0 Start-up Expenses $1,000,000
8/3/2019 Flour Milling Template 4-5-2004
http://slidepdf.com/reader/full/flour-milling-template-4-5-2004 5/26
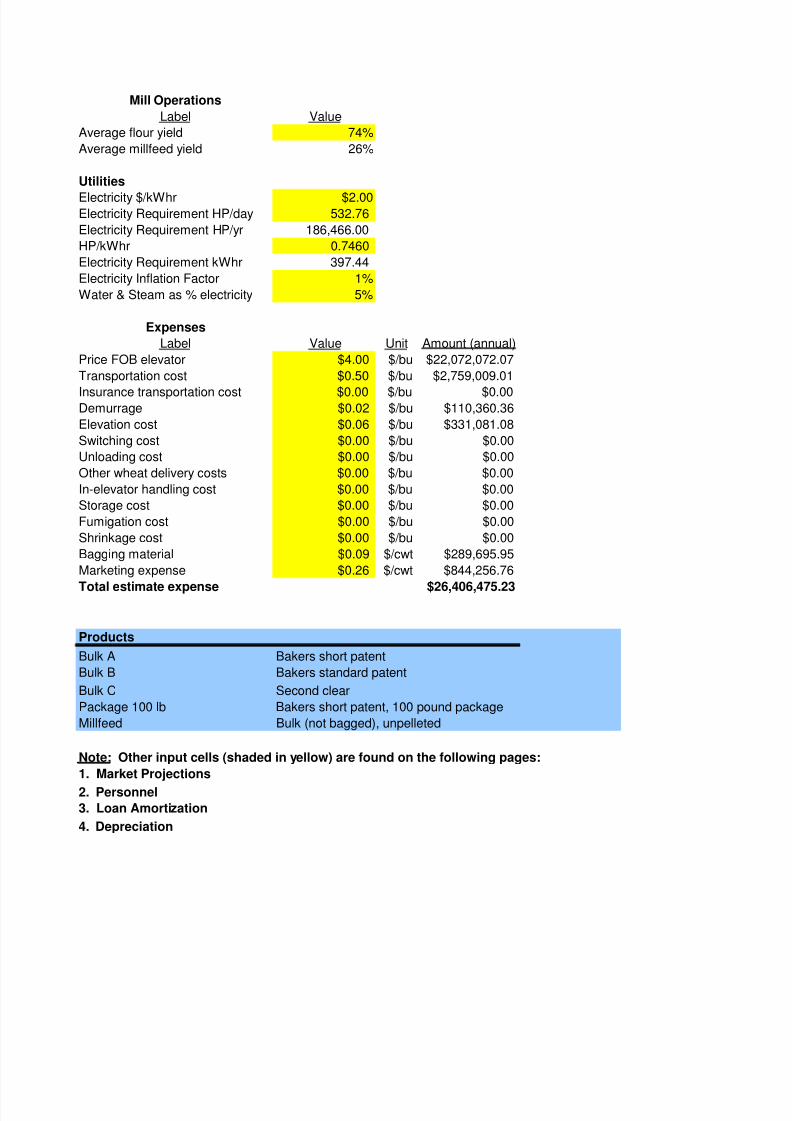
Mill Operations
Label Value
Average flour yield 74%
Average millfeed yield 26%
Utilities
Electricity $/kWhr $2.00Electricity Requirement HP/day 532.76
Electricity Requirement HP/yr 186,466.00
HP/kWhr 0.7460
Electricity Requirement kWhr 397.44
Electricity Inflation Factor 1%
Water & Steam as % electricity 5%
Expenses
Label Value Unit Amount (annual)
Price FOB elevator $4.00 $/bu $22,072,072.07
Transportation cost $0.50 $/bu $2,759,009.01
Insurance transportation cost $0.00 $/bu $0.00Demurrage $0.02 $/bu $110,360.36
Elevation cost $0.06 $/bu $331,081.08
Switching cost $0.00 $/bu $0.00
Unloading cost $0.00 $/bu $0.00
Other wheat delivery costs $0.00 $/bu $0.00
In-elevator handling cost $0.00 $/bu $0.00
Storage cost $0.00 $/bu $0.00
Fumigation cost $0.00 $/bu $0.00
Shrinkage cost $0.00 $/bu $0.00
Bagging material $0.09 $/cwt $289,695.95
Marketing expense $0.26 $/cwt $844,256.76
Total estimate expense $26,406,475.23
Products
Bulk A Bakers short patent
Bulk B Bakers standard patent
Bulk C Second clear
Package 100 lb Bakers short patent, 100 pound package
Millfeed Bulk (not bagged), unpelleted
Note: Other input cells (shaded in yellow) are found on the following pages:
1. Market Projections2. Personnel
3. Loan Amortization
4. Depreciation
8/3/2019 Flour Milling Template 4-5-2004
http://slidepdf.com/reader/full/flour-milling-template-4-5-2004 6/26
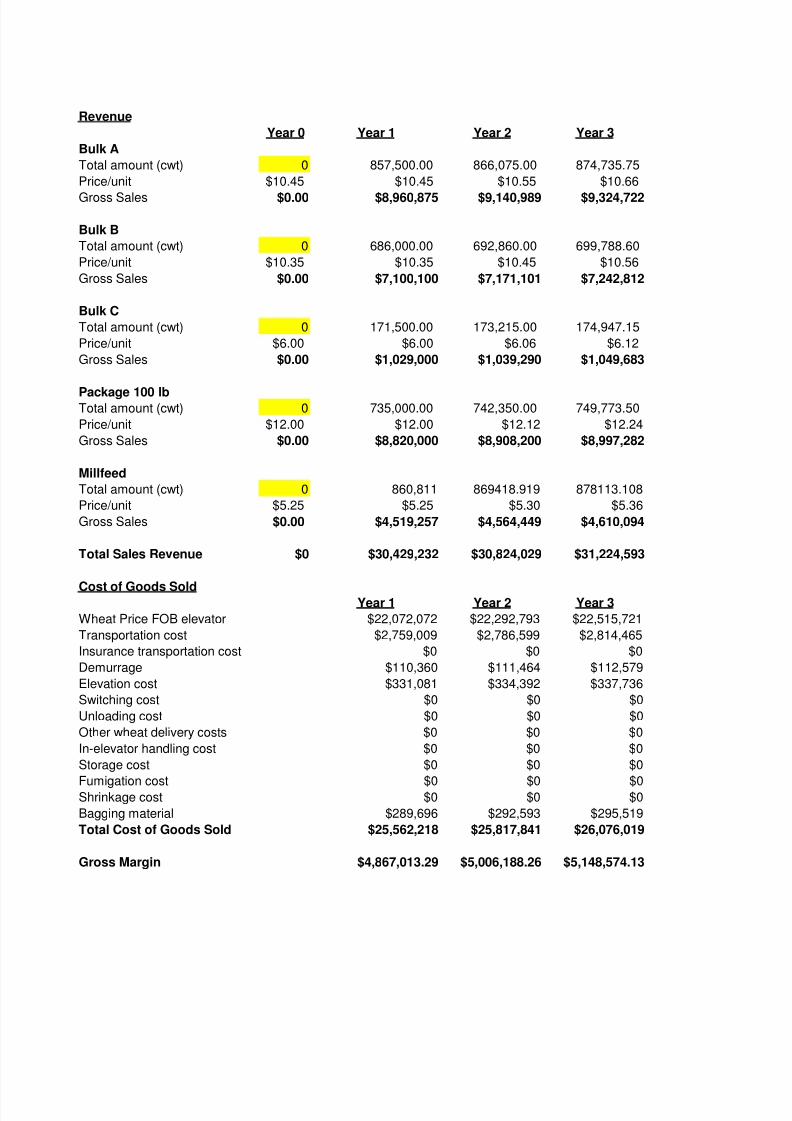
Revenue
Year 0 Year 1 Year 2 Year 3
Bulk A
Total amount (cwt) 0 857,500.00 866,075.00 874,735.75
Price/unit $10.45 $10.45 $10.55 $10.66
Gross Sales $0.00 $8,960,875 $9,140,989 $9,324,722
Bulk B
Total amount (cwt) 0 686,000.00 692,860.00 699,788.60
Price/unit $10.35 $10.35 $10.45 $10.56
Gross Sales $0.00 $7,100,100 $7,171,101 $7,242,812
Bulk C
Total amount (cwt) 0 171,500.00 173,215.00 174,947.15
Price/unit $6.00 $6.00 $6.06 $6.12
Gross Sales $0.00 $1,029,000 $1,039,290 $1,049,683
Package 100 lbTotal amount (cwt) 0 735,000.00 742,350.00 749,773.50
Price/unit $12.00 $12.00 $12.12 $12.24
Gross Sales $0.00 $8,820,000 $8,908,200 $8,997,282
Millfeed
Total amount (cwt) 0 860,811 869418.919 878113.108
Price/unit $5.25 $5.25 $5.30 $5.36
Gross Sales $0.00 $4,519,257 $4,564,449 $4,610,094
Total Sales Revenue $0 $30,429,232 $30,824,029 $31,224,593
Cost of Goods SoldYear 1 Year 2 Year 3
Wheat Price FOB elevator $22,072,072 $22,292,793 $22,515,721
Transportation cost $2,759,009 $2,786,599 $2,814,465
Insurance transportation cost $0 $0 $0
Demurrage $110,360 $111,464 $112,579
Elevation cost $331,081 $334,392 $337,736
Switching cost $0 $0 $0
Unloading cost $0 $0 $0
Other wheat delivery costs $0 $0 $0
In-elevator handling cost $0 $0 $0
Storage cost $0 $0 $0
Fumigation cost $0 $0 $0Shrinkage cost $0 $0 $0
Bagging material $289,696 $292,593 $295,519
Total Cost of Goods Sold $25,562,218 $25,817,841 $26,076,019
Gross Margin $4,867,013.29 $5,006,188.26 $5,148,574.13
8/3/2019 Flour Milling Template 4-5-2004
http://slidepdf.com/reader/full/flour-milling-template-4-5-2004 7/26
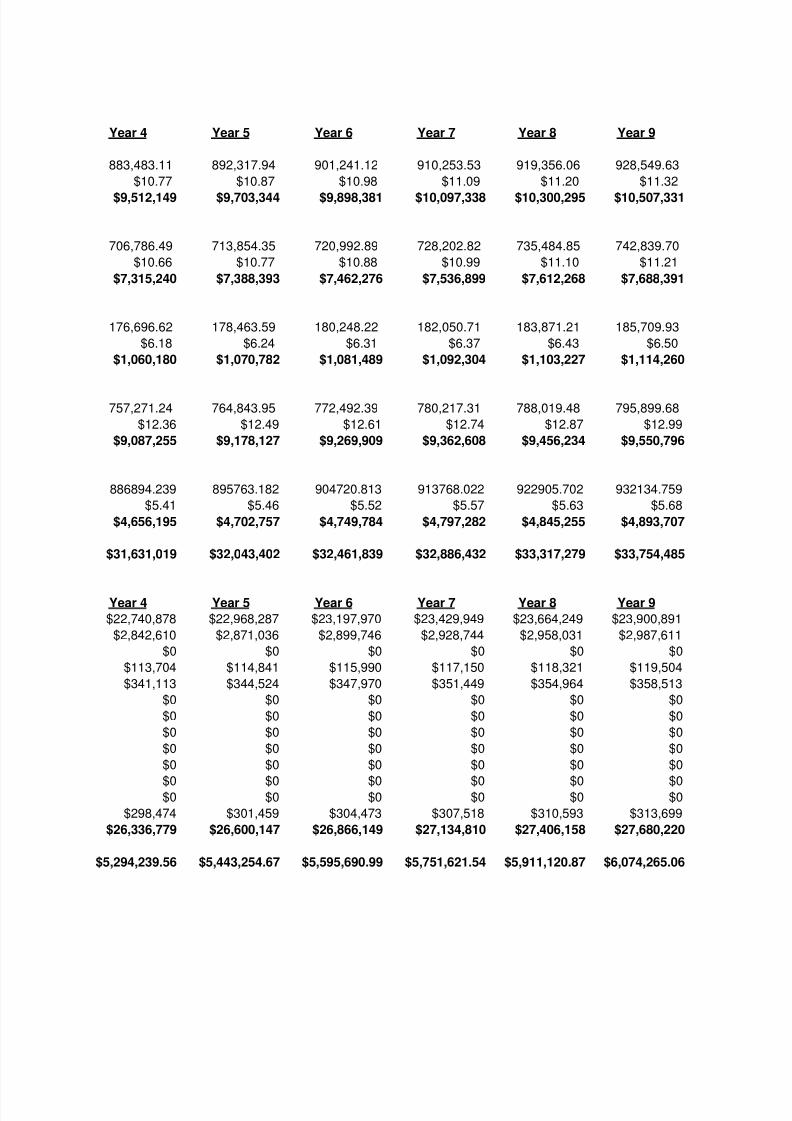
Year 4 Year 5 Year 6 Year 7 Year 8 Year 9
883,483.11 892,317.94 901,241.12 910,253.53 919,356.06 928,549.63
$10.77 $10.87 $10.98 $11.09 $11.20 $11.32
$9,512,149 $9,703,344 $9,898,381 $10,097,338 $10,300,295 $10,507,331
706,786.49 713,854.35 720,992.89 728,202.82 735,484.85 742,839.70
$10.66 $10.77 $10.88 $10.99 $11.10 $11.21
$7,315,240 $7,388,393 $7,462,276 $7,536,899 $7,612,268 $7,688,391
176,696.62 178,463.59 180,248.22 182,050.71 183,871.21 185,709.93
$6.18 $6.24 $6.31 $6.37 $6.43 $6.50
$1,060,180 $1,070,782 $1,081,489 $1,092,304 $1,103,227 $1,114,260
757,271.24 764,843.95 772,492.39 780,217.31 788,019.48 795,899.68
$12.36 $12.49 $12.61 $12.74 $12.87 $12.99
$9,087,255 $9,178,127 $9,269,909 $9,362,608 $9,456,234 $9,550,796
886894.239 895763.182 904720.813 913768.022 922905.702 932134.759
$5.41 $5.46 $5.52 $5.57 $5.63 $5.68
$4,656,195 $4,702,757 $4,749,784 $4,797,282 $4,845,255 $4,893,707
$31,631,019 $32,043,402 $32,461,839 $32,886,432 $33,317,279 $33,754,485
Year 4 Year 5 Year 6 Year 7 Year 8 Year 9
$22,740,878 $22,968,287 $23,197,970 $23,429,949 $23,664,249 $23,900,891
$2,842,610 $2,871,036 $2,899,746 $2,928,744 $2,958,031 $2,987,611
$0 $0 $0 $0 $0 $0
$113,704 $114,841 $115,990 $117,150 $118,321 $119,504
$341,113 $344,524 $347,970 $351,449 $354,964 $358,513
$0 $0 $0 $0 $0 $0
$0 $0 $0 $0 $0 $0
$0 $0 $0 $0 $0 $0
$0 $0 $0 $0 $0 $0
$0 $0 $0 $0 $0 $0
$0 $0 $0 $0 $0 $0$0 $0 $0 $0 $0 $0
$298,474 $301,459 $304,473 $307,518 $310,593 $313,699
$26,336,779 $26,600,147 $26,866,149 $27,134,810 $27,406,158 $27,680,220
$5,294,239.56 $5,443,254.67 $5,595,690.99 $5,751,621.54 $5,911,120.87 $6,074,265.06
8/3/2019 Flour Milling Template 4-5-2004
http://slidepdf.com/reader/full/flour-milling-template-4-5-2004 8/26
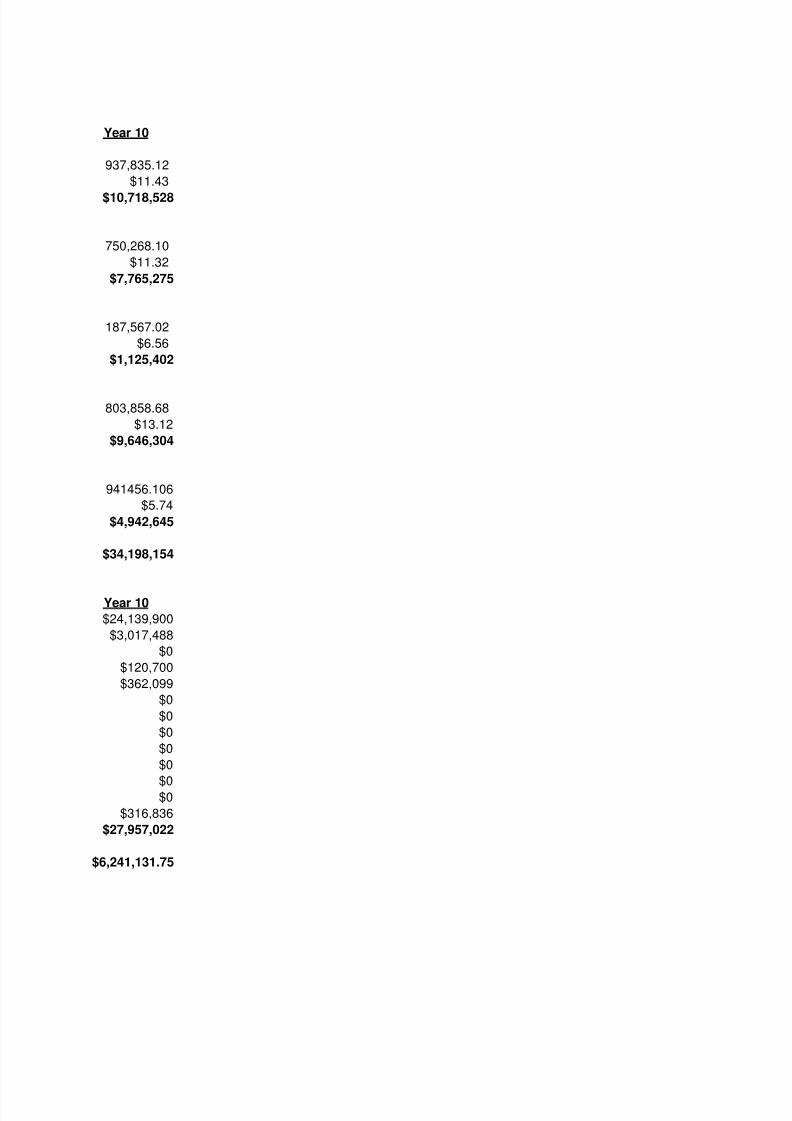
Year 10
937,835.12
$11.43
$10,718,528
750,268.10
$11.32
$7,765,275
187,567.02
$6.56
$1,125,402
803,858.68
$13.12
$9,646,304
941456.106
$5.74
$4,942,645
$34,198,154
Year 10
$24,139,900
$3,017,488
$0
$120,700
$362,099
$0
$0
$0
$0
$0
$0$0
$316,836
$27,957,022
$6,241,131.75

8/3/2019 Flour Milling Template 4-5-2004
http://slidepdf.com/reader/full/flour-milling-template-4-5-2004 9/26
Fixed
Cost Description Year 1 Year 2 Year 3 Year 4 Year 5 Year 6
General & Administrative $322,140 $325,361 $328,615 $331,901 $335,220 $338,572
Maintenance $648,878 $655,367 $661,921 $668,540 $675,225 $681,978
Insurance $259,551 $262,147 $264,768 $267,416 $270,090 $272,791
Property Taxes $3,202 $3,234 $3,267 $3,299 $3,332 $3,366
Depreciation $1,084,800 $1,755,222 $1,295,129 $966,490 $732,500 $731,842Interest $565,282 $536,615 $505,655 $472,219 $436,107 $397,106
Total Fixed $2,883,854 $3,537,948 $3,059,355 $2,709,865 $2,452,475 $2,425,655
Variable
Cost Description Year 1 Year 2 Year 3 Year 4 Year 5 Year 6
Labor: Yearly Wages $789,600 $797,496 $805,471 $813,526 $821,661 $829,878
Labor: Benefits $236,880 $239,249 $241,641 $244,058 $246,498 $248,963
Labor: Overtime $51,324 $51,837 $52,356 $52,879 $53,408 $53,942
Total Labor Expenses $1,077,804 $1,088,582 $1,099,468 $1,110,463 $1,121,567 $1,132,783
Utilities: Electricity $372,932.00 $376,661.32 $380,427.93 $384,232.21 $388,074.53 $391,955.28
Utilities: Water $18,646.60 $18,833.07 $19,021.40 $19,211.61 $19,403.73 $19,597.76
Total Utilities $391,579 $395,494 $399,449 $403,444 $407,478 $411,553Cost of Goods Sold* $25,562,218 $25,817,841 $26,076,019 $26,336,779 $26,600,147 $26,866,149
Total Variable $27,031,601 $27,301,917 $27,574,936 $27,850,686 $28,129,192 $28,410,484
*COGS breakdown on Market Projections Worksheet
Other Costs $0 $0 $0 $0 $0 $0
Total Costs $29,915,455 $30,839,865 $30,634,291 $30,560,551 $30,581,667 $30,836,140
8/3/2019 Flour Milling Template 4-5-2004
http://slidepdf.com/reader/full/flour-milling-template-4-5-2004 10/26
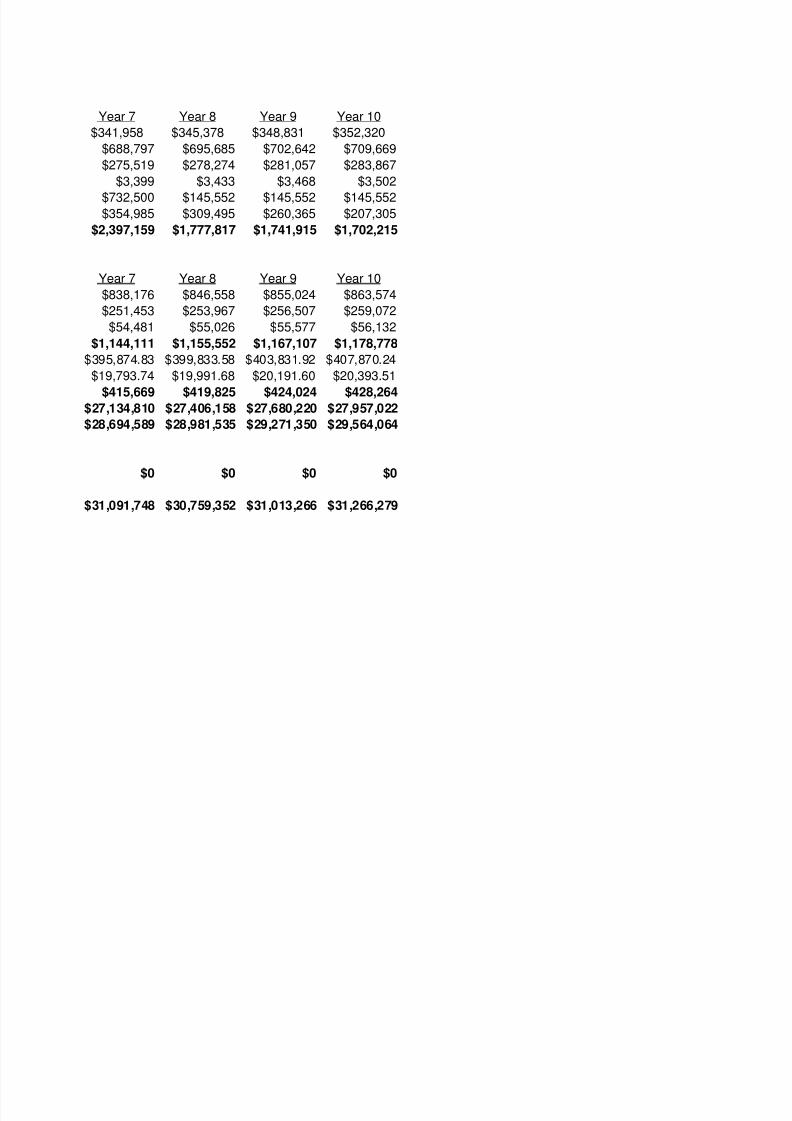
Year 7 Year 8 Year 9 Year 10
$341,958 $345,378 $348,831 $352,320
$688,797 $695,685 $702,642 $709,669
$275,519 $278,274 $281,057 $283,867
$3,399 $3,433 $3,468 $3,502
$732,500 $145,552 $145,552 $145,552$354,985 $309,495 $260,365 $207,305
$2,397,159 $1,777,817 $1,741,915 $1,702,215
Year 7 Year 8 Year 9 Year 10
$838,176 $846,558 $855,024 $863,574
$251,453 $253,967 $256,507 $259,072
$54,481 $55,026 $55,577 $56,132
$1,144,111 $1,155,552 $1,167,107 $1,178,778
$395,874.83 $399,833.58 $403,831.92 $407,870.24
$19,793.74 $19,991.68 $20,191.60 $20,393.51
$415,669 $419,825 $424,024 $428,264$27,134,810 $27,406,158 $27,680,220 $27,957,022
$28,694,589 $28,981,535 $29,271,350 $29,564,064
$0 $0 $0 $0
$31,091,748 $30,759,352 $31,013,266 $31,266,279

8/3/2019 Flour Milling Template 4-5-2004
http://slidepdf.com/reader/full/flour-milling-template-4-5-2004 11/26
Annual Total # of Total Benefits Annual
Job Type Salary Employees Salaries Expense Bonus
General and Administrative Positions
Storage and Receiving Foreman $25,000 1 $25,000 $7,500 5%
Packaging, Storage, and Loadout Foreman $25,000 1 $25,000 $7,500 5%
Chief Chemist $28,000 1 $28,000 $8,400 5%
Maintenance Foreman $25,000 1 $25,000 $7,500 5%Manager $50,000 1 $50,000 $15,000 5%
Assistant Manager $35,000 1 $35,000 $10,500 5%
Superintendent $20,000 1 $20,000 $6,000 5%
Clerical A $15,000 1 $15,000 $4,500 5%
Clerical B $13,000 1 $13,000 $3,900 5%
Totals
General Labor Positions (Direct Labor) Wage Rate 24 hours 8 hours 8 hours
(Hourly) (Monthly) [All Day] [Morning] [Afternoon]
Receiving and Storage
Unloader $9.00 1 1
Cleaning and Conditioning:
Smutter-oiler A $8.00 1 1
Smutter-oiler B $7.00
Milling:
Miller-bolter A $10.00 1
Miller-bolter B $9.00 1
Oiler-sweeper A $10.00 1
Oiler sweeper B $9.00 1
Packaging, Storage and Loadout:
Packer A $10.00 1 1
Packer B $9.00 2 2
Loader A $10.00 1 1
Loader B $9.00 2 1
Laboratory:
Chemist $10.00 1
Maintenance:
First Class A $10.00
First Class B $9.00 1 1
Second Class A $8.00 1
Second Class B $7.00 1
Other:
Chemist-sanit. relief A $10.00 1
Chemist-sanit. relief B $9.00 1
Unloader-loader-sweeper A $8.00
Unloader-loader-sweeper B $7.00
Total Labor Expense
Total # of Employees 0 14 12

8/3/2019 Flour Milling Template 4-5-2004
http://slidepdf.com/reader/full/flour-milling-template-4-5-2004 12/26
Bonus Yearly
Expense Expense
$1,625 $34,125
$1,625 $34,125
$1,820 $38,220
$1,625 $34,125$3,250 $68,250
$2,275 $47,775
$1,300 $27,300
$975 $20,475
$845 $17,745
$322,140
8 hours Total # of Hours/ Hours/ $/ Benefits Overtime Overtime
[Night] Employees Day Year Year Expense Percentage Expense
2 16 5,600 $50,400 $15,120.00 5% $3,276.00
2 16 5,600 $44,800 $13,440.00 5% $2,912.00
1 1 8 2,800 $19,600 $5,880.00 5% $1,274.00
1 2 16 5,600 $56,000 $16,800.00 5% $3,640.00
1 8 2,800 $25,200 $7,560.00 5% $1,638.00
1 2 16 5,600 $56,000 $16,800.00 5% $3,640.00
1 8 2,800 $25,200 $7,560.00 5% $1,638.00
2 16 5,600 $56,000 $16,800.00 5% $3,640.00
4 32 11,200 $100,800 $30,240.00 5% $6,552.00
2 16 5,600 $56,000 $16,800.00 5% $3,640.00
3 24 8,400 $75,600 $22,680.00 5% $4,914.00
1 8 2,800 $28,000 $8,400.00 5% $1,820.00
1 1 8 2,800 $28,000 $8,400.00 5% $1,820.00
2 16 5,600 $50,400 $15,120.00 5% $3,276.00
1 8 2,800 $22,400 $6,720.00 5% $1,456.00
1 8 2,800 $19,600 $5,880.00 5% $1,274.00
1 8 2,800 $28,000 $8,400.00 5% $1,820.00
1 8 2,800 $25,200 $7,560.00 5% $1,638.00
1 1 8 2,800 $22,400 $6,720.00 5% $1,456.00
0 - $0 $0.00 5% $0.00
$789,600 $236,880 $51,324
5 31
8/3/2019 Flour Milling Template 4-5-2004
http://slidepdf.com/reader/full/flour-milling-template-4-5-2004 13/26
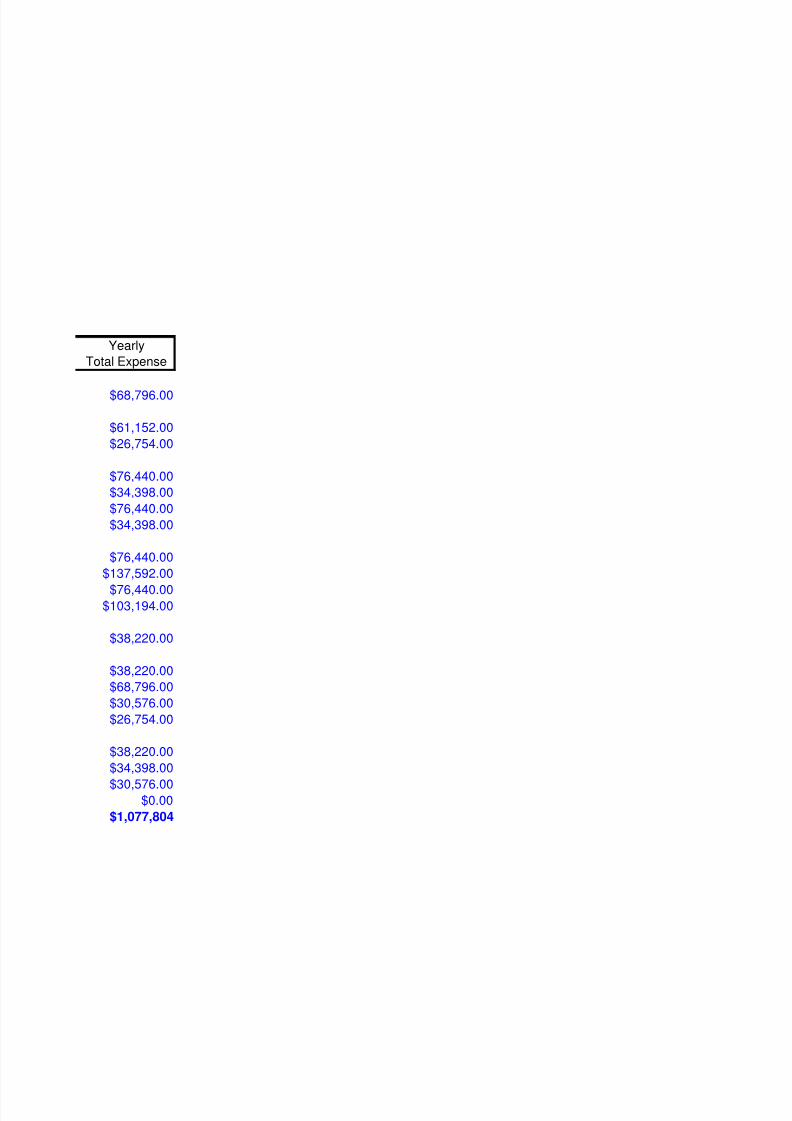
Yearly
Total Expense
$68,796.00
$61,152.00
$26,754.00
$76,440.00
$34,398.00
$76,440.00
$34,398.00
$76,440.00
$137,592.00
$76,440.00
$103,194.00
$38,220.00
$38,220.00
$68,796.00
$30,576.00
$26,754.00
$38,220.00
$34,398.00
$30,576.00
$0.00
$1,077,804

8/3/2019 Flour Milling Template 4-5-2004
http://slidepdf.com/reader/full/flour-milling-template-4-5-2004 14/26
Loan Amortization
Total PP&E $12,977,568.00
Member Equity $7,786,540.80
Loan amount $5,191,027.20
Long term interest rate 8.00%
Loan term 10.00Annual Payment $773,616.13
Year 1 Year 2
Beginning Balance $5,191,027.20 $4,832,693.25
Interest $415,282.18 $386,615.46
Principal $358,333.95 $387,000.67
Ending Balance $4,832,693.25 $4,445,692.58
Working Capital* $2,500,000.00
Short Term Interest Rate 6.00%
Interest Amount $150,000.00
Total Interest Expense $565,282.18 $536,615.46
Total Principle Payment $358,333.95 $387,000.67
*Working Capital is the short-term borrowing made by the mill to purchase inputs and make payroll,
Note: While this value may be determined by the template's users, a good rule of thumb is 10% of t

8/3/2019 Flour Milling Template 4-5-2004
http://slidepdf.com/reader/full/flour-milling-template-4-5-2004 15/26
Year 3 Year 4 Year 5 Year 6 Year 7
$4,445,692.58 $4,027,731.85 $3,576,334.27 $3,088,824.88 $2,562,314.75
$355,655.41 $322,218.55 $286,106.74 $247,105.99 $204,985.18
$417,960.72 $451,397.58 $487,509.39 $526,510.14 $568,630.95
$4,027,731.85 $3,576,334.27 $3,088,824.88 $2,562,314.75 $1,993,683.80
$505,655.41 $472,218.55 $436,106.74 $397,105.99 $354,985.18
$417,960.72 $451,397.58 $487,509.39 $526,510.14 $568,630.95
all to be paid back during the operating year.
e average annual Total Variable costs.
8/3/2019 Flour Milling Template 4-5-2004
http://slidepdf.com/reader/full/flour-milling-template-4-5-2004 16/26
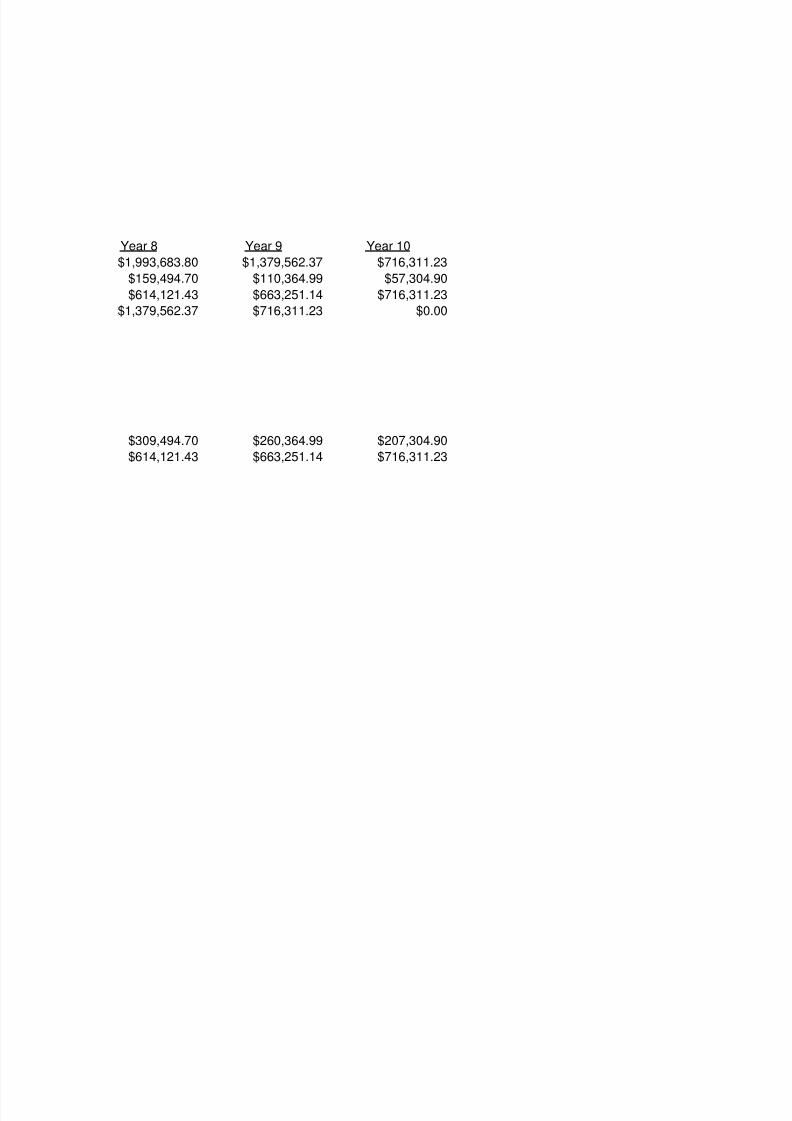
Year 8 Year 9 Year 10
$1,993,683.80 $1,379,562.37 $716,311.23
$159,494.70 $110,364.99 $57,304.90
$614,121.43 $663,251.14 $716,311.23
$1,379,562.37 $716,311.23 $0.00
$309,494.70 $260,364.99 $207,304.90
$614,121.43 $663,251.14 $716,311.23
8/3/2019 Flour Milling Template 4-5-2004
http://slidepdf.com/reader/full/flour-milling-template-4-5-2004 17/26
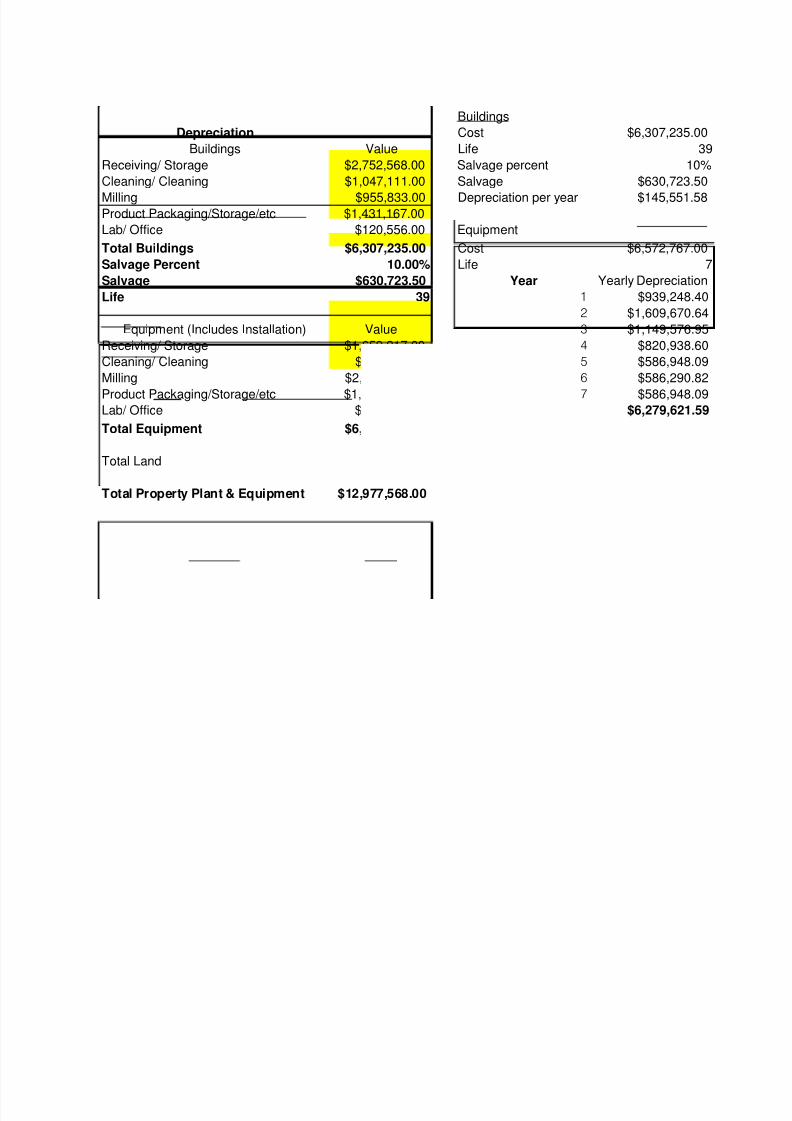
Buildings
Depreciation Cost $6,307,235.00
Buildings Value Life 39
Receiving/ Storage $2,752,568.00 Salvage percent 10%
Cleaning/ Cleaning $1,047,111.00 Salvage $630,723.50
Milling $955,833.00 Depreciation per year $145,551.58Product Packaging/Storage/etc $1,431,167.00
Lab/ Office $120,556.00 Equipment
Total Buildings $6,307,235.00 Cost $6,572,767.00
Salvage Percent 10.00% Life 7
Salvage $630,723.50 Year Yearly Depreciation
Life 39 1 $939,248.40
2 $1,609,670.64
Equipment (Includes Installation) Value 3 $1,149,576.95
Receiving/ Storage $1,659,217.00 4 $820,938.60
Cleaning/ Cleaning $668,275.00 5 $586,948.09
Milling $2,847,960.00 6 $586,290.82
Product Packaging/Storage/etc $1,206,106.00 7 $586,948.09Lab/ Office $191,209.00 $6,279,621.59
Total Equipment $6,572,767.00
Total Land $97,566.00
Total Property Plant & Equipment $12,977,568.00
8/3/2019 Flour Milling Template 4-5-2004
http://slidepdf.com/reader/full/flour-milling-template-4-5-2004 18/26
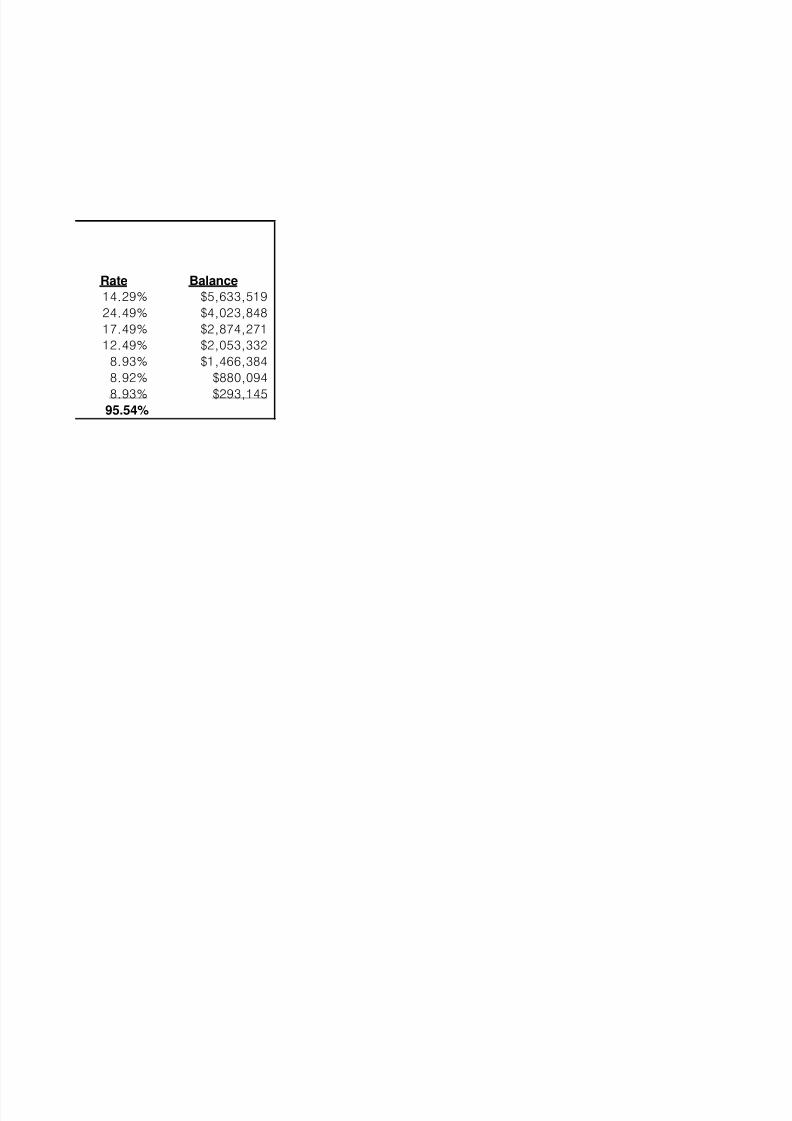
Rate Balance
14.29% $5,633,519
24.49% $4,023,848
17.49% $2,874,271
12.49% $2,053,332
8.93% $1,466,384
8.92% $880,094
8.93% $293,145
95.54%

8/3/2019 Flour Milling Template 4-5-2004
http://slidepdf.com/reader/full/flour-milling-template-4-5-2004 19/26
Income and Expense Summary
Gross Sales Year 1 Year 2 Year 3 Year 4
Bulk A $8,960,875.00 $9,140,988.59 $9,324,722.46 $9,512,149.38
Bulk B $7,100,100.00 $7,171,101.00 $7,242,812.01 $7,315,240.13
Bulk C $1,029,000.00 $1,039,290.00 $1,049,682.90 $1,060,179.73
Package 100 lb $8,820,000.00 $8,908,200.00 $8,997,282.00 $9,087,254.82Millfeed $4,519,256.76 $4,564,449.32 $4,610,093.82 $4,656,194.76
Total Sales $30,429,231.76 $30,824,028.91 $31,224,593.19 $31,631,018.81
Expenses
Variable Costs $27,031,601.07 $27,301,917.08 $27,574,936.25 $27,850,685.61
Fixed Costs $2,883,854.32 $3,537,947.56 $3,059,354.91 $2,709,865.41
Other $0.00 $0.00 $0.00 $0.00
Total Expenses $29,915,455.39 $30,839,864.64 $30,634,291.16 $30,560,551.03
EBT $513,776.37 ($15,835.72) $590,302.02 $1,070,467.79
*Interest is included in fixed expenses
Income Taxes $308,265.82 $0.00 $354,181.21 $642,280.67
Net Income $205,510.55 ($15,835.72) $236,120.81 $428,187.12
Approx. Cash Flow* $931,976.58 $1,352,385.82 $1,113,288.61 $943,279.71
*Cash flow does not consider increases or decreases in working capital.
8/3/2019 Flour Milling Template 4-5-2004
http://slidepdf.com/reader/full/flour-milling-template-4-5-2004 20/26
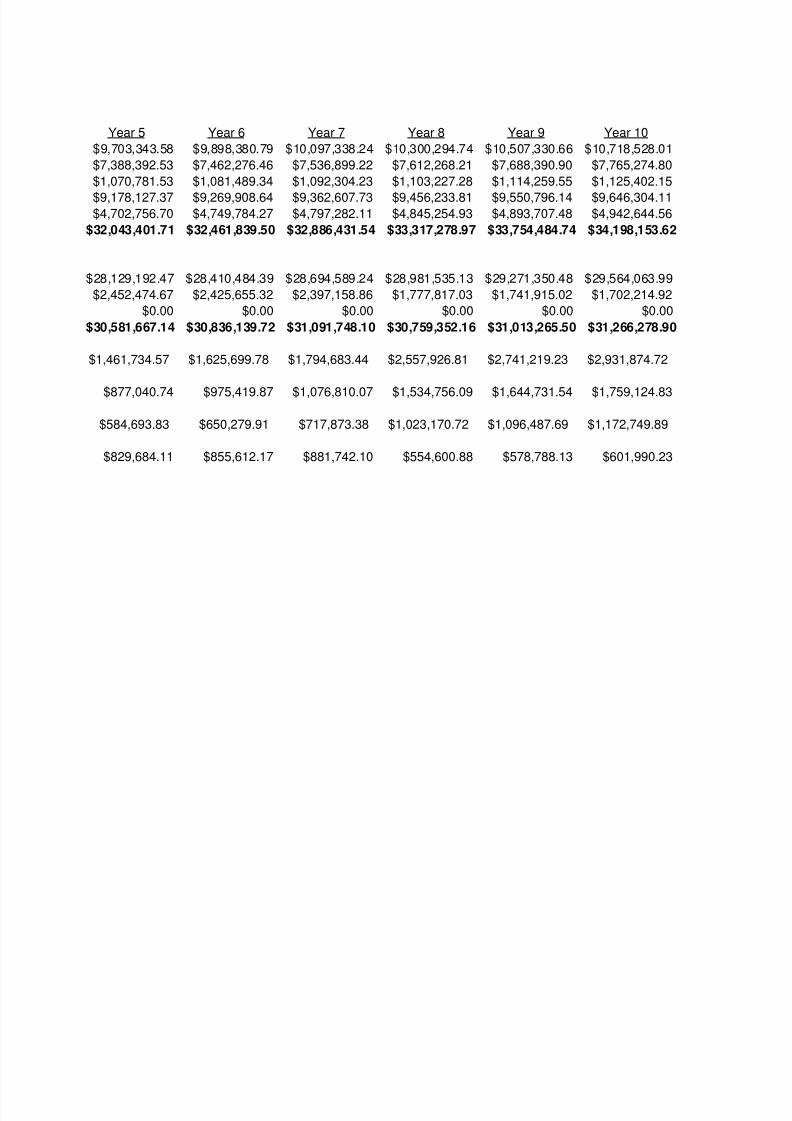
Year 5 Year 6 Year 7 Year 8 Year 9 Year 10
$9,703,343.58 $9,898,380.79 $10,097,338.24 $10,300,294.74 $10,507,330.66 $10,718,528.01
$7,388,392.53 $7,462,276.46 $7,536,899.22 $7,612,268.21 $7,688,390.90 $7,765,274.80
$1,070,781.53 $1,081,489.34 $1,092,304.23 $1,103,227.28 $1,114,259.55 $1,125,402.15
$9,178,127.37 $9,269,908.64 $9,362,607.73 $9,456,233.81 $9,550,796.14 $9,646,304.11$4,702,756.70 $4,749,784.27 $4,797,282.11 $4,845,254.93 $4,893,707.48 $4,942,644.56
$32,043,401.71 $32,461,839.50 $32,886,431.54 $33,317,278.97 $33,754,484.74 $34,198,153.62
$28,129,192.47 $28,410,484.39 $28,694,589.24 $28,981,535.13 $29,271,350.48 $29,564,063.99
$2,452,474.67 $2,425,655.32 $2,397,158.86 $1,777,817.03 $1,741,915.02 $1,702,214.92
$0.00 $0.00 $0.00 $0.00 $0.00 $0.00
$30,581,667.14 $30,836,139.72 $31,091,748.10 $30,759,352.16 $31,013,265.50 $31,266,278.90
$1,461,734.57 $1,625,699.78 $1,794,683.44 $2,557,926.81 $2,741,219.23 $2,931,874.72
$877,040.74 $975,419.87 $1,076,810.07 $1,534,756.09 $1,644,731.54 $1,759,124.83
$584,693.83 $650,279.91 $717,873.38 $1,023,170.72 $1,096,487.69 $1,172,749.89
$829,684.11 $855,612.17 $881,742.10 $554,600.88 $578,788.13 $601,990.23
8/3/2019 Flour Milling Template 4-5-2004
http://slidepdf.com/reader/full/flour-milling-template-4-5-2004 21/26
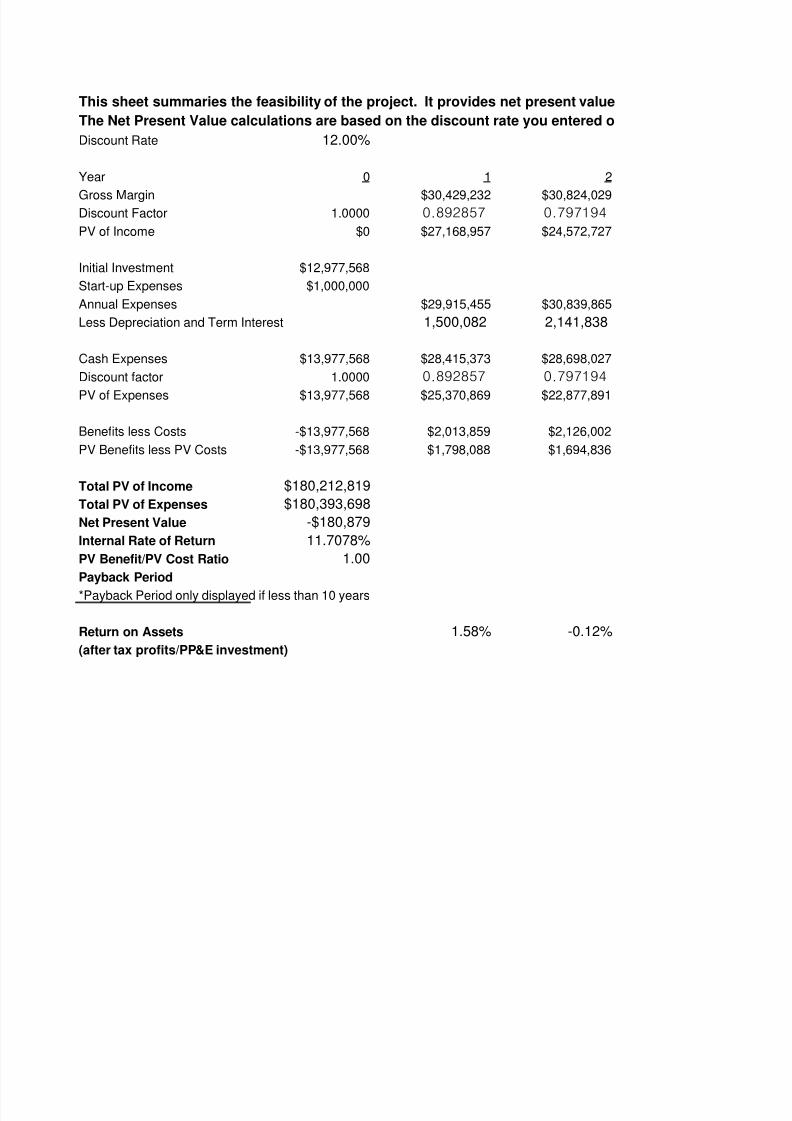
This sheet summaries the feasibility of the project. It provides net present value
The Net Present Value calculations are based on the discount rate you entered o
Discount Rate 12.00%
Year 0 1 2
Gross Margin $30,429,232 $30,824,029Discount Factor 1.0000 0.892857 0.797194
PV of Income $0 $27,168,957 $24,572,727
Initial Investment $12,977,568
Start-up Expenses $1,000,000
Annual Expenses $29,915,455 $30,839,865
Less Depreciation and Term Interest 1,500,082 2,141,838
Cash Expenses $13,977,568 $28,415,373 $28,698,027
Discount factor 1.0000 0.892857 0.797194
PV of Expenses $13,977,568 $25,370,869 $22,877,891
Benefits less Costs -$13,977,568 $2,013,859 $2,126,002
PV Benefits less PV Costs -$13,977,568 $1,798,088 $1,694,836
Total PV of Income $180,212,819
Total PV of Expenses $180,393,698
Net Present Value -$180,879
Internal Rate of Return 11.7078%
PV Benefit/PV Cost Ratio 1.00
Payback Period*Payback Period only displayed if less than 10 years
Return on Assets 1.58% -0.12%
(after tax profits/PP&E investment)

8/3/2019 Flour Milling Template 4-5-2004
http://slidepdf.com/reader/full/flour-milling-template-4-5-2004 22/26

8/3/2019 Flour Milling Template 4-5-2004
http://slidepdf.com/reader/full/flour-milling-template-4-5-2004 23/26
, benefit cost ratio and internal rate of return
n the input page
3 4 5 6 7
$31,224,593 $31,631,019 $32,043,402 $32,461,839 $32,886,4320.711780 0.635518 0.567427 0.506631 0.452349
$22,225,049 $20,102,084 $18,182,287 $16,446,178 $14,876,152
$30,634,291 $30,560,551 $30,581,667 $30,836,140 $31,091,748
1,650,784 1,288,709 1,018,606 978,948 937,485
$28,983,507 $29,271,842 $29,563,061 $29,857,191 $30,154,263
0.711780 0.635518 0.567427 0.506631 0.452349
$20,629,888 $18,602,785 $16,774,875 $15,126,582 $13,640,257
$2,241,086 $2,359,177 $2,480,341 $2,604,648 $2,732,168
$1,595,161 $1,499,299 $1,407,412 $1,319,596 $1,235,894
1.82% 3.30% 4.51% 5.01% 5.53%

8/3/2019 Flour Milling Template 4-5-2004
http://slidepdf.com/reader/full/flour-milling-template-4-5-2004 24/26

8/3/2019 Flour Milling Template 4-5-2004
http://slidepdf.com/reader/full/flour-milling-template-4-5-2004 25/26
8 9 10
$33,317,279 $33,754,485 $34,198,1540.403883 0.360610 0.321973
$13,456,290 $12,172,206 $11,010,890
$30,759,352 $31,013,266 $31,266,279
305,046 255,917 202,856
$30,454,306 $30,757,349 $31,063,422
0.403883 0.360610 0.321973
$12,299,983 $11,091,408 $10,001,591
$2,862,973 $2,997,136 $3,134,731
$1,156,307 $1,080,797 $1,009,300
7.88% 8.45% 9.04%

8/3/2019 Flour Milling Template 4-5-2004
http://slidepdf.com/reader/full/flour-milling-template-4-5-2004 26/26