TRENDS IN THE INDONESIAN FLOUR MILLING SECTOR · TRENDS IN THE INDONESIAN FLOUR MILLING SECTOR By:...
38
TRENDS IN THE INDONESIAN FLOUR MILLING SECTOR By: Franciscus Welirang Chairman of APTINDO (Association of Flour Producers in Indonesia) Director of PT Indofood Sukses Makmur Tbk (Bogasari Flour Mills) AGIC Indonesia Jakarta, March 5 th , 2019
Transcript of TRENDS IN THE INDONESIAN FLOUR MILLING SECTOR · TRENDS IN THE INDONESIAN FLOUR MILLING SECTOR By:...
TRENDS IN THE INDONESIAN
FLOUR MILLING SECTOR
By: Franciscus Welirang
Chairman of APTINDO (Association of Flour Producers in Indonesia)
Director of PT Indofood Sukses Makmur Tbk (Bogasari Flour Mills)
AGIC Indonesia
Jakarta, March 5th, 2019

2
SUBJECT
PRE Deregulation (BULOG Era)
POST Deregulation
Total
1970-1998 1999-2009 2010-2014 2015 - 2018
Total 4 4 + 7 = 11 11 + 15 = 26 27+ 4 (-3) 28
Location
Jakarta & Surabaya (1); Makassar (1); Semarang (1);
Cilacap (1);
Gresik (1); Tangerang (1); Sidoarjo (3); Medan (1); Cilegon (1)
Cilegon (3); Tangerang (2);
Medan (2); Bekasi (2); Gresik(3);
Sidoarjo (1); Mojokerto (1); Semarang (1)
Jakarta (1); Cilegon (1); Cilegon (-1)
Tangerang (-1); Bekasi (-1);
Surabaya (1);
Java: 23 Outside Java: 5 (Centralized in
Java )
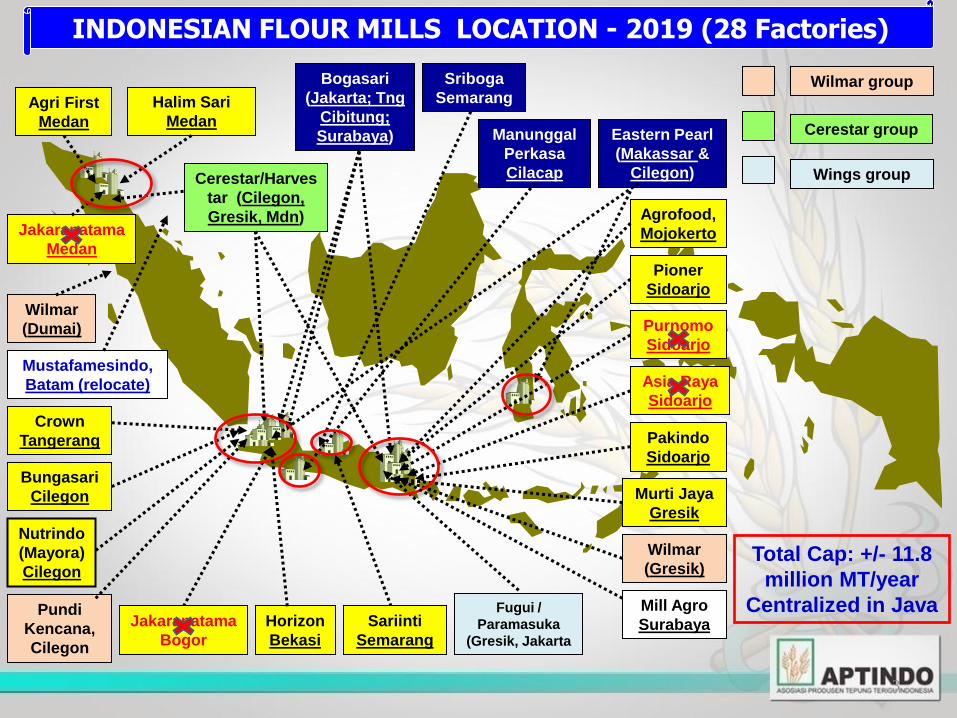
Total of Wheat Mill Capacity : +/- 11.8 million MT/year
PRE & POST DEREGULATION OF INDONESIAN WHEAT FLOUR INDUSTRY – THE HISTORY
3
Eastern Pearl
(Makassar &
Cilegon)
Sriboga
Semarang
Manunggal
Perkasa
Cilacap
Bogasari
(Jakarta; Tng
Cibitung;
Surabaya)
Purnomo
Sidoarjo
Asia Raya
Sidoarjo
Pakindo
Sidoarjo
Agri First
Medan
Halim Sari
Medan
Horizon
Bekasi
Cerestar/Harves
tar (Cilegon,
Gresik, Mdn) Jakaranatama
Medan
Pioner
Sidoarjo
Mustafamesindo,
Batam (relocate)
Nutrindo
(Mayora)
Cilegon
Mill Agro
Surabaya
Crown
Tangerang
Total Cap: +/- 11.8
million MT/year
Centralized in Java
Agrofood,
Mojokerto
Murti Jaya
Gresik
Bungasari
Cilegon
Pundi
Kencana,
Cilegon
Sariinti
Semarang
Fugui /
Paramasuka
(Gresik, Jakarta
Wilmar
(Dumai)
Wilmar group
Cerestar group
Wings group
INDONESIAN FLOUR MILLS LOCATION - 2019 (28 Factories)
Wilmar
(Gresik)
Jakaranatama
Bogor
4
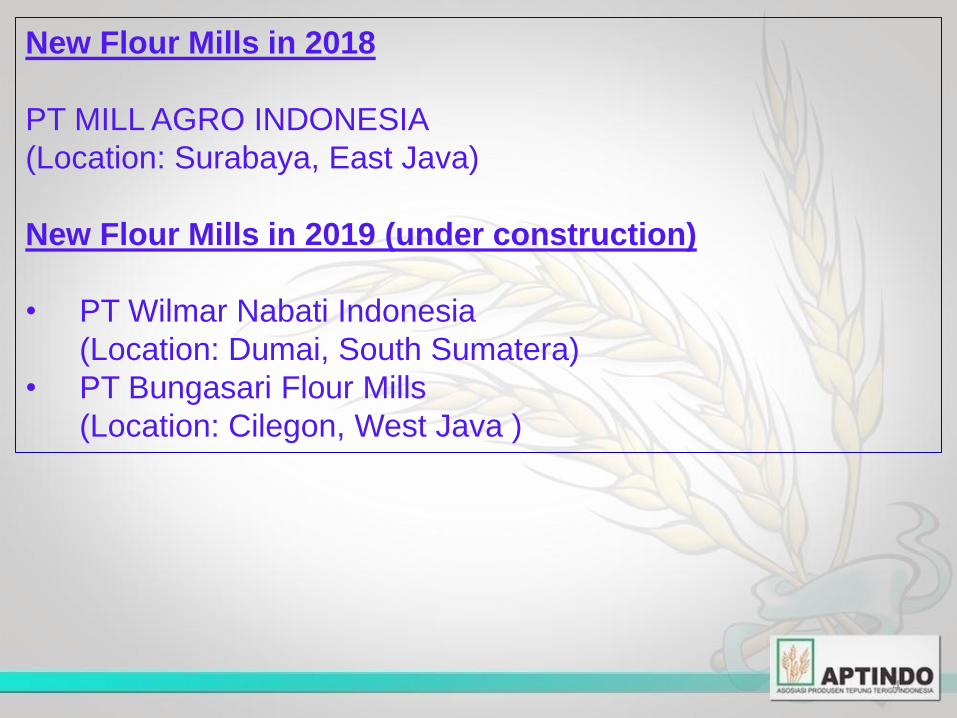
New Flour Mills in 2018
PT MILL AGRO INDONESIA
(Location: Surabaya, East Java)
New Flour Mills in 2019 (under construction)
• PT Wilmar Nabati Indonesia
(Location: Dumai, South Sumatera)
• PT Bungasari Flour Mills
(Location: Cilegon, West Java )
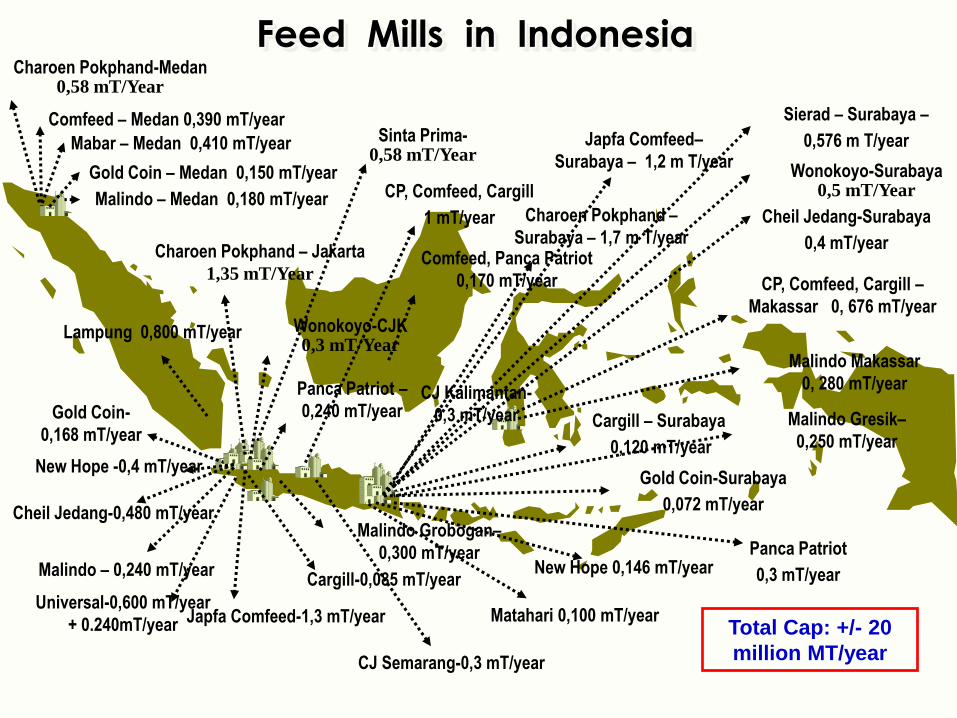
CP, Comfeed, Cargill –
Makassar 0, 676 mT/year
CP, Comfeed, Cargill
1 mT/year
Feed Mills in Indonesia
Japfa Comfeed–
Surabaya – 1,2 m T/year
Malindo – 0,240 mT/year
Cargill – Surabaya
0,120 mT/year
Gold Coin-Surabaya
0,072 mT/year
Mabar – Medan 0,410 mT/year
Panca Patriot
0,3 mT/year
Japfa Comfeed-1,3 mT/year
Sinta Prima- 0,58 mT/Year
Sierad – Surabaya –
0,576 m T/year
New Hope -0,4 mT/year
Charoen Pokphand – Jakarta
1,35 mT/Year
Charoen Pokphand –
Surabaya – 1,7 m T/year Comfeed, Panca Patriot
0,170 mT/year
Charoen Pokphand-Medan 0,58 mT/Year
Cheil Jedang-0,480 mT/year
New Hope 0,146 mT/year
Matahari 0,100 mT/year
Wonokoyo-Surabaya 0,5 mT/Year
Comfeed – Medan 0,390 mT/year
Gold Coin-
0,168 mT/year
Cargill-0,085 mT/year
Cheil Jedang-Surabaya
0,4 mT/year
Malindo – Medan 0,180 mT/year
Gold Coin – Medan 0,150 mT/year
Lampung 0,800 mT/year
Universal-0,600 mT/year
+ 0.240mT/year
Malindo Grobogan–
0,300 mT/year
Panca Patriot –
0,240 mT/year
Malindo Makassar
0, 280 mT/year
Malindo Gresik–
0,250 mT/year
CJ Semarang-0,3 mT/year
CJ Kalimantan-
0,3 mT/year
Wonokoyo-CJK 0,3 mT/Year
Total Cap: +/- 20
million MT/year
6
INDONESIAN WHEAT FLOUR CONSUMPTION

YEAR 2014 2015 2016 2017 2018
SUBJECT 000 MT
% 000 MT
% 000 MT
% 000 MT
% 000 MT %
DOMESTIC SUPPLY
5,431 98.0 5,455 99.5 5,841 98.9 6,275 99.9 6,519 99.96
IMPORTS 197 2.0 27 0.5 64 1.1 8.5 0.1 2.3 0.04
Total 5,628 100 5,482 100 5,905 100 6,24 100 6,522 100
Wheat Equivalent 7,405 7,213 7,769 8,056 8,361
GROWTH 5.09% - 2.60% 7.72% 6.41% 3.79%
Indonesian Wheat Flour Consumption : 2017 : 6.2 MMT, Wheat grain equivalent 7.98 MMT 2018: 6.5 MMT, Wheat grain equivalent 8.36 MMT
INDONESIAN WHEAT FLOUR CONSUMPTION , 2014-2018
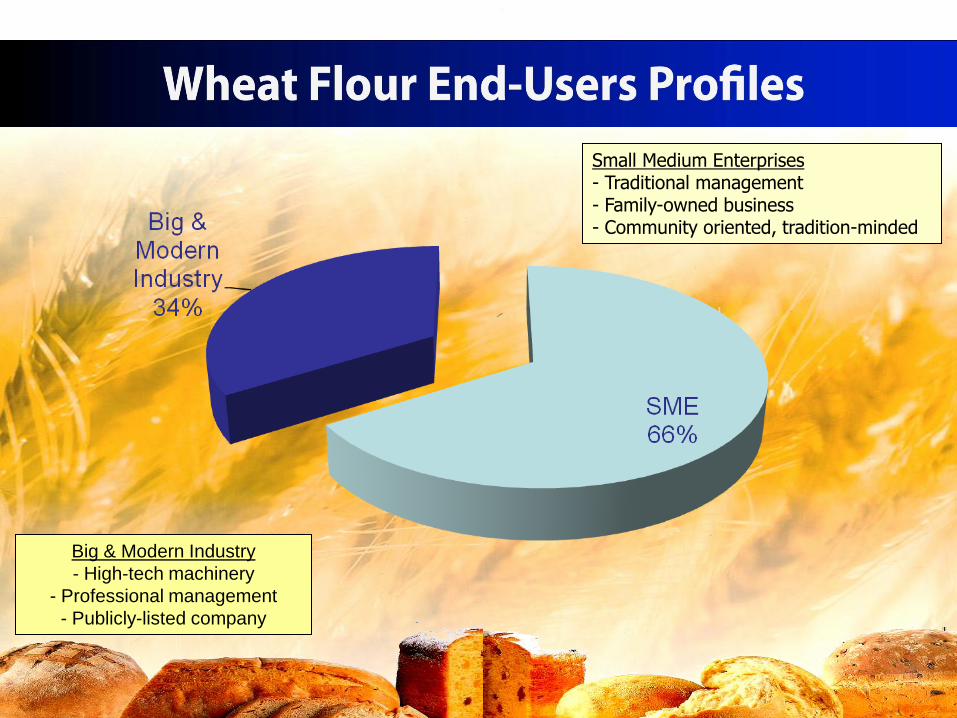
Small Medium Enterprises - Traditional management - Family-owned business - Community oriented, tradition-minded
Big & Modern Industry
- High-tech machinery
- Professional management
- Publicly-listed company

9
10
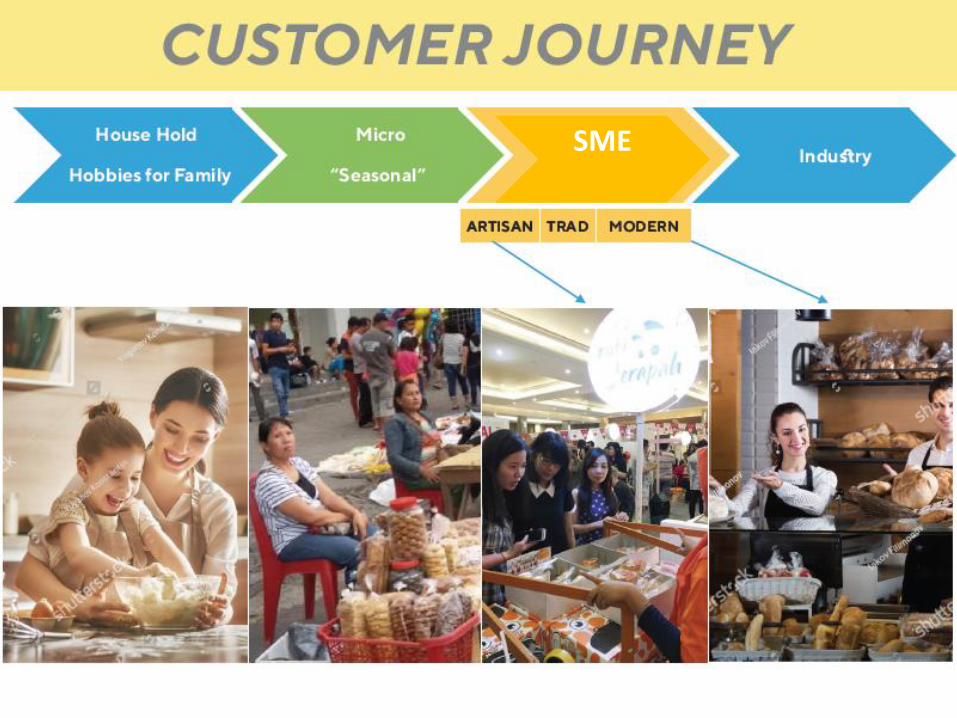
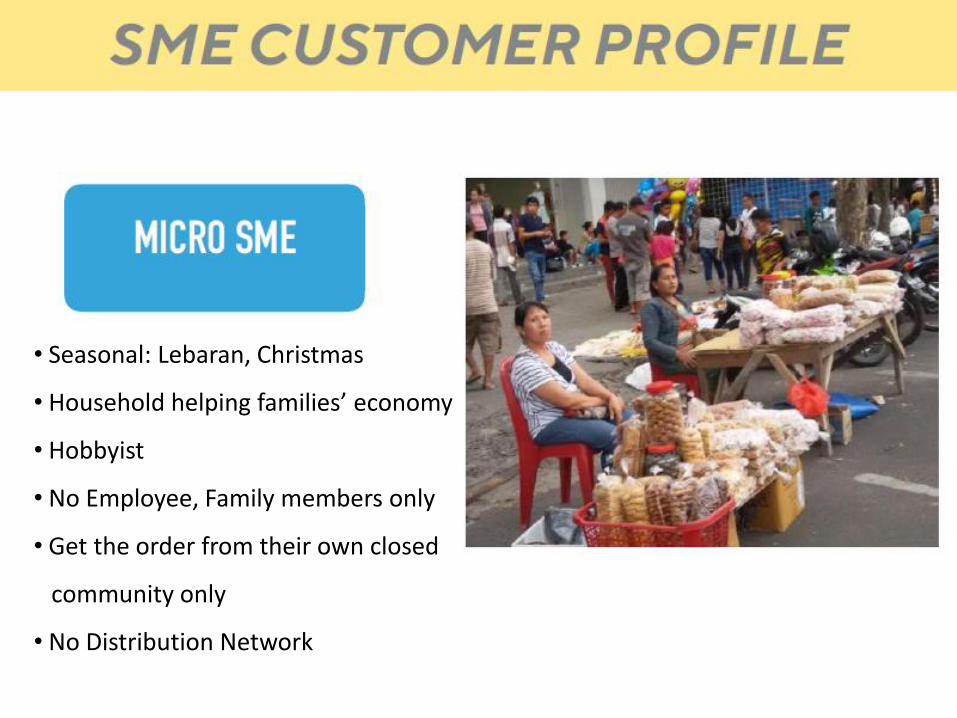
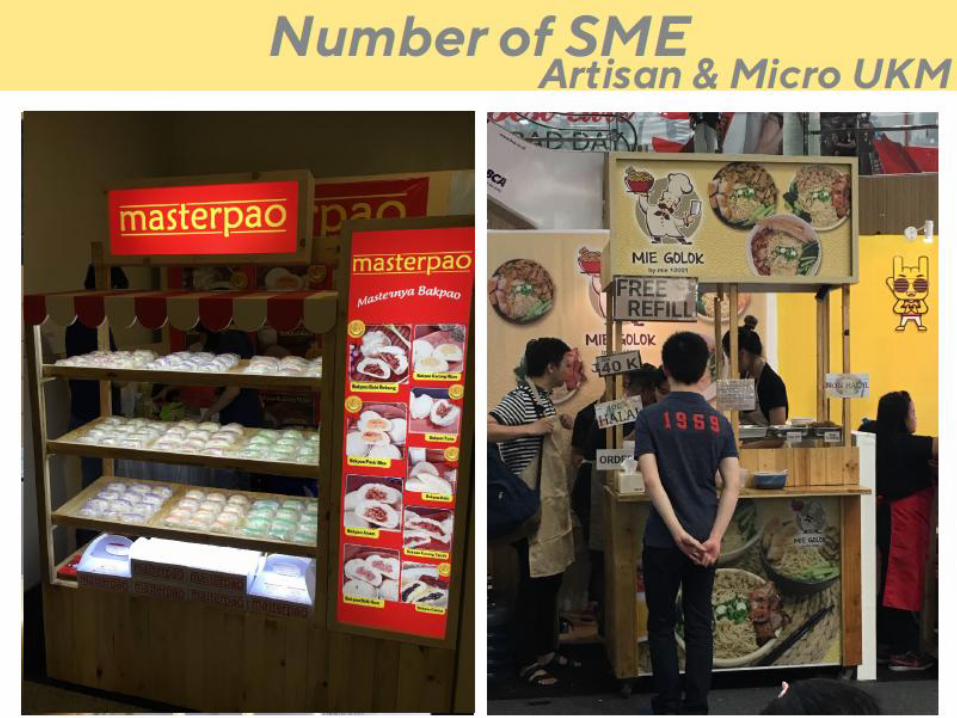
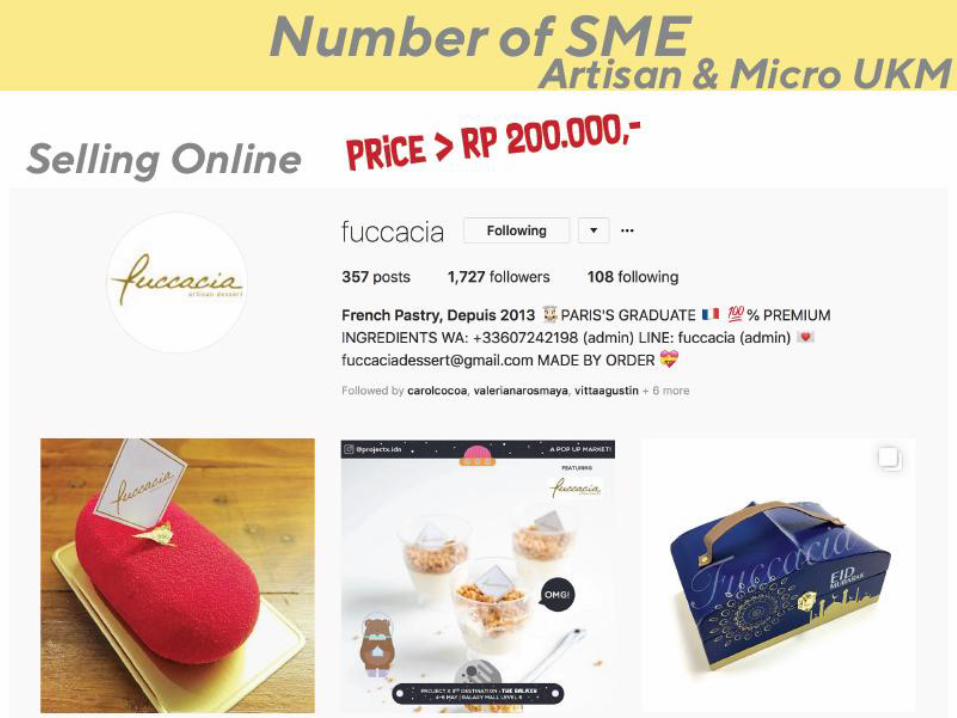
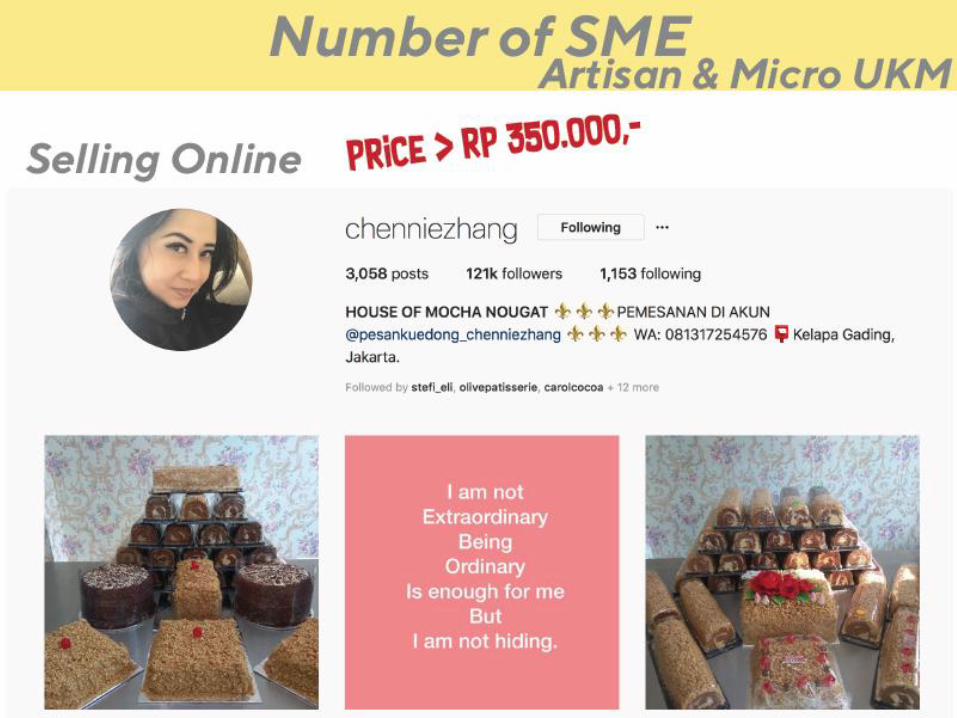
SME
11
• Seasonal: Lebaran, Christmas
• Household helping families’ economy
• Hobbyist
• No Employee, Family members only
• Get the order from their own closed
community only
• No Distribution Network
12
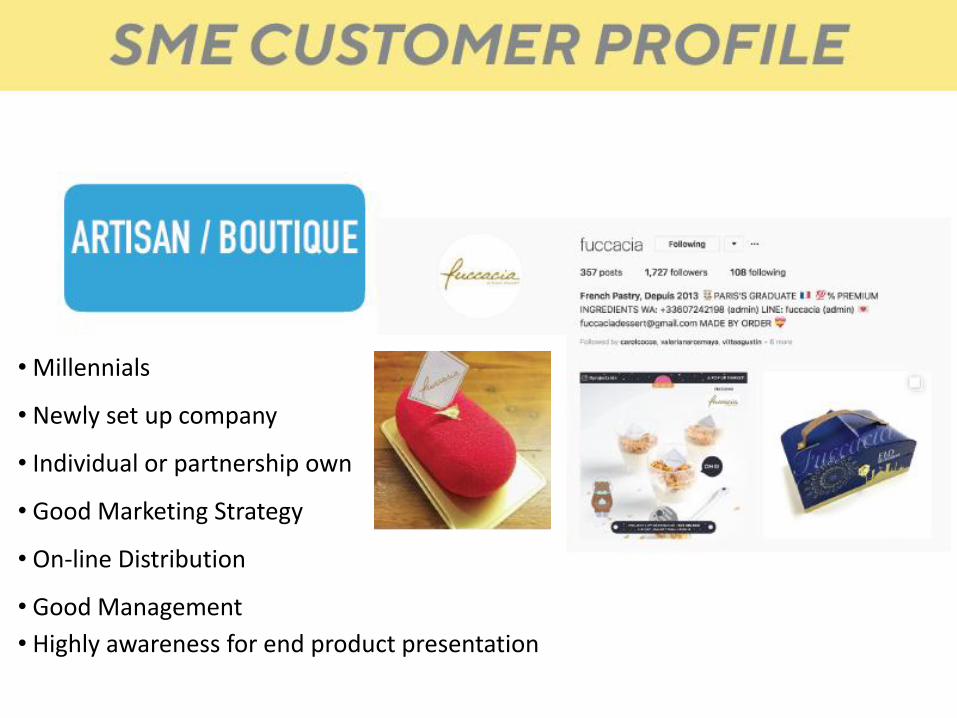
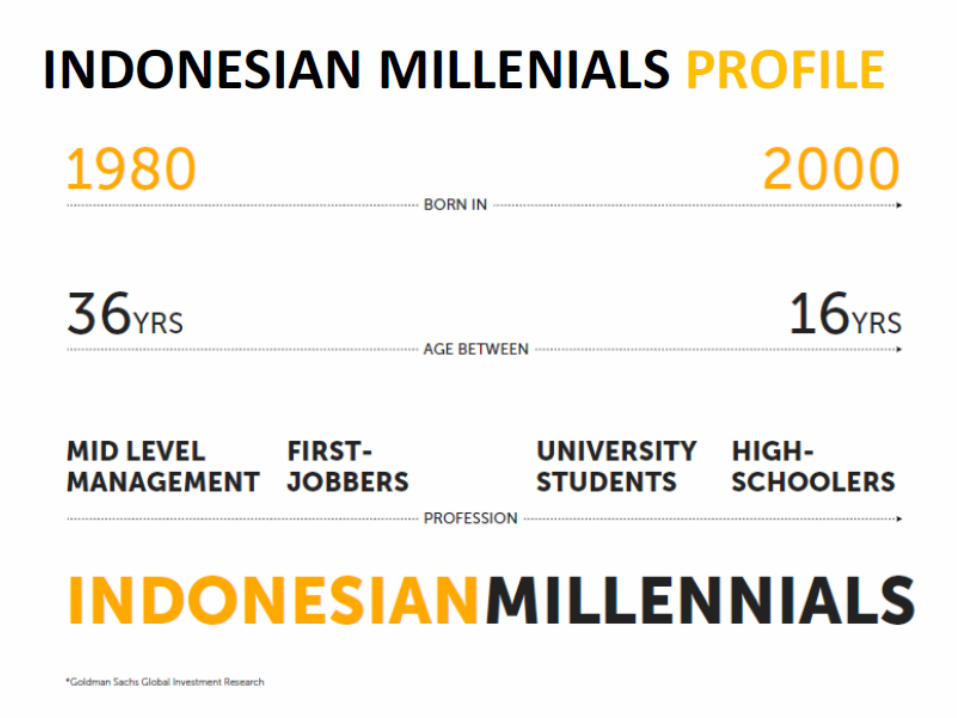
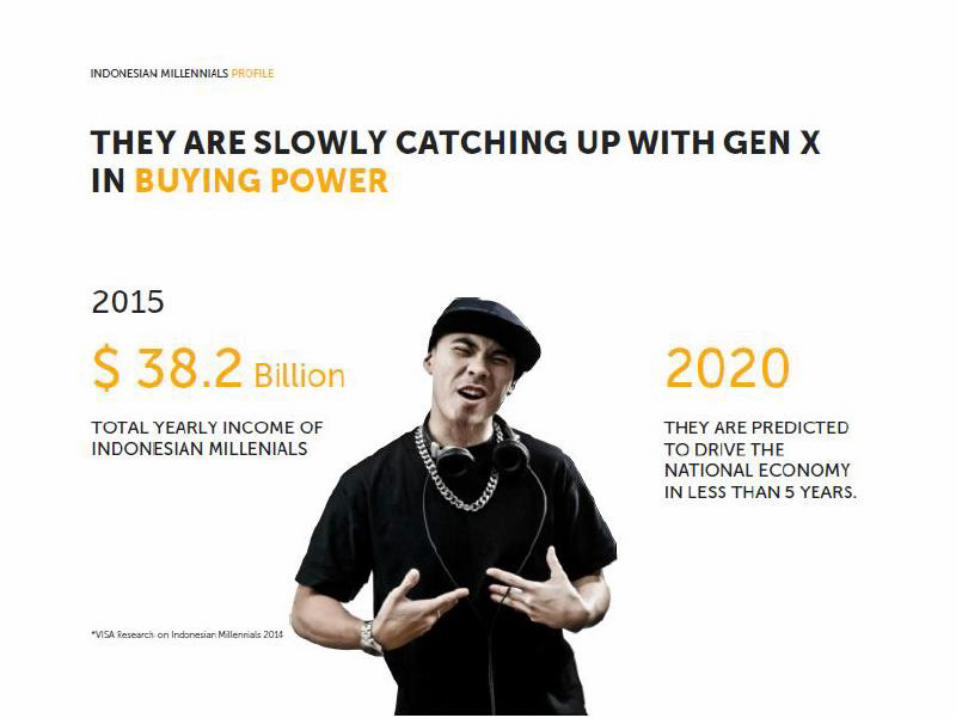
• Millennials
• Newly set up company
• Individual or partnership own
• Good Marketing Strategy
• On-line Distribution
• Good Management
• Highly awareness for end product presentation
13
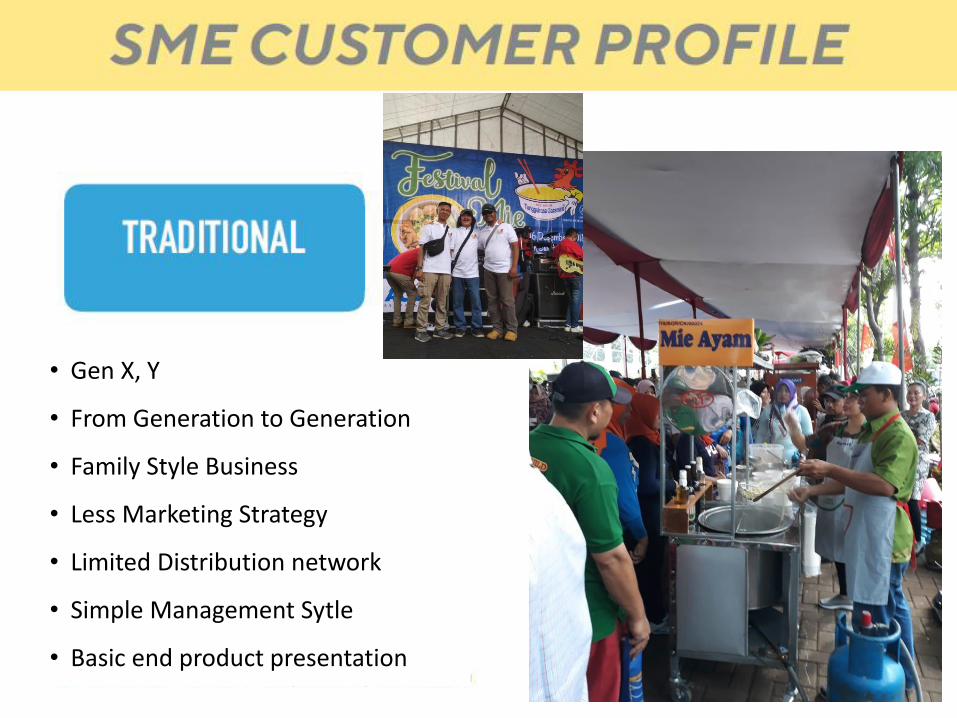
• Gen X, Y
• From Generation to Generation
• Family Style Business
• Less Marketing Strategy
• Limited Distribution network
• Simple Management Sytle
• Basic end product presentation
14
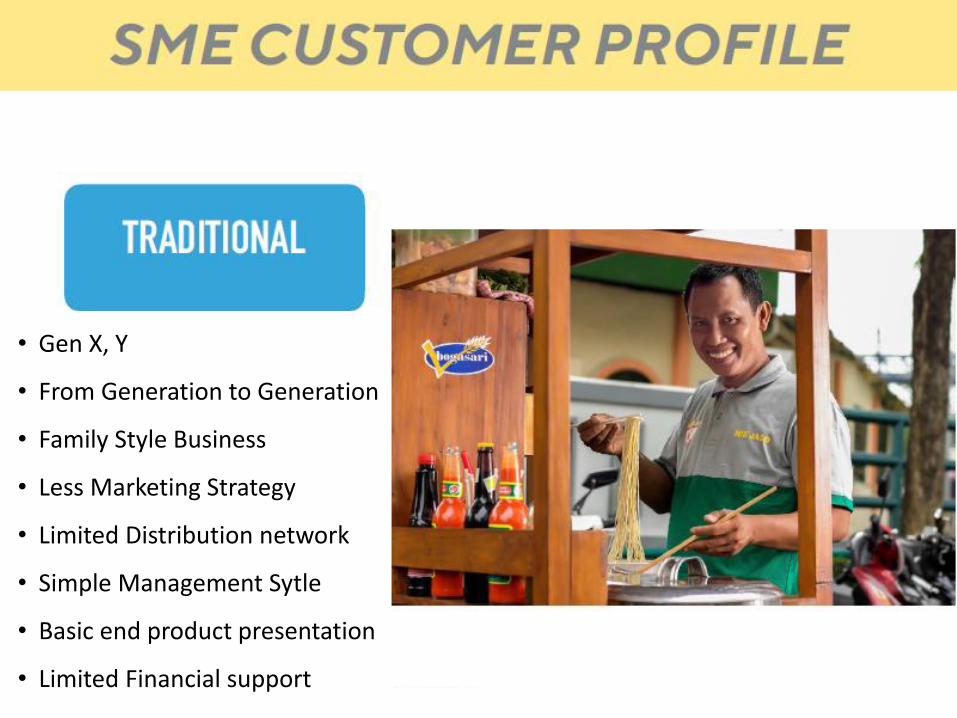
• Gen X, Y
• From Generation to Generation
• Family Style Business
• Less Marketing Strategy
• Limited Distribution network
• Simple Management Sytle
• Basic end product presentation
• Limited Financial support

15
• Gen X, Y
• Good Management
• Good Marketing Strategy
• Own Customer Network
• Legal Company
• Modern end product presentation
16
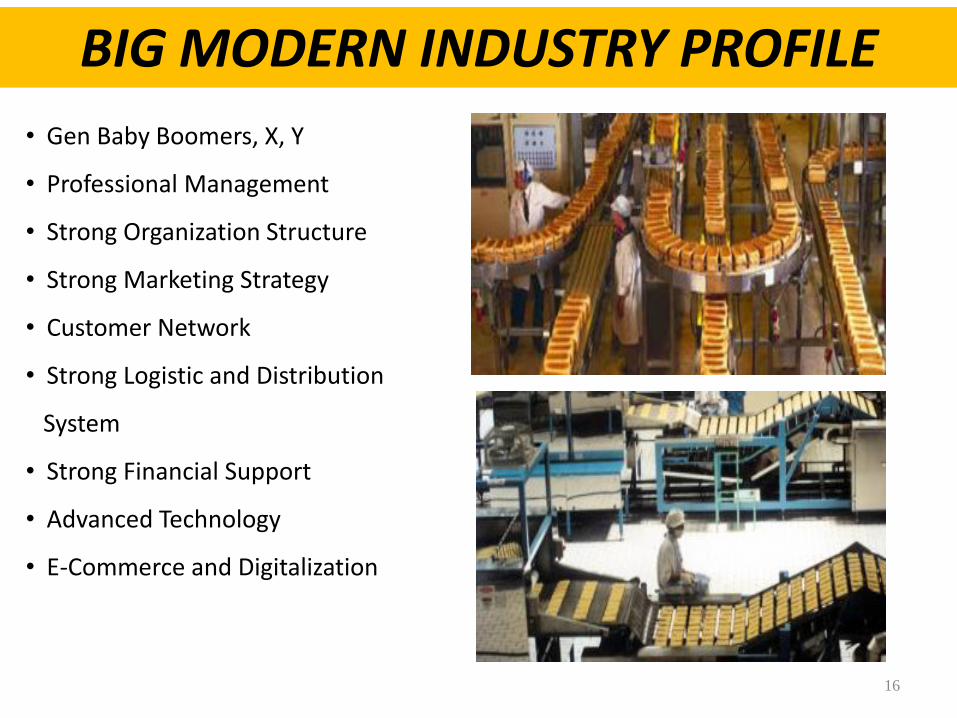
• Gen Baby Boomers, X, Y
• Professional Management
• Strong Organization Structure
• Strong Marketing Strategy
• Customer Network
• Strong Logistic and Distribution
System
• Strong Financial Support
• Advanced Technology
• E-Commerce and Digitalization
BIG MODERN INDUSTRY PROFILE

17
18
19
20

21
22
23

24
25

26
27

Copyri
ght
© 2
01
7 T
he
Nie
lsen
Com
pan
y.
Confi
denti
al
and p
ropri
eta
ry.
FLOUR CATEGORY AMONG SME
SME LOOK FOR CONSISTENT QUALITY AS THEY THINK IT IS IMPORTANT FOR CONSISTENCY &
CONTINUITY OF THEIR PRODUCTION
1. QUALITY
2. PRICE
3. AVAILABILITY
4. IMAGE
5. SERVICES
29
INDONESIAN WHEAT GRAIN IMPORT &
WHEAT FLOUR IMPORT
30
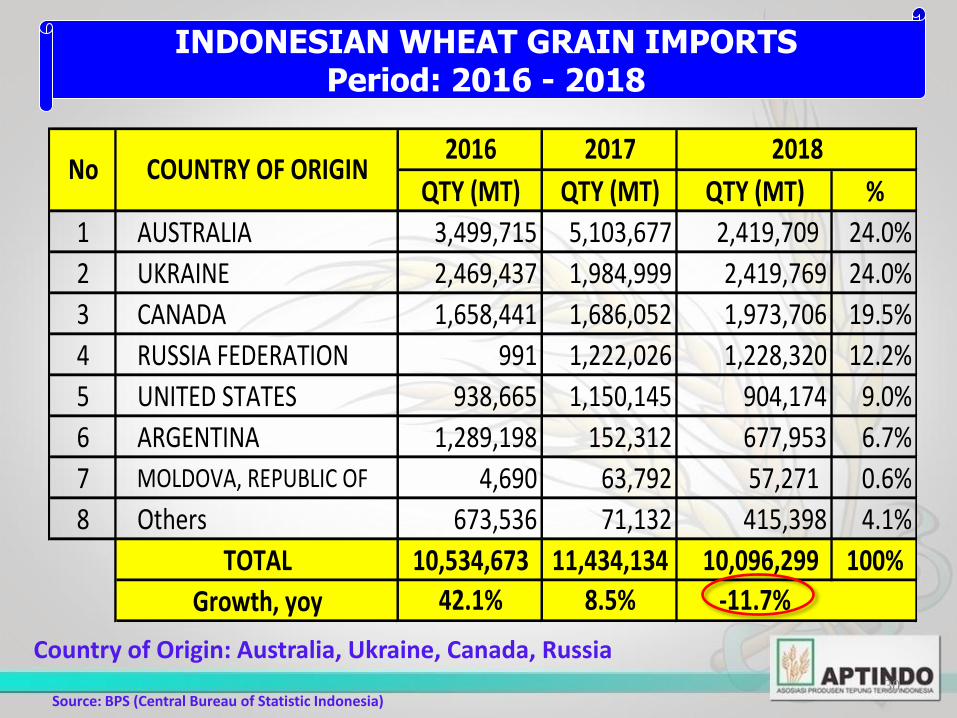
Country of Origin: Australia, Ukraine, Canada, Russia
Source: BPS (Central Bureau of Statistic Indonesia)
INDONESIAN WHEAT GRAIN IMPORTS Period: 2016 - 2018
QTY (MT) QTY (MT) QTY (MT) %
1 AUSTRALIA 3,499,715 5,103,677 2,419,709 24.0%
2 UKRAINE 2,469,437 1,984,999 2,419,769 24.0%
3 CANADA 1,658,441 1,686,052 1,973,706 19.5%
4 RUSSIA FEDERATION 991 1,222,026 1,228,320 12.2%
5 UNITED STATES 938,665 1,150,145 904,174 9.0%
6 ARGENTINA 1,289,198 152,312 677,953 6.7%
7 MOLDOVA, REPUBLIC OF 4,690 63,792 57,271 0.6%
8 Others 673,536 71,132 415,398 4.1%
TOTAL 10,534,673 11,434,134 10,096,299 100%
Growth, yoy 42.1% 8.5% -11.7%
2018No COUNTRY OF ORIGIN
2016 2017
31 31
Source: BPS (Central Bureau of Statistic Indonesia)
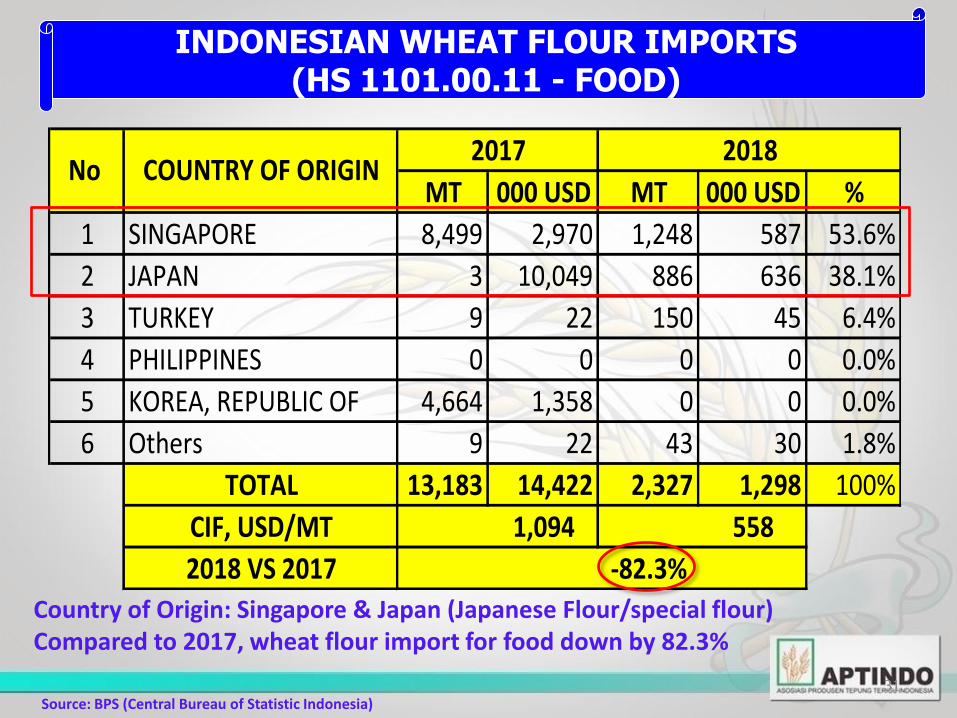
Country of Origin: Singapore & Japan (Japanese Flour/special flour) Compared to 2017, wheat flour import for food down by 82.3%
INDONESIAN WHEAT FLOUR IMPORTS (HS 1101.00.11 - FOOD)
MT 000 USD MT 000 USD %
1 SINGAPORE 8,499 2,970 1,248 587 53.6%
2 JAPAN 3 10,049 886 636 38.1%
3 TURKEY 9 22 150 45 6.4%
4 PHILIPPINES 0 0 0 0 0.0%
5 KOREA, REPUBLIC OF 4,664 1,358 0 0 0.0%
6 Others 9 22 43 30 1.8%
TOTAL 13,183 14,422 2,327 1,298 100%
CIF, USD/MT 1,094 558
2018 VS 2017 -82.3%
No COUNTRY OF ORIGIN2017 2018
32
INDONESIAN EXPORT OF: WHEAT FLOUR; BY PRPODUCT &
WHEAT FLOUR BASED PRODUCTS
33
Source: BPS (Central Bureau of Statistic Indonesia)
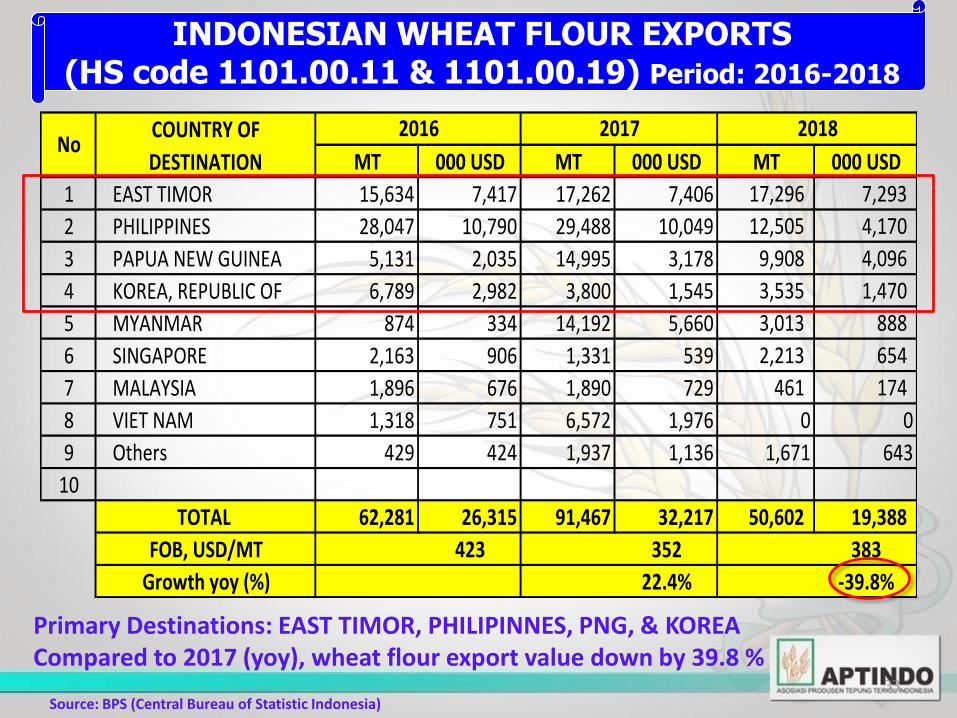
Primary Destinations: EAST TIMOR, PHILIPINNES, PNG, & KOREA Compared to 2017 (yoy), wheat flour export value down by 39.8 %
INDONESIAN WHEAT FLOUR EXPORTS (HS code 1101.00.11 & 1101.00.19) Period: 2016-2018
MT 000 USD MT 000 USD MT 000 USD
1 EAST TIMOR 15,634 7,417 17,262 7,406 17,296 7,293
2 PHILIPPINES 28,047 10,790 29,488 10,049 12,505 4,170
3 PAPUA NEW GUINEA 5,131 2,035 14,995 3,178 9,908 4,096
4 KOREA, REPUBLIC OF 6,789 2,982 3,800 1,545 3,535 1,470
5 MYANMAR 874 334 14,192 5,660 3,013 888
6 SINGAPORE 2,163 906 1,331 539 2,213 654
7 MALAYSIA 1,896 676 1,890 729 461 174
8 VIET NAM 1,318 751 6,572 1,976 0 0
9 Others 429 424 1,937 1,136 1,671 643
10
TOTAL 62,281 26,315 91,467 32,217 50,602 19,388
FOB, USD/MT 423 352 383
Growth yoy (%) 22.4% -39.8%
2017 2018No
COUNTRY OF
DESTINATION
2016
34 Source: BPS (Central Bureau of Statistic Indonesia)
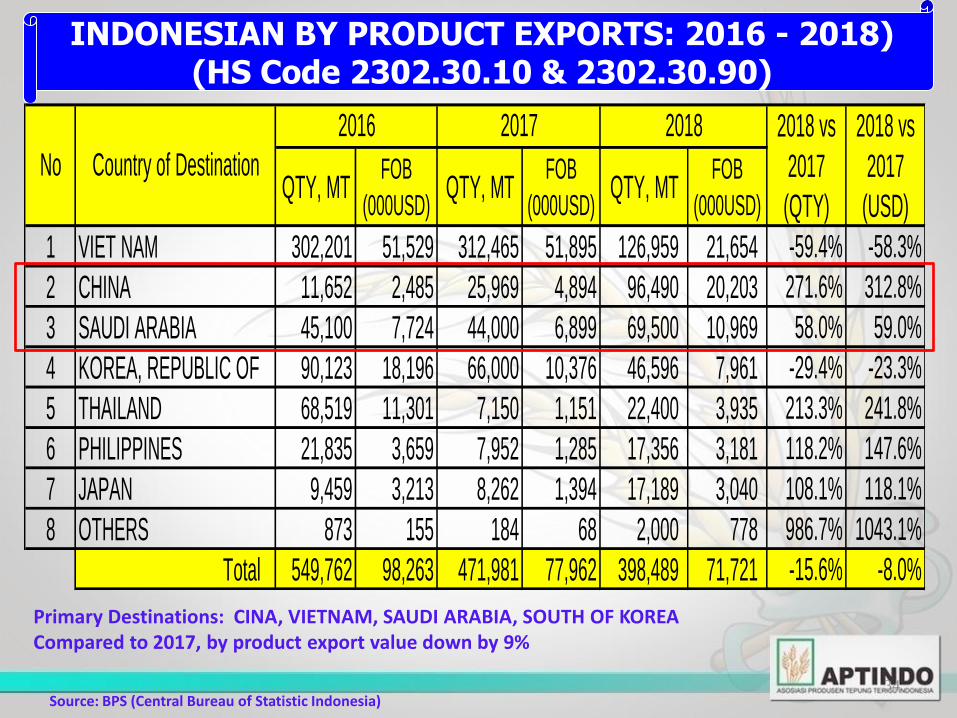
Primary Destinations: CINA, VIETNAM, SAUDI ARABIA, SOUTH OF KOREA Compared to 2017, by product export value down by 9%
INDONESIAN BY PRODUCT EXPORTS: 2016 - 2018) (HS Code 2302.30.10 & 2302.30.90)
QTY, MTFOB
(000USD)QTY, MT
FOB
(000USD)QTY, MT
FOB
(000USD)
1 VIET NAM 302,201 51,529 312,465 51,895 126,959 21,654 -59.4% -58.3%
2 CHINA 11,652 2,485 25,969 4,894 96,490 20,203 271.6% 312.8%
3 SAUDI ARABIA 45,100 7,724 44,000 6,899 69,500 10,969 58.0% 59.0%
4 KOREA, REPUBLIC OF 90,123 18,196 66,000 10,376 46,596 7,961 -29.4% -23.3%
5 THAILAND 68,519 11,301 7,150 1,151 22,400 3,935 213.3% 241.8%
6 PHILIPPINES 21,835 3,659 7,952 1,285 17,356 3,181 118.2% 147.6%
7 JAPAN 9,459 3,213 8,262 1,394 17,189 3,040 108.1% 118.1%
8 OTHERS 873 155 184 68 2,000 778 986.7% 1043.1%
Total 549,762 98,263 471,981 77,962 398,489 71,721 -15.6% -8.0%
2018 2018 vs
2017
(QTY)
2018 vs
2017
(USD)
No Country of Destination
2016 2017
35
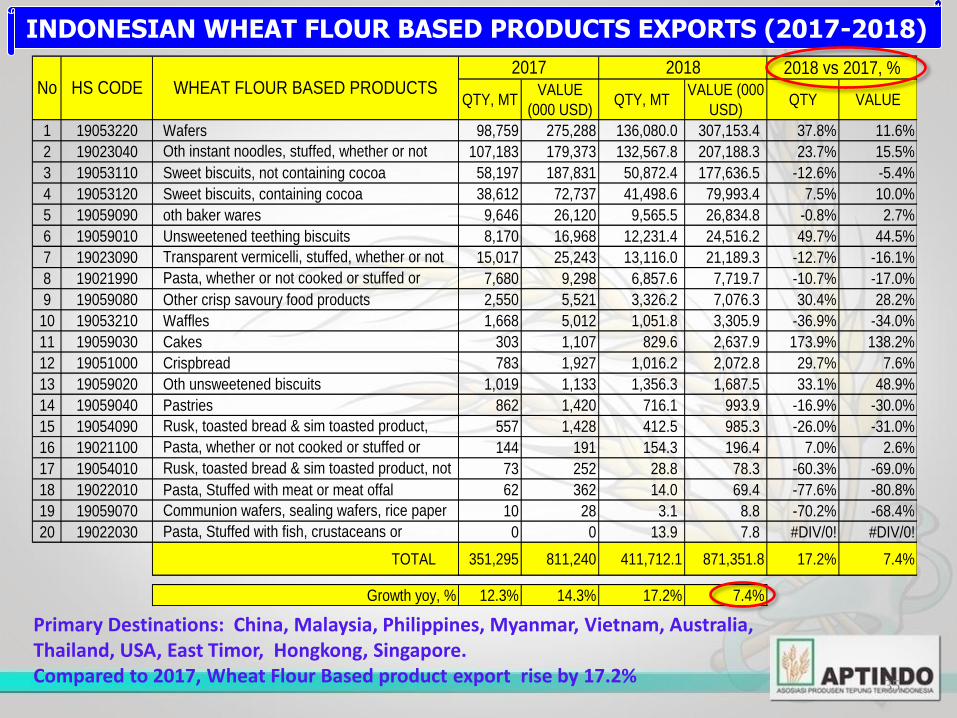
Primary Destinations: China, Malaysia, Philippines, Myanmar, Vietnam, Australia, Thailand, USA, East Timor, Hongkong, Singapore. Compared to 2017, Wheat Flour Based product export rise by 17.2%
INDONESIAN WHEAT FLOUR BASED PRODUCTS EXPORTS (2017-2018)
QTY, MTVALUE
(000 USD)QTY, MT
VALUE (000
USD)QTY VALUE
1 19053220 Wafers 98,759 275,288 136,080.0 307,153.4 37.8% 11.6%
2 19023040 Oth instant noodles, stuffed, whether or not
cooked or othwise prepared
107,183 179,373 132,567.8 207,188.3 23.7% 15.5%
3 19053110 Sweet biscuits, not containing cocoa 58,197 187,831 50,872.4 177,636.5 -12.6% -5.4%
4 19053120 Sweet biscuits, containing cocoa 38,612 72,737 41,498.6 79,993.4 7.5% 10.0%
5 19059090 oth baker wares 9,646 26,120 9,565.5 26,834.8 -0.8% 2.7%
6 19059010 Unsweetened teething biscuits 8,170 16,968 12,231.4 24,516.2 49.7% 44.5%
7 19023090 Transparent vermicelli, stuffed, whether or not
cooked or othwise prepared
15,017 25,243 13,116.0 21,189.3 -12.7% -16.1%
8 19021990 Pasta, whether or not cooked or stuffed or
otherwise prepared, other
7,680 9,298 6,857.6 7,719.7 -10.7% -17.0%
9 19059080 Other crisp savoury food products 2,550 5,521 3,326.2 7,076.3 30.4% 28.2%
10 19053210 Waffles 1,668 5,012 1,051.8 3,305.9 -36.9% -34.0%
11 19059030 Cakes 303 1,107 829.6 2,637.9 173.9% 138.2%
12 19051000 Crispbread 783 1,927 1,016.2 2,072.8 29.7% 7.6%
13 19059020 Oth unsweetened biscuits 1,019 1,133 1,356.3 1,687.5 33.1% 48.9%
14 19059040 Pastries 862 1,420 716.1 993.9 -16.9% -30.0%
15 19054090 Rusk, toasted bread & sim toasted product,
containing added sugar, honey, eggs, fats,
557 1,428 412.5 985.3 -26.0% -31.0%
16 19021100 Pasta, whether or not cooked or stuffed or
otherwise prepared, containing eggs
144 191 154.3 196.4 7.0% 2.6%
17 19054010 Rusk, toasted bread & sim toasted product, not
containing added sugar, honey, eggs, fats,
73 252 28.8 78.3 -60.3% -69.0%
18 19022010 Pasta, Stuffed with meat or meat offal 62 362 14.0 69.4 -77.6% -80.8%
19 19059070 Communion wafers, sealing wafers, rice paper
and similar products
10 28 3.1 8.8 -70.2% -68.4%
20 19022030 Pasta, Stuffed with fish, crustaceans or
molluscs
0 0 13.9 7.8 #DIV/0! #DIV/0!
TOTAL 351,295 811,240 411,712.1 871,351.8 17.2% 7.4%
Growth yoy, % 12.3% 14.3% 17.2% 7.4%
2018 2018 vs 2017, %No HS CODE WHEAT FLOUR BASED PRODUCTS
2017
36 36
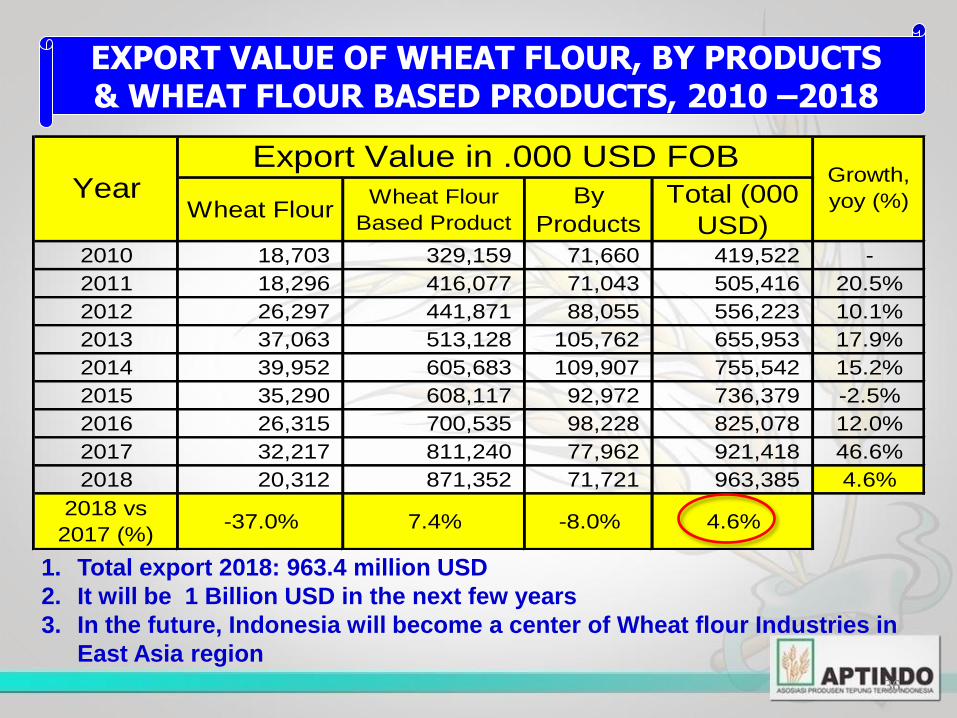
1. Total export 2018: 963.4 million USD
2. It will be 1 Billion USD in the next few years
3. In the future, Indonesia will become a center of Wheat flour Industries in
East Asia region
EXPORT VALUE OF WHEAT FLOUR, BY PRODUCTS & WHEAT FLOUR BASED PRODUCTS, 2010 –2018
Wheat FlourWheat Flour
Based Product
By
Products
Total (000
USD)2010 18,703 329,159 71,660 419,522 -
2011 18,296 416,077 71,043 505,416 20.5%
2012 26,297 441,871 88,055 556,223 10.1%
2013 37,063 513,128 105,762 655,953 17.9%
2014 39,952 605,683 109,907 755,542 15.2%
2015 35,290 608,117 92,972 736,379 -2.5%
2016 26,315 700,535 98,228 825,078 12.0%
2017 32,217 811,240 77,962 921,418 46.6%
2018 20,312 871,352 71,721 963,385 4.6%
2018 vs
2017 (%)-37.0% 7.4% -8.0% 4.6%
YearExport Value in .000 USD FOB
Growth,
yoy (%)
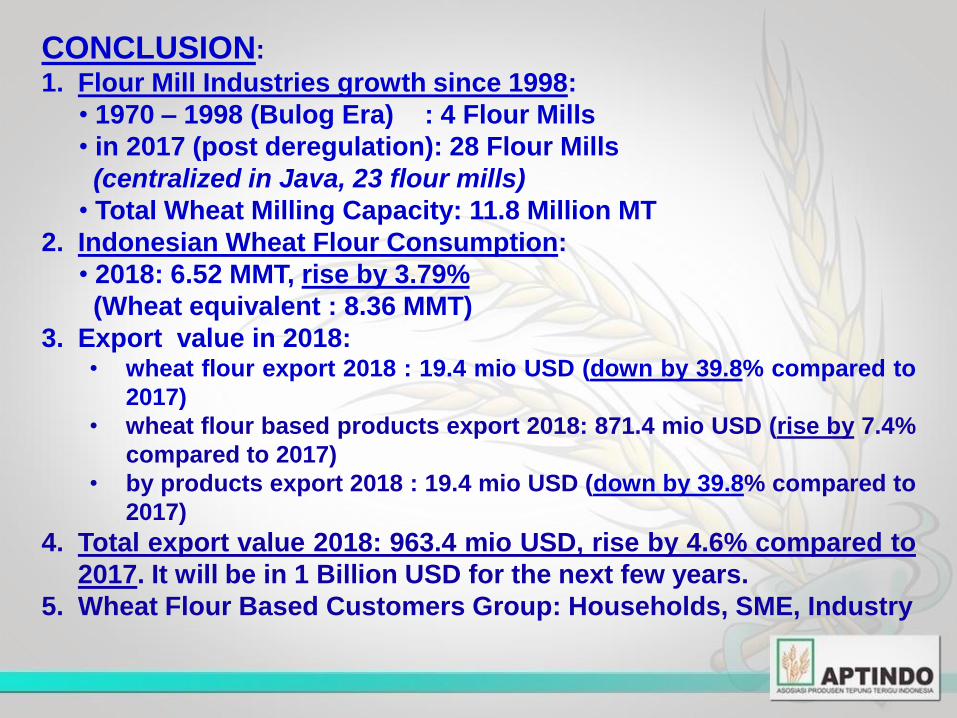
CONCLUSION:
1. Flour Mill Industries growth since 1998:
• 1970 – 1998 (Bulog Era) : 4 Flour Mills
• in 2017 (post deregulation): 28 Flour Mills
(centralized in Java, 23 flour mills)
• Total Wheat Milling Capacity: 11.8 Million MT
2. Indonesian Wheat Flour Consumption:
• 2018: 6.52 MMT, rise by 3.79%
(Wheat equivalent : 8.36 MMT)
3. Export value in 2018: • wheat flour export 2018 : 19.4 mio USD (down by 39.8% compared to
2017)
• wheat flour based products export 2018: 871.4 mio USD (rise by 7.4%
compared to 2017)
• by products export 2018 : 19.4 mio USD (down by 39.8% compared to
2017)
4. Total export value 2018: 963.4 mio USD, rise by 4.6% compared to
2017. It will be in 1 Billion USD for the next few years.
5. Wheat Flour Based Customers Group: Households, SME, Industry
38