
First Horizon National Corporation -...
41
1 First Horizon National Corporation Barclays Global Financial Services Conference September 16, 2009
Transcript of First Horizon National Corporation -...

1
First Horizon National Corporation
Barclays Global Financial Services ConferenceSeptember 16, 2009

2
Portions of this presentation use non-GAAP financial information. Each of those
portions is so noted, and a reconciliation of that non-GAAP information to comparable
GAAP information is provided in a footnote or in the appendix at the end of this
presentation.
This presentation contains forward-looking statements, which may include guidance,
involving significant risks and uncertainties which will be identified by words such as
“believe” “expect” “anticipate” “intend” “estimate” “should” “is likely” “will” “going
forward” and other expressions that indicate future events and trends and may be
followed by or reference cautionary statements. A number of factors could cause
actual results to differ materially from those in the forward-looking
information. These factors are outlined in our recent earnings and other press
releases and in more detail in the most current 10-Q and 10-K. First Horizon
disclaims any obligation to update any of the forward-looking statements that are
made from time to time to reflect future events or developments.

3
Back to the Future: Repositioning FHN on Track
Winding down national lending businesses
Returning company to sustained profitability
Driving shareholder returns over the long-term

4
Strategic Actions Since December 2007
Attractive Growth
Opportunities
Industry-Leading Strengths
Ceased national originations in Jan 2008Sold national mortgage platform in Sept 2008Shrunk balance sheet by 22% Retired $8B in debt through balance sheet reduction and growth in core deposits
AbilityTo
Execute
Raised $690mm common equity in May 2008TARP CPP of $866mm in Nov 2008Tier 1 ratio has improved from 8.1% to 15.6%TCE / TA up from 5.1% to 7.3%
Leading JD Power Ranking in Tennessee2
Hired talent to grow market share in TNImplemented line of business structure to enhance performance and profitability
Strong Capital Position1
Strong Regional Banking Franchise
Focused Capital Markets Business Distribution platform and low balance sheet usage drives higher risk-adjusted returnsCurrent market conditions demonstrate counter-cyclical nature of businessesHigher market share from competitive disruption and new hires
1Tier 1 Common, TCE, & TA are non-GAAP numbers, and a reconciliation is provided in the appendix. 2Power 2009 Retail Banking Satisfaction Study: Customer Satisfaction Index, Southeast Region. Rankings. First Tennessee ranked #2 in overall study.
Reducing Risk
Proactive on Asset Quality Reserve coverage ratio up from 1.55% to 4.91%Early identification of problems loans driving recent NPA slow down
5
Keys for Returning Company to Sustained Profitability
Continuing net interest margin improvement
Higher loan spreads
Improved deposit rates
Reduced adverse impact from non-accruals as national lending businesses wind-down
Abating environmental costs
Elevated expense from foreclosure, repurchase reserves and FDIC special
assessment
Reducing level of total provision (charge offs and reserves)
Realizing benefits of productivity and efficiency efforts
Offsetting normalizing capital markets revenues over time

6
$0
$200
$400
$600
$800
$1,000
$1,200
$1,400
1Q08 2Q08 3Q08 4Q08 1Q09 2Q09
$ M
illio
ns
NPLs ORE
Asset Quality Overview
Proactive management of credit quality remains top priority
Wind-down of national portfolios remains on track
65% of NPLs from OTC & National CRE in 2Q09
Home equity delinquency trends stabilizing
Income CRE and C&I softening as expected
Reserve increases in Income CRE and C&I in 2Q09
128155
191 208239
92
185 8992 20
2.59%
3.52%
3.99%
4.57%4.91%
0
50
100
150
200
250
300
350
400
2Q08 3Q08 4Q08 1Q09 2Q09
$ M
illio
ns
0.00%
0.50%
1.00%
1.50%
2.00%
2.50%
3.00%
3.50%
4.00%
4.50%
5.00%
Net Charge-Offs Reserve Increase Reserve % of Loans (right axis)
Reserves Strong, Growth SlowingNon-Performing Assets Flattening
43%
16%
14%8% (2)%

7
First Half 2009Trends generally consistent with previously communicated expectations2Q09: Total charge-offs in line; reserve build driven by C&I, Income CRE, Perm Mortgage
Second Half 2009Expectations generally consistent with prior viewsWind-down of national specialty portfolio should drive sequentially lower charge-offs and reservesContinued stress anticipated in Income CRE and C&I, particularly bank-related exposures
Credit Expectations and Risks Summary
1Other includes permanent mortgage, other consumer, and credit card. Expectations as of 7/17/09.
Balance
Portfolio6/30/09
($B)4Q08
(Actual)1Q09 Actual
2Q09 Actual
2H09 Expected
4Q08(Actual)
1Q09 Actual
2Q09 Actual
2H09 Expected
Residential CRE $1.0 $55 $56 $46 $106 $97 $97
One-Time Close 0.6 40 47 51 201 183 164
Home Equity 7.4 35 46 56 182 233 223
Commercial 7.4 41 30 27 192 228 251
Income CRE 1.9 14 17 31 94 101 108
Other1 1.4 6 13 28 74 99 118
Total $191 $208 $239 $849 $941 $961
2H09 expectations are relative to 2Q09 actual levels.
Net Charge-Offs ($mm) Allowance
8
Regional Banking

9
Strong Tennessee Franchise in Diverse Economy
Strategy emphasizes competitive advantages in Convenience, Advice, and Service
180 financial centers
$10B loans / $11B deposits1
GAALMS
AR
MOKY
NC
SC
TENNESSEEMid-South(#1)
Middle(#5)
Southeast(#2)
East(#1)
Northeast(#1)
Customer Service-TN Competitors2
734
735
746
746
746
756
767
788
700 725 750 775 800
Bank A
Bank B
SE Region Avg.
Bank C
Bank D
Bank E
Bank F
First Tennessee
1At 6/30/09 2JD Power 2009 Retail Banking Satisfaction Study: Customer Satisfaction Index, Southeast Region. Rankings. First Tennessee ranked #2 in overall study.
Top 3 TN Competitors
Deposit growth
Pricing Management
Productivity/Process Improvement
Efficiency
Asset quality
Leading Customer Market Share in Tennessee
Regional Banking Priorities

10
Regional Banking Restructure Improves Focus on Customers, Productivity, and Profitability
Retail
Business Banking
Commercial
Private Client/Wealth Management
Mid-South
Middle
TN
Southeast
TN
East
TN
Northeast
TN
Customer Relationships Go to Market ExecutionManagement of sales forceP&L Responsibility
Market
LOB StrategySales/Service EffectivenessGoals & IncentivesDelivery/TechnologyProduct OfferingsP&L Responsibility
Line of Business
Corporate
Improved performance disciplineConsistent execution across geographiesScalability to potential new markets
Commercial Real Estate

11
Capital Markets

12
Capital Markets Demonstrates Value to FHN Strategy
27%33%
41%
24%
83%
69%80%
20%
40%
60%
80%
100%
120%
4Q07
1Q08
2Q08
3Q08
4Q08
1Q09
2Q09
1Capital Markets return on capital excludes correspondent banking, a non-GAAP number; a reconciliation is provided in the appendix. .
Capital Markets: High Return on Capital1
High normalized return on equity
Counter-cyclical to regional banking business
Significant contributor to fee income as a percent of total revenue
$0.0
$0.5
$1.0
$1.5
$2.0
$2.5
$3.0
$3.5
1Q052Q053Q054Q051Q062Q063Q064Q061Q072Q073Q074Q071Q082Q083Q084Q081Q092Q09
4.00%
4.20%
4.40%
4.60%
4.80%
5.00%
5.20%
5.40%Regional Bank NIM (right axis)Fixed Income Correlation = -86%
Fixed Income Average Daily Revenue (left axis)
Fixed Income’s Counter-Cyclicality to Regional Banking
13
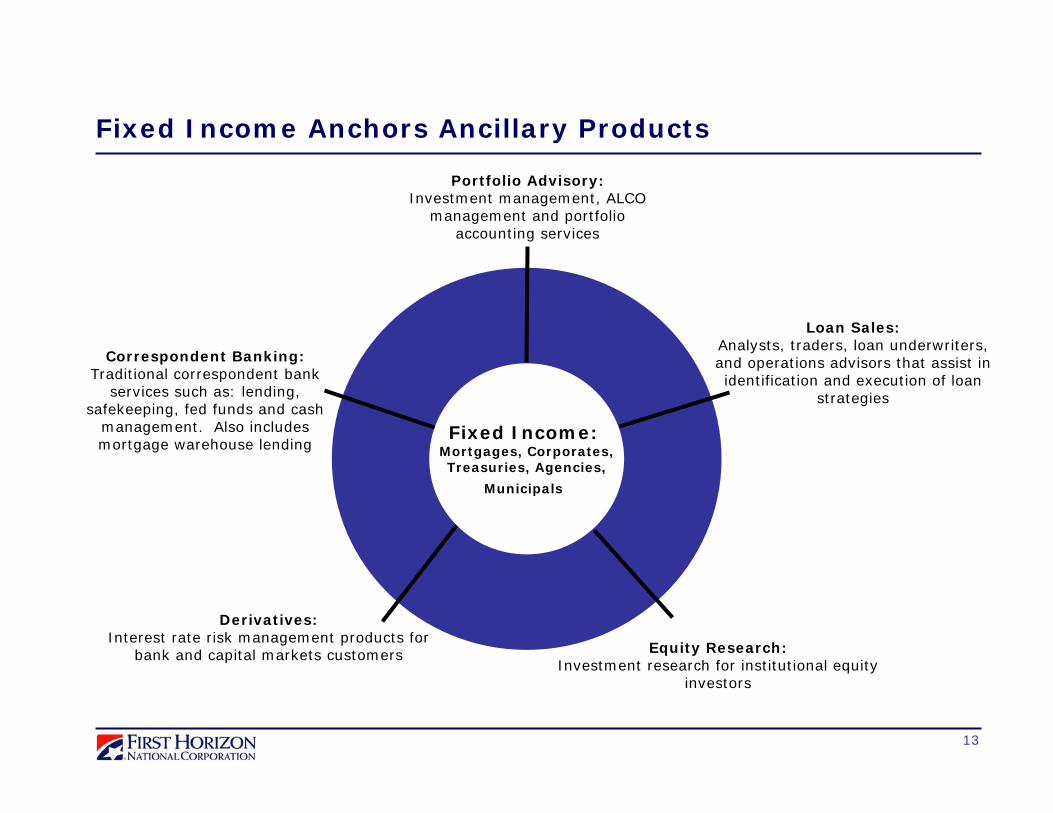
Fixed Income Anchors Ancillary Products
Equity Research:Investment research for institutional equity
investors
Loan Sales:Analysts, traders, loan underwriters, and operations advisors that assist in identification and execution of loan
strategies
Correspondent Banking:Traditional correspondent bank
services such as: lending, safekeeping, fed funds and cash
management. Also includes mortgage warehouse lending
Fixed Income: Mortgages, Corporates,Treasuries, Agencies,
Municipals
Derivatives:Interest rate risk management products for
bank and capital markets customers
Portfolio Advisory:Investment management, ALCO
management and portfolio accounting services

14
Capital Markets’ Diverse Client Base
Depositories40%
Non-Depositories1
60%
1 Non-Depositories includes Money Managers, Insurance Companies, Public Funds and Other Customer Types.
Geographic Distribution of Domestic Clients Revenue by Customer Type at 2Q09
FTN Financial does business with more than one-third of all banks in the U.S.

15
Significant Opportunities For More Focused First Horizon

16
Key Areas of Focus for FHN
Gaining market share in Middle TN
Leverage existing infrastructure to grow deposits
Targeting affluent market
Migration of affluent branch customers to private client network to maximize
profitability
Improving efficiency and productivity
Company-wide effort to operate more efficiently through expense control
Process transformation to improve productivity

17
Key Area of Focus: Middle TN Market
50 branch Locations
Opportunity to develop branch network for higher customer share
25 branches built since 2003
Leverage de novo delivery system
Key new hires to expand relationships
Attractive market demographics
FT 10%
$34
$63
$50
$24.0
$32.0
$40.0
$48.0
$56.0
$64.0
FTB Branch FTB MatureBranch
CompetitorMature Branch
$m
m
Middle TN Average Deposits Per Branch1
First Tennessee Branch Share
First Tennessee Customer Share
FT 16%
First Tennessee FDIC Deposit Share
FT 7%
.1 FDIC data as of June 30, 2008. Mature branch represents branch older than 5 years in Middle TN.
18
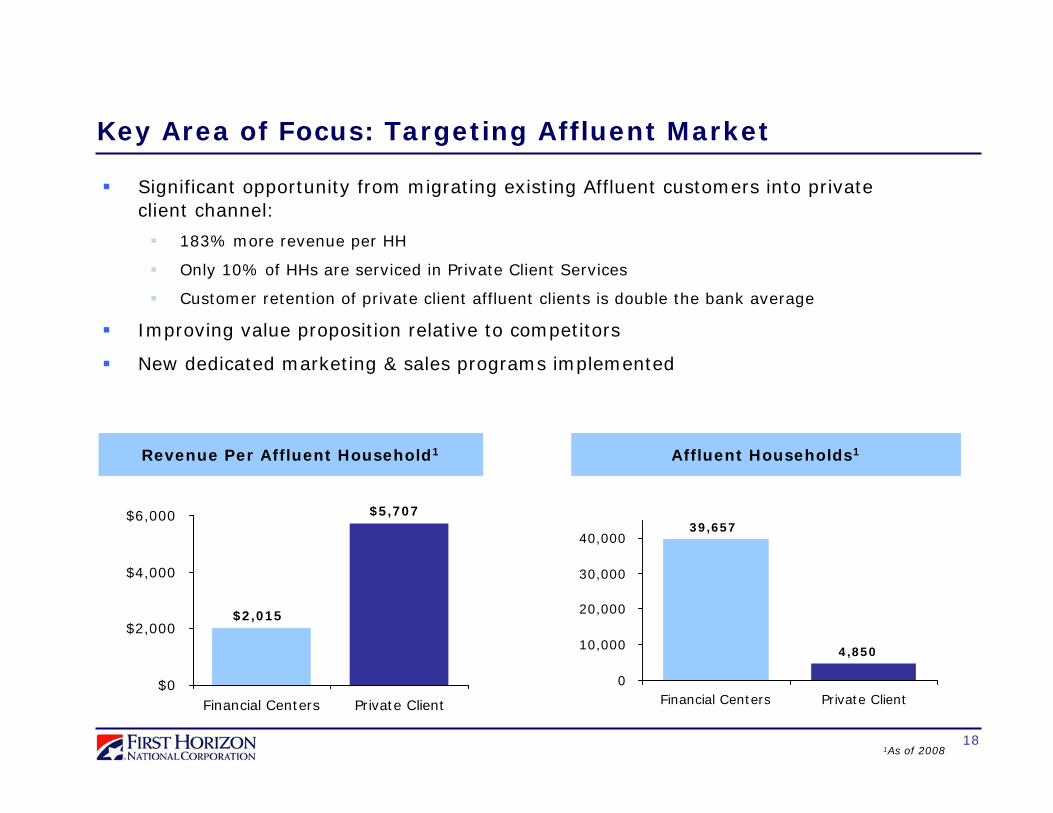
Significant opportunity from migrating existing Affluent customers into private client channel:
183% more revenue per HH
Only 10% of HHs are serviced in Private Client Services
Customer retention of private client affluent clients is double the bank average
Improving value proposition relative to competitors
New dedicated marketing & sales programs implemented
Key Area of Focus: Targeting Affluent Market
$5,707
$2,015
$0
$2,000
$4,000
$6,000
Financial Centers Private Client
4,850
39,657
0
10,000
20,000
30,000
40,000
Financial Centers Private Client
1As of 2008
Revenue Per Affluent Household1 Affluent Households1

19
Company-wide effort to operate more efficiently through expense control
Environmental costs should be significantly reduced over long-term and wind-down costs should be eliminated
Targeting approximately $50mm-$75mm in efficiency initiatives to reduce core run rate, in addition to reduced environmental costs
Key Area of Focus: Improving Efficiency
40%
50%
60%
70%
80%
90%
100%
2Q09Efficiency
Ratio
EnvironmentalCosts
Wind-DownBusinesses
NormalizedNIM
NormalizedFees
EfficiencyInitiaitves
TargetEfficiency
Ratio
84%
60-65%
Impact to Efficiency Ratio:
20
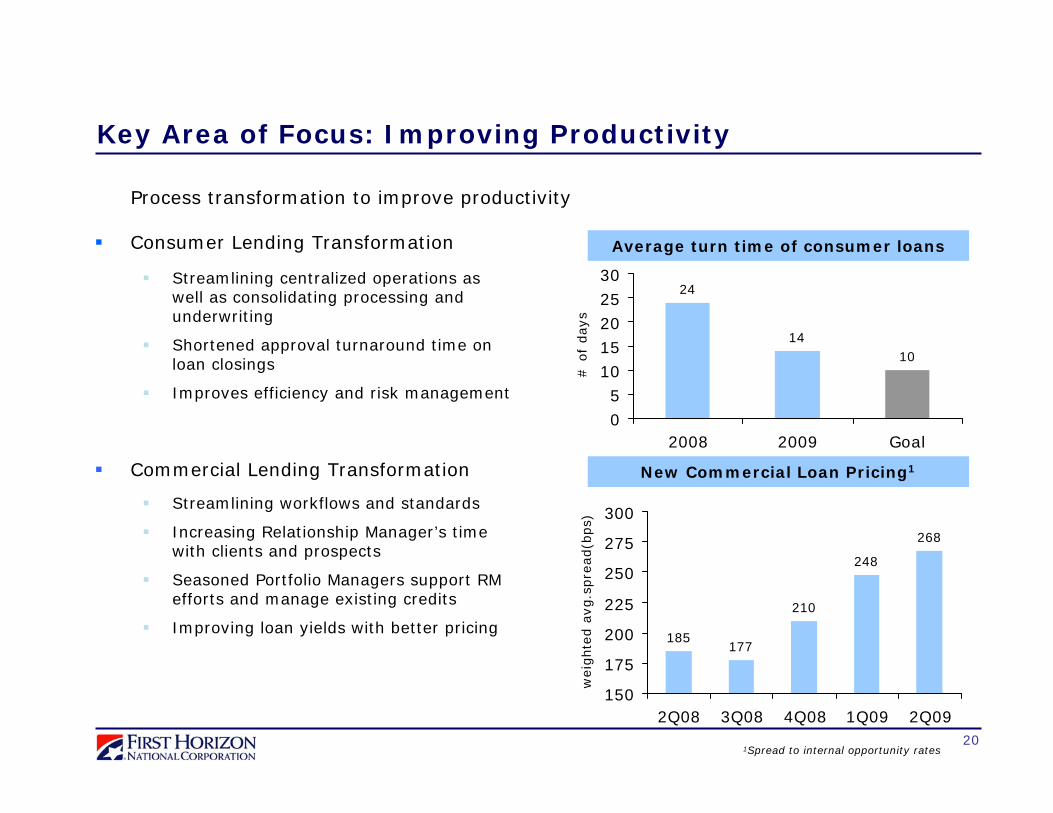
185177
210
248
268
150
175
200
225
250
275
300
2Q08 3Q08 4Q08 1Q09 2Q09
weig
hte
d a
vg.s
pre
ad(b
ps)
24
1410
05
1015202530
2008 2009 Goal
# o
f days
1Spread to internal opportunity rates
Average turn time of consumer loans
New Commercial Loan Pricing1
Consumer Lending Transformation
Streamlining centralized operations as well as consolidating processing and underwriting
Shortened approval turnaround time on loan closings
Improves efficiency and risk management
Key Area of Focus: Improving Productivity
Process transformation to improve productivity
Commercial Lending Transformation
Streamlining workflows and standards
Increasing Relationship Manager’s time with clients and prospects
Seasoned Portfolio Managers support RM efforts and manage existing credits
Improving loan yields with better pricing

21
Alternatives for Deploying Excess Capital for Optimal Return
Internal Investors External
Deployable Capital
Risk appropriate loan growth
Product development in capital markets
Technology infrastructure
Branch expansion
Repay TARP CPP Preferred
Reinstitute cash dividend on common
Share buyback
FDIC-assisted transactions of distressed franchises
Proactive strategic acquisitions
Complementary lines of business

22
Path to Driving Long-Term Returns & Profitability
Total Assets Earning Assets
Return on Assets Pre-tax Income 1.25% - 1.45% Net Interest Margin
3.50% - 4.00%
Tax Rate
Annualized Net Charge-Offs0.3% - 0.7%
Return on Equity15% - 20%
% Fee Income40% - 50%
Equity / Assets TCE / TA6% - 7%
Efficiency Ratio60% - 65%
Risk Adjusted Margin

23
Appendix
All financials in Appendix are as of 6/30/09, unless otherwise noted.

24
Segment Structure Reflects Strategic Focus
FIRST HORIZON NATIONAL CORPORATION
RegionalBanking
RetailOrigination
Servicing
CorrespondentBanking
Fixed Income
Other Products
Commercial
CorporateFunctions
InvestmentPortfolio
RiskManagement
ConsumerLending
ConstructionLending
CapitalMarkets
CorporateNationalSpecialtyLending
MortgageBanking
Core Business Wind-Down / Liquidating Businesses
Business Banking
PC/Wealth Management
Corporate
CRE

25
Actual Actual Actual Hypothetical4Q08 1Q09 2Q09 4Q10
Tier 1 15.0% 15.0% 15.6% 14.6%
Tier 1 Common 9.6% 9.4% 9.6% 8.6%
TCE/TA 7.3% 7.1% 7.3% 6.6%
TCE/RWA 8.8% 8.6% 8.7% 7.9%
Capital Analysis Demonstrates Balance Sheet Strength
Loan Loss AssumptionsAssumptions
Capital Ratios3
Illustrates expected strong 2010 year-end capital ratios based on severe economic conditions Pre-tax, pre-provision income at current broker estimates2
Loan losses at reported SCAP median rates by category under more adverse scenario$2.5B asset reduction (wind-down), assumes RWA decline by $1.8B from 4Q08Ending ALLL at 2.00% of loansTax rate of 35%
Tier 1 Common Roll-Forward
8.5%9.6%
3.5
1.1
0.8 (0.6)
(5.7)
0.0%
1.0%
2.0%
3.0%
4.0%
5.0%
6.0%
7.0%
8.0%
9.0%
10.0%
4Q08 Loan Losses PTPPEarnings
ReserveRelease
B/SShrinkage
Dividends /Warrant
4Q10
1Source: Federal Reserve SCAP: Overview of Results. 2PTPP assumptions based on ThomsonOne broker estimates; average of BAC-ML, FBR, Credit Suisse, FIG, Fox-Pitt, Sterne Agee, Stifel Nicolaus, SunTrust RH, & Wunderlich as of 7/9/09. FHN does not provide earnings estimates & has not endorsed these or any other broker estimates.
3Tier 1 Common, TCE, and TA are non-GAAP numbers, and a reconciliation is provided on page 39 of the Appendix.
Hypothetical Illustration
12/31/2008 2009-10Loans ($mm) Loss Rate1
C&I 7,806 5.8%Income CRE 1,988 10.6%Res CRE 1,288 16.5%Home Equity 7,749 13.3%OTC 981 16.5%Permanent Mortgage 1,127 8.0%Other 339 22.3%
Total 21,278 10.5%

26
2Q09Peer
4Q08 1Q09 2Q09 Median
Total Capital 15.2% 20.2% 20.8% 14.0%
Tier 1 Capital 15.0% 15.0% 15.6% 11.6%
TCE/TA 7.3% 7.1% 7.3% 5.9%
TCE/RWA 8.8% 8.6% 8.7% 7.3%
Liquidity and Capital Remain Strong
0.0%
2.0%
4.0%
6.0%
8.0%
10.0%
12.0%
14.0%
4Q08 1Q09 2Q09 2Q09 PeerMedian
Tangible Common Equity Reserves
Numbers may not add to total due to rounding.1Peer median includes Top 50 banks at 2Q09 as of 8/10/09. TCE and TA are considered non-GAAP, and a reconciliation is provided at the end of this presentation
2Excluding Securities Sold Repos, Trading Liabilities, and sub-debt and other collateralized borrowings of $4.0B.
TCE + Reserves / RWA1
12.3% 12.6% 13.1%
9.8%
Liquidity
Wholesale Funding2 — P/E Balances ($B) Capital Ratios1
Continued core deposit growth
Asset reductions, deposit growth offsetting debt maturities
Retired ~$700mm of debt in 2Q09
Wholesale funding in non-credit sensitive sources
2Q08 1Q09 2Q09Fed Funds Purchased $1.4 $1.4 $1.4Street CDs Long Term 1.0 0.5 0.5 Bank Notes 3.0 1.8 1.0 X-Notes 1.3 - - Insured Network Deposits 1.2 1.1 1.4 CDARs - - 0.1 Borrowing from FRB (TAF) 2.4 3.5 2.4 Borrowing from FHLB 3.0 - - Other 0.0 0.1 0.1
$13.3 $8.4 $6.9
27
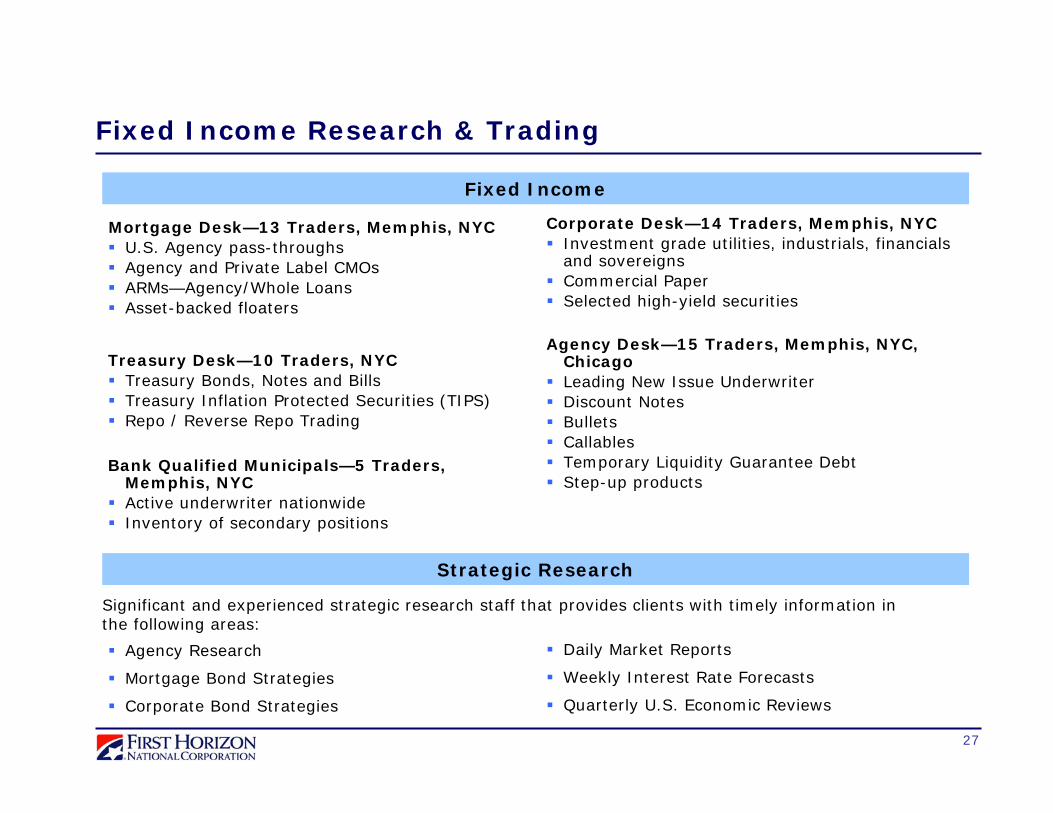
Fixed Income Research & Trading
Fixed Income
Strategic Research
Significant and experienced strategic research staff that provides clients with timely information in the following areas:
Daily Market Reports
Weekly Interest Rate Forecasts
Quarterly U.S. Economic Reviews
Agency Research
Mortgage Bond Strategies
Corporate Bond Strategies
Treasury Desk—10 Traders, NYCTreasury Bonds, Notes and BillsTreasury Inflation Protected Securities (TIPS)Repo / Reverse Repo Trading
Agency Desk—15 Traders, Memphis, NYC, ChicagoLeading New Issue UnderwriterDiscount NotesBulletsCallablesTemporary Liquidity Guarantee DebtStep-up products
Mortgage Desk—13 Traders, Memphis, NYCU.S. Agency pass-throughsAgency and Private Label CMOsARMs—Agency/Whole LoansAsset-backed floaters
Corporate Desk—14 Traders, Memphis, NYCInvestment grade utilities, industrials, financials and sovereignsCommercial PaperSelected high-yield securities
Bank Qualified Municipals—5 Traders, Memphis, NYCActive underwriter nationwideInventory of secondary positions
28
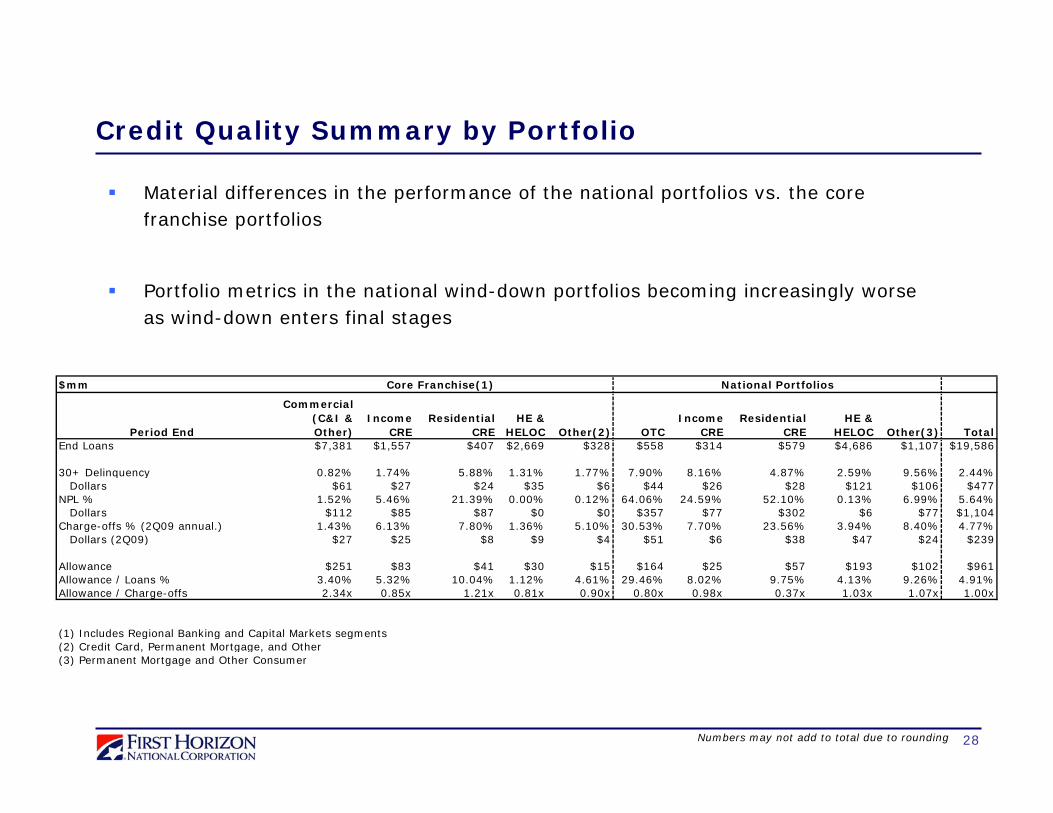
Credit Quality Summary by Portfolio
Numbers may not add to total due to rounding
Material differences in the performance of the national portfolios vs. the core franchise portfolios
Portfolio metrics in the national wind-down portfolios becoming increasingly worse as wind-down enters final stages
$mm
Period End
Commercial (C&I & Other)
IncomeCRE
Residential CRE
HE &HELOC Other(2) OTC
IncomeCRE
Residential CRE
HE &HELOC Other(3) Total
End Loans $7,381 $1,557 $407 $2,669 $328 $558 $314 $579 $4,686 $1,107 $19,586
30+ Delinquency 0.82% 1.74% 5.88% 1.31% 1.77% 7.90% 8.16% 4.87% 2.59% 9.56% 2.44%Dollars $61 $27 $24 $35 $6 $44 $26 $28 $121 $106 $477
NPL % 1.52% 5.46% 21.39% 0.00% 0.12% 64.06% 24.59% 52.10% 0.13% 6.99% 5.64%Dollars $112 $85 $87 $0 $0 $357 $77 $302 $6 $77 $1,104
Charge-offs % (2Q09 annual.) 1.43% 6.13% 7.80% 1.36% 5.10% 30.53% 7.70% 23.56% 3.94% 8.40% 4.77%Dollars (2Q09) $27 $25 $8 $9 $4 $51 $6 $38 $47 $24 $239
Allowance $251 $83 $41 $30 $15 $164 $25 $57 $193 $102 $961Allowance / Loans % 3.40% 5.32% 10.04% 1.12% 4.61% 29.46% 8.02% 9.75% 4.13% 9.26% 4.91%Allowance / Charge-offs 2.34x 0.85x 1.21x 0.81x 0.90x 0.80x 0.98x 0.37x 1.03x 1.07x 1.00x
(1) Includes Regional Banking and Capital Markets segments(2) Credit Card, Permanent Mortgage, and Other(3) Permanent Mortgage and Other Consumer
Core Franchise(1) National Portfolios

29
($ mm) 4Q08 1Q09 2Q09
Beginning ORE $115 $104 $119
+ Additions $22 $45 $39
- Dispositions ($33) ($30) ($52)
Ending ORE $104 $119 $106
NPAs declined 2% linked-quarter
Problem loan outflows increased while inflows decreased
Reduced ORE inventory partially via small bulk sales
Individual sales at approximate carrying values
Losses taken on bulk sales to move aging inventory
Active re-valuation of inventory resulted in increased foreclosure expense
Problem Loans – Inflows Declining, Resolutions Rising
ORE: Proactive Disposition Efforts3
1Includes Commercial & One-Time Close Portfolios only 2Commercial loan grade migration reflects pass to non-pass
3ORE excludes foreclosed real estate from GNMA loans. Includes fair value adjustments
NPLs: Slower Inflows, More Resolutions1
($ mm) 4Q08 1Q09 2Q09
Beginning NPLs $854 $998 $1,064
+ Additions $395 $317 $232
+ Principal Increase $6 $13 $19
- Payments ($83) ($81) ($113)
- Charge-Offs ($150) ($149) ($155)
- Transfer to ORE ($18) ($33) ($25)
- Upgrade to Accrual ($6) ($1) ($1)
Ending NPLs $998 $1,064 $1,021

30
Proactive Approach to Credit Quality Indicated as Problem Loans Slowing
Median 16%
FHN4.9%
1Peers include Top 50 banks at 2Q09 as of 8/10/09. 2Commercial Loan grade migration reflects pass to non-pass.
FHN(2)%
Reserves at $961 million or 4.9% of loans, well above peers
NPA’s declined 2% from 1Q09 to 2Q09, one of the few declines in the industry
Commercial loan deterioration slowing as downward loan grade migration continues to decline in 2Q09
Median 2.4%
Coverage Ratio1
NPA Growth1 from 1Q09 to 2Q09 Commercial Loan Downgrades2
$200
$400
$600
$800
$1,000
$1,200
2Q08 3Q08 4Q08 1Q09 2Q09
Bal
ance
s in
$M
illio
ns
31
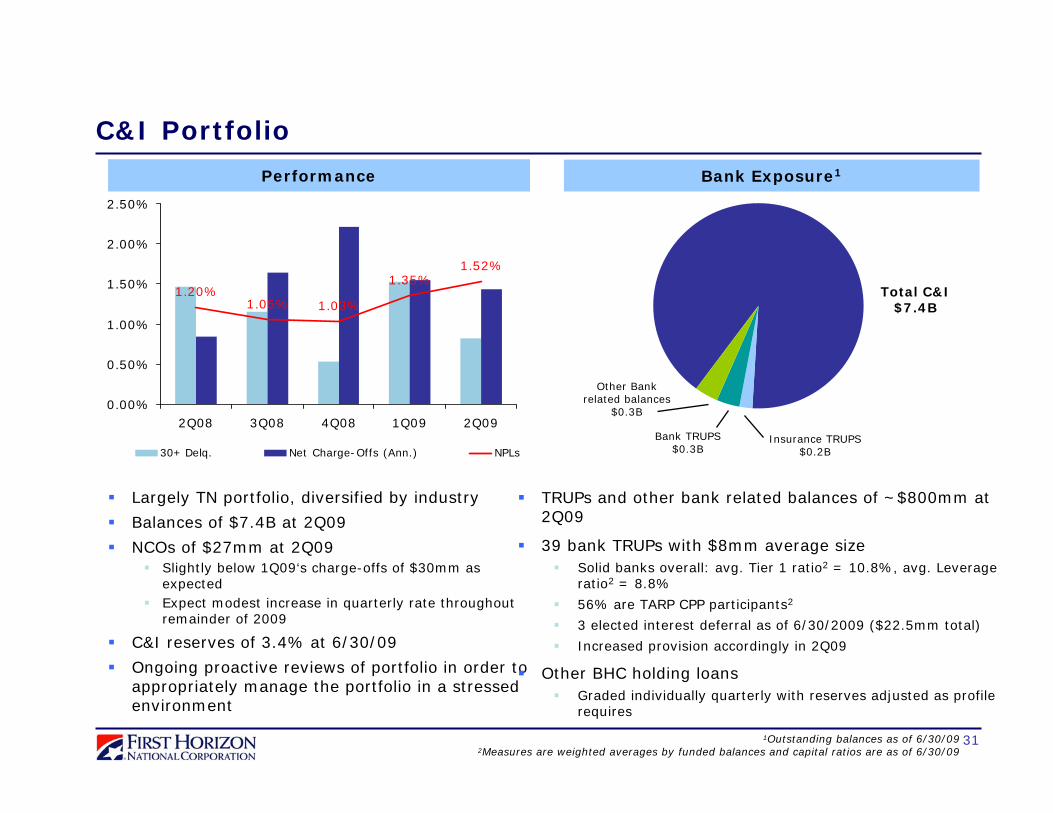
C&I Portfolio
Performance Bank Exposure1
1.52%
1.20%1.05% 1.03%
1.35%
0.00%
0.50%
1.00%
1.50%
2.00%
2.50%
2Q08 3Q08 4Q08 1Q09 2Q09
30+ Delq. Net Charge-Offs (Ann.) NPLs
Largely TN portfolio, diversified by industry
Balances of $7.4B at 2Q09
NCOs of $27mm at 2Q09Slightly below 1Q09‘s charge-offs of $30mm as expectedExpect modest increase in quarterly rate throughout remainder of 2009
C&I reserves of 3.4% at 6/30/09
Ongoing proactive reviews of portfolio in order to appropriately manage the portfolio in a stressed environment
TRUPs and other bank related balances of ~$800mm at 2Q09
39 bank TRUPs with $8mm average size Solid banks overall: avg. Tier 1 ratio2 = 10.8%, avg. Leverage ratio2 = 8.8%
56% are TARP CPP participants2
3 elected interest deferral as of 6/30/2009 ($22.5mm total)
Increased provision accordingly in 2Q09
Other BHC holding loansGraded individually quarterly with reserves adjusted as profile requires
Total C&I $7.4B
Insurance TRUPS $0.2B
Bank TRUPS$0.3B
Other Bank related balances
$0.3B
1Outstanding balances as of 6/30/092Measures are weighted averages by funded balances and capital ratios are as of 6/30/09

32
Income CRE Portfolio
Traditional commercial real estate construction and mini-permanent loans
Balances of ~$2 billion at 2Q09
Three-fourths managed in regional banking
Market conditions impacting portfolio performanceRecession increasing vacancy and rental rates (NOI)Lack of real estate financing in the market increasing cap rates
Reserves of 5.8% at 6/30/09
Multi-Family19%
Office14%
Land14%
Other12%
Industrial 10%
Hospitality7%
Retail24%
Portfolio Characteristics Performance
Collateral Type1Loan Type1
3.54% 3.72%
6.30%
8.67%
5.02%
0.00%1.00%2.00%3.00%4.00%5.00%
6.00%7.00%8.00%9.00%
10.00%
2Q08 3Q08 4Q08 1Q09 2Q09
30+ Delq. Net Charge-Offs (ann.) NPLs
1As of 6/30/09
Construction21%
Land14%%
Mini-Perm/Construction
65%
NPLs by Product Type1
Product Type 1Q09 2Q09
Raw Land 33.2% 41.3%Land Development 12.5% 24.2%Multi-Family 7.8% 11.2%Developed Land 4.3% 7.2%Retail 2.2% 6.5%Other 5.9% 5.5%Office 3.9% 5.2%Industrial 3.0% 3.5%Hospitality 0.0% 0.0%

33
Home Equity Portfolio
30+ Delinquency: National vs. Regional1 Net-Charge Offs2
3.94%
1.50%
0.81%
1.23%1.45% 1.36%
2.88%
2.10%1.91%1.70%
0.00%
1.00%
2.00%
3.00%
4.00%
5.00%
2Q08 3Q08 4Q08 1Q09 2Q09
Regional Banking National Specialty
Vintage Mix
15%17%
11%9%
15%
4,400
4,600
4,800
5,000
5,200
5,400
2Q08 3Q08 4Q08 1Q09 2Q09
$ M
illio
ns
0%
2%
4%
6%
8%
10%
12%
14%
16%
18%
Period End Balance Constant Pre-Payment Rate (right axis)
National Portfolio Run-Off
1.28%
2.62%
0.00%
1.00%
2.00%
3.00%
Jun-
08
Jul-0
8
Aug-
08
Sep-
08
Oct-08
Nov-0
8
Dec-0
8
Jan-
09
Feb-
09
Mar-0
9
Apr-0
9
May-0
9
Jun-
09
Regional Banking National Specialty
Industry = 13.20%
1Source: McDash industry data as of April 2009. FHN data excludes FHB.2Net Charge-Offs are annualized
Balance ($B) W/AVintage 6/30/2009 1Q09 2Q09 Age (mo.)
pre-2002 0.4 2.0% 1.4% 932003 0.7 1.3% 1.3% 722004 0.9 2.1% 1.8% 592005 1.6 3.1% 4.3% 472006 1.3 3.5% 4.3% 362007 1.5 2.5% 4.0% 242008 0.7 1.7% 2.3% 132009 0.3 0.0% 0.0% 3
Total 7.4 2.4% 3.0%
NCOs QTD Ann.

34
Portfolio Characteristics
Home Equity - Differentiated Portfolio Characteristics
Other 37%
WA4%
VA 4%
MD3%
FL 3%
CA 15%
TN 34%
30+ Delinquency: Key Drivers
FICO Score Channel Lien Position
Geographic Distribution
% of portfolio
86% 14%
1.34%
2.44%
0%
2%
4%
6%
1st Lien 2nd Lien
% of portfolio
28% 72%
% of portfolio
1.02%
2.59%3.23% 2.97%
4.68%
0%
2%
4%
6%
>=740 720-739 700-719 660-699 <660
50% 14% 13% 15% 9%
1.81%
4.09%
0%
2%
4%
6%
Retail Wholesale/Other
First Second Total
Balance $2.1B $5.3B $7.3B
Original FICO 734 736 735
Original CLTV 70% 80% 78%
Full Doc 78% 69% 71%
Owner Occupied 85% 96% 93%
HELOCs $0.8B $3.6B $4.4B
Weighted Avg. HELOC Utilization
50% 59% 57%

35
Home Equity - Cumulative Charge-Offs
0.00%
0.50%
1.00%
1.50%
2.00%
2.50%
3.00%
3.50%
4.00%
1 3 5 7 9 11 13 15 17 19 21 23 25 27 29 31 33 35 37 39 41 43 45 47 49 51 53 55 57 59
Cu
mu
lati
ve C
harg
e-O
ff P
erc
en
t
Older vintage performance benefiting from home price appreciation
Portfolio weighted average cumulative losses expected at 3-6%
Regional Banking cumulative losses expected at 2-5%
National Specialty cumulative losses expected at 3-6%
Age (months)
2007
2006
2005
2004
20022003
2000
2001
Cum loss rate represents charge-off amount over origination volume
$ Balance (mm)
Balance %
Pre-2002 441 6%2003 736 10%2004 956 13%2005 1,471 20%2006 1,251 17%2007 1,471 20%2008 736 10%2009 294 4%

36
National Wind-Down Portfolios: OTC, Perm Mortgage, & Res CRE
0.0
0.5
1.0
1.5
2.0
2.5
3.0
4Q07 2Q08 3Q08 4Q08 1Q09 2Q09
$ B
illio
ns
OTC Balances Unfunded Commitments
$0.0
$0.4
$0.8
$1.2
$1.6
$2.0
$2.4
4Q07 2Q08 3Q08 4Q08 1Q09 2Q09
$ B
illio
ns
0.0%
10.0%
20.0%
30.0%
40.0%
50.0%
60.0%
Nat'l Res CRE Balances Nat'l Res CRE Unfunded Commitments
NPLs as % of portfolio 30+day Del.
79%
One-Time Close
Permanent Mortgage1
National portfolios on track for wind-downOTC balances down 28% to $558mm from 1Q09
Completed loans paid off, modified to perm mortgage, or managed as problem assetsOTC reserves of 29.5% at 6/30/09
Perm portfolio is heterogeneous; performance varies by pool
Delinquency and severity driving higher reserves and lossesReserve growth also from available LOCOM depletion Perm mortgage reserves of 8.9% at 2Q09
Res CRE national balances down 15% to $579mm at 2Q09
Res CRE national reserves of 9.8% at 6/30/09
National Res CRE
$500
$700
$900
$1,100
$1,300
$1,500
2Q08 3Q08 4Q08 1Q09 2Q09
$ M
illio
ns
0.0%
2.0%
4.0%
6.0%
8.0%
10.0%
12.0%
14.0%
Perm Mortgage Balances 30+Del. Charge-Offs Ann.
1Perm Mortgage reflects consolidated asset quality trends
70%

37
Reserves/($ mm) Reserves Loans Loans
FAS114 Impaired Loans w/o Reserves
$0 $522 0.00%
FAS114 Impaired Loans w/ Reserves
$9 $26 33.67%
Other Commercial Loans $448 $9,691 4.62%
Total $456 $10,238 4.46%
$0
$100
$200
$300
$400
$500
$600
$700
$800
$900
AppraisedValue
Pre-ChargeDown Balance
CumulativeCharge Down
Book Balance(6/30/09)
$ M
illio
ns
Problem Loans Written Down to Realizable Values, Reserves Largely for Performing Credits
FAS 114 Charge-Downs2Commercial Loan Reserves
837
785522
34% write-down
(263)
1Refers to Individually Impaired Loans, ASC 310. 2Approximation based on most recent appraised value, which can be impacted by changing market conditions and asset disposition.
Generally, classified non-accrual loans over $1mm are assessed for impairment in accordance with FAS-1141
Commercial loans typically charged-down to net realizable value rather than holding reserves

38
Reconciliation to GAAP Financials
Slides in this presentation use non-GAAP information of capital markets’ return on capital. That information is not presented according to generally accepted accounting principles (GAAP), and is reconciled to GAAP information below.
4Q07 1Q08 2Q08 3Q08 4Q08 1Q09 2Q09Capital Markets Net Income Correspondent Banking 5,828 (1,435) (4,310) (16,836) 1,783 482 (5,242) Capital Markets 13,505 15,818 19,599 11,956 44,701 46,171 54,534 Total Capital Markets 19,333 14,383 15,289 (4,880) 46,484 46,653 49,292
Capital Markets Capital Correspondent Banking 89,008 93,005 103,716 108,333 126,907 137,870 145,895 Capital Markets 198,004 192,192 191,466 201,658 215,780 265,868 272,327 Total Capital Markets 287,012 285,197 295,182 309,991 342,687 403,738 418,223
Capital Markets Return on Capital excluding correspondent banking capital 27% 33% 41% 24% 83% 69% 80%Total Capital Markets Return on Capital 27% 20% 21% -6% 54% 46% 47%
Return on equity is calculated by annualizing quarterly net income divided by capital.

39
Reconciliation to GAAP FinancialsSlides in this presentation use non-GAAP information of pre-tax, pre-provision earnings. That information is not presented according to generally accepted accounting principles (GAAP), and is reconciled to GAAP information below.
($ Millions)Regional Banking 2Q09 1Q09 2Q08
Pre-Tax, Pre-Provision Earnings/(Loss) $ 38 $ 31 $ 72Provision (51) (98) (89)Reported Pre-Tax Earnings/(Loss) (13) (67) (17)
National Specialty Lending
Pre-Tax, Pre-Provision Earnings/(Loss) (19) (5) 10Provision (176) (189) (108)Reported Pre-Tax Earnings/(Loss) (195) (194) (98)
Mortgage Banking
Pre-Tax, Pre-Provision Earnings/(Loss) (33) 85 72Provision (12) (0) (4)Reported Pre-Tax Earnings/(Loss) (45) 85 68
Capital Markets
Pre-Tax, Pre-Provision Earnings/(Loss) 100 89 43Provision (21) (14) (19)Reported Pre-Tax Earnings/(Loss) 79 75 24
Corporate
Pre-Tax, Pre-Provision Earnings/(Loss) (7) (12) (22)Provision - - -Reported Pre-Tax Earnings/(Loss) (7) (12) (22)
Total Consolidated
Pre-Tax, Pre-Provision Earnings/(Loss) 79 187 175Provision (260) (300) (220)Reported Pre-Tax Earnings/(Loss) $ (181) $ (113) $ (45)

40
Reconciliation to GAAP FinancialsSlides in this presentation use non-GAAP information of TCE, TA, and Tier 1 Common. That information is not presented according to generally accepted accounting principles (GAAP), and is reconciled to GAAP information below.
1Includes goodwill and other intangible assets, net of amortization
($ Millions) 2Q09 1Q09 4Q08
Tangible Common Equity (Non-GAAP)Total equity (GAAP) $ 3,394.0 $ 3,507.7 $ 3,574.6Less: Preferred stock capital surplus - CPP 790.6 786.6 785.7Less: Noncontrolling interest 295.2 295.2 295.2Total common equity 2,308.2 2,425.9 2,493.7Less: Intangible assets (GAAP)1 234.3 235.9 237.5Tangible common equity (Non-GAAP) 2,073.9 2,190.0 2,256.2Less: Unrealized gains on AFS securities, net of tax 59.2 57.4 42.3Adjusted tangible common equity (Non-GAAP) 2,014.7 2,132.6 2,213.9
Tangible Assets (Non-GAAP)Total assets (GAAP) $ 28,758.9 $ 31,208.0 $ 31,022.0Less: Intangible assets (GAAP)1 234.3 235.9 237.5Tangible assets (Non-GAAP) 28,524.6 30,972.1 30,784.5
Tier 1 Common (Non-GAAP)Tier 1 capital $ 3,596.3 $ 3,709.0 $ 3,784.2Less: Preferred stock capital surplus - CPP 790.6 786.6 782.7 Less: Noncontrolling interest 295.2 295.2 295.2 Less: Trust preferred 300.0 300.0 300.0 Tier 1 common (Non-GAAP) 2,210.5 2,327.2 2,406.3
Risk Weighted AssetsRisk weighted assets $ 23,123.4 $ 24,771.8 $ 25,185.4
RatiosTangible common equity to tangible assets (TCE/TA) (Non-GAAP) 7.27% 7.07% 7.34%Total equity to total assets (GAAP) 11.80% 11.24% 11.52%Tier 1 common ratio (Non-GAAP) 9.56% 9.40% 9.56%Tier 1 capital to total assets (GAAP) 12.50% 11.88% 12.20%Adjusted tangible common equity to risk weighted assets (TCE/RWA) (Non-GAAP) 8.71% 8.61% 8.80%Total equity to total assets (GAAP) 11.80% 11.24% 11.52%Tangible common equity plus reserves to risk weighted assets (TCE/RWA) (Non-GAAP) 13.13% 12.64% 12.33%Total equity plus reserves to total assets (GAAP) 15.14% 14.25% 14.26%

41
FHN Investor Relations Contact Information
Dave Miller, Corporate Strategy & Investor Relations165 Madison Ave, Memphis, TN 38103(901) [email protected]
Aarti Bowman, Investor Relations165 Madison Ave, Memphis, TN 38103(901) [email protected]