Presentación de PowerPoint -...
40
SECOND QUARTER 2017 RESULTS INVESTOR PRESENTATION
Transcript of Presentación de PowerPoint -...

SECOND
QUARTER 2017
RESULTS
INVESTOR
PRESENTATION

This presentation may contain forward-looking information and statements. Forward-looking statements are statements that are
not historical facts. These statements are only predictions based on our current information and expectations and projections
about future events. Forward-looking statements may be identified by the words “believe,” “expect,” “anticipate,” “target,”
“estimate,” or similar expressions. While OMA's management believes that the expectations reflected in such forward-looking
statements are reasonable, investors are cautioned that forward-looking information and statements are subject to various risks
and uncertainties, many of which are difficult to predict and are generally beyond the control of OMA, that could cause actual
results and developments to differ materially from those expressed in, or implied or projected by, the forward-looking
information and statements. These risks and uncertainties include, but are not limited to, those discussed in our most recent
annual report filed on Form 20-F under the caption “Risk Factors.” OMA undertakes no obligation to update publicly its forward-
looking statements, whether as a result of new information, future events, or otherwise.
2

A b o u t t h e C o m p a n y
Our businesses
13 Airports in the central-north region of Mexico, serving 18.8 million
passengers in 2016.
2 Hotels; NH Collection Hotel in Terminal 2 of the Mexico City
Airport, and Hilton Garden Inn at Monterrey Airport
1 Industrial Park at Monterrey Airport
Who we are
More than 1,000 employees committed to providing aeronautical,
commercial and real state services of excellence to our
passengers and clients.
Listed in BMV and NASDAQ since 2006
Part of Dow Jones Sustainability Index for Emerging Markets and
the Sustainability Index of BMV
3

Company
Overview
Aeronautical
Business
Non-
Aeronautical
Business
Financial
Results
MDP &
Maximum
Rates
Outlook and
Industry
Value Proposal
Historical Performance
Shareholder Structure
Board of Directors and
Management Team
Operations &
Sustainability
Connectivity &
New Routes
Passenger Traffic
Airline Participation
AR 2Q17
Commercial Strategy
Diversification Strategy
NAR 2Q17
Historical NAR Growth
2Q17 Highlights
Cost & Efficiency
Balance Sheet
Profitability Indicators
Value Distribution
Investments 2016-2020
New Terminals
Maximum Rates
Industry Trends
Airline Fleets: Orders
and Expected
Load Factor

Value Proposal
Company
Overv iew
1
Historical Performance
Shareholder Structure
2
3
Board of Directors and
Management Team4
Operations & Sustainability5

Company Overview | Value Proposal
High potential
portfolio of
airports and
businesses
Maximizing
value
distribution
Constant growth
in Adjusted
EBITDA and
margins
Balanced
capital structure
Cost and
expenses
management
efficiency
Commitment to
sustainability,
safety and
security
Sustained
passenger
growth
Visibility in
aeronautical
tariffs
Successful
commercial
and
diversification
strategies
Experienced
board of
directors and
management
team
6

Company Overview | Historical Performance
81% 82% 81% 81% 77% 76% 76% 74% 74%73%
74%19%
18% 19% 19% 23%24%
24%26%
26%
27%
26%
1,687 1,897 1,988 1,896 2,144 2,459
2,820 3,065
3,422
4,145
5,205 5,600
11.8
14.2 14.1
11.5 11.6 11.8 12.6
13.3
14.7
16.9
18.8 19.5
3.0
5.0
7.0
9.0
11.0
13.0
15.0
17.0
19.0
21.0
(500)
500
1,500
2,500
3,500
4,500
5,500
6,500
7,500
2006 2007 2008 2009 2010 2011 2012 2013 2014 2015 2016 LTM 6M17
Aeronautical Revenues Non-Aeronautical Revenues Passenger Traffic (million)
% Adj.
EBITDA254% 56% 53% 51% 44% 51% 54% 55% 55% 59% 64% 65%
Sustained positive trends through economic and business cycles
Note: From 2010 to 2016 figures expressed under IFRS; 2001 - 2009 figures expressed under MFRS.1 Represents the sum of aeronautical and non-aeronautical revenues (excludes construction). 2 Adjusted EBITDA Margin = Adjusted EBITDA / (Aeronautical + Non-Aeronautical Revenues). Adjusted EBITDA = Operating income + Depreciation and Amortization + Maintenance Provision.
CAGR 2011-LTM2Q17
• PAX
• Revenues
• Adjusted EBITDA
+8.8%
+14.7%
+19.4%
25%
75%
7

Market Cap3.
MxN Bn Ps.43.2 / USD Bn $2.4
12.6%
SETA1 – BB shares
1.9%
CONOISA1 – B shares
85.5%
Public Float2 - B Shares
Company Overview | Shareholder Structure
8
Note: Share holding information as of June 30, 20171 Servicios de Tecnología Aeroportuaria, S.A. de C.V. (SETA) and Controladora de Operaciones de Infraestructura, S.A. de C.V. (CONOISA) are wholly owned subsidiaries of Empresas ICA ,S.A.B. de C.V.2 Float includes repurchased shares3 BMV Price Ps.109.68 as of June 30, 2017. Exchange rate used: 18.0279

CORPORATE GOVERNANCE
5 of 11 Directors are independentmembers
Board Audit and Corporate PracticesCommitees are 100% independent
Company Overview | Board of Directors & Management Team
9
EXPERIENCED MANAGEMENT TEAM(Average time with OMA: 14 years)
Porfirio GonzálezChief Executive Officer – With the Company since 1998
Vicsaly TorresChief Financial Officer – With the Company since 2006
Alfredo DomínguezGeneral Counsel – With the Company since 2004
Juan Manuel JaureguiDirector of Airport Operations – With the Company since 1999
Roberto OntiverosInfraestructure and Maintenance Director – With theCompany since 2008
Héctor CortésNew Businesses and Diversification Director – With theCompany since 2001

Company Overview | Operations & Sustainability
10
Always striving to meet international standards.
Environment
Social Responsibility
SustainabilityPerformance
OccupationalHealth and Safety
Quality and Customer Service
CULIACÁN AIRPORT MAZATLÁN AIRPORT
AerodromeCertification

Connectivity &
New Routes
Aero na u t ica l
Bus iness
1
Passenger Traffic
Airline Participation
2
3
Aeronautical Revenues 2Q174

4 1 n e w d i r e c t r o u t e s i n 2 0 1 6
1 2 c a n c e l l e d r o u t e s i n 2 0 1 6
Aeronautical Business | Connectivity & New Routes
4
16
4
8
Domestic Routes
1
2
5
1
International Routes
1 5 n e w d i r e c t r o u t e s i n 6 M 1 7
4 5 c a n c e l l e d r o u t e s i n 6 M 1 7
3 11
Chicago
Milwaukee
Zihuatanejo
Acapulco
Guadalajara
Culiacán
Hermosillo
Chihuahua
QuerétaroBajío
2+ 1 0 . 9 %
P A X i n 2 0 1 6
Monterrey
Detroit
Ciudad de México
24
Puerto Vallarta
2
Ciudad Juárez
Cancún
Tijuana
Obregón

Metropolitan
50%
Regional
30%
Tourist
11%
Border Cities
9%
MTY
Aeronautical Business | Passenger Traffic
(%) YoY 6M17 Passenger Growth
CUU
CJS
CUL
MZT
DGO
TRC
ZCLSLP
TAM
REX
ZIH
ACA
At Monterrey Airport
• Aeromexico regional hub• VivaAerobus main base and headquarters• Volaris secondary base• Interjet secondary base
Total Pax: 4.9 million (+8.3%)
88% Domestic: 4.3 million (+8.8%)
12% International: 0.6 million (+4.9%)
2Q17 Passenger Traffic
13
+7%
+20%
+14%
+6% -7%
-1%
+9%
-9%
+1%+10%+11%
+25%
0%Note: Percentages in graphs represent Passenger share by type of airport.
Total Pax: 9.5 million (+8.5%)
87% Domestic: 8.2 million (+9.2%)
13% International: 1.3 million (+4.6%)
6M17 Passenger Traffic

Aeronautical Business | Airline Participation
VivaAerobus, 28%
(+37.6%)
Aeroméxico, 27%
(+1.3%)
Volaris, 19% (-4.3%)
Interjet, 18% (+4.3%)
TAR, 2%
(-2.2%)
Other, 6%
(+4.9%)
American, 22%
(+3.7%)
United, 22% (-0.4%)
Aeroméxico, 16%
(+7.4%)
Delta, 12% (+10.7%)
Volaris, 10%
(+41.5%)
Interjet, 6%
(-8.3%)
Alaska, 4%
(+0%)
VivaAerobus, 2%
(-13.9%)
Other, 6%
(-6.9%)
88% Domestic Passengers
12% International Passengers
Note: Percentages in graphs represent 1) Passenger share by category and 2) % change 2Q17 vs 2Q16.
14

Aeronautical Business | Aeronautical Revenues 2Q17
Ps.225mm
+22.5%
21% of
Aeronautical
Revenue
Ps.1,079mm
+13.0%
75% of Total
Revenue*
Ps. 219.6 / PAX
Ps.691mm
+13.2%
64% of
Aeronautical
Revenue
Domestic Passenger Charges
InternationalPassenger Charges
AirportServices
Aeronautical
Revenues
* Total Revenues excluding Construction Revenues
Ps.163mm
+1.5%
15% of
Aeronautical
Revenue
15

Commercial Strategy
Non -
Aero na u t ica l
Bus iness
1
Diversification Strategy
NAR 2Q17
2
3
Historical NAR Growth4

Non-Aeronautical Business | Commercial Strategy
16 Commercial Initiatives Implemented in 2Q17Airport Type QuantityCiudad Juárez, Chihuahua, Culiacán, Reynosa, San Luis Potosí, Tampico, Zacatecas and Zihuatanejo
Financial Services 8
Ciudad Juárez, Mazatlán, Reynosa, Culiacán and Torreón Comunications 5
Durango and Monterrey Retailers 2
San Luis Potosí Hotel Promotion 1
17
Maximize commercial
areas
Balance between
internationalfranchises & local brands
Develop premium
offerings & loyalty
programs
Addinnovativeadvertising

Non-Aeronautical Business | Diversification Strategy
17.4% of NAR | 287 Rooms
Avg. Room Rate: Ps.2,226 per night (+5.1% yoy)
Occupancy Rate: 88% | EBITDA Margin: 38.3%
6.1% of NAR | 134 Rooms
Avg. Room Rate: Ps.2,023 per night (+3.0% yoy)
Occupancy Rate: 73% | EBITDA Margin: 38.4%
NH Collection Hotel at Mexico City Airport Hilton Garden Inn Hotel in MTY
OMA Carga Real Estate Industrial Park In MTY
0.8% of NAR | Ps.2,762mm
1st and 2nd warehouses leased | 2nd
warehouse expansion request to 8,200 m2
and additional revenue generation since 1Q18 | 3rd warehouse leased; revenue
generation since 4Q17 | 4th warehouse in commercialization process
1.0% of NAR | -6.5%
revenues in 2Q17
10.3% of NAR | +16.6% revenues in 2Q17
1,650m2 | New ground cargo facility
started operations on February 16, 2017
18

Non-Aeronautical Business | NAR 2Q17
Ps.129mm
+13.2%
36% of NAR.
Ps.360mm+6.8%
25% of Total Rev. *Ps.73.3 / PAX
Ps.172mm
+2.0%
48% of NAR
Ps.59mm
+8.1%
16% NAR
Commercial Activities
Diversification Activities
Complementary Activities
Non-
Aeronautical
Revenues
* Total Revenues excluding Construction Revenues
19

89%89% 84% 83% 67%
64% 54% 51%51%
51%49% 49%
4%3%
4% 8%
25%
29% 28%28%
28%
32%
35%35%
7%8% 12% 9%
8%
7%
18%
21%
21%
17%
16%
16%
-5
45
95
145
195
245
295
345
-
200
400
600
800
1,00 0
1,20 0
1,40 0
1,60 0
2006 2007 2008 2009 2010 2011 2012 2013 2014 2015 2016 LTM2T17
INA/PAX Comercial INA/PAX Diversificación INA/PAX Complementarios INA Total PAX
Non-Aeronautical Business | Historical NAR Growth
Non-Aeronautical Revenues (NAR) have increased faster than
passenger traffic as a result of commercial initiatives and
diversification projects
20
+358%
60
61
71
+66%
42
2624
26 32
50
55
72
CAGR 2011-LTM2Q17
Base = 2005
• PAX• NAR• NAR/PAX
+8.8%+15.5%+6.2%
66

2Q17 Highlights1
Cost & Efficiency
Balance Sheet
2
3
Profitability Indicators4
F inanc ia l
Resu l t s
Value Distribution5

Financial Results | 2Q17 Highlights
Ps.949mm
+39.9%Ps.510mm
+14.4%
Revenues*Total Operating Cost
and ExpensesAdjusted EBITDA**
Consolidated Net
Income
* Total Revenues excluding Construction Revenues** Adjusted EBITDA Margin = Adjusted EBITDA / (Aeronautical + Non-Aeronautical Revenues). Adjusted EBITDA = Operating income + Depreciation and Amortization + Maintenance Provision.22
Ps.1,439mm
+11.4%
Aeronautical +13.0%Non-Aero +6.8%
Ps.292.8 / PAX (+2.8%)
Ps. 936mm
+16.0%
2Q17 Margin 65.1%
Ps.190.6 / PAX (+7.1%)
Ps.193.2 / PAX (+29.2%) Ps.103.7 / PAX (+5.6%)
Financial Results | Cost & Efficiency
23
2011 2012 2013 2014 2015 2016 LTM2Q17
1Total Operating Cost and Expenses excluding construction cost, maintenance provision and other expenses (revenues).
Costs and expenses control
has contributed to the
generation of EBITDA
Aj EBITDA / PAX
AR+NAR / PAX
Total Operating Costs and Expenses1/ PAX
Distribution of Operating Cost and
Expenses*
• Economies of scale• Generation and purchase of green power• Development a culture of savings• Use of innovative technology• Improvement of operational systems• Development of human capital
Cost Control Strategy
CAGR 2011-LTM2Q17
+9.7%
+5.4%
+0.1%
*As of June 30, 2017. Excluding construction cost and other expenses (revenues).
39%
23%
11%
11%
11%5%
Cost of Services
Administrative Expenses
Depreciation andAmortization
Concession Taxes
Major MaintenanceProvision
Technical Assistance Fee

Financial Results | Balance Sheet
*Information as of June 30, 2017
Total Debt | Shareholders’ Equity
Debt Profile*
Strong Financial Position* Low Leverage vs Industry*
Ps.Million Net Debt / Adjusted EBITDA
4,643 1,886
2,757
Total Debt Cash Net Debt
0.6
0.9 1.0
0.8
0.5
0.8
2012 2013 2014 2015 2016 LTM 2Q17
MXN97%
USD 3%
Capital Structure Improvement*
Long Term99%
Short Term 1%
24
75% 67%56% 56% 59% 57%
25% 33%44% 44% 41% 43%
2012 2013 2014 2015 2016 LTM 2Q17

Financial Results | Profitability Indicators
1.54 2.05
3.01 2.58
3.15
4.76 5.05
2011 2012 2013 2014 2015 2016 LTM 2Q17
6.6 8.2
10.9
8.3 9.9
13.9 15.6
10.1
12.8
18.8 16.8
20.8
28.0
32.8
-
5.0
10.0
15.0
20.0
25.0
30.0
35.0
2011 2012 2013 2014 2015 2016 LTM 2Q17
ROA / ROEPercentage
Earnings per SharePesos
25
CAGR 2011-LTM2Q17• ROA
• ROE
• Earnings per Share
+15.3%
+21.6%
+21.8%

Financial Results | Value Distribution
Dividend or Capital
Reimbursement
Dividend Yield / Payout Ratio
Ps. Million
Percentage
Dividend Yield was calculated with the stock price at the end of each year.
Percentage
500
1,200 1,200 1,200
1,400
1,600 1
-
200
400
600
800
1,000
1,200
1,400
1,600
1,800
2011 2012 2013 2014 2015 2016
81
147
100
117 113
85
5.7
8.6
6.9
4.4 4.2
4.5
-
1.0
2.0
3.0
4.0
5.0
6.0
7.0
8.0
9.0
-
50
100
150
200
250
2011 2012 2013 2014 2015 2016
26
Note: The amounts shown were paid in the following year, after the annual shareholder meeting.1 The payment was made on May 16, 2017.

Investments 2016-20201
New Terminals
Maximum Rates
2
3
MDP &
Max imum
Ra te s
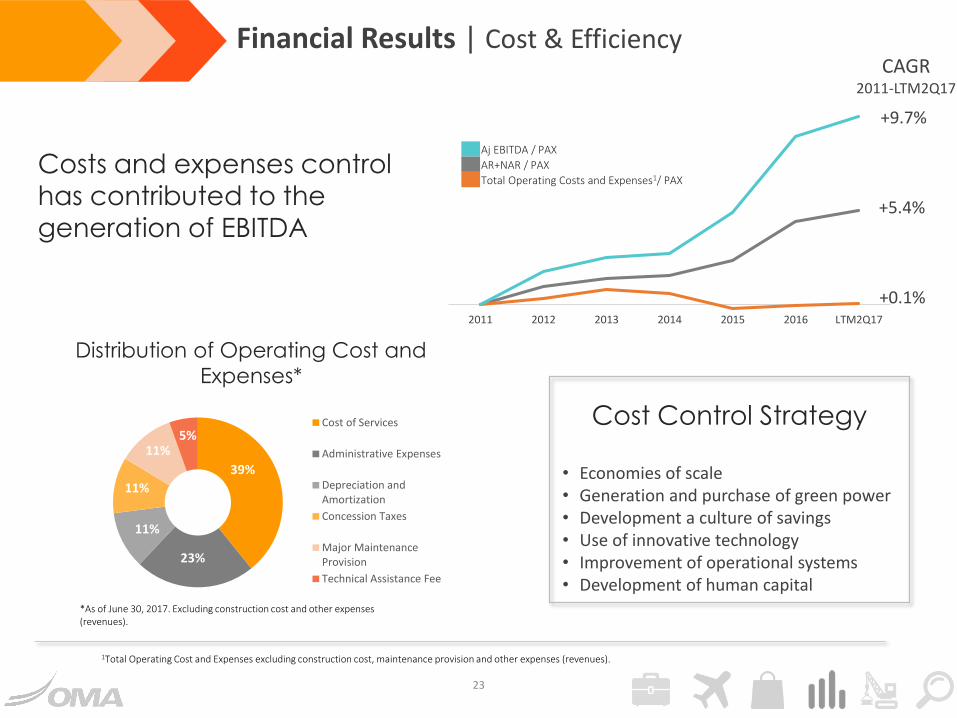
MDP & Maximum Rates | Investments 2016-2020
1,4701,410
1,072
659
43329% 28%21%
13%9%
0%
10%
20%
30%
40%
50%
60%
70%
80%
90%
100 %
0
200
400
600
800
1,0 00
1,2 00
1,4 00
1,6 00
2016 2017 2018 2019 2020
Visibility of capital expenditure requirements through 2020
Monterrey,
28%
Acapulco,
13%
Chihuahua,
10%
San Luis
Potosí, 9%
Reynosa,
8%
Zihuatanejo,
7%
Tampico,
7%
Culiacán, 4%
Ciudad Juárez, 4%
Durango, 3%
Torreón, 3%
Mazatlán, 3%
Zacatecas, 2%
Total Committed Investment Ps.5,044mmpesos of Dec. 31, 2016
28

MDP & Maximum Rates | Investments 2016-2020
49%
16%
11%
11%
7%6%
Other
ICAO Certification
Operational
Infrastructure
Expansion
Major
Maintenance
Security, Safety
& IT Equipment
Terminal
Expansion
& Remodeling
Most Important Projects
Terminal Expansion
• Monterrey• Ciudad Juárez
New Terminals• Acapulco• Reynosa
Operational Infrastructure• Monterrey• Culiacán• Durango
• Chihuahua• San Luis Potosí• Tampico
Total Committed Investment Ps.5,044mmpesos of Dec. 31, 2016
29
+ Expected Strategic Investment 2017
Ps.150-200 mm

MDP & Maximum Rates | New Terminals
Ps.547 mm
Investment
Total PAX mm1.1 1.3, +18%
Capacity Comfort
1Q 2018**
Start of Operations
Acapulco Airport
30
18,800 m2*
Total Area
Terminal building, m2 +44%Commercial spaces, m2 +32%
3 levels plus a mezzanine
** Expected* New terminal total surface

MDP & Maximum Rates | New Terminals
Ps.302 mm
Investment
Total PAX mm0.3 1.0, +233%
Capacity
2 levels
Comfort
8,000 m2*
Total Area
4Q 2018**
Start of Operations
Reynosa Airport
31
Terminal building, m2 +188%Commercial spaces, m2 +147%
** Expected* New terminal total surface

MDP & Maximum Rates | Expansion & Remodeling Terminals
Ps.351 mm
Investment
Total PAX mm0.4 1.2, +200%
Capacity
4,111 m2 13,000 m2*
Total Area
1Q 2019**
Start of Operations
San Luis Potosí Airport
** Expected32
Terminal building, m2 +204%Commercial spaces, m2 +45%
* Total surface after remodeling and expansion

MDP & Maximum Rates | Expansion & Remodeling Terminals
Chihuahua Airport
33** Expected* Total surface after remodeling and expansion
Ps.308 mm
Investment
Total PAX mm0.9 1.7, +89%
Capacity
9,510 m2 15,253 m2*
Total Area
4Q 2018**
Start of Operations
Terminal building, m2 +60%Commercial spaces, m2 +29%

Visibility on Aeronautical Revenues Through 2020
• Maximum rate (Regulated revenue per workload unit) increased in each airport
• The maximum rate for each succeeding year through 2020 will be adjusted by inflation and an
efficiency factor of 0.70%
MDP & Maximum Rates | Maximum Rates
1 Weighted average using passenger traffic for each period (2017 has been weighted with traffic of 2016) and expressed in constant pesos of December 31, 2016 considering efficiency factor effect
3 Expected
2 Considering an expected PPI of December 31, 2017 of +6.5%
2015(1) 2016(1) 2017(1) (2)
13 Airports MT MT MT
Maximum217
(ACA & ZIH)
280(ACA & ZIH)
278(ACA & ZIH)
Minimum166
(MTY)
207(MTY)
205(MTY)
Weighted average 177 222 221
Average rate
increase3
+4.8% Domestic Passenger Charges+4.0% International Passenger Charges
+6.5% in SAEs
34
99.4%
93.7%
95-96%
MT Compliance
2015 2016 2017e

Industry Trends1
Airline Fleets: Orders and
Expected2
Out lo o k and
I ndus t ry
3 Load Factor

0.6
0.30.5
2.4
0.9
2.5
Mexico Argentina Brazil Canada Chile UnitedStates
Outlook and Industry | Industry Trends
Air Industry Low
Penetration in Mexico
4.6%4.9%
2.1%
2.5%
3.7%
5.1% 5.0%
Mexico Brazil UnitedStates
Canada Russia CentralAmerica
SouthAmerica
Projected Domestic
Passenger Traffic CAGR
2016-2035
Source: World Bank. Latest information available of 2016 Source: Airbus. (Global Market Forecast 2016-2035)
36

Historical Airline Fleets and Available SeatsAirplanes
Outlook and Industry | Airline Fleets: Orders and Expected
Source: DGAC, Airlines. Latest information available.
37
13,321 14,944 15,335 16,723 16,635
2013 2014 2015 2016 2017E
Fle
et
Ava
ilab
le S
ea
ts
2,812 2,972 3,472 3,600
4,500
117
45 44
19
0
124
51 50
19
3
125
56 56
21
8
133
70 69
21
10
130
7275
26
10
-
150
400
700 700
6,222 6,594 7,917
8,722 9,645
7,230 8,160 9,296
12,282 14,370

Outlook and Industry | Airline Fleets: Orders and Expected
Source: DGAC, Airlines. Latest information available.
Airline Expansion Orders
(2013 – 2022)
100
80
60
47
20
Aeromexico Interjet VivaAerobus Volaris TAR
38

Load Factor (2006 – 2016)
• CAGR = 2.8%
• During 2016, in our 13 Airports we had an increase of +1.0% to 75.4% in load factor
• In 2016, Culiacán had the highest load factor of 80.7%
Outlook and Industry | Load Factor
39
57%
59%
63%
65%
68%
72% 72% 72%
70%
74%75%
2006 2007 2008 2009 2010 2011 2012 2013 2014 2015 2016
Note: Load Factor = Total Passengers / Total Available Seats

G r u p o A e r o p o r t u a r i o d e l C e n t r o N o r t e , S . A . B . , d e C . V.
Chief Financial OfficerVicsaly Torres | [email protected] | +52.81.8625.4300
Investor Relations TeamEmmanuel Camacho | [email protected] | +52.81.8625.4308
Laury Franco Castillo | [email protected] | +52.81.8625.4377
Investor Relations in USADaniel Wilson | Zemi Communications
[email protected] | +1.212.689.9560