First Half & Second Quarter...
33
Brother Industries, Ltd. November 6, 2013 Information on this report, other than historical facts, refers to future prospects and performance, and has been prepared by our Management on the basis of information available at the time of the announcement. This covers various risks, including, but not limited to, economic conditions, customer demand, foreign currency exchange rates, tax rules, regulation and other factors. As a result, actual future performance may differ from any forecasts contained on this report. Fiscal Year 2013 (ending March 31, 2014) First Half & Second Quarter Results (ended September 30, 2013)
Transcript of First Half & Second Quarter...

Brother Industries, Ltd.November 6, 2013
Information on this report, other than historical facts, refers to future prospects and performance, and has been prepared by our Management on the basis of information available at the time of the announcement. This covers various risks, including, but not limited to, economic conditions, customer demand, foreign currency exchange rates, tax rules, regulation and other factors. As a result, actual future performance may differ from any forecasts contained on this report.
Fiscal Year 2013 (ending March 31, 2014)
First Half & Second Quarter Results(ended September 30, 2013)

© 2013 Brother Industries, Ltd. All Rights Reserved. 2
Highlight
Sales increased compared with the same period the previous year.
・For Communications & Printing equipment, sales in Europe decreased on a local currency basis. However, as the whole business, sales increased, supported by strong sales in Americas.
・For Machine tools, sales decreased due to a recoil reduction against large orders in the same period the previous year.
・For Industrial sewing machines, sales to China and other Asian regions recovered, backed by the recovery of business sentiment toward capital expenditure in the sewing industry.
Operating income, despite a boost-up by yen depreciation, decreased compared with the previous year, due to a sales decrease in Machine tools, increased capital expenditure (depreciation) associated with the production enhancement of Communications & Printing equipment, and an increase in SG&A.
◆Results for first half of FY2013
The outlook for the full year 2013 consolidated financial results is that sales, due to the effect of yen depreciation, are expected to significantly increase compared with the same period the previous year. Despite negative factors, such as an increase in SG&A and an increase in fixed costs including R&D and depreciation costs, operating income is expected to increase, supported by the effect of yen depreciation.
◆Forecast for FY2013

© 2013 Brother Industries, Ltd. All Rights Reserved. 3
Net Sales increased due to the positive effect of forex and a steady sales increase in communications & printing equipment.
Despite the positive effect of forex, Operating Income decreased due to a sales decrease in the Machinery &Solution business and an increase in selling and general administrative expenses.
Results for first half of FY2013(ending March 31,2014)
(100 Millions of Yen)
Six months ended Sep. 30, 20131H 3/2014 1H 3/2013 Change Rate of Change
[Actual] [Actual] (w/o foreximpact)
17.9%(+1.3%)
194 196 -3 -1.3%6.7% 8.0% -1.3%-40 4 -45153 200 -47 -23.5%
-3 -7 486 45 4164 148 -84 -56.6%
(Yen)Exchange USD 97.99 79.43 18.56Rates EUR 128.79 101.12 27.67
Extraordinary Income (Loss)
Income TaxesNet Income
Operating IncomeOperating Income RatioNon-operating Income (Loss)
Current Profits
Net Sales 2,884 2,445 438

© 2013 Brother Industries, Ltd. All Rights Reserved. 4
〈P&S〉Continue to expand sales in business segment, and launch new Black&White laser printerspecialized for the needs to expand sales in the emerging countries.
〈S&S〉Expand sales by enhancing the competitiveness of our products by building newservice infrastructures.
〈P&H〉Expand customer base with products which offer new value, and achieve low cost of manufacturing at Vietnam factory to further strengthen competitiveness.
〈M&S〉Introduce competitive products, enhance sales force in Asian market and strengthen corporate financial stability by cost reduction.
〈N&C〉Secure profit stably by enhancing product/service of Karaoke business throughimproving operation process, as well as develop new opportunities, such as business in the health industry.
<Industrial parts>Promote business synergy with Nissei Corporation at an early stage.
Policy of FY2013

© 2013 Brother Industries, Ltd. All Rights Reserved. 5
Launched new Black&White laser printerspecialized for the needs of the emerging markets
0%
5%
10%
15%
20%
25%
30%
0
1000000
2000000
3000000
4000000
5000000
6000000
7000000
8000000
9000000
2012 2013 2014 2015brother units Other brands units brother share
25%
1
3
2
Affordable pricing (machines and consumables)
Hassle-free Printing Technology prevents paper jam
Asia monochrome laser market size(Qty) & brother target share
High durability enables long-term use
4 Cost reduction achieved by production in Vietnam
HL-1110
DCP-1510
MFC-1810
MFC-1815
11%
15%
20%
Progress in Printing & Solutions

© 2013 Brother Industries, Ltd. All Rights Reserved. 6
Strategic lock stitcher launched
S-7000DD
1
3
2
Price competitiveness achieved by strengthening cost reduction
Compact machining centerSPEEDIO S500X1
compact multi-tasking machineSPEEDIO M140X1
Competitive new products launched to strengthen sales force in Asian markets
<Industrial sewing machines> <Machine tools>Compact machining center and compact multi-tasking machine launched to achieve significant improvement of production efficiency
1
3
2
Dramatic improvement of productivity
Equipped new NC unit that advances usability
Clean sewing without oil staining achieved
Upper-model-sewing-quality achieved
Turning and machining integrated multi-tasking processes offer high productivity
1
3
2
High environmental performance achieved by energy saving functions actively adopted
Equipped new NC unit that advances usability
High environmental performance achieved by energy saving functions actively adopted
Progress in Machinery & Solution

© 2013 Brother Industries, Ltd. All Rights Reserved. 7
Industrial Parts business< strategy >Promote business synergy with Nissei Corporation at an early stage.
Consideration of collaborative expansion in the new business domain
Strategy planning to expand overseas sales of Nissei Corp. products
Network & Contents business< strategy >Strengthen competitiveness of karaoke shop business
Service & Solutions business< strategy >Pursue sales expansion through strengthening product capabilities and expanding service foundation
Personal & Home business< strategy >Expand sales of mid-to high-end lineups and increase marketing in emerging countries
Innov-is V7 JS-20Portable Scanner ADS-1500W
Media Create Co., Ltd. Takeover Bid concluded by Xing
Promotion measures implemented to strengthen directly-managed shops
Progress in Other business
Desktop Color ScannerADS-2500W
Mobile ScannerMDS-700D
Web conference systemOmnijoin
New!

© 2013 Brother Industries, Ltd. All Rights Reserved. 8
Sales are expected to increase due to the positive effect of forex and continuously steady sales of Communications & Printing equipment.
Despite investments for future growth in the P&S business, operating income is expected to increase due to the large effect of yen depreciation.
(100 Millions of Yen)3/2014 3/2013 Change Rate of Change 3/2014 Change
[Forecast] [Actual](w/o forex impact)
[Previous Forecast]
(A) (B) (A - B) (A/B - 1) (C) (A - C)
16.3%(+3.5%)
350 298 52 17.5% 350 05.8% 5.8% 0.1% 6.0% -0.1%
-55 -66 11 -30 -25295 231 64 27.5% 320 -25
-5 48 -53 -15 10125 101 24 120 5165 178 -13 -7.4% 185 -20
(Yen)Exchange USD 96.77 83.23 92.84Rates EUR 127.45 107.57 122.78
6,000 5,161 839 5,850 150
Net Income
Operating Income
Operating Income Ratio
Non-operating Income (Loss)
Current ProfitsExtraordinary Income (Loss)
Income Taxes
Net Sales
Forecast for FY2013(ending March 31,2014)

© 2013 Brother Industries, Ltd. All Rights Reserved.
278 302
416
231 245282
0
250
500 Capital expenditure
Depreciation and amortization392 375404
0
250
500
9
Promoting growth strategy based on the Mid-Term Business Strategy 〈P&S〉 Expand sales of models to emerging countries Larger share in the LBP market
by strengthening approach to corporate customers
〈P&H〉 Expand customer base with products which offer new value
〈Industrial sewing machines〉 Expand sales in emerging markets with high-value-added products
〈Machine tools〉 Expand sales to automobile-related customers by strengthening solutions
〈N&C〉 Maintainand expand the share in Online karaoke machines and strengthen the competitiveness of directly-managed karaoke shops
〈Industrial parts〉 Promote business synergy with Nissei Corporation at an early stage.
Medium-term challenges and approaches
Promote and strengthen “R&D/Production” structure tosupport business growth and profit Aware of the right level of R&D investment and promote its efficiency
Continue capital expenditure aiming for production automation and power saving・R&D expenses(100 Million of yen)
•Capital expenditure/Depreciation and amortization(100 million of yen)
3/2012Actual
3/2013Actual
3/2014Forecast
3/2012Actual
3/2013Actual
3/2014Forecast

© 2013 Brother Industries, Ltd. All Rights Reserved.
CS B2015(Mid-Term Business Strategy)
Grow in all business and all regions
Basic policy of CS B2015 remains unchanged
2010 2011 2012 2013 2015
5,028 4,974 5,1616,000
7,500
10
580
7.7%
Net Sales
Operating Income Ratio
Operatingincome
7,500
(100 million yen)
FY 2015 Targets
Development/expansion of new business/new product
Expansion in emerging market Promote global business strategy Promote M&A and business alliance

© 2013 Brother Industries, Ltd. All Rights Reserved.
Basic policy remains unchanged with consolidated payout ratio of about 30% Dividends forecast for 3/2014 are unchanged from 3/2013
Brother Industries Ltd. acquires its treasury stock held by subsidiary (Nissei Corp.) (upper limit of 4.2 billion yen) (Common shares 3,061,660 shares (upper limit), which accounts for 1.1 % of the total number of issued shares excluding treasury stock)
3/2010 3/20093/2008 3/2011 3/2012 3/2013 3/2014Forecast
2yen of CommemorativeDividend for the 100th Anniversary
Interim end
12 yen
Year end
12 yen
Year end
12 yen
Interim end
12 yen
11
Dividend and Payout ratio

Details of Financial Results forFirst Half & Second Quarter
and Forecasts for FY2013(ended September 30, 2013)
(ending March 31, 2014)

© 2013 Brother Industries, Ltd. All Rights Reserved. 13
Consolidated Results for FY2013 (ending March 31,2014)< FY2013 1H ( 6-month Results ) >
(100 Millions of Yen)
Six months ended Sep. 30, 20131H 3/2014 1H 3/2013 Change Rate of Change
[Actual] [Actual] (w/o foreximpact)
17.9%(+1.3%)
194 196 -3 -1.3%6.7% 8.0% -1.3%-40 4 -45153 200 -47 -23.5%
-3 -7 486 45 4164 148 -84 -56.6%
(Yen)Exchange USD 97.99 79.43 18.56Rates EUR 128.79 101.12 27.67
Extraordinary Income (Loss)
Income TaxesNet Income
Operating IncomeOperating Income RatioNon-operating Income (Loss)
Current Profits
Net Sales 2,884 2,445 438
Net Sales increased due to the positive effect of forex and a steady sales increase in communications & printing equipment. Despite the positive effect of forex, Operating Income decreased due to a sales decrease in the Machinery &Solution business and an
increase in selling and general administrative expenses. Current profits decreased due to the impact of foreign exchange losses. Quarterly Net Income significantly decreased due to decreased Current Profits and an increase in income taxes caused by tax effect
accounting.
© 2013 Brother Industries, Ltd. All Rights Reserved.
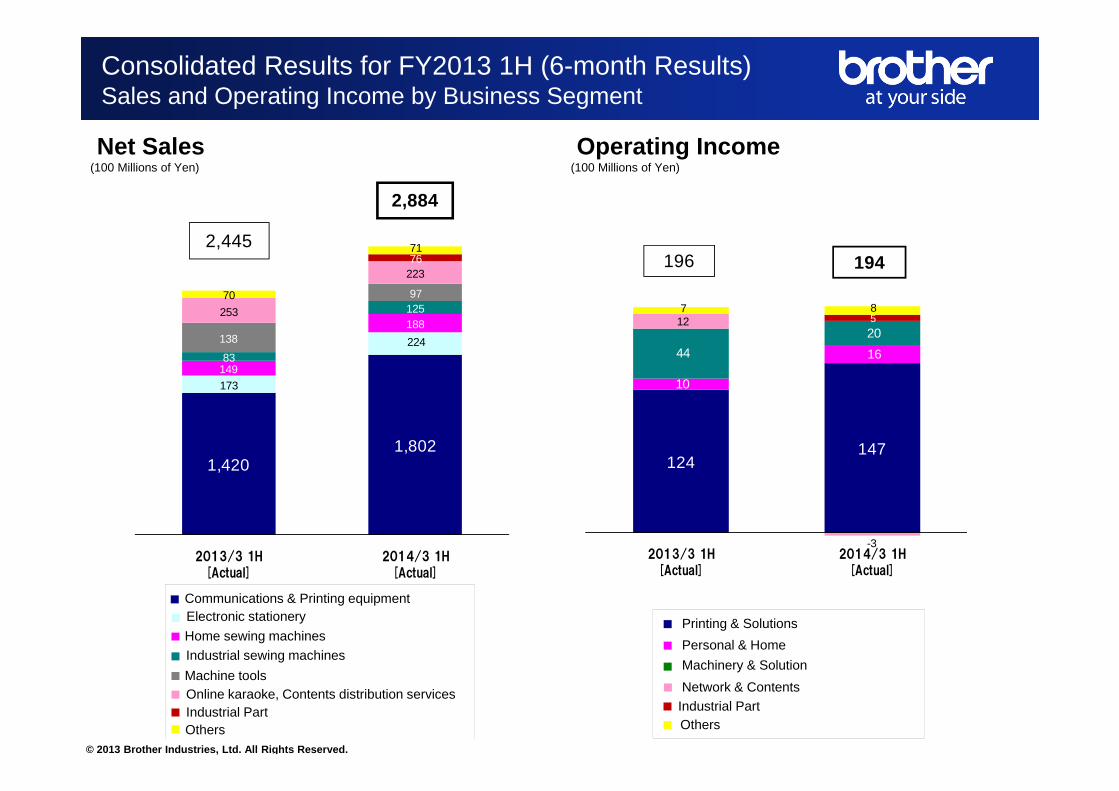
Consolidated Results for FY2013 1H (6-month Results)Sales and Operating Income by Business Segment
Net Sales(100 Millions of Yen)
Operating Income(100 Millions of Yen)
Communications & Printing equipmentElectronic stationeryHome sewing machinesIndustrial sewing machinesMachine toolsOnline karaoke, Contents distribution services
Others
Network & ContentsMachinery & SolutionPersonal & HomePrinting & Solutions
OthersIndustrial Part Industrial Part
173
224
149
188
83
125
138
97 253
22376
70
71
1,4201,802
2013/3 1H
[Actual]
2014/3 1H
[Actual]
2,884
2,445
124147
10
164420
12
-3
7 85
2013/3 1H
[Actual]
2014/3 1H
[Actual]
194196

© 2013 Brother Industries, Ltd. All Rights Reserved. 15
Main Factors for Changes in Operating Income< FY2013 1H ( 6-month Results ) >
196 194
0
50
100
150
200
250
300
350
400
2012 1HOperatingIncome
Diff.in sales
Pricechange
Costchange
Foreximpact
SG&A R&Dexpense
2013 1HOperatingIncome
100 Millions of Yen
-8+10
-2
-3(-1.3%)
-51
+82
-33

© 2013 Brother Industries, Ltd. All Rights Reserved. 16
Printing & Solutions Sales & Operating Income< FY2013 1H(6-month Results ) >
Net Sales(100 Millions of Yen)
Operating Income(100 Millions of Yen)
Electronic stationeryGeographical Sales(100 Millions of Yen)
Communications & Printing equipmentGeographical Sales(100 Millions of Yen)
Change(w/o forex impact)
173 224
1,420
1,802
1,594
2,025
0
500
1,000
1,500
2,000
2,500
3/2013 1H 3/2014 1H
124
147
7.8% 7.3%
0.0%
10.0%
20.0%
30.0%
0
100
200
300
3/2013 1H 3/2014 1H
Operating Income Ratio
+26.8% ( +5.9% )
Communications &Printing equipment
Electronic stationery +29.0% ( +6.9% )
Total+27.1% ( +6.0% )
3/2013 1H 3/2014 1H
Americas 540 738 +36.6% (+11.9%)
Europe 464 569 +22.6% (-2.9%)
Asia & Others 199 258 +29.8% (+7.1%)
Japan 217 236 +8.8% (+8.8%)
Change(w /o forex impact)
3/2013 1H 3/2014 1H
Americas 83 107 +29.3% (+5.5%)
Europe 51 65 +26.5% (+0.0%)
Asia & Others 20 28 +38.2% (+12.9%)
Japan 19 24 +24.8% (+24.8%)
Change(w /o forex impact)
Sales increased in each region due to the positive effect of forex. However, sales in Europe, due to sluggish demand, showed a year-to-year decrease on a local currency basis.
Operating income, despite an increase in SG&A, increased due to the positive effect of forex.

© 2013 Brother Industries, Ltd. All Rights Reserved. 17
Net Sales(100 Millions of Yen)
Operating Income(100 Millions of Yen)
Change(w/o forex impact)
Home sewing machinesGeographical Sales(100 Millions of Yen)
Personal & Home Sales & Operating Income< FY2013 1H(6-month Results ) >
149
188
0
50
100
150
200
250
3/2013 1H 3/2014 1H
10
16
6.6%
8.6%
0.0%
10.0%
20.0%
0
5
10
15
20
3/2013 1H 3/2014 1H
Operating Income Ratio
Home sew ing machines
+25.7% ( +5.0% )
3/2013 1H 3/2014 1H
Americas 73 99 +35.0% (+10.4%)
Europe 36 46 +30.2% (+1.8%)
Asia & Others 13 16 +24.3% (+2.7%)
Japan 27 26 -4.1% (-4.1%)
Change(w /o forex impact) Although demand in Europe was
slightly weak, strong sales in Americas continued and became a driving force for sales increase.
Operating income increased partly due to the positive effect of forex.

© 2013 Brother Industries, Ltd. All Rights Reserved. 18
Net Sales(100 Millions of Yen)
Operating Income(100 Millions of Yen)
Change(w/o forex impact)
Industrial sewing machinesGeographical Sales(100 Millions of Yen)
Machine toolsGeographical Sales(100 Millions of Yen)
*As machine tools are mostly exported to customers abroad directly from Japan, sales are reported in ‘Japan’ segment regardless of destination of exports. Therefore, for the purpose of this material, the regional breakdown ratios of exports from Japan multiplied by total consolidated sales is shown here.
Machinery & Solution Sales & Operating Income< FY2013 1H(6-month Results ) >
296
176
83
125
379
300
0
100
200
300
400
500
3/2013 1H 3/2014 1H
44
20
11.6%
6.8%0.0%
10.0%
20.0%
30.0%
40.0%
0
20
40
60
80
3/2013 1H 3/2014 1H
Operating Income Ratio
Industrial sewing machines+49.8% ( +20.5% )
Machine tools-40.6% ( -44.8% )
Total-20.7% ( -30.5% )
3/2013 1H 3/2014 1H
Americas 16 22 +36.4% (+10.6%)
Europe 13 17 +33.7% (+4.7%)
Asia & Others 51 82 +59.9% (+28.0%)
Japan 3 3 +16.1% (+16.1%)
Change(w /o forex impact) 3/2013 1H 3/2014 1H
Americas 10 10
Europe 6 6
Asia & Others 253 142
Japan 27 18
+4.2%
-2.1%
-44.0%
-32.3%
Change Sales of industrial sewing machines increased due to the recovery of demand in Asia.
Sales of machine tools decreased due to a downturn in IT related demand.
With decreased total sales, total operating income decreased.

© 2013 Brother Industries, Ltd. All Rights Reserved. 19
Net Sales(100 Millions of Yen)
Operating Income(100 Millions of Yen)
Change
* Regional sales breakdown for “Network & Contents” is not referred here because the major part of sales are made in Japan.
Network & Contents Sales & Operating Income< FY2013 1H(6-month Results ) >
253
223
0
100
200
300
400
3/2013 1H 3/2014 1H
12
-3
4.8%
- 1.3%
-10.0%
0.0%
10.0%
20.0%
-10
0
10
20
3/2013 1H 3/2014 1H
Operating Income Ratio
-12.1%
Sales decreased due to a recoil reduction against new Karaoke machines launched in the previous year.
Operating income fell into the red due to a sales decrease and an increase in SG&A including costs for remodeling directly-managed karaoke shops.

© 2013 Brother Industries, Ltd. All Rights Reserved. 20
Sales have been revised upward due to changes of the assumed exchange rates, although sales of Communications & Printing equipment in Europe have been revised downward.
Operating income has remained unchanged, because, despite a positive effect from changes of the assumed rates in light of the yen’s depreciation, the effect is offset by downwardly-revised outlooks for the Europe P&S and the N&C businesses.
Current profits and Net income have been revised downward by factoring in foreign exchange losses associated with changes of the assumed rates in light of the yen’s depreciation.
Revised Forecast for FY 2013 ( ending March 31, 2014)
(100 Millions of Yen)3/2014 3/2013 Change Rate of Change 3/2014 Change
[Forecast] [Actual](w/o forex impact)
[Previous Forecast]
(A) (B) (A - B) (A/B - 1) (C) (A - C)
16.3%(+3.5%)
350 298 52 17.5% 350 05.8% 5.8% 0.1% 6.0% -0.1%
-55 -66 11 -30 -25295 231 64 27.5% 320 -25
-5 48 -53 -15 10125 101 24 120 5165 178 -13 -7.4% 185 -20
(Yen)Exchange USD 96.77 83.23 92.84Rates EUR 127.45 107.57 122.78
6,000 5,161 839 5,850 150
Net Income
Operating Income
Operating Income Ratio
Non-operating Income (Loss)
Current ProfitsExtraordinary Income (Loss)
Income Taxes
Net Sales
Changes from the previous forecast

© 2013 Brother Industries, Ltd. All Rights Reserved. 21
Communications & Printing equipmentElectronic stationeryHome sewing machinesIndustrial sewing machinesMachine toolsOnline karaoke, Contents distribution services
Others
Network & ContentsMachinery & SolutionPersonal & HomePrinting & Solutions
Others
Net Sales(100 Millions of Yen)
Operating Income(100 Millions of Yen)
Consolidated Forecast for FY2013 (ending March 31,2014)Sales and Operating Income by Business Segment
Industrial Part Industrial Part
3,1353,638 3,760
373
440 454338
398 417
189
251260
425
298298
501
525505
161 160
199
139 146
3/2013
[Actual]
3/2014
[Previous Forecast]
3/2014
[Forecast]
5,850
5,161
6,000
188251 251
25
32 32
40
23 23
23
21 21 11 11
21
12 12
3/2013
[Actual]
3/2014
[Previous Forecast]
3/2014
[Forecast]
350
298
350

© 2013 Brother Industries, Ltd. All Rights Reserved. 22
Net Sales(100 Millions of Yen)
Operating Income(100 Millions of Yen)
Change(w/o forex impact)
Communications &Printing equipmentGeographical Sales(100 Millions of Yen)
Electronic stationeryGeographical Sales(100 Millions of Yen)
Printing & Solutions Sales & Operating Income< Forecast for FY2013( ending March 31,2014 ) >
373 440 454
3,135 3,638 3,760
3,508
4,078 4,214
0
1,000
2,000
3,000
4,000
5,000
3/2013 Actual 3/2014Previous Forecast
3/2014 Forecast
188
251 253
5.4%6.2% 6.0%
0.0%
5.0%
10.0%
15.0%
20.0%
0
100
200
300
400
3/2013 Actual 3/2014Previous Forecast
3/2014 Forecast
Operating Income Ratio
+19.9% ( +4.4% )
Communications &Printing equipment
+21.6% ( +6.2% )
Electronic stationery
Total
+20.1% ( +4.6% )
3/2013Actual
3/2014Prev iousForecast
3/2014Forecast
Americas 1,193 1,398 1,506 +26.2% (+6.1%)
Europe 1,081 1,243 1,251 +15.7% (-1.5%)
Asia & Others 406 492 506 +24.7% (+9.6%)
Japan 454 505 497 +9.4% (+9.4%)
Change(w /o forex impact)
3/2013Actual
3/2014Prev iousForecast
3/2014Forecast
Americas 176 206 212 +20.8% (+4.0%)
Europe 114 136 139 +22.3% (+3.7%)
Asia & Others 43 53 55 +28.0% (+11.6%)
Japan 41 45 48 +16.5% (+16.5%)
Change(w /o forex impact)

© 2013 Brother Industries, Ltd. All Rights Reserved. 23
Net Sales(100 Millions of Yen)
Operating Income(100 Millions of Yen)
Change(w/o forex impact)
Home sewing machinesGeographical Sales(100 Millions of Yen)
Personal & Home Sales & Operating Income< Forecast for FY2013( ending March 31,2014 ) >
338
398 417
0
100
200
300
400
500
3/2013 Actual 3/2014Previous Forecast
3/2014 Forecast
25
3234
7.4% 8.0% 8.2%
0.0%
5.0%
10.0%
15.0%
20.0%
0
10
20
30
40
3/2013 Actual 3/2014Previous Forecast
3/2014 Forecast
Operating Income Ratio
Home sew ing machines
+23.4% ( +8.6% )
3/2013Actual
3/2014Prev iousForecast
3/2014Forecast
Americas 174 205 222 +27.6% (+10.2%)
Europe 78 91 96 +23.5% (+3.8%)
Asia & Others 28 35 36 +29.9% (+14.7%)
Japan 59 67 63 +7.4% (+7.4%)
Change(w /o forex impact)

© 2013 Brother Industries, Ltd. All Rights Reserved. 24
Net Sales(100 Millions of Yen)
Operating Income(100 Millions of Yen)
Change(w/o forex impact)
Industrial sewing machinesGeographical Sales(100 Millions of Yen)
Machine toolsGeographical Sales(100 Millions of Yen)
*As machine tools are mostly exported to customers abroad directly from Japan, sales are reported in ‘Japan’ segment regardless of destination of exports. Therefore, for the purpose of this material, the regional breakdown ratios of exports from Japan multiplied by total consolidated sales is shown here.
Machinery & Solution Sales & Operating Income< Forecast for FY2013( ending March 31,2014 ) >
425298 298
189
251 260
614549 558
0
200
400
600
800
1,000
3/2013 Actual 3/2014Previous Forecast
3/2014 Forecast
40
23 246.5%
4.2% 4.3%
0.0%
10.0%
20.0%
0
50
100
3/2013 Actual 3/2014Previous Forecast
3/2014 Forecast
Operating Income Ratio
Industrial sewing machines+37.5% ( +17.9% )
Machine tools-29.9% ( -35.1% )
Total-9.1% ( -18.8% )
3/2013Actual
3/2014Prev iousForecast
3/2014Forecast
Americas 36 42 43 +18.7% (+2.2%)
Europe 30 39 38 +27.1% (+7.3%)
Asia & Others 117 166 174 +48.1% (+26.7%)
Japan 5 4 5 -9.1% (-9.1%)
Change(w /o forex impact)
3/2013Actual
3/2014Prev iousForecast
3/2014Forecast
Americas 20 18 20 -0.5%
Europe 11 13 13 +15.2%
Asia & Others 348 232 228 -34.4%
Japan 46 35 37 -19.7%
Change

© 2013 Brother Industries, Ltd. All Rights Reserved. 25
Operating Income(100 Millions of Yen)
Change
* Regional sales breakdown for “Network & Contents” is not referred here because the major part of sales are made in Japan.
Network & Contents Sales & Operating Income< Forecast for FY2013( ending March 31,2014 ) >
Net Sales(100 Millions of Yen)
501 525505
0
200
400
600
800
3/2013 Actual 3/2014Previous Forecast
3/2014 Forecast
23 21
14
4.6%4.0%
2.8%
0.0%
5.0%
10.0%
15.0%
20.0%
0
10
20
30
40
3/2013 Actual 3/2014Previous Forecast
3/2014 Forecast
Operating Income Ratio
+0.8%

© 2013 Brother Industries, Ltd. All Rights Reserved. 26
Consolidated Results for FY2013(ending March 31,2014)< FY2013 Q2(3-month Results ) >
(100 Millions of Yen)[Reference data]
Three months ended Sep. 30, 2013Q2 3/2014 Q2 3/2013 Change Rate of Change
[Actual] [Actual] (w/o forex impact)
20.3%(+2.1%)
100 81 19 23.3%6.7% 6.5% 0.2%
-5 -3 -294 78 17 21.3%-3 -4 040 29 1151 45 6 12.3%
(Yen)Exchange USD 98.20 78.42 19.78Rates EUR 130.17 98.30 31.87
Extraordinary Income (Loss)
Income TaxesNet Income
Operating IncomeOperating Income RatioNon-operating Income (Loss)
Current Profits
1,490 1,239 252Net Sales
Sales increased due to the positive effect of forex and continuously strong sales of Communications & Printing equipment, although sales of Machine tools and Online karaoke machines significantly decreased.
Operating income increased due to the large positive effect of forex, despite negative factors including sales decreases of Machine tools and Online karaoke machines and an increase in SG&A.

© 2013 Brother Industries, Ltd. All Rights Reserved. 27
Main Factors for Changes in Operating Income< FY2013 Q2 ( 3-month Results ) >
81
0
50
100
150
200
2012 Q2OperatingIncome
Diff.in sales
Pricechange
Costchange
Foreximpact
SG&A R&Dexpense
2013 Q2OperatingIncome
100 Millions of Yen
-6+2
-0
+19(+23.3%)
-29
+59
-7100

© 2013 Brother Industries, Ltd. All Rights Reserved. 28
Net Sales(100 Millions of Yen)
Operating Income(100 Millions of Yen)
Electronic stationeryGeographical Sales(100 Millions of Yen)
Communications & Printing equipmentGeographical Sales(100 Millions of Yen)
Change(w/o forex impact)
Printing & Solutions Sales & Operating Income< FY2013 Q2(3-month Results ) >
89 115
700
938
789
1,053
0
500
1,000
1,500
Q2 3/2013 (3-month Results) Q2 3/2014 (3-month Results)
36
72
4.5%
6.9%
0.0%
10.0%
20.0%
0
50
100
Q2 3/2013 (3-month Results) Q2 3/2014 (3-month Results)
Operating Income Ratio
+34.0% ( +10.5% )
Communications &Printing equipment
+29.8% ( +5.8% )
Electronic stationery
Total+33.5% ( +10.0% )
Q2 3/2013(3-monthResults)
Q2 3/2014(3-monthResults)
Americas 271 383 +41.4% (+14.5%)
Europe 221 295 33.3% (+2.2%)
Asia & Others 97 134 +38.7% (+14.9%)
Japan 111 126 +13.3% (+13.3%)
Change(w /o forex impact)
Q2 3/2013(3-monthResults)
Q2 3/2014(3-monthResults)
Americas 42 55 +32.5% (+6.9%)
Europe 26 34 +32.6% (+1.5%)
Asia & Others 10 13 +38.4% (+12.2%)
Japan 11 12 +5.7% (+5.7%)
Change(w /o forex impact)

© 2013 Brother Industries, Ltd. All Rights Reserved. 29
Net Sales(100 Millions of Yen)
Operating Income(100 Millions of Yen)
Change(w/o forex impact)
Home sewing machinesGeographical Sales(100 Millions of Yen)
Personal & Home Sales & Operating Income< FY2013 Q2(3-month Results ) >
76
105
0
50
100
150
Q2 3/2013 (3-month Results) Q2 3/2014 (3-month Results)
5
10
6.9%9.2%
0.0%
10.0%
20.0%
30.0%
0
5
10
15
Q2 3/2013 (3-month Results) Q2 3/2014 (3-month Results)
Operating Income Ratio
Home sew ing machines
+38.7% ( +14.0% )
Q2 3/2013(3-monthResults)
Q2 3/2014(3-monthResults)
Americas 39 59 +52.1% (+23.0%)
Europe 17 25 +45.8% (+10.1%)
Asia & Others 7 8 +26.2% (+5.0%)
Japan 13 13 -3.0% (-3.0%)
Change(w /o forex impact)

© 2013 Brother Industries, Ltd. All Rights Reserved. 30
Net Sales(100 Millions of Yen)
Operating Income(100 Millions of Yen)
Change(w/o forex impact)
Industrial sewing machinesGeographical Sales(100 Millions of Yen)
Machine toolsGeographical Sales(100 Millions of Yen)
*As machine tools are mostly exported to customers abroad directly from Japan, sales are reported in ‘Japan’ segment regardless of destination of exports. Therefore, for the purpose of this material, the regional breakdown ratios of exports from Japan multiplied by total consolidated sales is shown here.
Machinery & Solution Sales & Operating Income< FY2013 Q2(3-month Results ) >
158
79
41
63
199
141
0
100
200
300
Q2 3/2013 (3-month Results) Q2 3/2014 (3-month Results)
24
12
12.0%8.6%
0.0%
10.0%
20.0%
30.0%
40.0%
0
10
20
30
40
Q2 3/2013 (3-month Results) Q2 3/2014 (3-month Results)
Operating Income Ratio
Industrial sewing machines+51.6% ( +19.9% )
Machine tools-50.2% ( -54.4% )
Total-29.1% ( -39.0% )
Q2 3/2013(3-monthResults)
Q2 3/2014(3-monthResults)
Americas 8 11 +43.9% (+15.1%)
Europe 6 9 +42.3% (+7.5%)
Asia & Others 26 41 +58.3% (+24.7%)
Japan 1 2 +12.0% (+12.0%)
Change(w /o forex impact)
Q2 3/2013(3-monthResults)
Q2 3/2014(3-monthResults)
Americas 4 5 +10.7%
Europe 2 3Asia & Others 139 60 -56.8%
Japan 13 11 -15.5%
Change(w /o forex impact)
+43.4%

© 2013 Brother Industries, Ltd. All Rights Reserved. 31
Net Sales(100 Millions of Yen)
Operating Income(100 Millions of Yen)
Change
• Regional sales breakdown for “Network & Contents” is not referred here because majority of sales are made in Japan.
Network & Contents Sales & Operating Income< FY2013 Q2(3-month Results ) >
143
112
0
50
100
150
200
Q2 3/2013 (3-month Results) Q2 3/2014 (3-month Results)
14
-1
9.7%
-1.0%
-5.0%
0.0%
5.0%
10.0%
15.0%
20.0%
-5
0
5
10
15
20
Q2 3/2013 (3-month Results) Q2 3/2014 (3-month Results)
Operating Income Ratio
-21.7%

© 2013 Brother Industries, Ltd. All Rights Reserved.
105162
302
416
108 125
245282
0
200
400
Capital expenditure
Depreciation and amortization
32
Capital expenditure and Depreciation and amortization(100 Millions of Yen)
R&D expenses(100 Millions of Yen)
Inventories(100 Millions of Yen)
(Number of months)
Inventories Inventories / Cost of sales
R&D expenses, Capital expenditure, Depreciation and amortization and Inventories
1H 3/2013 Actual
3/2013Actual
3/2014 Forecast
1H 3/2014 Actual
1H 3/2013 Actual
3/2013Actual
3/2014 Forecast
1H 3/2014 Actual
181 190
375404
0
200
400
770 779 765 788 851 891 877 912 977
3.4 3.2 3.1 3.5 3.6 3.4 3.2 3.4 3.5
0.0
1.0
2.0
3.0
4.0
5.0
6.0
0
500
1,000
Sep-11 Dec-11 Mar-12 Jun-12 Sep-12 Dec-12 Mar-13 Jun-13 Sep-13