First Half 2008 Results Presentation - Home - Bialetti · First Half 2008 Key Facts First Half...
21
First Half 2008 Results Presentation September 1, 2008
Transcript of First Half 2008 Results Presentation - Home - Bialetti · First Half 2008 Key Facts First Half...
First Half 2008Results Presentation
September 1, 2008

2
AGENDA
First Half 2008 Key Facts
First Half 2008 Financial Overview
Strategy & 2008 Outlook
Appendices
3
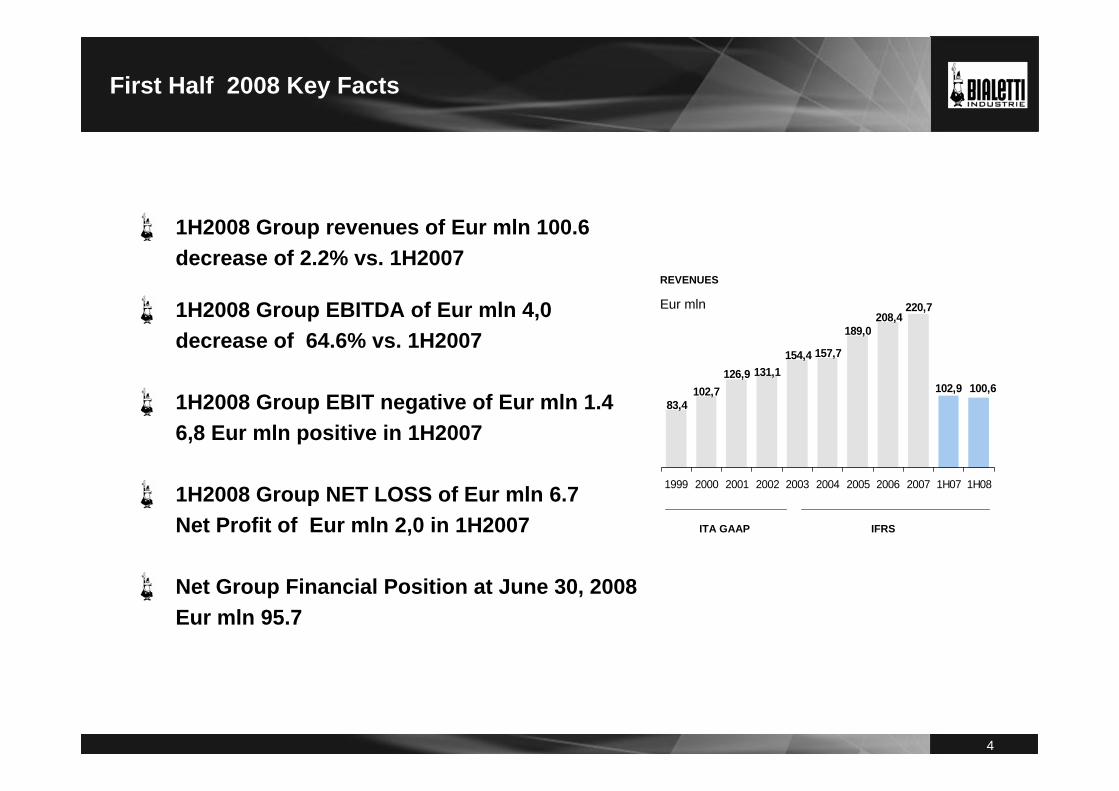
First Half 2008 Key Facts
4
100,6
220,7
102,9
208,4189,0
157,7154,4131,1126,9
102,783,4
1999 2000 2001 2002 2003 2004 2005 2006 2007 1H07 1H08
First Half 2008 Key Facts
1H2008 Group revenues of Eur mln 100.6 decrease of 2.2% vs. 1H2007
1H2008 Group EBITDA of Eur mln 4,0 decrease of 64.6% vs. 1H2007
1H2008 Group EBIT negative of Eur mln 1.4 6,8 Eur mln positive in 1H2007
1H2008 Group NET LOSS of Eur mln 6.7 Net Profit of Eur mln 2,0 in 1H2007
Net Group Financial Position at June 30, 2008 Eur mln 95.7
ITA GAAP IFRS
Eur mln
REVENUES
5
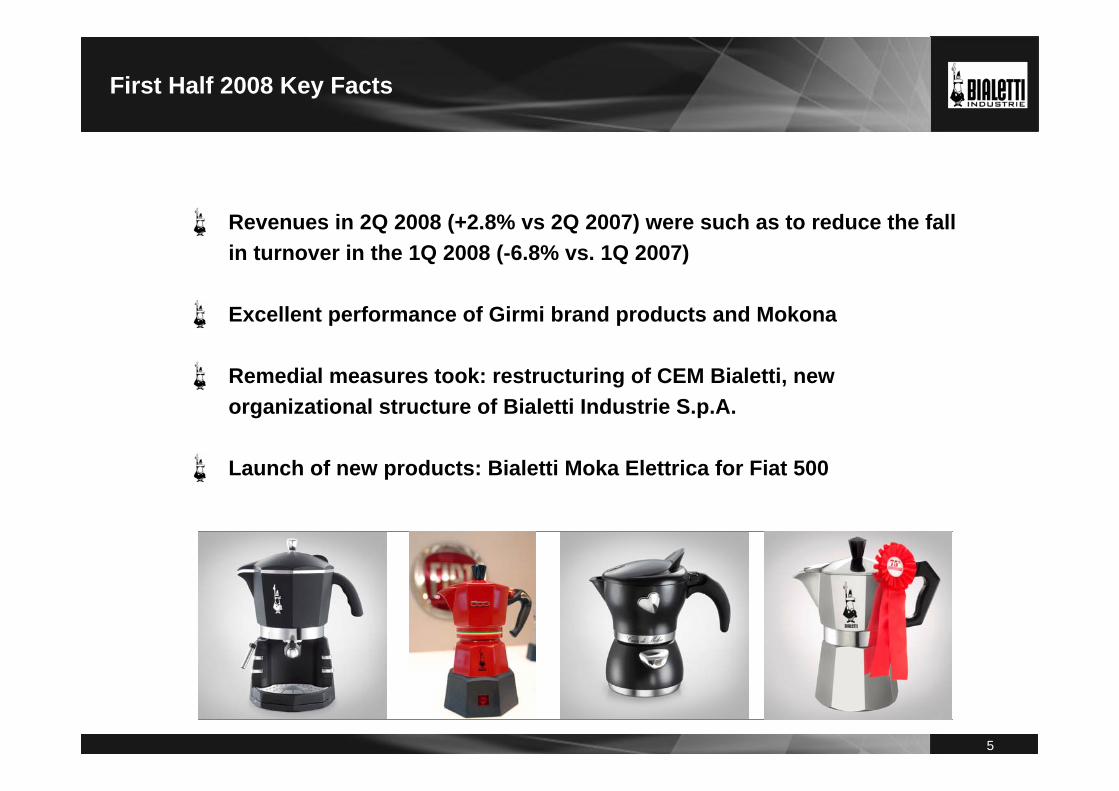
Revenues in 2Q 2008 (+2.8% vs 2Q 2007) were such as to reduce the fall in turnover in the 1Q 2008 (-6.8% vs. 1Q 2007)
Excellent performance of Girmi brand products and Mokona
Remedial measures took: restructuring of CEM Bialetti, new organizational structure of Bialetti Industrie S.p.A.
Launch of new products: Bialetti Moka Elettrica for Fiat 500
First Half 2008 Key Facts
6
First Half 2008 Financial Overview
7
11,4
4
1H 2008 1H 2007
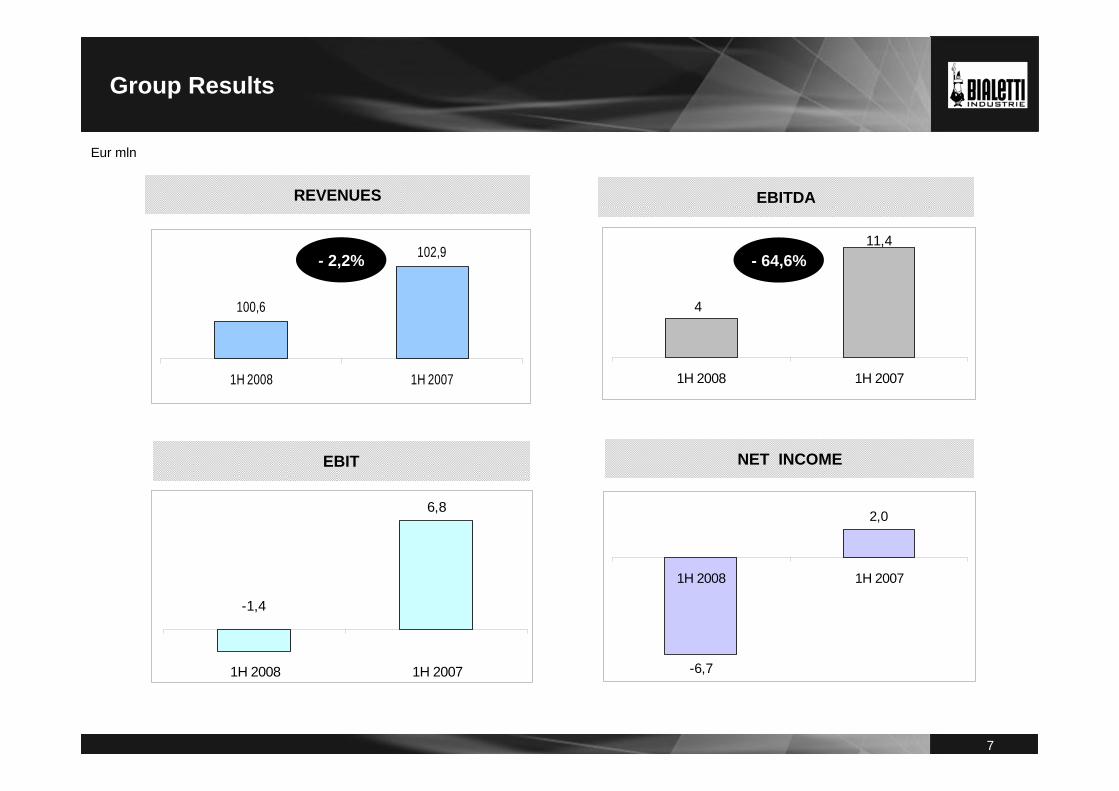
Group Results
Eur mln
REVENUES
100,6
102,9
1H 2008 1H 2007
- 2,2%
EBITDA
- 64,6%
EBIT NET INCOME
-6,7
2,0
1H 2008 1H 2007
6,8
-1,4
1H 2008 1H 2007
8
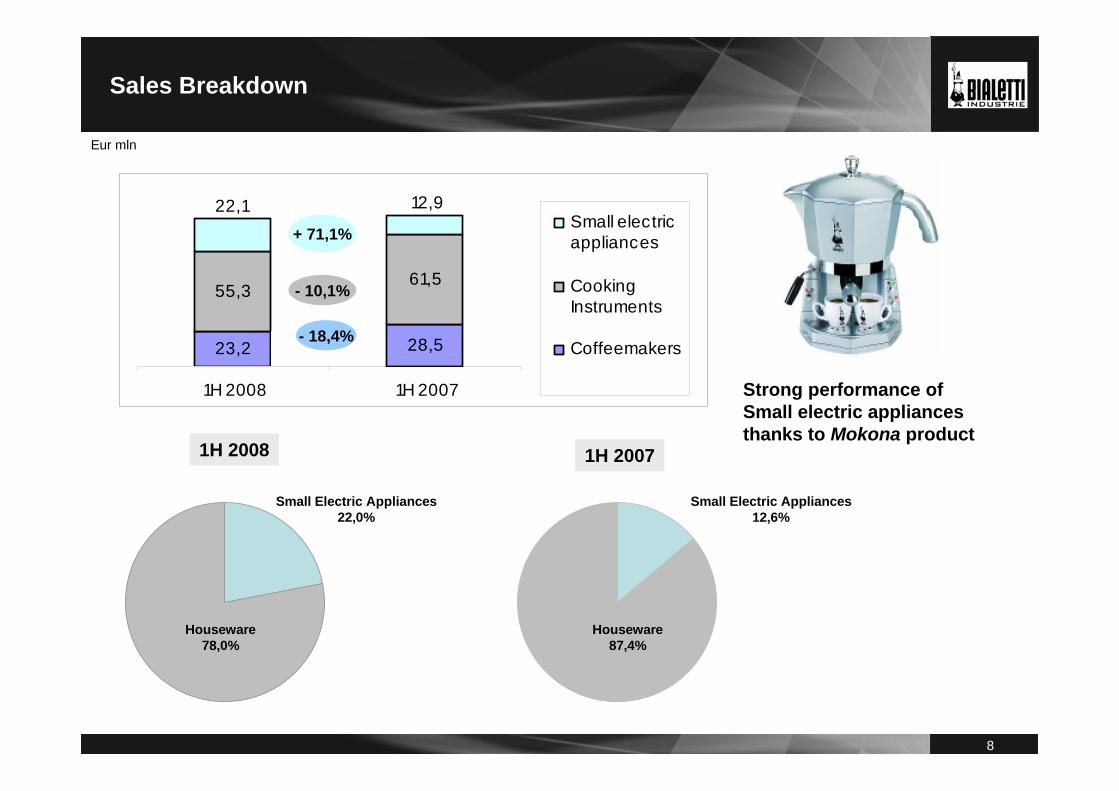
Sales Breakdown
Eur mln
23,2 28,5
55,361,5
12,922,1
1H 2008 1H 2007
Small electricappliances
CookingInstruments
Coffeemakers- 18,4%
+ 71,1%
- 10,1%
Strong performance of Small electric appliances thanks to Mokona product
1H 2008 1H 2007
Small Electric Appliances12,6%
Houseware87,4%
Small Electric Appliances22,0%
Houseware78,0%
9
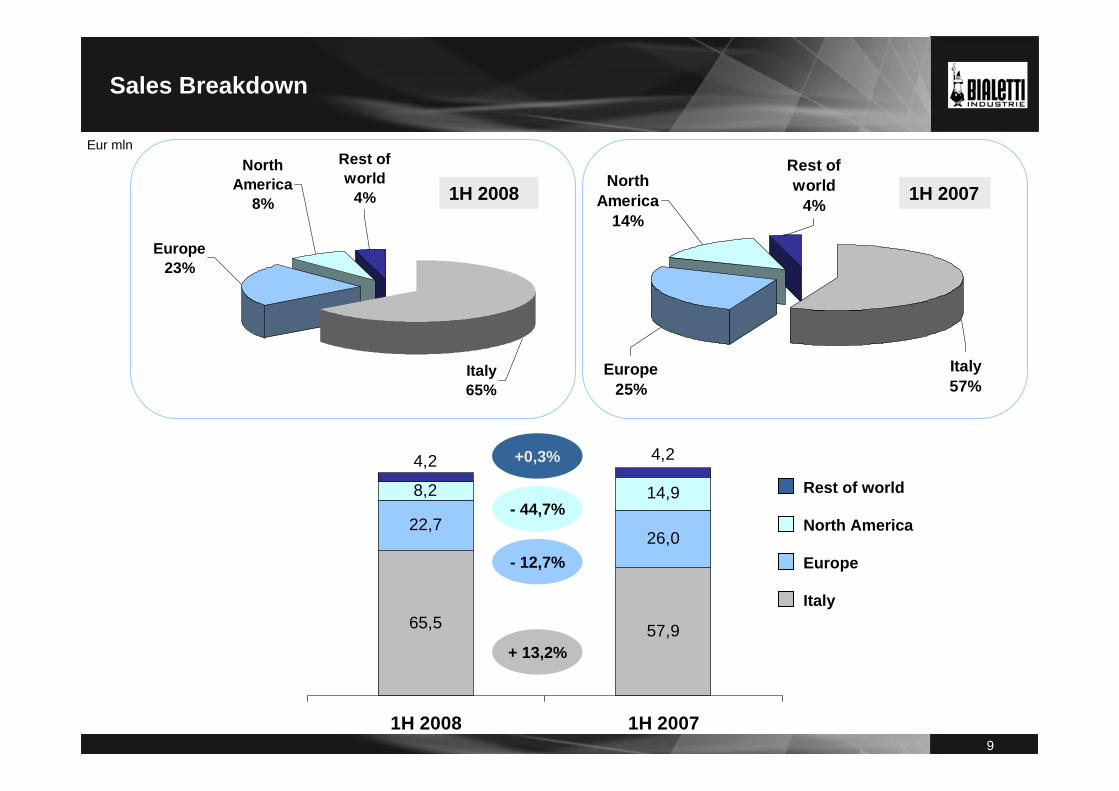
Sales Breakdown
Eur mln
Europe23%
Italy65%
Rest of world
4%
North America
8% 1H 2008
Europe25%
Italy57%
Rest of world
4%North
America14%
1H 2007
65,5 57,9
22,726,0
8,2 14,9
4,2 4,2
1H 2008 1H 2007
- 44,7%
- 12,7%
+ 13,2%
+0,3%
Italy
Europe
North America
Rest of world
10
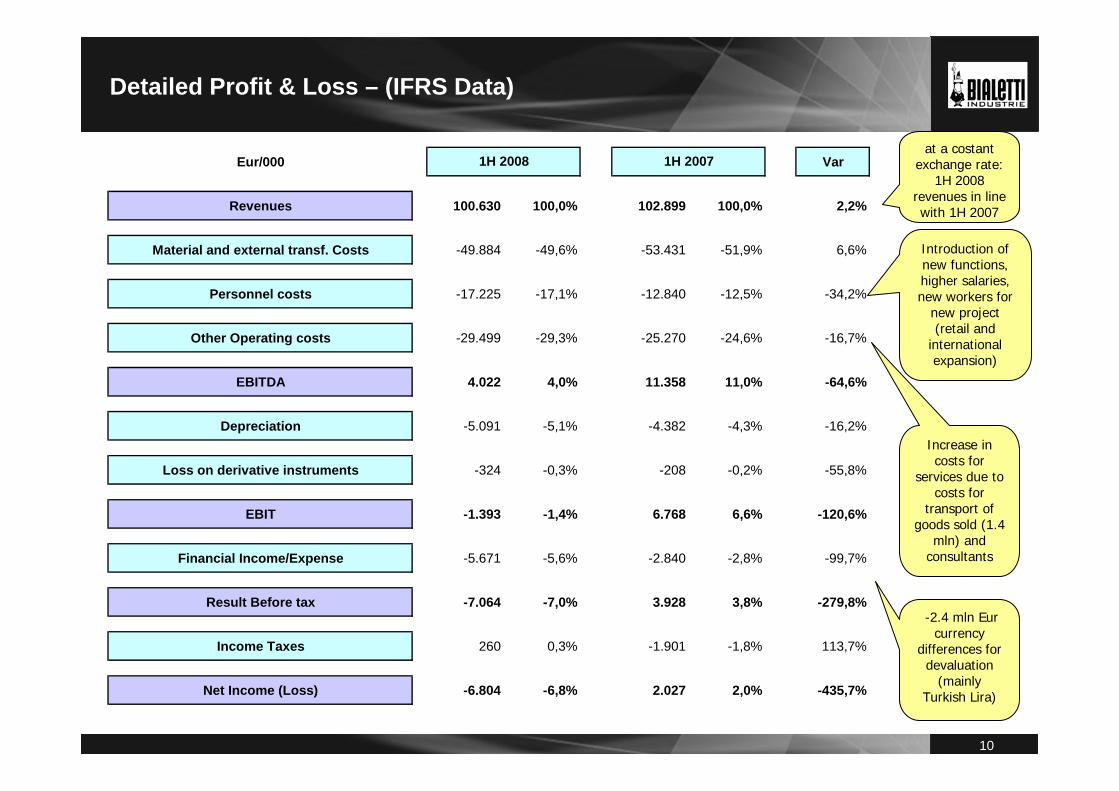
Detailed Profit & Loss – (IFRS Data)
Introduction of new functions, higher salaries, new workers for
new project (retail and
internationalexpansion)
-2.4 mln Eurcurrency
differences fordevaluation
(mainlyTurkish Lira)
Increase in costs for
services due tocosts for
transport of goods sold (1.4
mln) and consultants
at a costantexchange rate:
1H 2008 revenues in line with 1H 2007
Eur/000 Var
Revenues 100.630 100,0% 102.899 100,0% 2,2%
Material and external transf. Costs -49.884 -49,6% -53.431 -51,9% 6,6%
Personnel costs -17.225 -17,1% -12.840 -12,5% -34,2%
Other Operating costs -29.499 -29,3% -25.270 -24,6% -16,7%
EBITDA 4.022 4,0% 11.358 11,0% -64,6%
Depreciation -5.091 -5,1% -4.382 -4,3% -16,2%
Loss on derivative instruments -324 -0,3% -208 -0,2% -55,8%
EBIT -1.393 -1,4% 6.768 6,6% -120,6%
Financial Income/Expense -5.671 -5,6% -2.840 -2,8% -99,7%
Result Before tax -7.064 -7,0% 3.928 3,8% -279,8%
Income Taxes 260 0,3% -1.901 -1,8% 113,7%
Net Income (Loss) -6.804 -6,8% 2.027 2,0% -435,7%
1H 2008 1H 2007
11
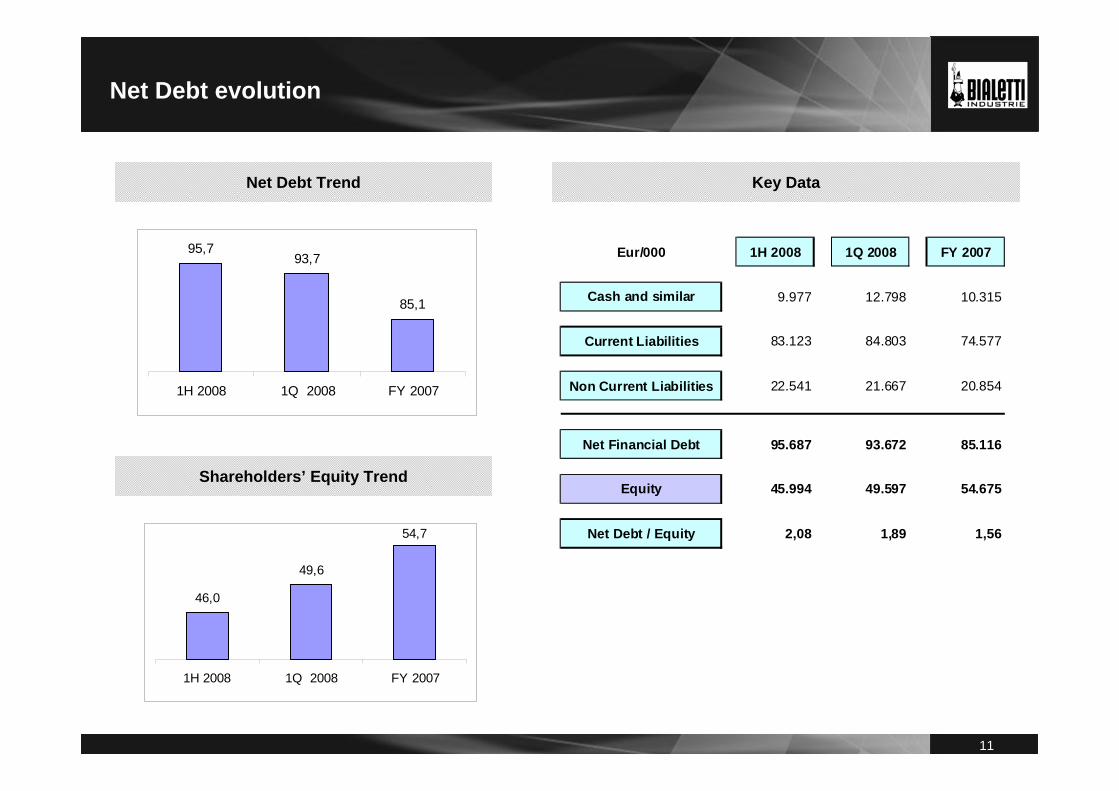
Net Debt evolution
Net Debt Trend Key Data
Shareholders’ Equity Trend
Eur/000 1H 2008 1Q 2008 FY 2007
Cash and similar 9.977 12.798 10.315
Current Liabilities 83.123 84.803 74.577
Non Current Liabilities 22.541 21.667 20.854
Net Financial Debt 95.687 93.672 85.116
Equity 45.994 49.597 54.675
Net Debt / Equity 2,08 1,89 1,56
95,793,7
85,1
1H 2008 1Q 2008 FY 2007
46,0
49,6
54,7
1H 2008 1Q 2008 FY 2007
12
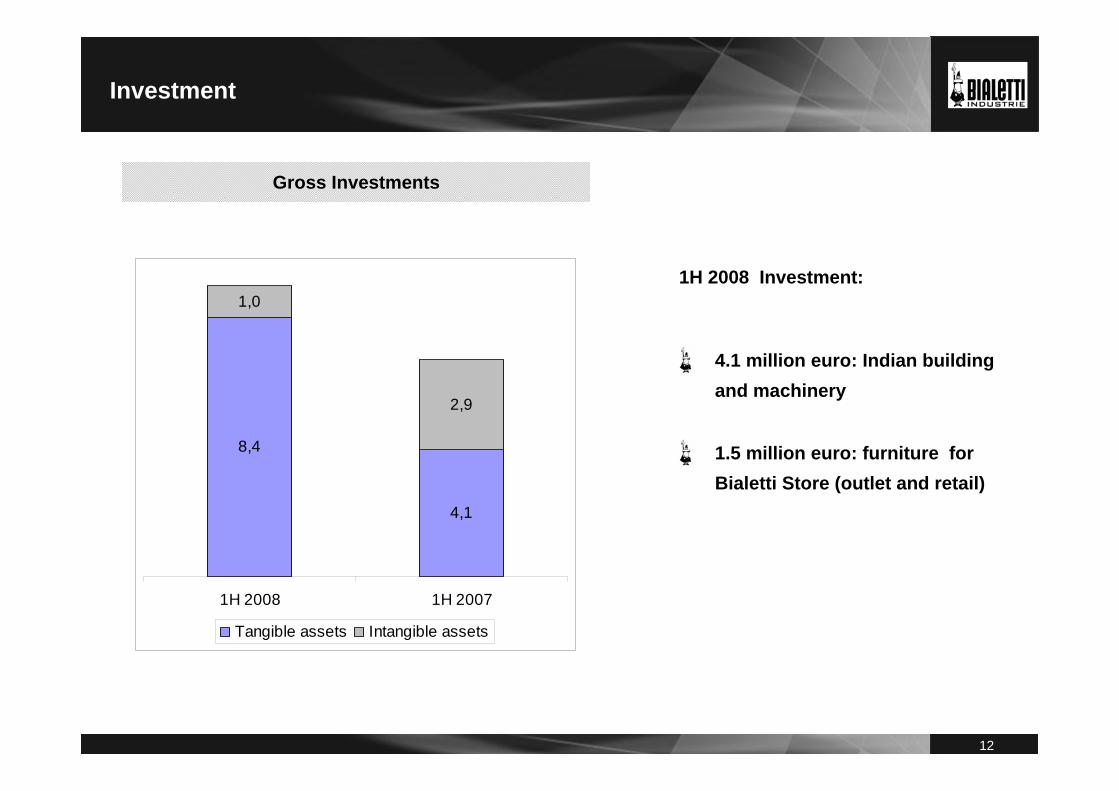
Investment
Gross Investments
1H 2008 Investment:
4.1 million euro: Indian building and machinery
1.5 million euro: furniture forBialetti Store (outlet and retail)
8,4
4,1
1,0
2,9
1H 2008 1H 2007
Tangible assets Intangible assets
13
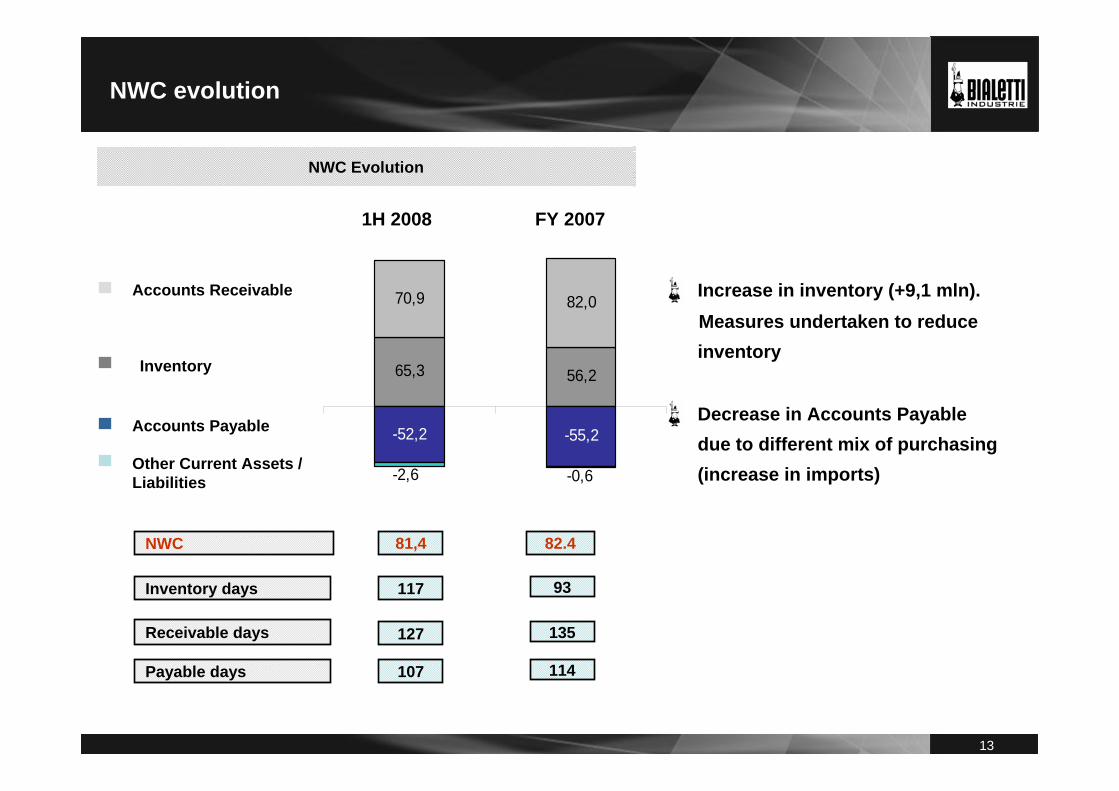
65,3 56,2
70,9 82,0
-52,2 -55,2
-0,6-2,6
NWC evolution
NWC Evolution
NWC 81,4 82.4
1H 2008 FY 2007
Increase in inventory (+9,1 mln).Measures undertaken to reduce inventory
Decrease in Accounts Payable due to different mix of purchasing (increase in imports)
Inventory days 93
Receivable days 135
Payable days 114
117
127
107
Other Current Assets / Liabilities
Accounts Payable
Inventory
Accounts Receivable

14
Strategy & 2008 Outlook
15
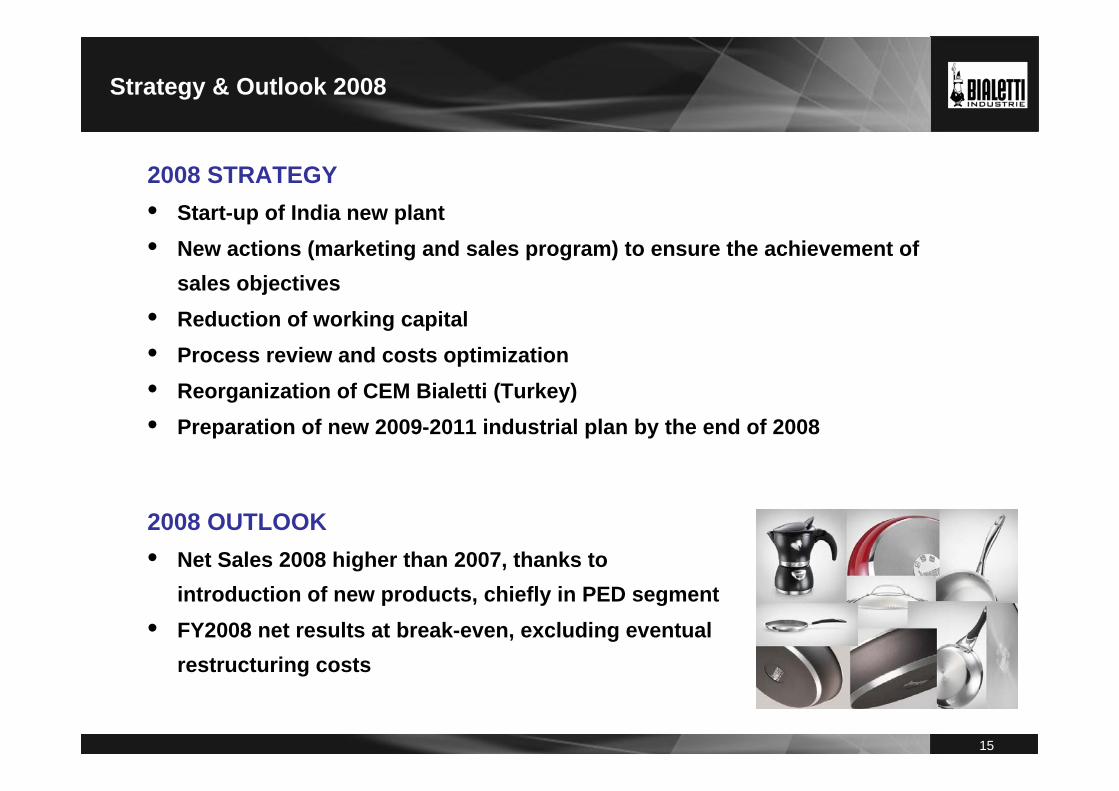
Strategy & Outlook 2008
2008 STRATEGY• Start-up of India new plant• New actions (marketing and sales program) to ensure the achievement of
sales objectives• Reduction of working capital• Process review and costs optimization • Reorganization of CEM Bialetti (Turkey) • Preparation of new 2009-2011 industrial plan by the end of 2008
2008 OUTLOOK• Net Sales 2008 higher than 2007, thanks to
introduction of new products, chiefly in PED segment• FY2008 net results at break-even, excluding eventual
restructuring costs

16
Appendices
17
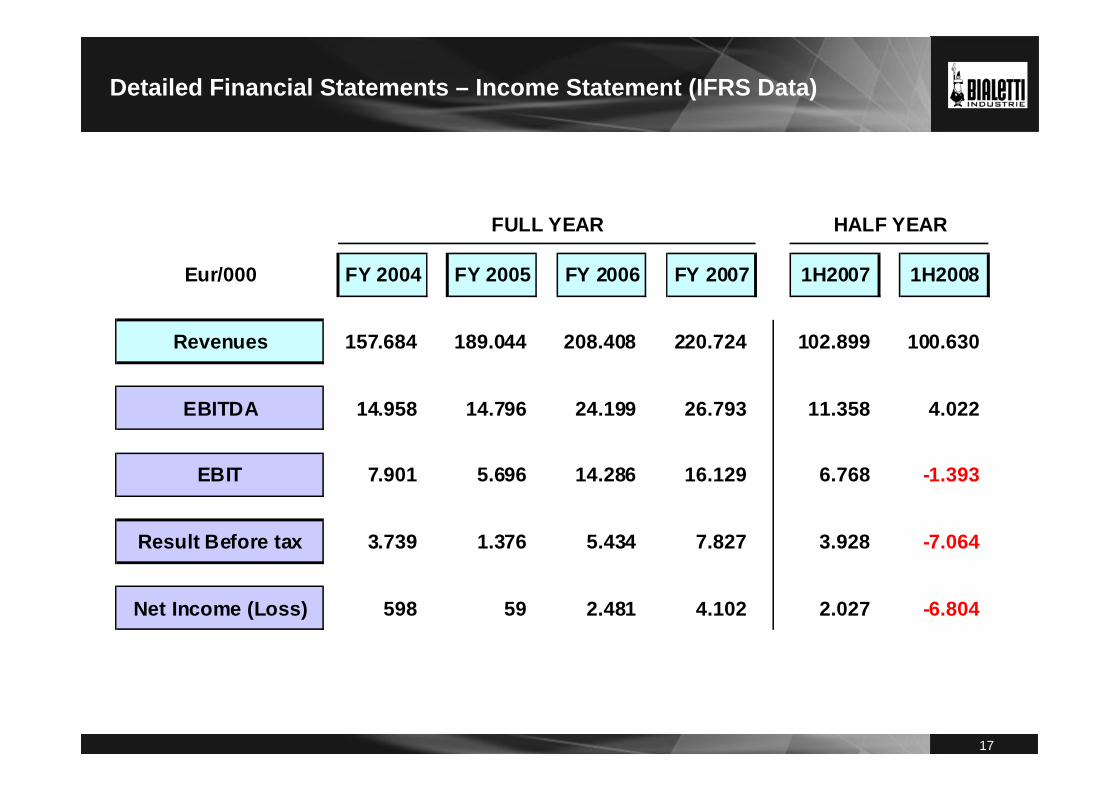
Detailed Financial Statements – Income Statement (IFRS Data)
Eur/000 FY 2004 FY 2005 FY 2006 FY 2007 1H2007 1H2008
Revenues 157.684 189.044 208.408 220.724 102.899 100.630
EBITDA 14.958 14.796 24.199 26.793 11.358 4.022
EBIT 7.901 5.696 14.286 16.129 6.768 -1.393
Result Before tax 3.739 1.376 5.434 7.827 3.928 -7.064
Net Income (Loss) 598 59 2.481 4.102 2.027 -6.804
FULL YEAR HALF YEAR
18
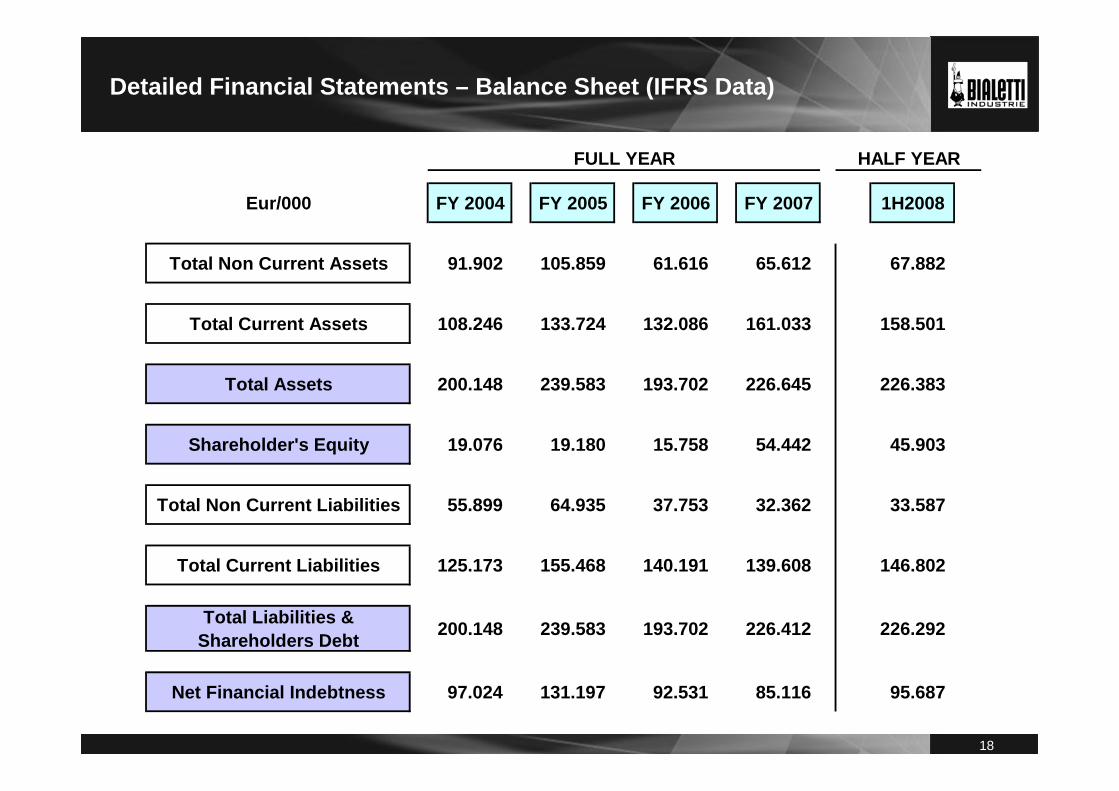
Detailed Financial Statements – Balance Sheet (IFRS Data)
Eur/000 FY 2004 FY 2005 FY 2006 FY 2007 1H2008
Total Non Current Assets 91.902 105.859 61.616 65.612 67.882
Total Current Assets 108.246 133.724 132.086 161.033 158.501
Total Assets 200.148 239.583 193.702 226.645 226.383
Shareholder's Equity 19.076 19.180 15.758 54.442 45.903
Total Non Current Liabilities 55.899 64.935 37.753 32.362 33.587
Total Current Liabilities 125.173 155.468 140.191 139.608 146.802
Total Liabilities & Shareholders Debt 200.148 239.583 193.702 226.412 226.292
Net Financial Indebtness 97.024 131.197 92.531 85.116 95.687
FULL YEAR HALF YEAR
19
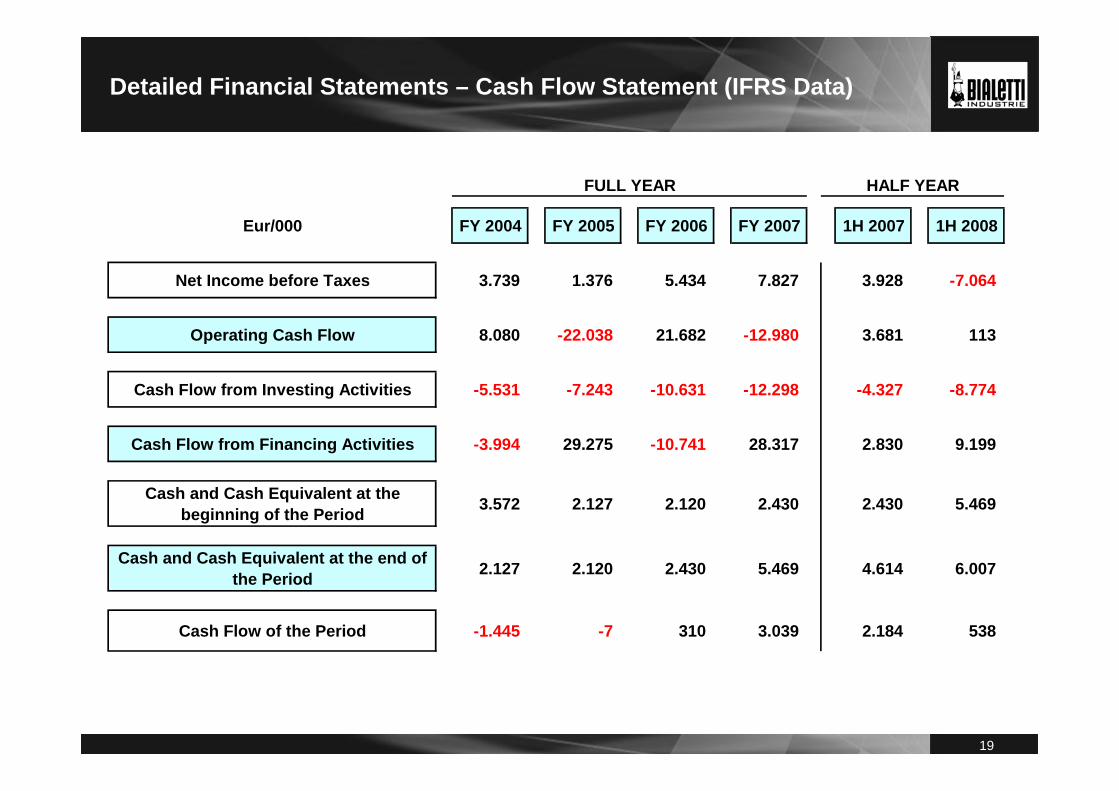
Detailed Financial Statements – Cash Flow Statement (IFRS Data)
Eur/000 FY 2004 FY 2005 FY 2006 FY 2007 1H 2007 1H 2008
Net Income before Taxes 3.739 1.376 5.434 7.827 3.928 -7.064
Operating Cash Flow 8.080 -22.038 21.682 -12.980 3.681 113
Cash Flow from Investing Activities -5.531 -7.243 -10.631 -12.298 -4.327 -8.774
Cash Flow from Financing Activities -3.994 29.275 -10.741 28.317 2.830 9.199
Cash and Cash Equivalent at the beginning of the Period 3.572 2.127 2.120 2.430 2.430 5.469
Cash and Cash Equivalent at the end of the Period 2.127 2.120 2.430 5.469 4.614 6.007
Cash Flow of the Period -1.445 -7 310 3.039 2.184 538
FULL YEAR HALF YEAR

20
THIS DOCUMENT MAY NOT BE DISTRIBUTED, PUBLISHED OR REPRODUCED INWHOLE OR IN PART OR DISCLOSED BY RECIPIENTS TO ANY OTHER PERSON.NEITHER THIS DOCUMENT REPRESENTS ANY SOLICITATION OR OTHER OFFER TO SELL ANY SECURITIES, NOR ANY SUGGESTION, ADVOCACY OR OTHER MARKETING OR SIMILAR EFFORT OF ANY INVESTMENT IN ANY SECURITIES. EACH INVESTOR CONTEMPLATING PURCHASING SECURITIES ISSUED BY BIALETTI INDUSTRIE SPA SHOULD MAKE ITS OWN INDEPENDENT INVESTIGATION OF THE FINANCIAL CONDITION AND AFFAIRS, AND ITS OWN APPRAISAL OF THE CREDITWORTHINESS OF BIALETTI INDUSTRIE SPA AND SHOULD CAREFULLY CONSIDER THE RISKINVOLVED IN PURCHASING THESE SECURITIES.THIS DOCUMENT CONTAINS CERTAIN FORWARD LOOKING STATEMENTS WHICH REFLECT MANAGEMENT’S CURRENT VIEWS, ESTIMATES AND OBJECTIVES. THE USER OF SUCH INFORMATION SHOULD RECOGNISE THAT ACTUAL RESULTS MAY DIFFER MATERIALLY FROM SUCH EXPECTATIONS BECAUSE THEY RELATE TO FUTURE EVENTS AND CIRCUMSTANCES WHICH ARE BEYOND OUR CONTROL, INCLUDING, AMONGST OTHER THINGS, INTERNAL, INDUSTRY AND EXTERNALFACTORS, SUCH AS GENERAL ECONOMIC CONDITIONS.
* * *“The manager responsible for preparing the company’s financial reports” Luca Graziadei declares, pursuant to paragraph 2 of Article 154-bis of the Consolidated Law on Finance, that the accounting information contained in this slides corresponds to the document results, books and accounting records.
21
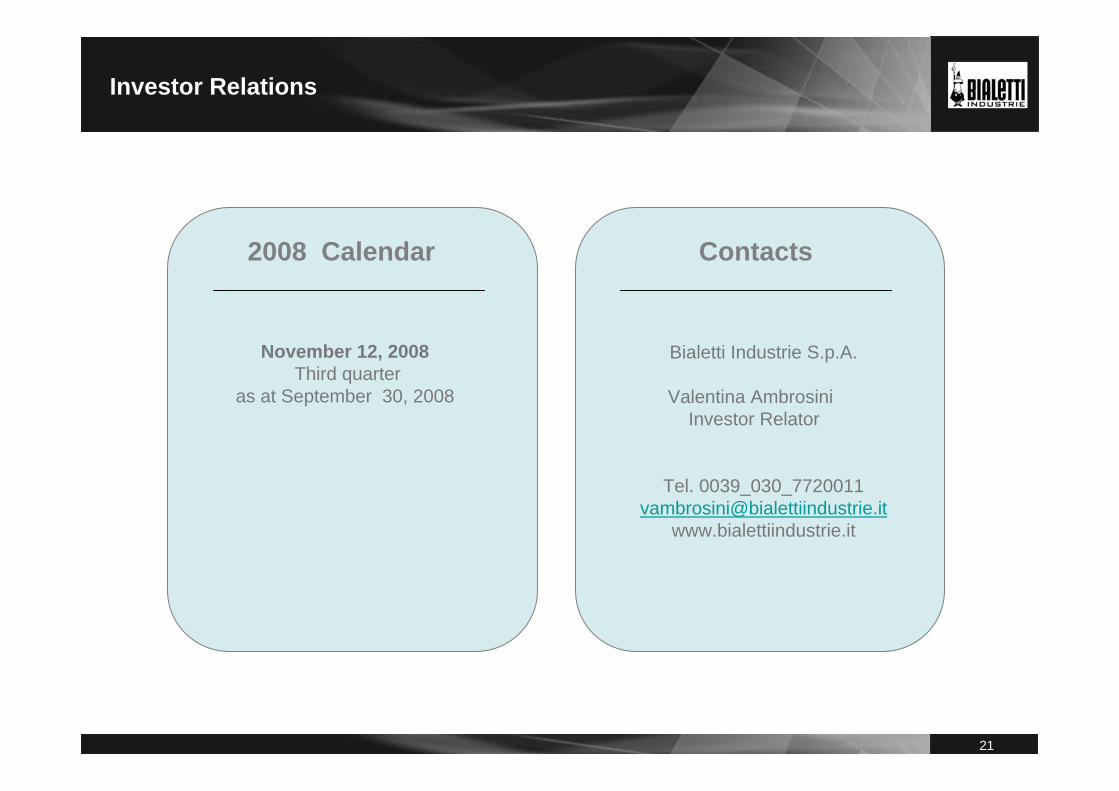
Investor Relations
Contacts
Bialetti Industrie S.p.A.
Valentina AmbrosiniInvestor Relator
Tel. [email protected]
www.bialettiindustrie.it
2008 Calendar
November 12, 2008Third quarter
as at September 30, 2008