
Finlight Research - Market Perspectives - Apr 2015
53
Market Perspectives April 2015 Apr. 1 st , 2015 www.finlightresearch.com Complacency reigns supreme…
-
Upload
zouheir-ben-tamarout -
Category
Economy & Finance
-
view
42 -
download
1
Transcript of Finlight Research - Market Perspectives - Apr 2015

Market PerspectivesApril 2015
Apr. 1st, 2015
www.finlightresearch.com
Complacency reigns supreme…

“If something can't go on forever, it won't.”– Old saying
“Are we vulnerable in my personal opinion to a
significant equity market correction? I do believe we
are, and the reason for that is people have gotten
lazy. They've depended totally on the Fed.”– Richard Fischer
2
FinLight Research | www.finlightresearch.com

Executive Summary: Global Asset Allocation
� Growth data has been better than expected in Europe and Japan. Chinese
economy is slowing. In the US, macro data surprised to the downside. But US
macro surprise indices have already fallen to levels from which they typically
revert.
� The world continues to be in yield-chasing mode across risky assets
� But valuation levels in equity and credit are high enough to make us cautious
� Trouble is brewing under the surface in the form of rapidly deteriorating US
corporate earnings growth.
� Thus, we remain unconvinced that the market’s exuberance will be
validated by economic outcomes.
� We also think that the threat of a Fed tightening cycle will remain a
persistent risk for investors in the coming months.
� The only question that matters: Are US earnings expectations going to improve
as we move forward (into H2-2015)?
� We still see a solid case for further dollar strength, lower oil prices and
lower commodities.
� The prospect of rising interest rates could also be a trigger for higher cross-
asset volatility.
� Maintain UW government bonds and corporate credit overall (but with an
intra-asset class preference for IG vs HY, Eurozone vs US in HY, US vs
Eurozone in IG), OW US dollar and UW commodities (specially energy and
precious metals)
� We summarize our views as follows�
3
FinLight Research | www.finlightresearch.com

MACRO VIEW
� The Good� European economies are getting better. Both manufacturing and services flash PMIs
surprised on the upside. Deflationary pressures are also easing.� The University of Michigan final Consumer Sentiment for March came in at 93.0 (compared to
95.4 in February and 98.1 in January). � US corporate profits are still very impressive
� The Bad� US Q4-2014 GDP and durable goods were disappointing� Earnings forecasts have markedly deteriorated very rapidly in recent months. Earnings
growth is now expected to turn negative starting in Q2-2015� Chinese manufacturing PMI, exports and economic growth continue to slow� For the first time since 1980, China’s steel consumption is projected to fall in 2015� In Japan, and despite the aggressive monetary stimulus, inflation is back to zero, and industrial
output has been negative on a YoY basis over 6 of the past 8 months
� The Ugly � Geopolitical risk is getting worse, specially in the Middle-East (Iraq, Syria and now Yemen)� Greece remains the wild card in Europe� Main systemic risk resides in China : China’s economy is supported by approximately six
trillion dollars of 'shadow debt', coupled with an unprecedented credit-fueled construction madness� Systemic risk is around the corner
4
FinLight Research | www.finlightresearch.com

5
FinLight Research | www.finlightresearch.com
The Big Four Economic Indicators
� The overall picture had been one of a slow recovery, but there is no indication of a recession using the indicators monitored by the NBER.
� Retail Sales disappointed again in February, as the came at -0.8% in real terms.� The Big Four average shows signs of exhaustion…

6
FinLight Research | www.finlightresearch.com
Retail Sales
� Retail Sales declined for the third month in a row. In February, they came at -0.58% in nominal terms, and -0.80% in real terms.
� The decline is even more severe than last winter’s one.

7
FinLight Research | www.finlightresearch.com
Durable Goods
� New orders were particularly weak.
� Durable goods orders were down 1.4% in February
� When transportation equipment orders are excluded, the fall stands at 0.4%
� Core capital goods orders also fell 1.4%.
� The fall in Feb. durable goods orders and shipments echoes the decline in Feb. manufacturing Industrial Production.
� The picture should be watched closely from here...
Source: Thomson Reuters Eikon

8
FinLight Research | www.finlightresearch.com
US Inflation
� Because of the contraction in food and energy prices, inflation remains far from the Fed target.
Source: Thomson Reuters Eikon

9
FinLight Research | www.finlightresearch.com
GS – Global Leading Indicator (GLI)
� Since Dec ‘14, GLI has been in“Contraction” phase, defined bynegative and decreasingmomentum.
� 6 of the 10 underlying componentsof the GLI worsened in March
� We’ve been thinking for a whilethat the acceleration we’ve seenlast year was quite modest for atypical expansion phase.
� Our fears about the currenteconomic situation areconcretizing…

10
FinLight Research | www.finlightresearch.com
Eurozone Economy
� Life is getting back to the Eurozone economy…
� Retail sales and consumer confidence are improving rapidly
� Eurozone economic reports have been surprising on the upside
� The region is benefitting from a combination of positive tailwinds : ECB stimulus, low oil prices, a weak euro and financial releveraging
11
FinLight Research | www.finlightresearch.com
Eurozone Inflation
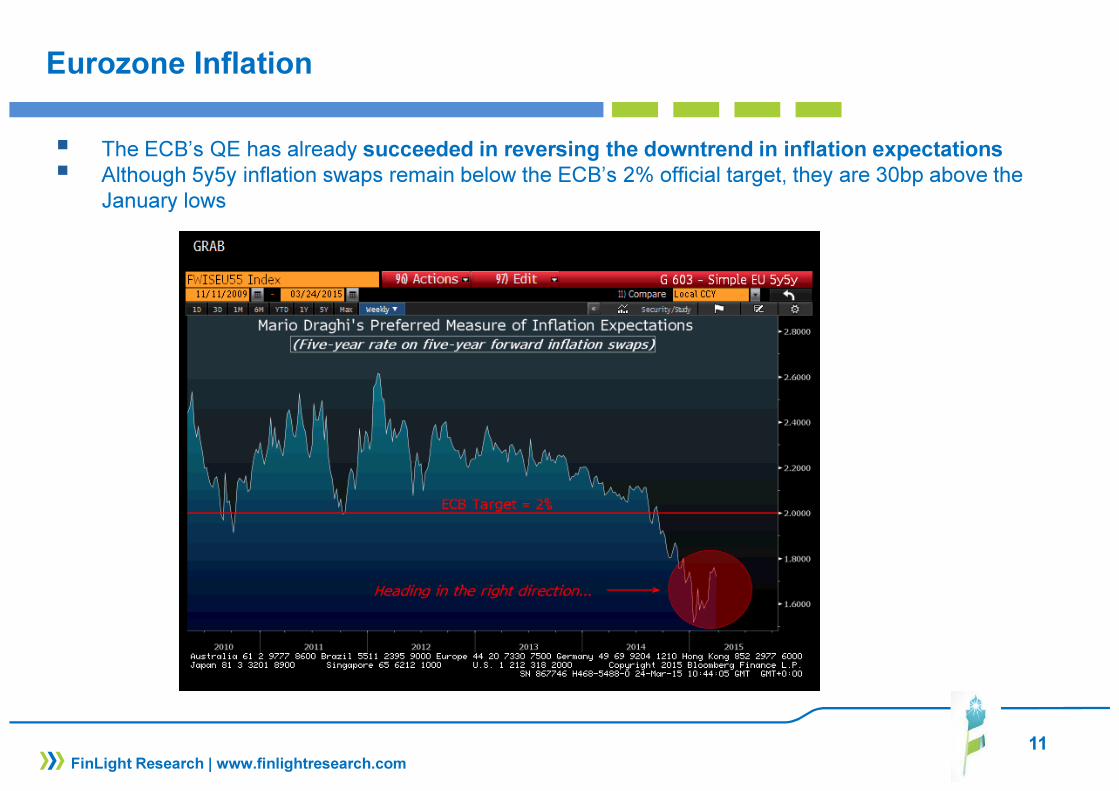
� The ECB’s QE has already succeeded in reversing the downtrend in inflation expectations� Although 5y5y inflation swaps remain below the ECB’s 2% official target, they are 30bp above the
January lows
12
FinLight Research | www.finlightresearch.com
Chinese Economy
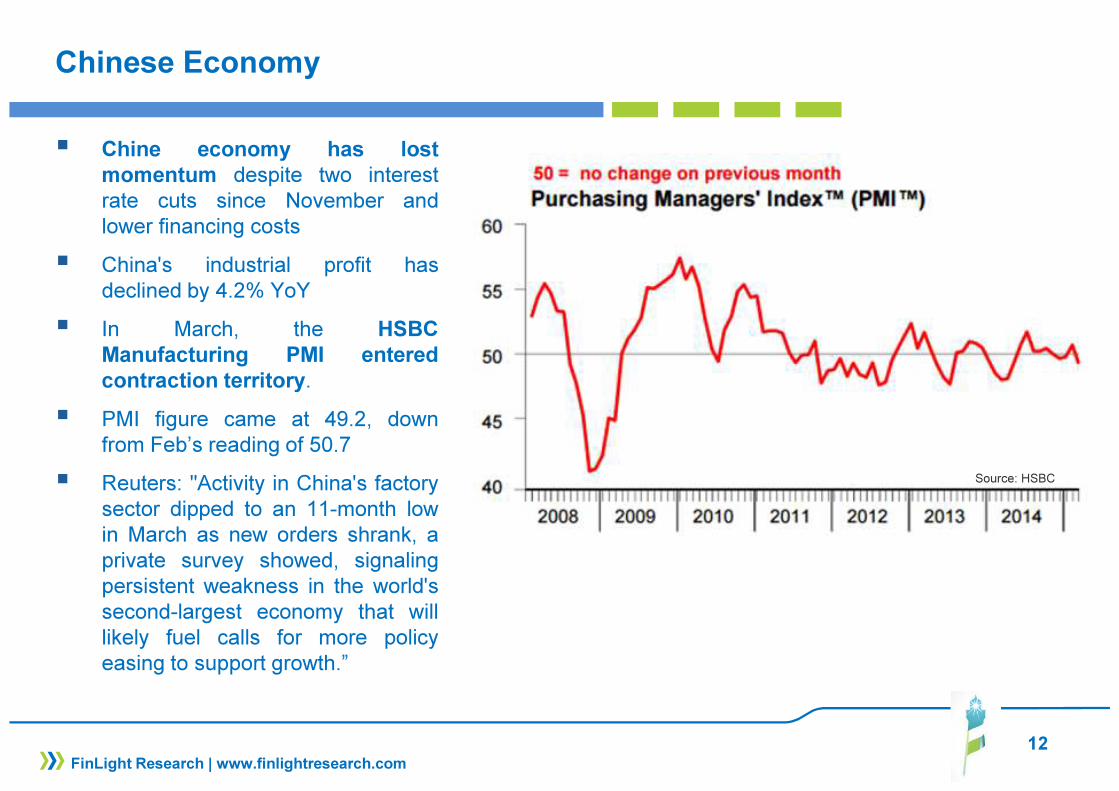
� Chine economy has lostmomentum despite two interestrate cuts since November andlower financing costs
� China's industrial profit hasdeclined by 4.2% YoY
� In March, the HSBCManufacturing PMI enteredcontraction territory.
� PMI figure came at 49.2, downfrom Feb’s reading of 50.7
� Reuters: "Activity in China's factorysector dipped to an 11-month lowin March as new orders shrank, aprivate survey showed, signalingpersistent weakness in the world'ssecond-largest economy that willlikely fuel calls for more policyeasing to support growth.”
Source: HSBC

13
FinLight Research | www.finlightresearch.com
EQUITY
� The uptrend on stocks remains intact. Optimism is extreme. But we still believe that equity markets are living on borrowed time because…� Trouble is brewing under the surface in the form of rapidly deteriorating US corporate earnings
growth. � Technicals suggest that the trend is already exhausted. � Stocks are arriving at the end of the seasonally favorable period. (Oct-Apr) � Valuations are too high: the median stock has a P/E and EV/EBITDA of 18.0x and 11.0x,
respectively. These valuations rank in the 99th percentile of both multiples since 1976.
� Consensus 2015-16 earnings assumptions strike us as ambitious, given the net margin compression we expect (because of labor cost increase and dollar strength)
� Too little cash is left on the sidelines, as investors moved massively into equities and out of bonds and cash. Excessive optimism makes the equity market more vulnerable, pushing the volatility to the upside.
� We are concerned about drawdown risk in the near-term because of rising rates and interest rate volatility and current valuations
� The coming rate hikes (probably in Jun. or Sep.) is not priced in yet. It will depress all asset prices for at least part of next year, in our view
� We are among the rare few who still think that current market cycle is simply a very very strong cyclical bull within a secular bear market!

14
FinLight Research | www.finlightresearch.com
EQUITY
� Bottom line :� Nothing new compared to our previous report. We remain Neutral equities. At this stage,
expansionary monetary policies, low interest rates and abundant liquidity are keeping us from moving to an underweight on equities.
� We may revise our view to OW after a clean break of the 2075-2125 range on the S&P500, and to UW below the trend since Nov. ‘12 lows
� We think it is wise to incrementally "de-risk" your portfolios by focusing on higher quality / more defensive / more favorably priced companies
� While we remain long-term OW on Japan (always on an FX hedged basis) as we see further upside for Japanese stocks from the improvement in macro data and corporate earnings momentum, we’ve tactically decided to move Neutral in the short-term. A correction should be expected shortly.
� A number of factors are helping European growth: lower oil prices, weaker Euro, and fading credit headwinds. We remain Neutral on Europe vs. US despite the massive ECB’s QE. According to the 12 month forward P/E, Europe is now trading at 15 year highs, relative to the US
� We remain UW in US small caps vs large caps, and UW EM stocks vs US large caps

15
FinLight Research | www.finlightresearch.com
Earnings
� For Q1 2015, 85 companies have issued negative EPS guidance and 16 companies have issued positive EPS guidance.
� The forward 12-month P/E ratio for the S&P 500 now stands at 16.7, well above historical averages: 5-year (13.7), 10-year (14.1)
� Not very long ago, at the start of the New Year, corporate earnings were forecasted to increase on a year-over-year basis. Since then, the earnings forecast for the S&P 500 Index has deteriorated a lot.
� The 12-month EPS estimate is now at $122.11, decreasing from $126.87 at Dec. 31st.
� Based on Factset data, analysts predict YoYearnings declines of 4.6% and 1.8%, for Q1 2015 and Q2 2015, respectively

16
FinLight Research | www.finlightresearch.com
Earnings
� Nevertheless, US corporate profits are still very impressive � Corporate profits are at or near record levels, both in nominal terms and relative to GDP.

17
FinLight Research | www.finlightresearch.com
Earnings & Relative Valuations
� Despite their outperformance, Japanese equity valuations are still relatively cheap
� But Europe is now trading at 15 year highs, relative to the US.
� Earnings revisions have shifted in favor of European / Japanese equities relative to the US

18
FinLight Research | www.finlightresearch.com
Market Flows
� Market flows tend to favor non-US equities and U.S. bonds� Using US ETF flows year-to-date, we see that :
� US Domestically-focused equity ETFs saw $7.3B in outflows� Internationally-focused ETFs saw $36.6B in inflows (8.8% in assets) .� US Domestic bond ETFs have attracted $17.9B, or 25x the money the goes in internationally-
focused bond ETFs
Source: Bloomberg

19
FinLight Research | www.finlightresearch.com
Investors Sentiment
� .
� Mutual funds cash to asset ratio is very low, implying that fund managers are all in!
� Stock market major tops have occurred when cash was near (or below) the 4% threshold.
Source: Elliot Wave

20
FinLight Research | www.finlightresearch.com
S&P500 – A Fundamental Perspective
� Williams Market AnalyticsS&P500 model uses multivariateregressions to reconstruct(starting in1960) equityperformance based solely onmonthly IP and corporateearnings.
� This 100%-fundamental index issupposed to represent the trendthat the S&P should have beenfollowing ex-Fed action.
� Based on this approach, theS&P500 seems 25% overvaluedat current levels

21
FinLight Research | www.finlightresearch.com
S&P500 – A Long-Term Perspective
� Equity markets appear at lofty valuations, whatever the valuation metric we use.
� We see only a few quarters (during the dot.com bubble) with higher valuations� Valuation alone is very rarely a timing tool for a major market top� Nevertheless, all these indicators suggest a cautious long-term outlook and weak long-term return
expectations

22
FinLight Research | www.finlightresearch.com
S&P500 – A Medium-Term Perspective
� A snapshot of selloffs since the 2009 trough shows that S&P500 hasn’t experienced a 10% correction over more than 3 years.
23
FinLight Research | www.finlightresearch.com
S&P500 – A Medium-Term Perspective
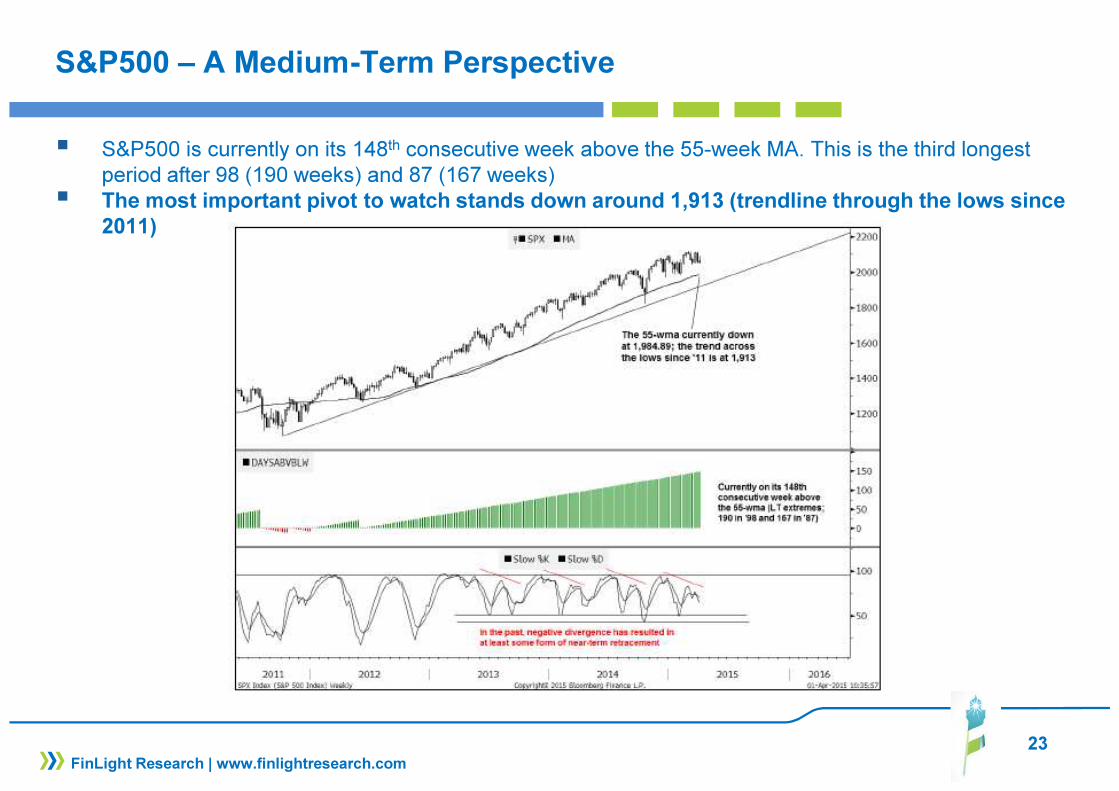
� S&P500 is currently on its 148th consecutive week above the 55-week MA. This is the third longest period after 98 (190 weeks) and 87 (167 weeks)
� The most important pivot to watch stands down around 1,913 (trendline through the lows since 2011)

24
FinLight Research | www.finlightresearch.com
S&P500 – A Medium-Term Perspective
� Stocks are arriving at the end of the seasonally favorable period
� Historically, the market has made most of its gains in the favorable season between October and May
� Substantial corrections took place during the unfavorable season of May to October.
� This pattern has not worked out over the last 3 years
� The last time it worked well was in 2011 (with the end of QE) and the S&P500 plunged 21% from May to October.

25
FinLight Research | www.finlightresearch.com
S&P500 – A Very Short-Term Perspective
� Our first warning signal over the short-term, is a combination of:
� A clean break below 2038-2035. Breaking this area will induce the first lower low in a while, complete a double top pattern, and open the door to a further pullback (~1960)
� A VIX that goes through its 17.2 ceiling

26
FinLight Research | www.finlightresearch.com
Trading Model – S&P500
� As of Apr 1st, our prop. Short-Term trading model becomes massively long at 2059.7 on the index.� The model targets 2062, 2083 and 2103 on the upside, but still expect a breach of the 2041 level
to the downside.

27
FIXED INCOME & CREDIT
� The negative net issuance in the Euro area combined with the continuing duration withdrawal in Japan provides a supportive backdrop for global fixed income markets
� We still look for the bear market on USTs to resume. Patience should pay…
� We’ve been Neutral UST since end of Nov. ’14. US long-term rates are stuck in a range. 10-year yield is poised to trade 1.85-2.05% (perhaps 1.75-2.25%) until we get closer to Fed hikes. Low yields in the US will be supported by yield hungry investors in Japan and the Eurozone
� Our medium-term outlook would stay neutral as far as the 10y UST yield remains below 2.25.
� We remain neutral on German yields and peripheral debt, because:
� The current record low rates are not enough justify an UW position. The ECB’s QE program is forecast to be more than 3x the size of the region’s net issuance of government debt.
� An OW position isn’t justified either: How can we justify 10y Bund yields of 25bp if the ECB’s inflation projections are realized over a 2 year horizon? We do not expect the QE to drive EUR/JPY yields much lower, as yields are already rock bottom (and even negative in some cases). Yield hungry investors will look for higher yields elsewhere (in the US, for instance)
FinLight Research | www.finlightresearch.com

28
FIXED INCOME & CREDIT
� Market pricing of the timing of the first rate hike remains volatile.
� Despite the negative macro surprises in the US, we still expect the Fed to start tightening in June. The US data surprises have fallen to levels from which they typically revert and the US macro picture may change very quickly.
� At this stage, the market pricing of the projected pace of hiking is significantly below Fed guidance. We expect the re-pricing of Fed expectations to take place very soon in the short end of the curve.
� While US yields in the short end are expected to go higher driven by Fed expectations, the medium to long end of the curve will be supported by abundant liquidity and by spillover effects from ECB and BoJ QE as investors struggle for yield. We continue to bet on a significant flattening of the US yield curve.
FinLight Research | www.finlightresearch.com

29
FIXED INCOME & CREDIT
� Credit markets have performed strongly since the ECB announced an expanded asset purchase program at the end of January. Since then, the search for yield resumed and we saw investors moving down the quality spectrum, buying high yield bonds and growth sectors.
� We remain UW on corporate credit, due to valuation, to rising corporate leverage (specially in the US), to rising volatility, to position within the credit cycle and given the weak total return forecast
� Within the credit pocket, and over the very short-term, we stick with our preference for Eurozone HY corps vs US HY corps, because of the ECB massive QE, more resilient macro in the Eurozone, and the still elevated beta of US credit spreads to oil prices.
� However, we shift to UW on Eurozone vs US IG (from OW) as :� more than 75% of European IG credits yielding less than 1%� we expect the pattern of European outperformance to reverse in IG (at least) because of market
flows going from Europe/Japan to the US� Credit spreads are expected to suffer from the increased rates volatility to come.
� We still prefer IG over HY on a risk-adjusted basis as we expect higher volatility on spreads
� Bottom line : Neutral Govies, Neutral Eurozone vs. US Govies, Long flatteners on the US yield curve, UW credit, OW Eurozone vs US HY credit, UW Eurozone vs US IG credit, Neutral TIPS and OW HICP Inflation, UW High Yield vs High Grade, Neutral on EM corporates
FinLight Research | www.finlightresearch.com

30
US Treasuries
� We’ve been Neutral UST since end of Nov. ’14.
� US long-term rates are stuck in a range. 10-year yield is poised to trade 1.85-2.05% (perhaps 1.75-2.25%) until we get closer to Fed hikes.
FinLight Research | www.finlightresearch.com

31
US Treasuries
� Tactically, we stay Neutral on USTs.
� The T-note dollar weighted Put/Call measure stands in neutral territories. It almost reached overbought territory before last week’s backup
� On a relative basis, and despite a 10-year yield differential at a 25-year high, we stick to our Neutral USTs vs Bunds position. Reasons for that: ECB’s QE program + risk of Fed rate hikes later this year
FinLight Research | www.finlightresearch.com

32
US Treasuries
� We’ve been targeting 40bps on the 5-10 year slope
� But this slope has broken its downtrend, threatening the initial setup.
� Nevertheless, we continue to bet on a significant flattening of the US yield curve, using shorter maturities (2-10 year spread)
FinLight Research | www.finlightresearch.com

33
US Credit
� US Treasury TIC and ECB data show:� big inflows into US domestic corporate bonds� Even bigger outflows from Euro area bonds.
� We shift to UW on Eurozone vs US IG (from OW)
FinLight Research | www.finlightresearch.com

34
US Credit
� We still prefer IG over HY on a risk-adjusted basis
� Credit fundamentals are stable in IG, but still deteriorating in HY (because of lower operating income, more debt on balance sheets and rising leverage).
� The high beta of US HY credit spreads to oil prices (coupled with our bearish view on oil) increases our cautiousness towards HY
FinLight Research | www.finlightresearch.com
Source: BAML
Merrill Lynch IG Corp. Bond Index
Merrill Lynch HY Master II Index

35
$US-denominated Credit
� For the first time since the crisis, the amount of fallen angels debt exceeds the rising stars
� It’s worthwhile noting that most of the downgrade activity (in notional amount) has come from emerging markets issuers (Gazprom with$18bn, Petrobras with $41.2bn).
FinLight Research | www.finlightresearch.com

36
European Credit
� Rating drift is still heading up…
� Upside surprise to growth in the EZ is clearly credit positive.
FinLight Research | www.finlightresearch.com
Source: Bloomberg, Capital IQ
European HY Net Leverage
� But credit fundamentals of European HY issuers are deteriorating, with net leverage at the highest level since the financial crisis (4.7x EBITDA) and still climbing

37
European vs US Credit
� European credit has outperformed as:� the ECB QE program has been
priced in, driving tighter EZ spreads
� USD spreads widened on energy uncertainty. The energy-sector weighting in US HY is as high as 14% (vs 1% for European HY)
FinLight Research | www.finlightresearch.com
US vs European Credit Spread

38
EXCHANGE RATES
� Policy divergence between the US on one hand, and Japan and the Eurozone on the other, should continue to provide an environment supportive of the dollar.
� Historically, USD cycles have been persistent, lasting 5-6 years in the appreciation phase. We thus see further medium term USD gains against the major crosses, especially EUR and JPY
� Equity inflows in the Eurozone may slow but not reverse the euro's decline.
� The upside potential on EUR-USD remains limited. The bounce from 1.0462 was short lived. Our next target 1.07. Breaking decisively below would open the door to our ultimate target at 1.0250-0.98. We remain UW EUR-USD as long as the pivot stays below 1.11 - 1.13 and move Neutral above to play the correction towards 1.17-1.18.
� We remain OW USD-JPY as far as the pivot stays above 116 (lower bound of the consolidation triangle). Our ultimate medium-term target remains at 124-125
FinLight Research | www.finlightresearch.com

39
EUR vs USD
� The EUR-USD is clearly connected to the relative size of the Fed and ECB's balance sheet
� At this stage, EUR-USD seems to price an extremely lower Fed/ECB balance sheet ratio.
FinLight Research | www.finlightresearch.com

40
US Dollar Index - DXY
� We continue to expect the USD to strengthen against the major crosses
� The spot has finally broken above our first target of 96.00, and has even been above 100 before turning down.
� Our ultimate target remains at 102.50
� To feel more comfortable with our bullish view, the 100 threshold should be meaningfully breached
FinLight Research | www.finlightresearch.com

41
EUR-USD
� Our medium-term view remains biased towards a strengthening of USD
� The bounce from 1.0462 was short lived. Our next target 1.0690. Breaking decisively below would open the door to our ultimate target at 1.0250-0.98
� We remain UW EUR-USD as long as the pivot stays below 1.11 - 1.13 and move Neutral above to play the correction towards 1.17-1.18.
FinLight Research | www.finlightresearch.com
42
USD-JPY
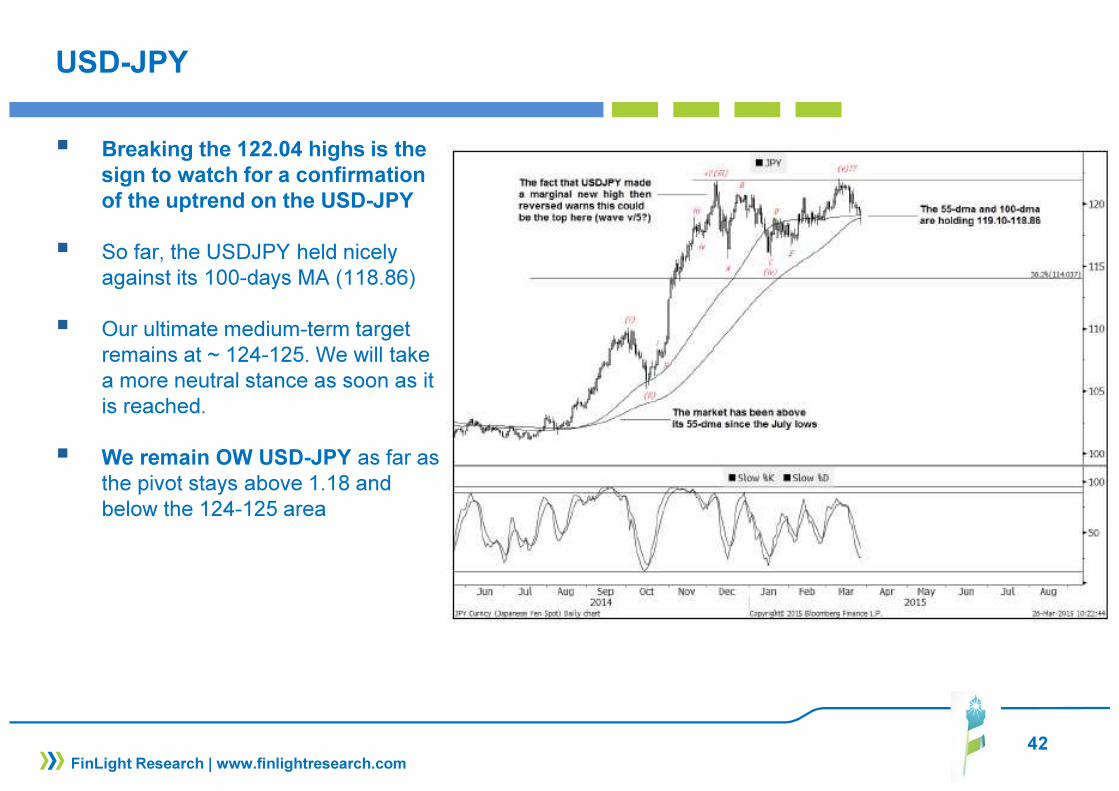
� Breaking the 122.04 highs is the sign to watch for a confirmation of the uptrend on the USD-JPY
� So far, the USDJPY held nicely against its 100-days MA (118.86)
� Our ultimate medium-term target remains at ~ 124-125. We will take a more neutral stance as soon as it is reached.
� We remain OW USD-JPY as far as the pivot stays above 1.18 and below the 124-125 area
FinLight Research | www.finlightresearch.com

43
COMMODITY
� In the near term, the trend remains bearish. Volatility is going up and there is no indication of abottom formation yet.
� USD strengthening remains a big headwind to commodities� Global commodity prices could stay suppressed as less demand from China leads to greater
oversupply
� We remain UW commodities. We continue, however, to like owning the GSCI index, and thinkthat commodities hold value as cross-asset portfolio diversifiers.
� However, with most commodities trading in contango, roll yields remain negative across the majorityof commodity sectors, making any buy-and-hold position very costly.
Bottom Line :
� Base Metals: Many factors are weighing on base metals: US Dollar strengthening, the Chineseslowdown, weaknesses in construction / housing sectors in major economies (mainly affectingCopper and Nickel) � We remain Neutral on base metals, but do not like holding Copper as itappears highly overvalued relative to the dollar and the global growth. Particularly, China growth islikely to weigh on its price.
� Agri: We remain UW on agriculture because of excess supply and substantial stocks (built sincethe 2012 drought). Absent a severe weather shock, it is unlikely that agriculture prices will spike thisyear. We rather anticipate they will revert to 2009 levels.
FinLight Research | www.finlightresearch.com

44
COMMODITY
� Within the Agri complex, we’ve been OW Cocoa and Coffee for a while now. We like Cocoa for its long-term underlying demand driven by consumption in Asia. Pullback in coffee prices provide a better entryopportunity into this market after the sharp surge we’ve seen in prices because of the drought in Brazil.
� Energy: It is too early to expect major upside for the price of oil as the US is sinking deeper in aglut of excess oil. Supply is at all-time highs. Without a supply cutback, there is no reason for thecurrent oil price to go higher (except geopolitical risk).
� We remain UW oil and target ‘08 lows (around $35-40) as long as the OPEC doesn’t decide to stopthe bleeding and the excess supply remains. This bottom would be followed by a rebound towards themarginal cost of production (around $65 for WTI) by H2-2016.
� We move to Neutral each time the WTI breaks above $53-54/barrel
� Precious Metals: We change nothing to our view on precious metals. The stimulus provided by the ECB & BoJ is already factored in gold prices. Precious metals are vulnerable to higher US real yields and stronger dollar
� We remain UW above 1150-1170 band. We will move Neutral below 1150 and switchprogressively to OW (accumulate) as the spot slides down towards 1000-980, which is likely thefinal leg down.
� Our first target on silver stands at 14.70. We still think that Silver (like gold) is probably ready for its final leg down towards 12.50. At current levels, we are UW. we will switch progressively to OW (accumulate) as the spot breaks the first material resistance around 14.70 and slides down towards 12.50
FinLight Research | www.finlightresearch.com

45
Crude Oil
� US production and inventories continueto make record highs despite theplunge in rig count
� U.S. crude oil production edged up to 9.42mmbbl/day, a new multi-decade high.
� At 458.5 million barrels, crude oilinventories are at their highest levels (forthis time of year) over the last 80 years.
� But the US is not the only source ofoversupply. Saudi Arabia says it hasincreased its oil production to 10 millionbarrels per day. This isclose to a recordhigh.
� Oil prices could plummet further if:� supply reaches storage capacity� Iranian oil finds its way back to the
market
FinLight Research | www.finlightresearch.com

46
Crude Oil
� There are some LT signals of abase forming. The trend acrossthe lows since 1998 (around 45-46) is acting as an importantsupport.
� For our bearish view to complete,we need to break the Jan ‘15 lows(43.6)
� A weekly close above the 53-54area will oblige us to witch toNeutral (if not OW)
FinLight Research | www.finlightresearch.com

47
Gold
� After the Gold broke below theNov. ‘14 uptrend (1189), we calledfor a down move till 1132. Instead,we saw a bounce on 1150.
�
� Around 1200, we started to seesome weakness again, with the100d-MA acting as a resistance.Momentum should reverse totarget 1180-1172-1161
� We change nothing to ourstrategy: We move Neutral below1150 and switch progressively toOW (accumulate) as the spotslides down towards 1000-980,which is likely the final legdown.
FinLight Research | www.finlightresearch.com

48
ALTERNATIVE STRATEGIES
� Hedge funds ended March on a positive note (+0.33% MTD and +2.06% YTD on the HFRI Global HFI). Best performers were CTAs (+1.30%), Equity Market-Neutral (+1.04%), Global Macro ( +0.71%) and Merger Arb (+0.66%).
� Increased volatility, driven by changes in expectations of growth rates and interest rates, was generally helpful to relative value and global macro traders.
� CTA made money on short commodity, long USD, long equities, and long fixed income positions.� Most of Global macro gains were posted on long European equities, long precious metals, long credit,
short EUR. Macro managers are still positioned for higher rates but with a very limited exposure at this stage.
� We stick to our preference for risk diversifiers (pure alpha generation strategies) over return enhancers.
� We maintain our previous positioning and remain OW on:� Equity Market Neutrals both for their “intelligent” beta and their alpha contribution. � CTA’s and Global Macro as a diversifier and tail hedge. � Vol. Arb strategy and prefer funds that trade volatility globally (all assets / all regions). This is our
way to position for a higher volatility regime.
FinLight Research | www.finlightresearch.com

49
Hedge Funds and the Long-$US Trade
� USD momentum has generatedsubstantial gains for macro andsystematic funds, but not for currencyfunds
FinLight Research | www.finlightresearch.com

Bottom Line: Global Asset Allocation
� Growth data has been better than expected in Europe and Japan. Chinese
economy is slowing. In the US, macro data surprised to the downside. But US
macro surprise indices have already fallen to levels from which they typically
revert.
� The world continues to be in yield-chasing mode across risky assets
� But valuation levels in equity and credit are high enough to make us cautious
� Trouble is brewing under the surface in the form of rapidly deteriorating US
corporate earnings growth.
� Thus, we remain unconvinced that the market’s exuberance will be
validated by economic outcomes.
� We also think that the threat of a Fed tightening cycle will remain a
persistent risk for investors in the coming months.
� The only question that matters: Are US earnings expectations going to improve
as we move forward (into H2-2015)?
� We still see a solid case for further dollar strength, lower oil prices and
lower commodities.
� The prospect of rising interest rates could also be a trigger for higher cross-
asset volatility.
� Maintain UW government bonds and corporate credit overall (but with an
intra-asset class preference for IG vs HY, Eurozone vs US in HY, US vs
Eurozone in IG), OW US dollar and UW commodities (specially energy and
precious metals)
� We summarize our views as follows�
50
FinLight Research | www.finlightresearch.com

51
Disclaimer
FinLight Research | www.finlightresearch.com
This writing is for informational purposes only and does not constitute an
offer to sell, a solicitation to buy, or a recommendation regarding any
securities transaction, or as an offer to provide advisory or other services
by FinLight Research in any jurisdiction in which such offer, solicitation,
purchase or sale would be unlawful under the securities laws of such
jurisdiction. The information contained in this writing should not be
construed as financial or investment advice on any subject matter.
FinLight Research expressly disclaims all liability in respect to actions
taken based on any or all of the information on this writing.

About Us…
� FinLight Research is a research-centric company focused on Asset Allocation from a top-down perspective, on Portfolio Construction, and all related quantitative aspects and risk management issues.
� Our expertise expands along 3 axes:
� Asset Allocation with risk control and/or risk budgeting techniques
� Allocation to alternative investments : Hedge funds, rule-based strategies (momentum, value, carry, volatility), real assets (real estate, infrastructure, farmland, timberland and natural resources). Private equity and venture capital should be the next step…
� Allocation with a factorial approach built on the understanding (profiling) of the risk/return drivers of the different asset classes
� FinLight Research is an innovation-oriented company. We target to fill the gap between the academic research and the investment community, especially on real assets and alternatives. We survey on a continuous basis the academic literature for interesting published and working papers related to quantitative investing, non-linear profiling, asset allocation, real assets...
52
FinLight Research | www.finlightresearch.com

Our Standard Offer
Provide tailor-made quantitative analysis of your
portfolios in terms of asset allocation, risk profiling and risk contribution
Provide tailor-made quantitative analysis of your
portfolios in terms of asset allocation, risk profiling and risk contribution
•Risk Profiling
Offer a turnkey 3-step factor-based process in GAA
with factor selection, risk budgeting and
dynamic portfolio protection
Offer a turnkey 3-step factor-based process in GAA
with factor selection, risk budgeting and
dynamic portfolio protection
•Factor-based GAA Process
Provide assistance with alternative
investments (including real
assets) in terms of profiling, and
integration in a GAA
Provide assistance with alternative
investments (including real
assets) in terms of profiling, and
integration in a GAA
•Alternative Investments
Provide assistance with asset
allocation and related risk control
and/or risk budgeting techniques
Provide assistance with asset
allocation and related risk control
and/or risk budgeting techniques
•Global Asset Allocation (GAA)
53
FinLight Research | www.finlightresearch.com