Finlight Research - Market Perspectives - Sep 2016
65
Market Perspectives September 2016 Sep. 9 th , 2016 www.finlightresearch.com Inflation is the dog that hasn’t barked yet
-
Upload
finlight-research -
Category
Economy & Finance
-
view
13 -
download
1
Transcript of Finlight Research - Market Perspectives - Sep 2016
Market PerspectivesSeptember 2016
Sep. 9th, 2016
www.finlightresearch.com
Inflation is the dog that hasn’t barked yet

“You are once again creating complacency
with your words. You are creating one of the
greatest misallocations of capital in history as
performance chasing investors plow into
passive market-cap weighted indices because
of your policies which have destroyed the
normal functioning of markets through volatility
suppression. The more you talk, the more you
create one class of investors who take extra
risk, and another which sees the market’s
response to your words and then themselves
decide to not even participate.”– Michael A. Gayed (Pension Partners),
talking to the Fed
2FinLight Research | www.finlightresearch.com
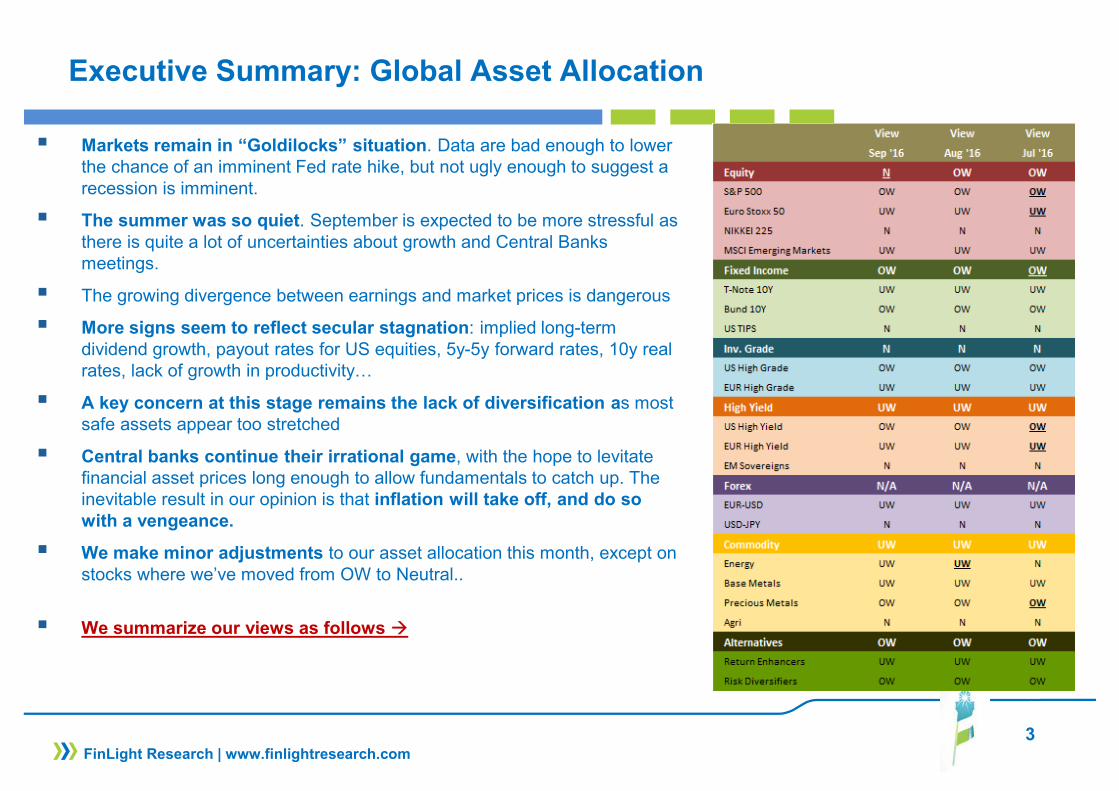
Executive Summary: Global Asset Allocation
� Markets remain in “Goldilocks” situation. Data are bad enough to lower the chance of an imminent Fed rate hike, but not ugly enough to suggest a recession is imminent.
� The summer was so quiet. September is expected to be more stressful as there is quite a lot of uncertainties about growth and Central Banks meetings.
� The growing divergence between earnings and market prices is dangerous
� More signs seem to reflect secular stagnation: implied long-term dividend growth, payout rates for US equities, 5y-5y forward rates, 10y real rates, lack of growth in productivity…
� A key concern at this stage remains the lack of diversification as most safe assets appear too stretched
� Central banks continue their irrational game, with the hope to levitate financial asset prices long enough to allow fundamentals to catch up. The inevitable result in our opinion is that inflation will take off, and do so with a vengeance.
� We make minor adjustments to our asset allocation this month, except on stocks where we’ve moved from OW to Neutral..
� We summarize our views as follows �
3FinLight Research | www.finlightresearch.com
MACRO VIEW
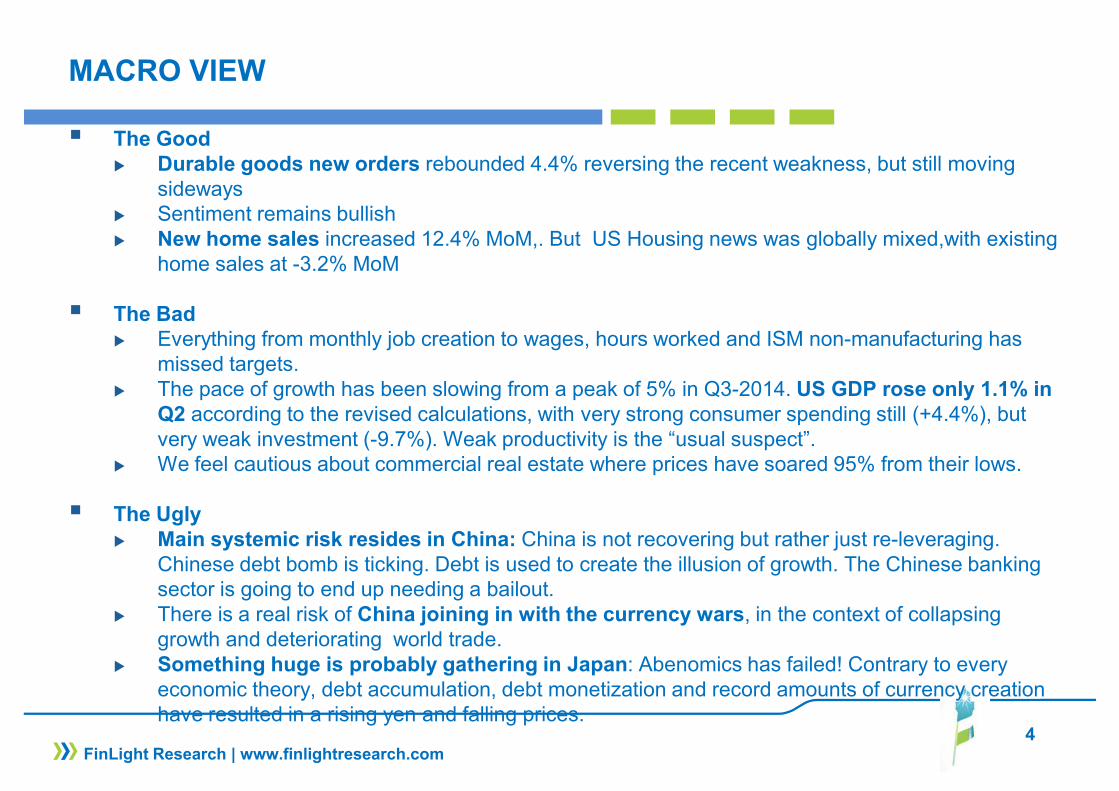
� The Good� Durable goods new orders rebounded 4.4% reversing the recent weakness, but still moving
sideways� Sentiment remains bullish� New home sales increased 12.4% MoM,. But US Housing news was globally mixed,with existing
home sales at -3.2% MoM
� The Bad� Everything from monthly job creation to wages, hours worked and ISM non-manufacturing has
missed targets. � The pace of growth has been slowing from a peak of 5% in Q3-2014. US GDP rose only 1.1% in
Q2 according to the revised calculations, with very strong consumer spending still (+4.4%), but very weak investment (-9.7%). Weak productivity is the “usual suspect”.
� We feel cautious about commercial real estate where prices have soared 95% from their lows.
� The Ugly � Main systemic risk resides in China: China is not recovering but rather just re-leveraging.
Chinese debt bomb is ticking. Debt is used to create the illusion of growth. The Chinese banking sector is going to end up needing a bailout.
� There is a real risk of China joining in with the currency wars, in the context of collapsing growth and deteriorating world trade.
� Something huge is probably gathering in Japan: Abenomics has failed! Contrary to every economic theory, debt accumulation, debt monetization and record amounts of currency creation have resulted in a rising yen and falling prices.
4FinLight Research | www.finlightresearch.com
5FinLight Research | www.finlightresearch.com
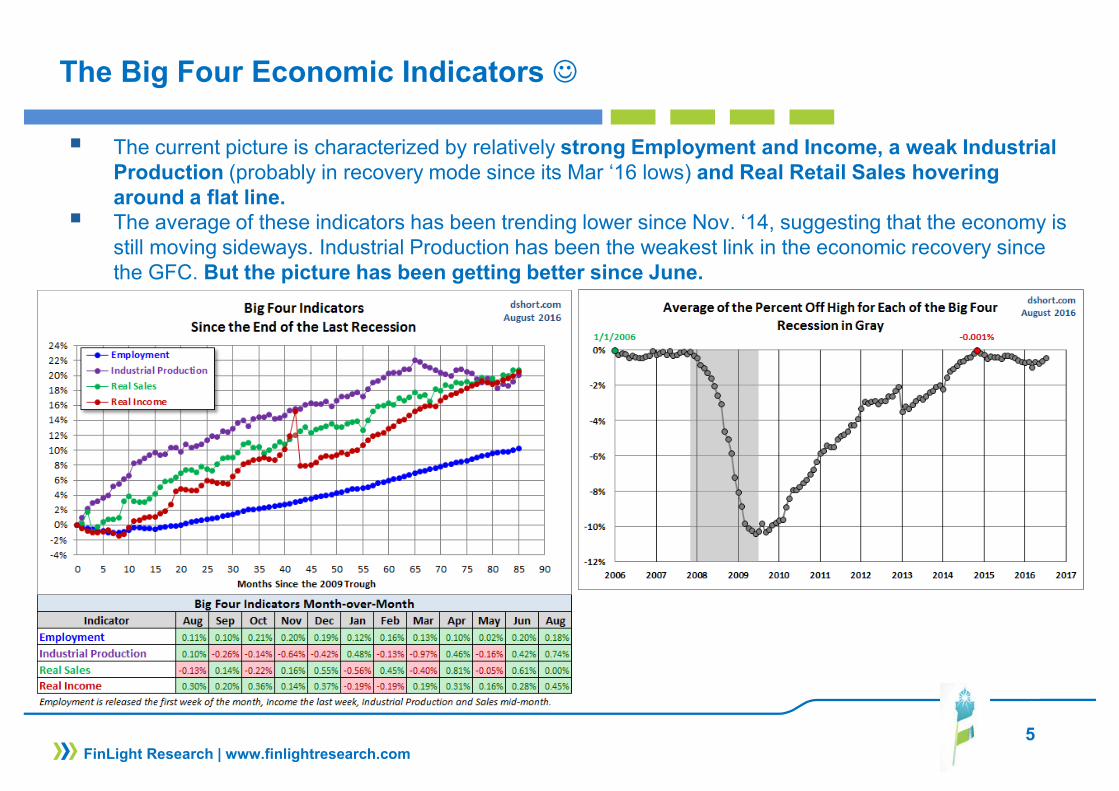
The Big Four Economic Indicators ☺
� The current picture is characterized by relatively strong Employment and Income, a weak Industrial Production (probably in recovery mode since its Mar ‘16 lows) and Real Retail Sales hovering around a flat line.
� The average of these indicators has been trending lower since Nov. ‘14, suggesting that the economy is still moving sideways. Industrial Production has been the weakest link in the economic recovery since the GFC. But the picture has been getting better since June.
6FinLight Research | www.finlightresearch.com
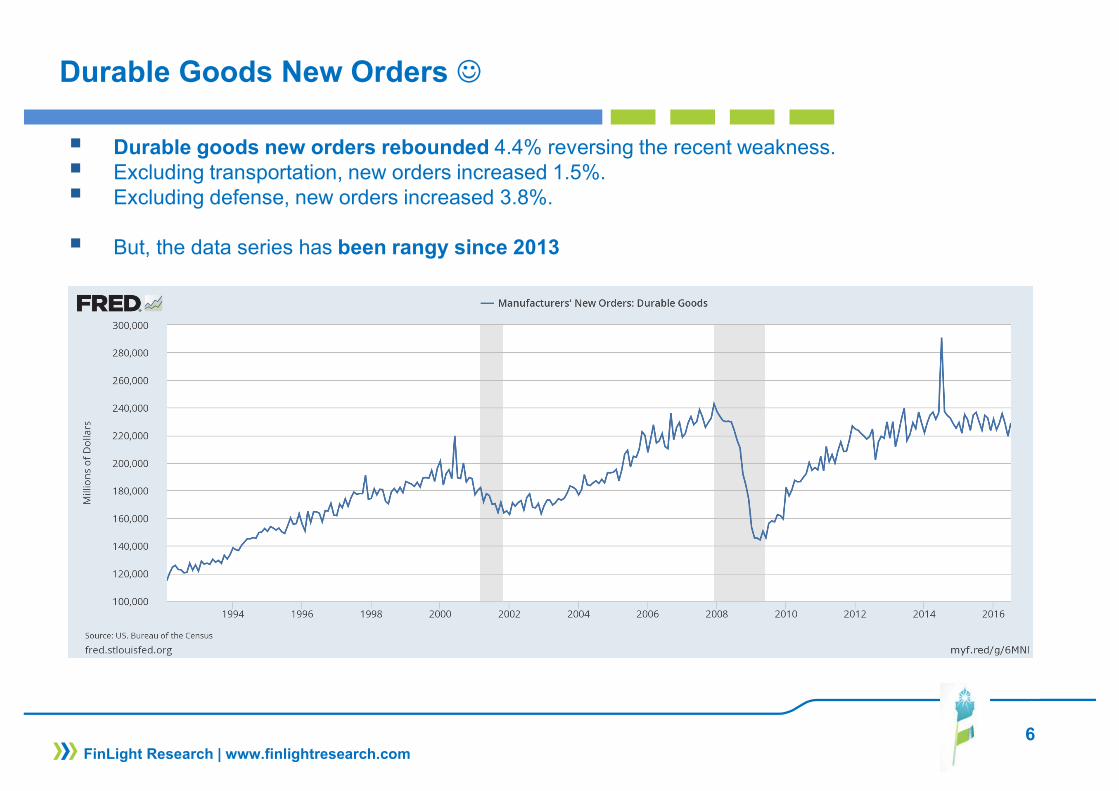
Durable Goods New Orders ☺
� Durable goods new orders rebounded 4.4% reversing the recent weakness. � Excluding transportation, new orders increased 1.5%. � Excluding defense, new orders increased 3.8%.
� But, the data series has been rangy since 2013
7FinLight Research | www.finlightresearch.com
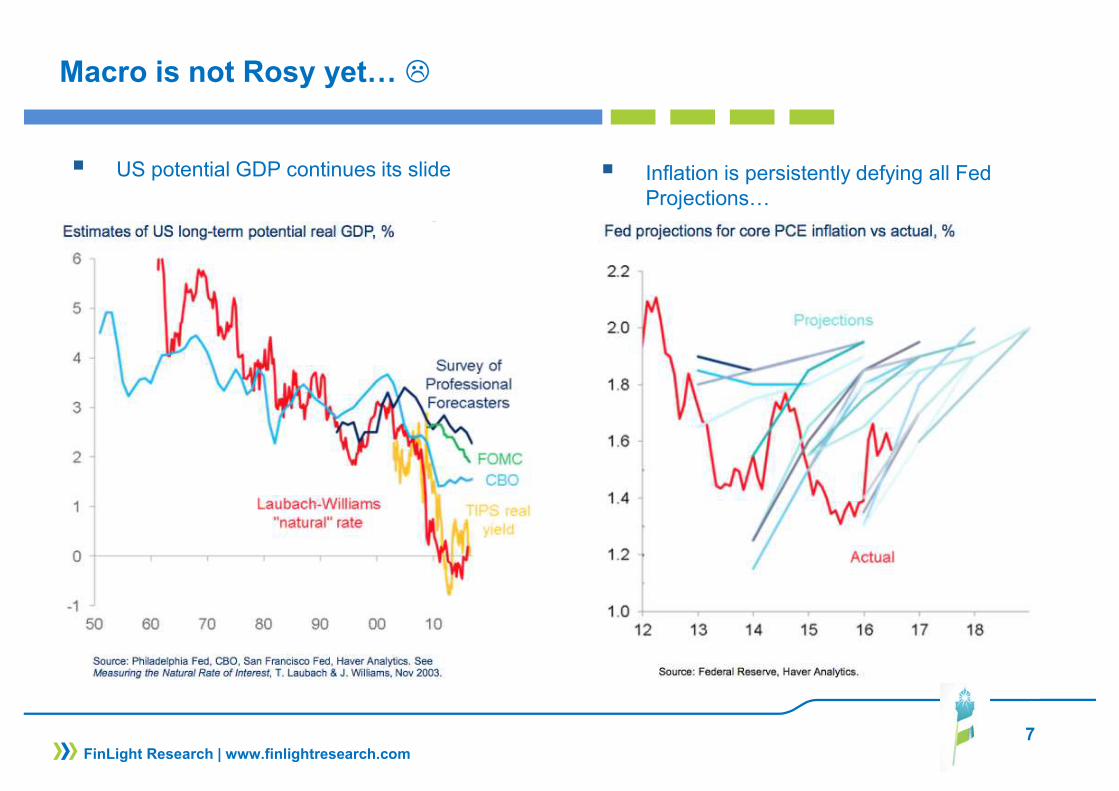
Macro is not Rosy yet… �
� US potential GDP continues its slide � Inflation is persistently defying all Fed Projections…

8FinLight Research | www.finlightresearch.com
Blame the Slowdown in Productivity! �
� Productivity growth has been plunging in all DM economies over the past decade.
� Productivity slowdown is clearly weighing on GDP.
� Two possible explanations for that:
� Fischer’s theory that weak productivity growth is the fault of a lack of innovation, an issue that monetary policy is not well equipped to address
� Mismeasurement of effective productivity due to the increased difficulty to assess value in the information and communications technology (mainly software, digital products, and specialized technology equipment) sector.
9FinLight Research | www.finlightresearch.com
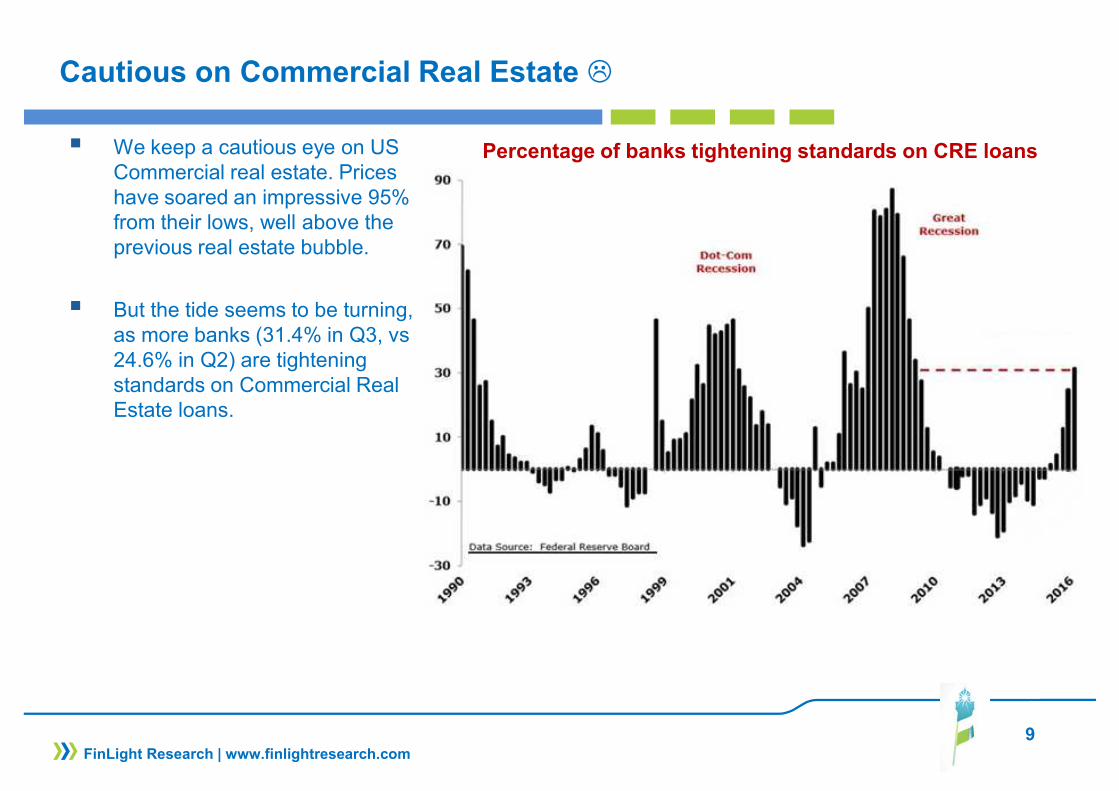
Cautious on Commercial Real Estate �
� We keep a cautious eye on US Commercial real estate. Prices have soared an impressive 95% from their lows, well above the previous real estate bubble.
� But the tide seems to be turning, as more banks (31.4% in Q3, vs 24.6% in Q2) are tightening standards on Commercial Real Estate loans.
Percentage of banks tightening standards on CRE loans

10
US Rates: Signs of Secular Stagnation?
� 5y-5yr forward rates are well below 2008 levels in main DM markets
� This is consistent with “secular stagnation” theories.
FinLight Research | www.finlightresearch.com
11FinLight Research | www.finlightresearch.com
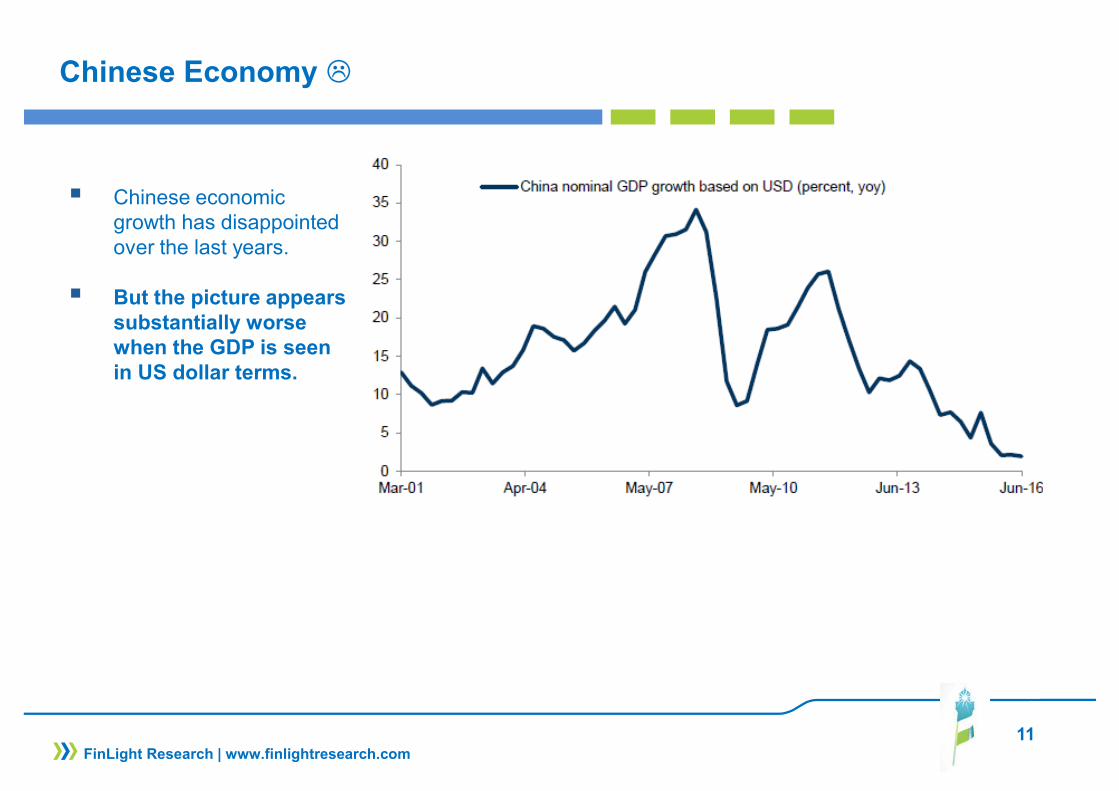
Chinese Economy �
� Chinese economic growth has disappointed over the last years.
� But the picture appears substantially worse when the GDP is seen in US dollar terms.
12FinLight Research | www.finlightresearch.com
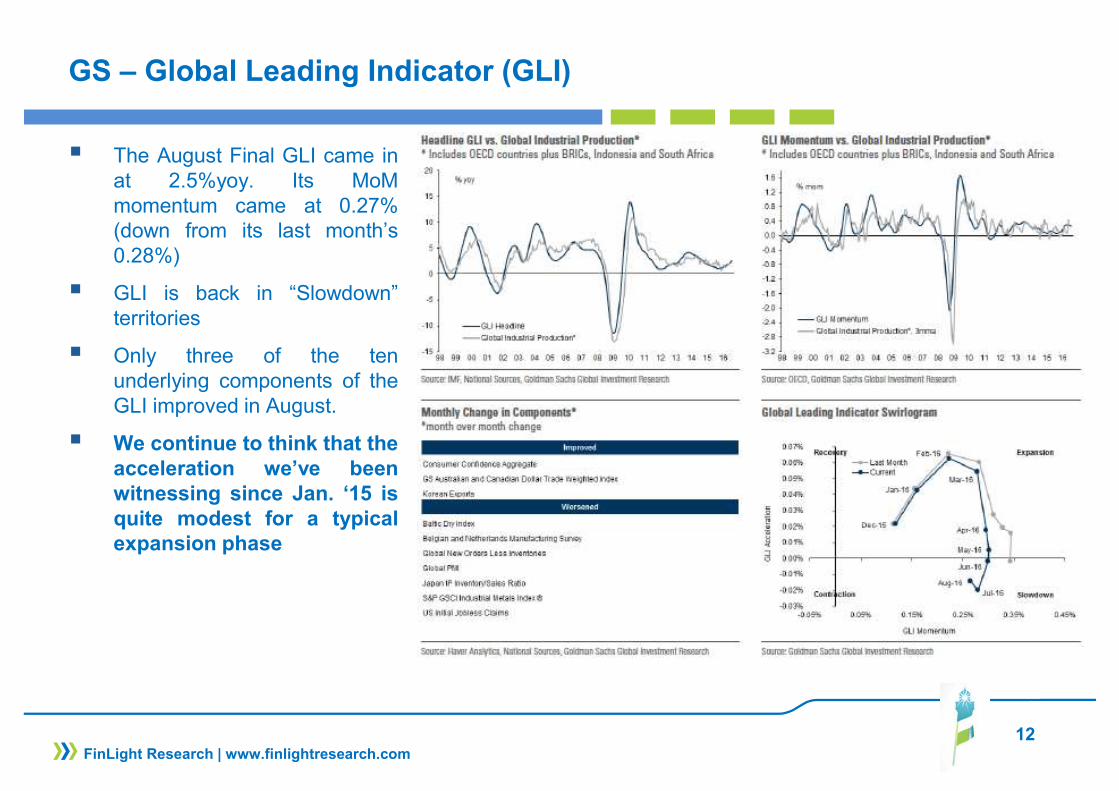
GS – Global Leading Indicator (GLI)
� The August Final GLI came inat 2.5%yoy. Its MoMmomentum came at 0.27%(down from its last month’s0.28%)
� GLI is back in “Slowdown”territories
� Only three of the tenunderlying components of theGLI improved in August.
� We continue to think that theacceleration we’ve beenwitnessing since Jan. ‘15 isquite modest for a typicalexpansion phase

13FinLight Research | www.finlightresearch.com
EQUITY
� Our equity outlook remains cautious. We see the market more vulnerable than ever to growth andpolicy disappointments.
� Despite the fact that we’re running into 6 straight quarters of earnings contraction, the S&P500 made newall-time highs. Its trend remains up on the daily, weekly and monthly time frames.
� Globally, stocks are trading at historical high valuations in terms of earnings and sales
� A stronger dollar will induce another headwind to already weak earnings
� Capital spending continues to contract and to be replaced by stock buybacks and other forms of financialengineering.
� Tactically, we moved from OW (a position we’ve kept since Mar. ‘16) to Neutral on stocks, as theS&P500 broke below 2055, last Friday (Sep 9).
� We still think that key fundamental data will eventually matter… in a BIG BIG way. For now, investorsare buying the rumor of better future earnings. One day, they will be selling the news of bad effectiveearnings.

14FinLight Research | www.finlightresearch.com
EQUITY
� Our scenarios are unchanged.
� Our main scenario from here (70% chance) : A massive top forming around 2170-2190� Equities remain expensive, earnings growth poor and profit margins are showing increasing
evidence of peaking. On Price/Sales metric, equities are trading at the top of the historical range. � A resumption of earnings growth going into 2016 will be necessary for equities to move higher.
� Our alternative scenario (30% chance) : The S&P500 breaks the 2170-2190 resistance, opening the way to 2225 - 2300. Such a breakout would need a new round of stimulus and/or a new impulse to macro fundamentals
� A pull back below 2080 is needed in order to confirm our primary scenario!� Above 2200-2225, we’ll be obliged to recognize the alternative scenario is in.
15FinLight Research | www.finlightresearch.com
EQUITY
� Bottom line :
� De-risking should continue. A higher allocation to cash is sensible in this late-stage stock bull.� We adjust our positioning rules on the S&P 500 as follows:
� We moved from OW to Neutral as the index broke below 2155 on Friday Sep 9.� To switch to OW again, we need a break higher than 2185 – 2200 � We will switch to UW as soon as the 2000 – 2010 range is materially broken to the downside. � Any clean break below the ‘09 trend would make us move massively UW
� We like the low US beta. We remain Neutral Japan and UW Europe vs. US.
� We remain UW in US small caps vs large caps. � We remain OW defensive vs. cyclical and value stocks vs growth stocks. We turn Neutral on high
dividend stocks.
� We remain UW EMs vs DMs despite the recent EM outperformance and robust flows going into EM Equities (since the start of July). � An “on hold” Fed and a range bounded US dollar is positive for EM sentiment� But, we see risks to the downside. We expect another (last) leg of USD strengthening.
Negative spillovers from China will also likely have a strong impact on other EMs.
16FinLight Research | www.finlightresearch.com
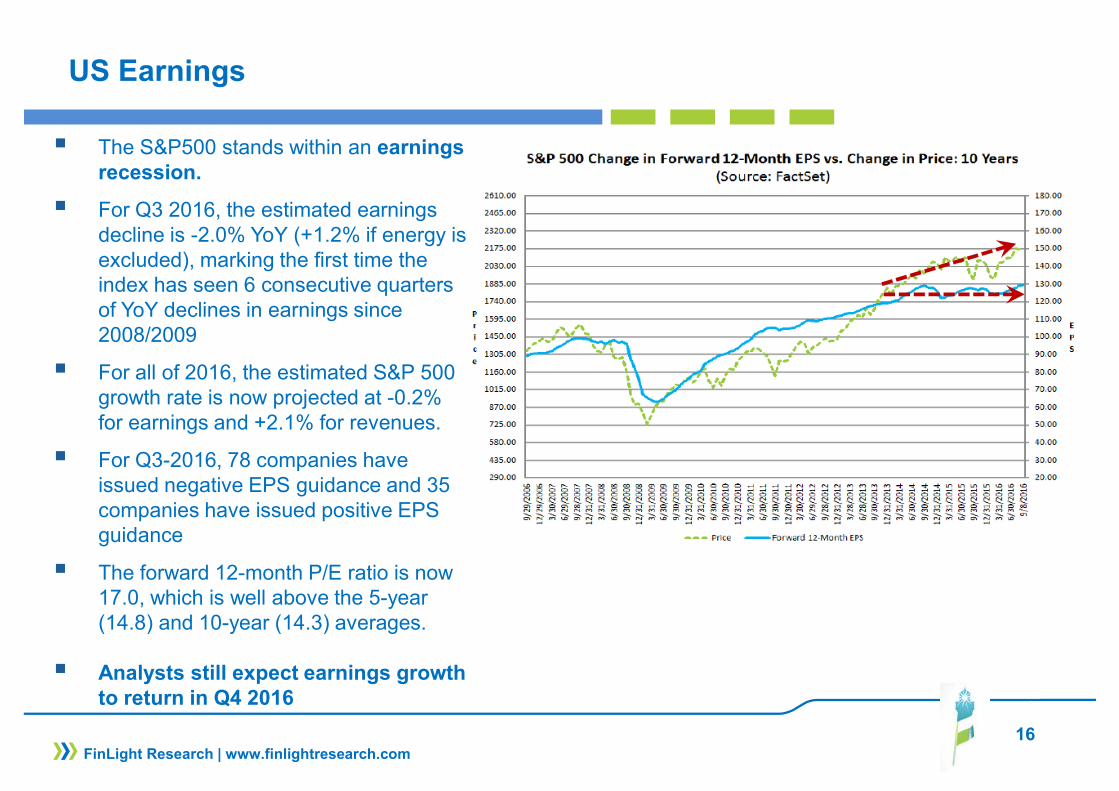
US Earnings
� The S&P500 stands within an earningsrecession.
� For Q3 2016, the estimated earnings decline is -2.0% YoY (+1.2% if energy is excluded), marking the first time the index has seen 6 consecutive quarters of YoY declines in earnings since 2008/2009
� For all of 2016, the estimated S&P 500 growth rate is now projected at -0.2% for earnings and +2.1% for revenues.
� For Q3-2016, 78 companies have issued negative EPS guidance and 35 companies have issued positive EPS guidance
� The forward 12-month P/E ratio is now 17.0, which is well above the 5-year (14.8) and 10-year (14.3) averages.
� Analysts still expect earnings growth to return in Q4 2016

17FinLight Research | www.finlightresearch.com
US Earnings
� Our feeling is that reported earnings should be interpreted with more and more cautious
� The gap between operating earnings and GAAP (standard accounting rules) earnings is getting wider
18FinLight Research | www.finlightresearch.com
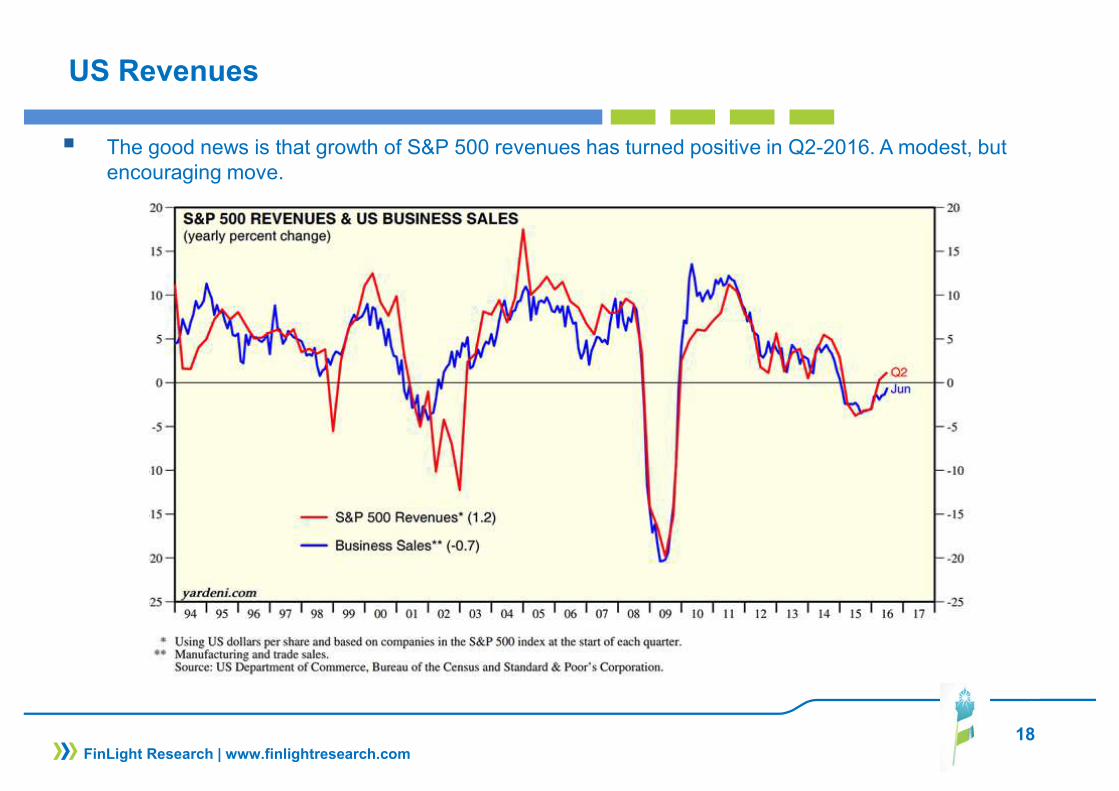
US Revenues
� The good news is that growth of S&P 500 revenues has turned positive in Q2-2016. A modest, but encouraging move.
19FinLight Research | www.finlightresearch.com
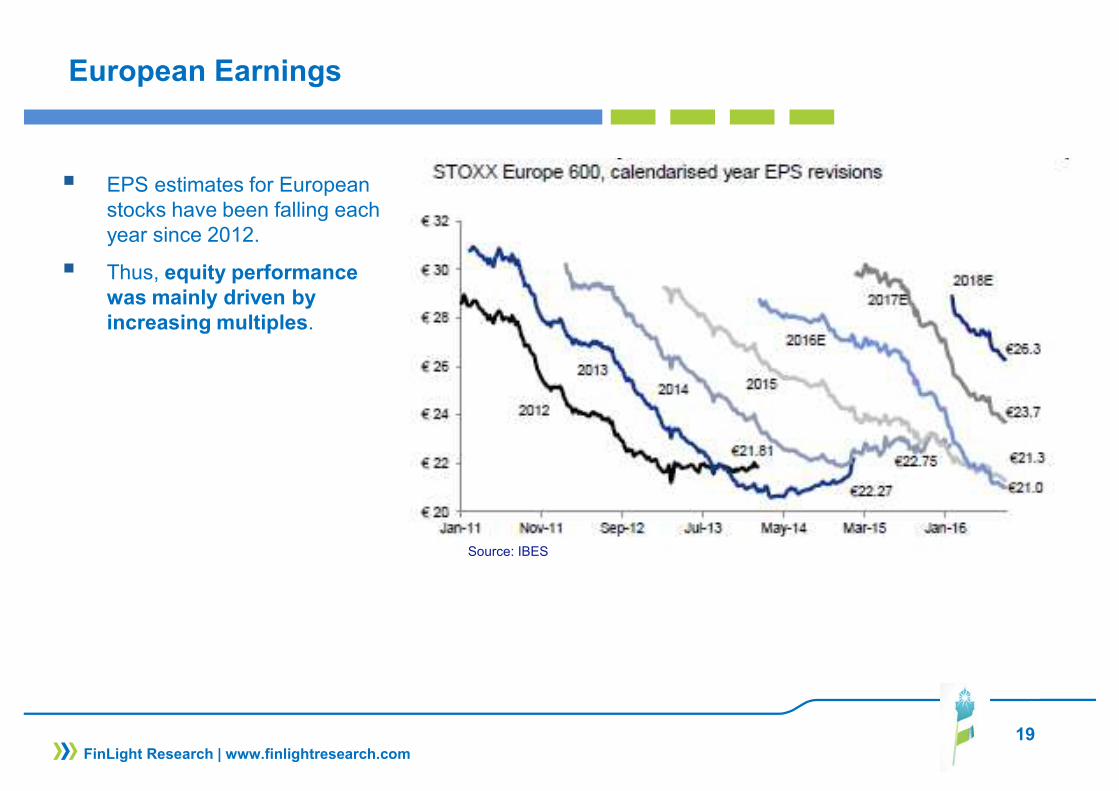
European Earnings
� EPS estimates for European stocks have been falling each year since 2012.
� Thus, equity performance was mainly driven by increasing multiples.
Source: IBES

20FinLight Research | www.finlightresearch.com
European Earnings
� Indeed, equity valuations for European stocks are near their historical highs.
� Furthermore, European equities don’t look fundamentally cheaper than US equities, when financials are excluded .
� We keep our UW bias on European stocks vs US stocks.
12-month Fwd P/E Ratio
Source: Goldman Sachs

21FinLight Research | www.finlightresearch.com
Earnings Sentiment
� Global earnings sentiment has been improving, recently.
� The move on CY16 global earnings has been the most optimistic in recent years
Source: IBES, Goldman Sachs

22FinLight Research | www.finlightresearch.com
Payout Ratios
� Payout ratios are back to their historical highs
� This seems consistent with low growth expectations
� This is probably another sign of secular stagnation
Percentage of European companies with dividend yields exceeding corporate bond yields

23FinLight Research | www.finlightresearch.com
Dividend Growth
� Long-term dividend growth (as implied by dividend swaps) is still heading south.
� Currently, it stands at its 2008 lows.
� Dividend growth slide has closely followed the (mis-)evaluation of 10yr USTs.
� This is one of the signs we see for secular stagnation
� The picture is worse for European stocks � Another reason to remain UW Europe vs US.

24FinLight Research | www.finlightresearch.com
High DY Stocks
� High dividend yield stocks outperformed in line with government yield shrinkage
� High DY stocks have clearly benefited from yield scarcity
� We have been OW High DY stocks for a while, now.
� We choose to switch to neutral on High DY stocks given the poor dividend growth perspectives.
Source: Goldman Sachs

25FinLight Research | www.finlightresearch.com
S&P500 – BBM Squeeze
� The S&P 500's daily Bollinger Band Width (BBW) has never been lower since1982.
� This is probably a sign that a big move is imminent in stocks
� Such a “squeeze” in BBW is usually followed by a band break and the start of a new move in one direction or the other.
S&P500 Bollinger BandWidth
Source: Bloomberg

26FinLight Research | www.finlightresearch.com
S&P500 – Market Breadth
� Market breadth has deteriorated a lot during the summer: 50-dma breadth (% of SPX companies trading above their 50 day moving average) fall to its lowest level since the Brexit surprise in end of Jun’ 16.
� There are zero stocks above their 50-DMAs in both the Utilities and Telecom sectors, the best performers YTD
� Furthermore, the breadth chart shows a bearish divergence configuration which may be interpreted as another warning signal.
Source: Bloomberg data
27FinLight Research | www.finlightresearch.com
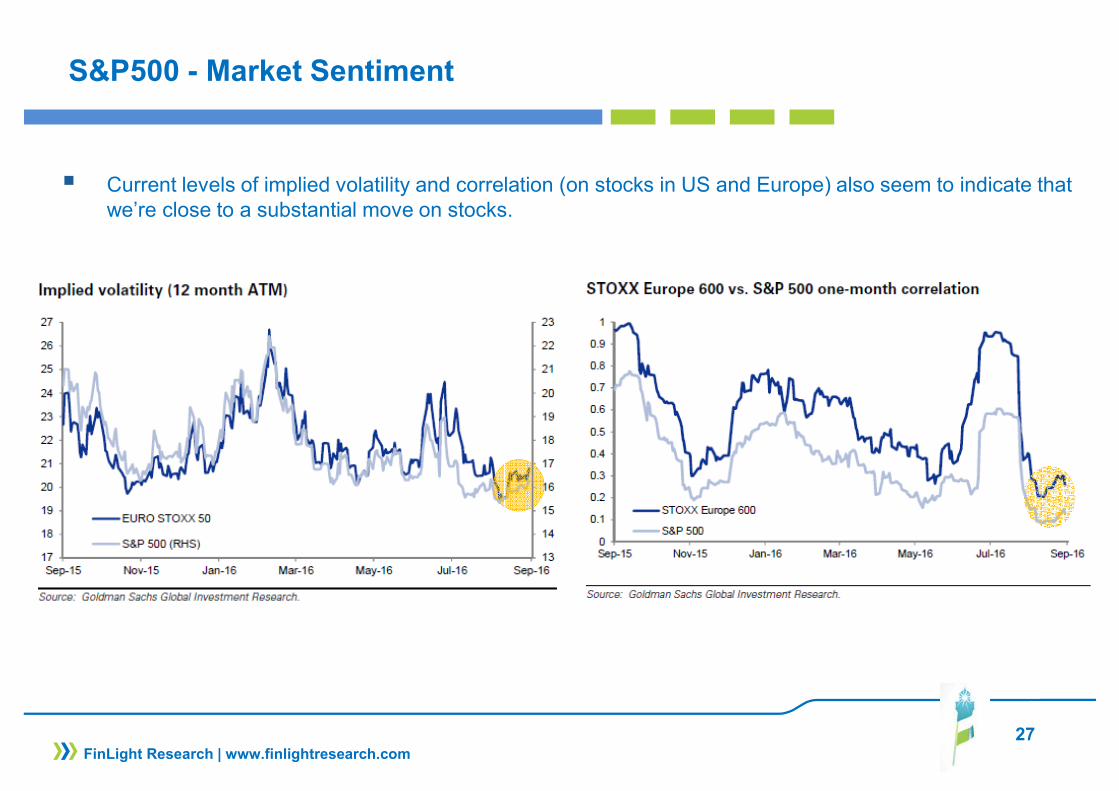
S&P500 - Market Sentiment
� Current levels of implied volatility and correlation (on stocks in US and Europe) also seem to indicate that we’re close to a substantial move on stocks.

28FinLight Research | www.finlightresearch.com
US Equities – Market Positioning
� Commodity Futures Trading Commission's COT report shows that hedge funds hold an extremely long position in Dow futures
Source: CFTC Commitments of Traders

29FinLight Research | www.finlightresearch.com
US Equities – Market Positioning
� Hedge funds are massively net short VIX futures.
� This is a bearish signal as crowded short positioning usually lead to an explosive move in the opposite direction.
Source: CFTC Commitments of Traders

30FinLight Research | www.finlightresearch.com
S&P500 – A Long-Term Perspective
� Equity markets still appear at lofty valuations, whatever the valuation metric we use.
� All the indicators we use suggest a cautious long-term outlook and weak long-term return expectations � These measures are consistent with flat (0%) 12 year S&P 500 nominal total returns
31FinLight Research | www.finlightresearch.com
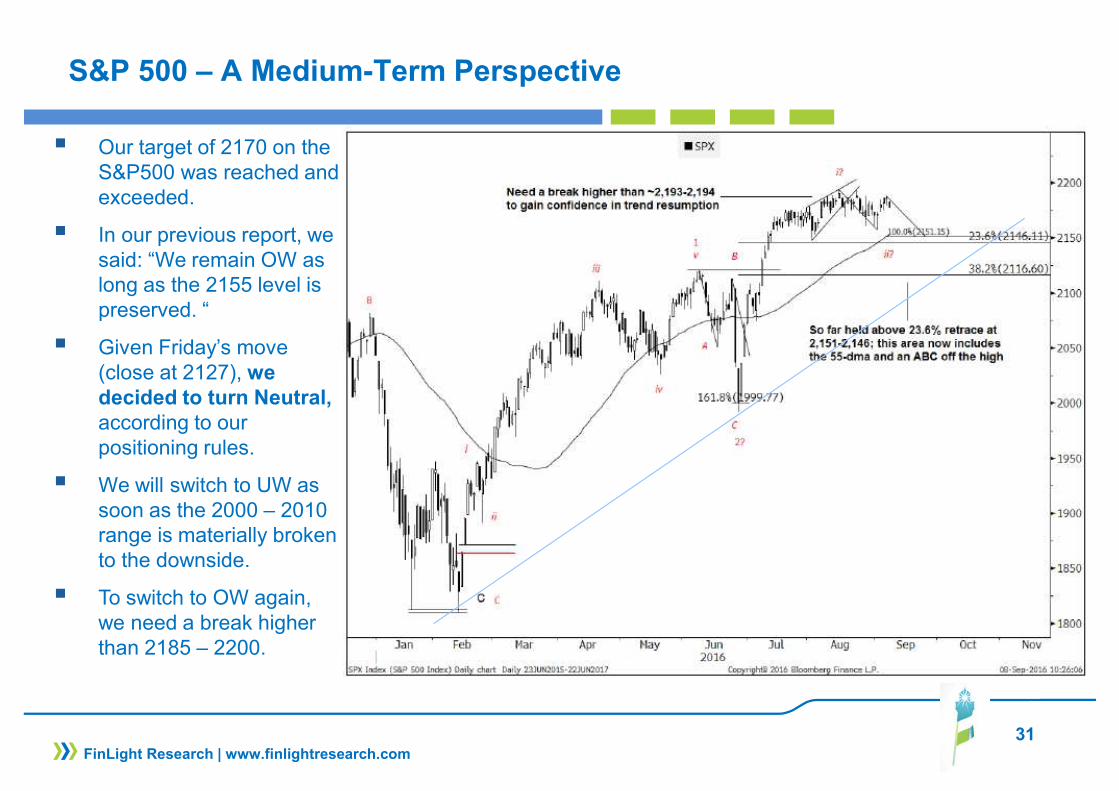
S&P 500 – A Medium-Term Perspective
� Our target of 2170 on the S&P500 was reached and exceeded.
� In our previous report, we said: “We remain OW as long as the 2155 level is preserved. “
� Given Friday’s move (close at 2127), we decided to turn Neutral,according to our positioning rules.
� We will switch to UW as soon as the 2000 – 2010 range is materially broken to the downside.
� To switch to OW again, we need a break higher than 2185 – 2200.

32FinLight Research | www.finlightresearch.com
S&P500 – A Short-Term Perspective
� Our prop. Short-Term trading model has been flat since mid-August.
� 3 systems are targeting a break above 2189. � 3 others are targeting a break below 2083� Bottom line: There is no conviction there!
33
FIXED INCOME & CREDIT
GOVIES & INFLATION-LINKED
� Over the last weeks, the Fed has been signaling its willingness to move ahead with a second rate hike.
� A rate hike by year end now seems in the bag. Recent comments from Fed officials have also opened the door for a rate hike as soon as in September 21st
� As a consequence, the US rate curve flattened with its front end underperforming and long end remaining stable.
� After this quiet summer, rate volatility seems far too low. Thus, any sign of reluctance by Central Bank to ease further would result in a substantial correction in global rates .
� G3 government yields are inconsistent with fundamentals. Eurozone (like Japanese) yields appear too low when compared to nominal GDP growth. In our view, this is a bubble inflated by investors who think that central banks will support such prices indefinitely..
� The endgame will be disastrous given the extreme levels reached by valuation and market positioning in FI.
� Inflation isn't on anyone's radar right now. Inflation expectations haven't moved up yet. Any surprise on the inflation front would make a lot of damage on the market.
� Inflationary signs should be watched closely as they will foreshadow a steepening decline in Govies.
� We remain Neutral 10y-TIPS and HICP Inflation as we expect breakevens to trade sideways from here
FinLight Research | www.finlightresearch.com

34
FIXED INCOME & CREDIT
CORPORATE CREDIT
� A quiet summer and a depressed volatility have been supportive for the credit markets.
� Corporate credit spreads inched tighter on both sides of the Atlantic with HY outperforming IG.
� Euro HY continued to tighten with investors exodus out of CSPP-eligible bonds (with tighter spreads) and moving down the rating spectrum.
� Credit is expensive relative to the fundamentals . fundamentals continue to deteriorate, with EBITDA growth continuing to decline and net leverage rising further (especially in the US). But central bank QE from Europe and Japan remains a support.
� We remain overweight US vs EUR credit (more on IG than HY) because of our fundamentally bearish view on European credit, the relative yield disadvantage and the fact that the re-leveraging cycle looks more mature in the US.
� We keep our bias towards higher quality. Any unpriced rate hike (and/or dollar strengthening) would weigh on low quality bonds (High Yield and EM debt). We remain UW on HY and Neutral on IG.
� We remain, however, concerned about the outlook for the US HY market, where default rates continue to move up and balance sheets are deteriorating. Renewed weakness in oil prices will bring this issue under the spotlights again
� We expect the focus on liquidity to remain. As said in previous reports, we feel concerned about the credit market liquidity as the rate of turnover in corporate bonds has steadily declined since 2009, despite the huge inflows
FinLight Research | www.finlightresearch.com

35
FIXED INCOME & CREDIT
EM DEBT
� The dollar strengthening we still expect would weigh on EM debt
� We remain Neutral on EM bonds, because of all the macro challenges facing the EM economies at a time when the Fed is likely to be more hawkish
� Bottom line : We change nothing to our views : OW Govies, UW US vs Eurozone Govies, remain long flatteners on the US yield curve and short duration in 2y USTs, UW credit mainly through HY and Neutral on IG (duration hedged), UW Eurozone vs US in IG & HY credit, Neutral 10y-TIPS and Neutral HICP Inflation, UW High Yield vs High Grade, Neutral on EM sovereigns with a little preference for local bonds
FinLight Research | www.finlightresearch.com
36
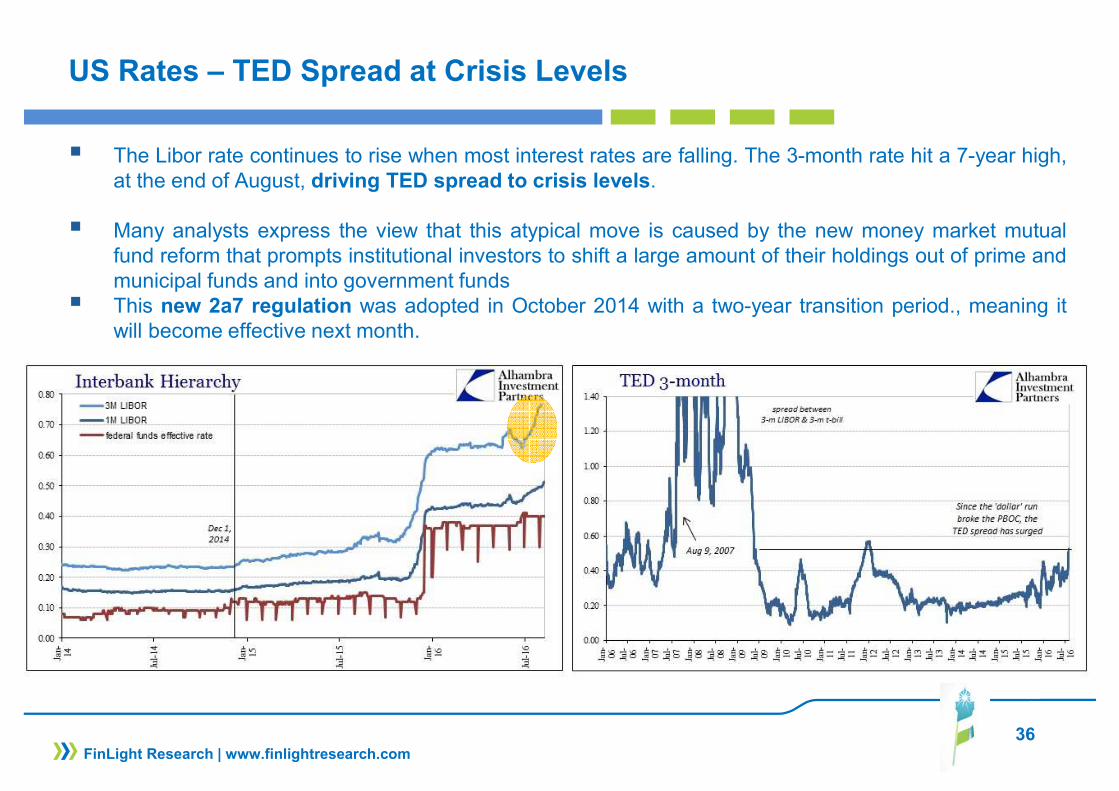
US Rates – TED Spread at Crisis Levels
� The Libor rate continues to rise when most interest rates are falling. The 3-month rate hit a 7-year high,at the end of August, driving TED spread to crisis levels.
� Many analysts express the view that this atypical move is caused by the new money market mutualfund reform that prompts institutional investors to shift a large amount of their holdings out of prime andmunicipal funds and into government funds
� This new 2a7 regulation was adopted in October 2014 with a two-year transition period., meaning itwill become effective next month.
FinLight Research | www.finlightresearch.com
37
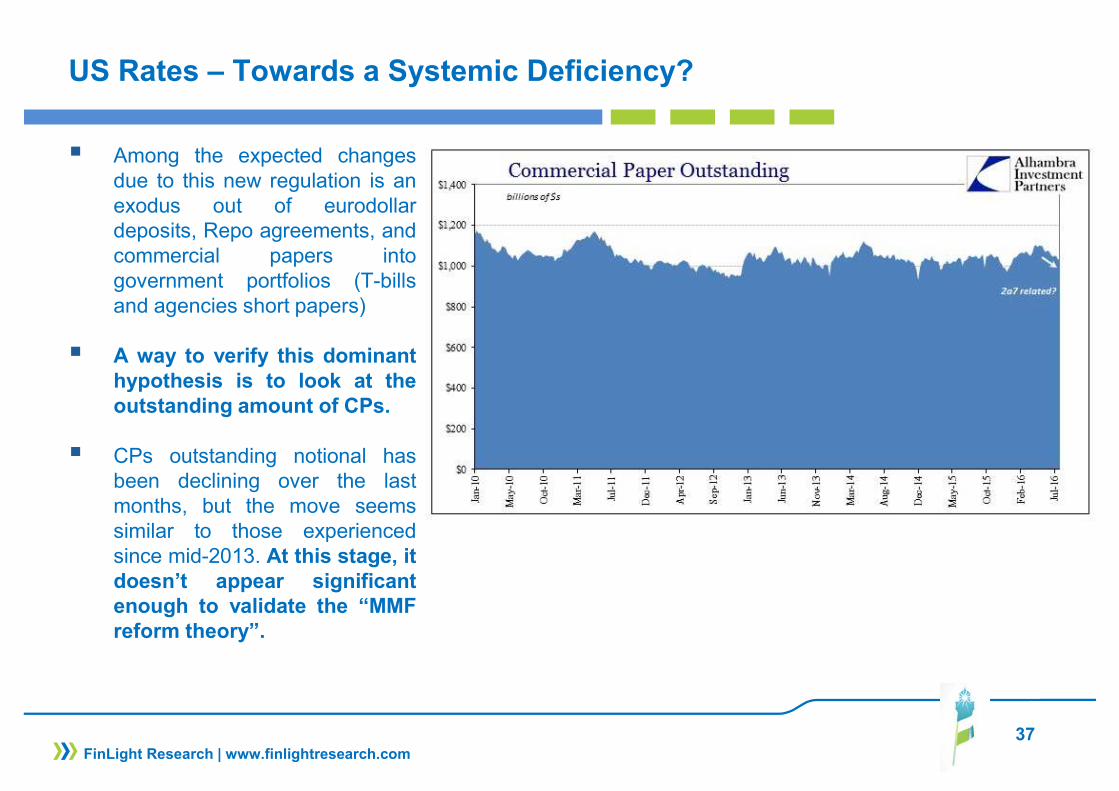
US Rates – Towards a Systemic Deficiency?
� Among the expected changesdue to this new regulation is anexodus out of eurodollardeposits, Repo agreements, andcommercial papers intogovernment portfolios (T-billsand agencies short papers)
� A way to verify this dominanthypothesis is to look at theoutstanding amount of CPs.
� CPs outstanding notional hasbeen declining over the lastmonths, but the move seemssimilar to those experiencedsince mid-2013. At this stage, itdoesn’t appear significantenough to validate the “MMFreform theory”.
FinLight Research | www.finlightresearch.com

38
US Rates – A Dollar Funding Crunch?
� Since end of 2015, the move on 3-month US Libor has come with a similar widening in OIS ratesand Libor-OIS spreads
� As a consequence, the short-term funding gap relative to Japan has increased in a substantial way.
FinLight Research | www.finlightresearch.com

39
US Rates – Higher Hedging Costs
� This “rarefication” of short-term dollar funding hasbecame visible throughUSD-JPY basis swaps.
� From a Japanese investor’spoint of view, the wideningof USD-JPY basis swapshas pushed the cost ofdollar hedging to a level(around an additional 100bpover the past year) thatsimply eliminates anyyield pick-up for him.
FinLight Research | www.finlightresearch.com
40
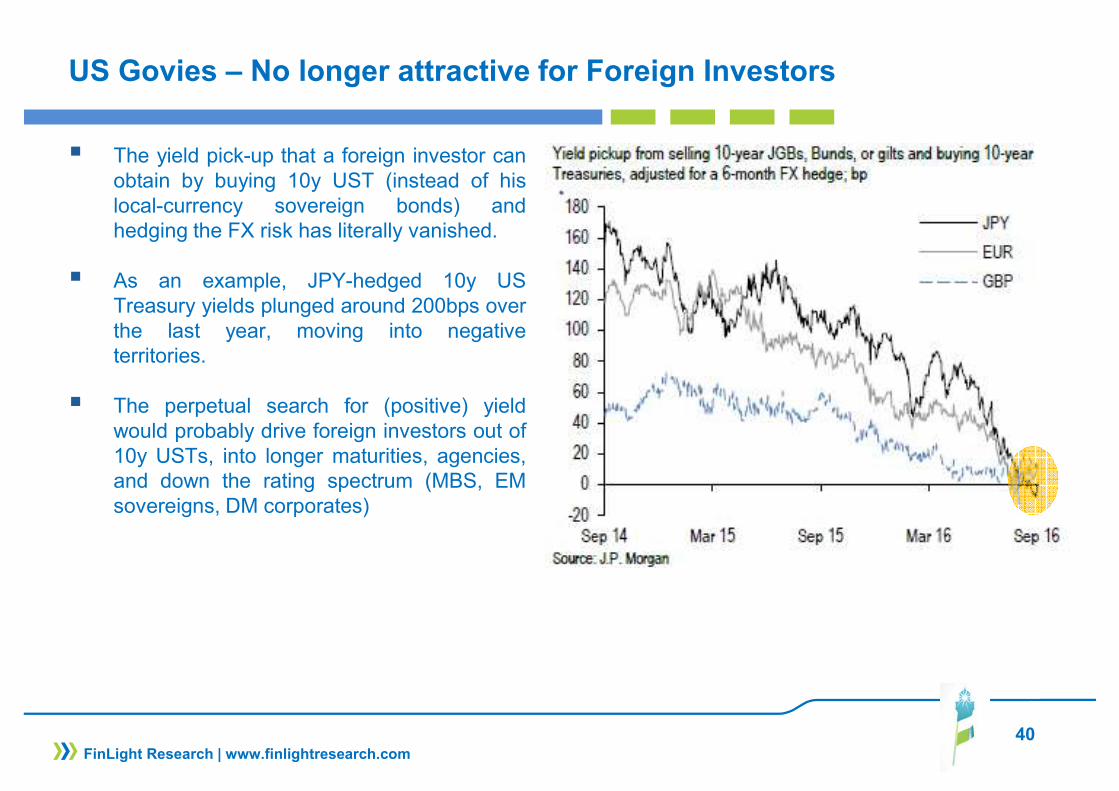
US Govies – No longer attractive for Foreign Investors
� The yield pick-up that a foreign investor canobtain by buying 10y UST (instead of hislocal-currency sovereign bonds) andhedging the FX risk has literally vanished.
� As an example, JPY-hedged 10y USTreasury yields plunged around 200bps overthe last year, moving into negativeterritories.
� The perpetual search for (positive) yieldwould probably drive foreign investors out of10y USTs, into longer maturities, agencies,and down the rating spectrum (MBS, EMsovereigns, DM corporates)
FinLight Research | www.finlightresearch.com

41
US Real Rates
� Long-term real interest rateshave trended south since theend of 2015, but seem to bestabilizing over the last fewmonths.
� Central Banks have failed toignite inflation via QE. Fiscalstimulus is probably their net try.
� We start to see signs of areversal in LT US real interestrates
FinLight Research | www.finlightresearch.com
Source: Bloomberg data

42
US Govies – 10y UST
� Technically speaking, the riskof an impulsive decline hasdiminished on the 10y USTyield
� In June, we moved to OW asthe 10y yield broke below1.65.
� Since July, yields have beenevolving within a tight triangleconsolidation pattern
� Our positioning rules areadjusted:� We’ll turn Neutral again
above 1.65 and we’llremain so as long as the1.80 level is preserved.
� We’ll move also Neutralaround 1.25-1.28
� Above 1.80, we’ll move toUW.
FinLight Research | www.finlightresearch.com

43
EUR Govies – 10y Bund
� The bund seem to havefound a support at -0.13%for the moment.
� We remain OW but willconsider bearishexposure if the 10y-yieldmove through -0.02%.Target ~0.11%
FinLight Research | www.finlightresearch.com

44
US Credit – HY vs IG
� US HY has been outperforming IG sinceMarch.
� We keep however our bias towards IGfor a better risk-return tradeoff.
� We believe investors are toocomplacent with credit risk.
� Investors are uncomfortable with currentvaluations, but still stick to their ‘buy-the-dip' mentality’: They have cash to put towork, and are just looking for better entrylevels.
� Major risks, at this stage, are:
� A resurgence of idiosyncratic risk.
� A rate shock induced by CentralBanks reluctance to ease more.
FinLight Research | www.finlightresearch.com

45
US Credit – Rating Drift Rate
� Upgrade-to-downgrade ratio isanother indicator showing thatwe are in the late stage of thecredit cycle.
FinLight Research | www.finlightresearch.com

46
EXCHANGE RATES
� Central banks remain the key driver of foreign exchange, We remain structural Dollar bulls� The dollar is now likely to bounce as the Fed ramps up its hawkish rhetoric.
� The technical picture for the EUR-USD remains rangy and messy.� We remain UW for the moment. We will move to Neutral above 1.14, and to OW if the spot breaks
above the 1.16 resistance to target 1.18� Our positioning rules remain unchanged:
� Move to Neutral within the 1.14 - 1.165 range� Move to OW if the spot breaks above the 1.165 resistance to target 1.18� Remain UW below 1.14. Target = 1.08 and then 1.04 to parity over 2H
� Over the medium-term (2H-2016), we expect the pre-2015 downtrend to resume, eventually.� we maintain our downside projections towards 1.07-1.04-parity. For that, we need a clean break
through the 1.0910-1.0981 area, then through 1.06 support.
� We remain Neutral on the USD-JPY.� But we see the risk of continued losses in USD-JPY ahead of the next BoJ meeting end of Sep. ’16� Our positioning rules on USD-JPY are adjusted:
� Remain Neutral below 105.5� Move to OW above 105.5� Only a break below of 99.50 and bearish momentum, would make us move to UW
FinLight Research | www.finlightresearch.com

47
EXCHANGE RATES
� EM currencies have weakened since the middle of August as Fed risks have been repriced. � We anticipate that pressure on EM currencies will resume and continue until we see a more
constructive / fundamental improvement for global growth and commodities supply/demand imbalances.
� We remain UW EM and Commodity FX
FinLight Research | www.finlightresearch.com

48
EUR-USD
� 3 months ago, we moved to UWon the EUR-USD after the cleanbreak below 1.13.
� The technical picture remainsrangy and messy.
� We remain UW for the moment.We will move to Neutral above1.14, and to OW if the spotbreaks above the 1.16 resistanceto target 1.18
� Over the medium-term (2H-2016), we maintain our downsideprojections towards 1.07-1.04-parity. For that, we need a cleanbreak through the 1.0910-1.0981 area, then through 1.06support.
FinLight Research | www.finlightresearch.com

49
USD-JPY
� The important area to watch standsaround the trendline formed acrossthe highs since January ~103.94
� For now, we remain Neutral.
� We adjust however our positioningrules on USD-JPY as follows:� Remain Neutral below 105.5
(Jan. trendline)� Move to OW above 105.5� Only a break below of 99.50
and bearish momentum, wouldmake us move to UW
FinLight Research | www.finlightresearch.com

50
COMMODITY
� The summer sell-off hasn’t occurred in commos.� Nevertheless, and as expected, commodity prices moved lower in response to the Fed's most recent
hawkish rhetoric.
� We continue to view upward moves more as technical adjustments than as a fundamentally-driven ones.
� We don’t see any sustainable recovery without a pick-up in global growth or a material tightening on the supply side. It is likely that supply destruction (due to pull-back in capital investment) will be the main catalyst for the next sustainable recovery in prices.
� We also expect a considerable volatility along the way
� We remain UW commodities over 3-6 months as we believe the recent rally might be short-lived� The supply side has adjusted but still has a way to go in many commodities before erasing
current imbalances. In order to get more cuts in supply, we think there needs another legdown in prices to force capitulation
� US dollar strengthening should resume. Dollar will dictate both direction and velocity incommos. We expect the stronger dollar to put downward pressure on commodities despitesupportive fundamentals for some of them
� The downtrend in commodities looks about to bottom out. We see one last leg down in energyand metals.
FinLight Research | www.finlightresearch.com
51
COMMODITY
� Bottom Line :Energy:
� Hopes of a producer deal have supported markets, but now are fading. OPEC freeze appears more like a bluff. Prospects of a deal in Algiers become less and less plausible.
� Ample supply and growing inventories remain the major problem plaguing the oil market. US shale production continues to weigh on price.
� We think that the bottom is in for oil, but we don’t expect a significant rally from here. Any growing evidence that the downtrend in U.S. crude production is ending, would induce another sharp drop in prices.
� $40-$50 per barrel is the range for WTI over the short-term. Only an unexpected exogenous event could cause oil to break out of it.
� We actually expect the spot to test again the 25-30 area before putting in a permanent rebound. At this stage, we watch a few key levels ($40, $36, $31, $25). We need to see how the price behaves around these levels to make our projections.
� We keep our UW bias as long as the spot remains below $50/barrel� Our tactical rules are unchanged:
� Remain UW below $50 to target $37� Move to Neutral above $50� Move to OW above the channel (drawn from Jan. ‘16) ceil or below $29.
FinLight Research | www.finlightresearch.com

52
COMMODITY
Precious Metals:
Outlook for precious metals continues to be dominated by Fed rhetoric, macroeconomic and political uncertainties and the subsequent impact on US dollar, real yields and sovereign credit.
� Price weakness is expected to show up again in the gold market, as investors reassess the probabilityand timing of the Fed’s next rate hike. September rate hike is, now, a real possibility (not yet priced bythe market) and so gold could come under pressure again soon.
� We see more signs pointing towards a reversal in long-term US real interest rates. Such a move willthreaten Gold’s bullishness.
� According to our positioning rules, we remain OW on Gold as it stays above 1295.
� We feel, however, cautious about the sustainability of the recent rally as long positioning becomes very crowded: According to the latest CFTC‘s COT report. Gold futures' net speculative positions remains close to multi-year highs.
� At this stage, we think that gold / silver are still due for a final leg down. Our ultimate target was raised to 1000 – 1040 on gold and 12.5-13 on silver. The main risk to our scenario is the resurgence of DM sovereign risk (starting with UK?).
� Our positioning rules are adjusted as follows:� Remain OW above 1295, targeting 1367 and even 1428� Go Neutral again between 1260 and 1295� Turn UW if the spot breaks below 1260 and go OW again below 1070
FinLight Research | www.finlightresearch.com
53
COMMODITY
Base Metals: .
� Despite the macro-driven rally started in Jan ‘16, we remain UW on base metals on continuing excess supply, weak prospects for demand and cost deflation.
� Industrial metals have remained range bounded over the summer. We believe that lower prices are still needed to induce more supply adjustments.
� From a longer-term point of view, we believe that metals prices are headed for multi-year declinesas the current China-driven super-cycle appears to have peaked
� In base metals, we see limited further upside potential for copper, as it appears to be one of the mostoversupplied markets.
Agriculture:
� The S&P GSCI Agri TR Index posted another loss in Aug. Excess supply worldwide continues to weighon prices.
� For grains, a bullish shift in sentiment from here, would require a significantly larger-than-expected cut toUS yields. We notice that hedge funds have returned to cutting bullish positioning on agriculturalcommodities.
� We choose to remain Neutral on Agris, as we have no conviction at this stage and given biguncertainties around forecasts for 2016-17
FinLight Research | www.finlightresearch.com
54
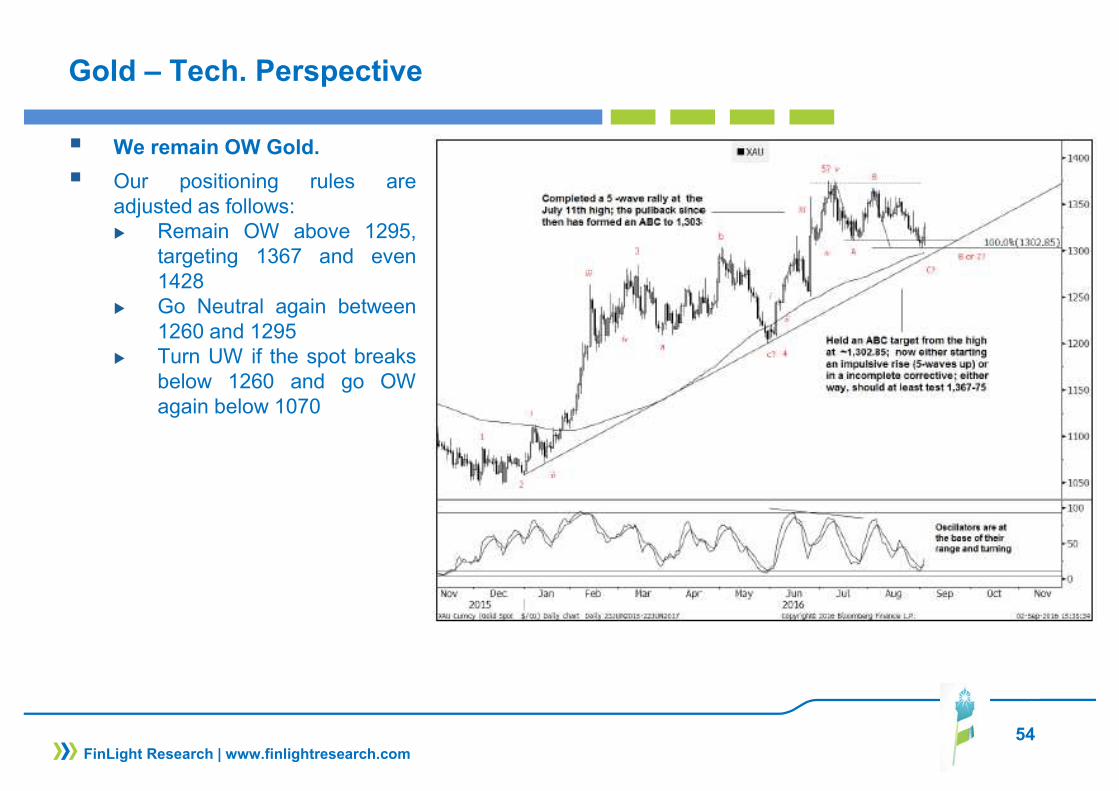
Gold – Tech. Perspective
� We remain OW Gold.
� Our positioning rules areadjusted as follows:� Remain OW above 1295,
targeting 1367 and even1428
� Go Neutral again between1260 and 1295
� Turn UW if the spot breaksbelow 1260 and go OWagain below 1070
FinLight Research | www.finlightresearch.com

55
Precious Metals: Gold Stocks vs Physical Gold
� Gold miner rally is livingon borrowed time.
� Since the beginning of thecurrent gold bull cycle in2002, precious metalsstocks have beenunderperforming gold.
� PM stocks haveoutperformed only during 4short periods of 6 to 12months.
� We are currently in the 4th
period that started in Jan ’16, statistically close to its end.
� Thus we expect gold to rebound soon relative to PM stocks.
FinLight Research | www.finlightresearch.com

56
Crude – Tech. Perspective
� According to our positioningrules (please see our previousreports), we remain UW crude.
� We believe that the downsiderisk has significantly increased
� Our tactical rules are adjustedas follows:� Remain UW below $50 to
target $37� Move to Neutral above $50� Move to OW above the
channel (drawn from Jan.‘16) ceil or below $29.
FinLight Research | www.finlightresearch.com
57
ALTERNATIVE STRATEGIES
� The HFRI Fund Weighted Composite Index posted gains of 0.4% in August. Gains were led by Event-Driven (+1.8% MoM) and Equity Hedge (+1.3% MoM) strategies.
� CTAs experienced losses of 2.9% over the month, as a result of their long fixed income and short USD positions, and despite some gains generated from commodities through short exposure on agricultural
� Global Macro managers continue to play the growth divergence thesis between the US and the rest of the world. They posted a gain of +0.4% in August, benefitting from their long USD positions and shorts in FI.
� We believe that diversifying portfolios with an increased allocation to alternatives is particularly attractive at this stage of the cycle, given the current macroeconomic and interest rate uncertainties.
� Within the hedge fund universe, we continue to prefer strategies with moderate market directionality (“risk diversifiers” type) such as L/S Equity Market Neutral, Global Macro and CTAs. The reason behind that is that we continue to consider traditional asset classes as richly valued.
FinLight Research | www.finlightresearch.com

58
ALTERNATIVE STRATEGIES
� We maintain our OW rating on :
� Equity Market Neutrals both for their “intelligent” beta and their alpha contribution.
� CTAs: Despite their recent losses, we keep a clear OW stance on CTAs as a diversifier in portfolios and a hedge against future stress. Furthermore, we expect new trends to emerge from here…
� Global Macro: We like this strategy as a diversifier and tail hedge. We have a slight preference for macro funds with a focus on Forex and Fixed-income…
� Vol. Arb strategy (HFRI RV: Volatility Index: +0.4% MoM, +2.5% Ytd) and prefer funds that trade volatility globally (all assets / all regions).
FinLight Research | www.finlightresearch.com

59
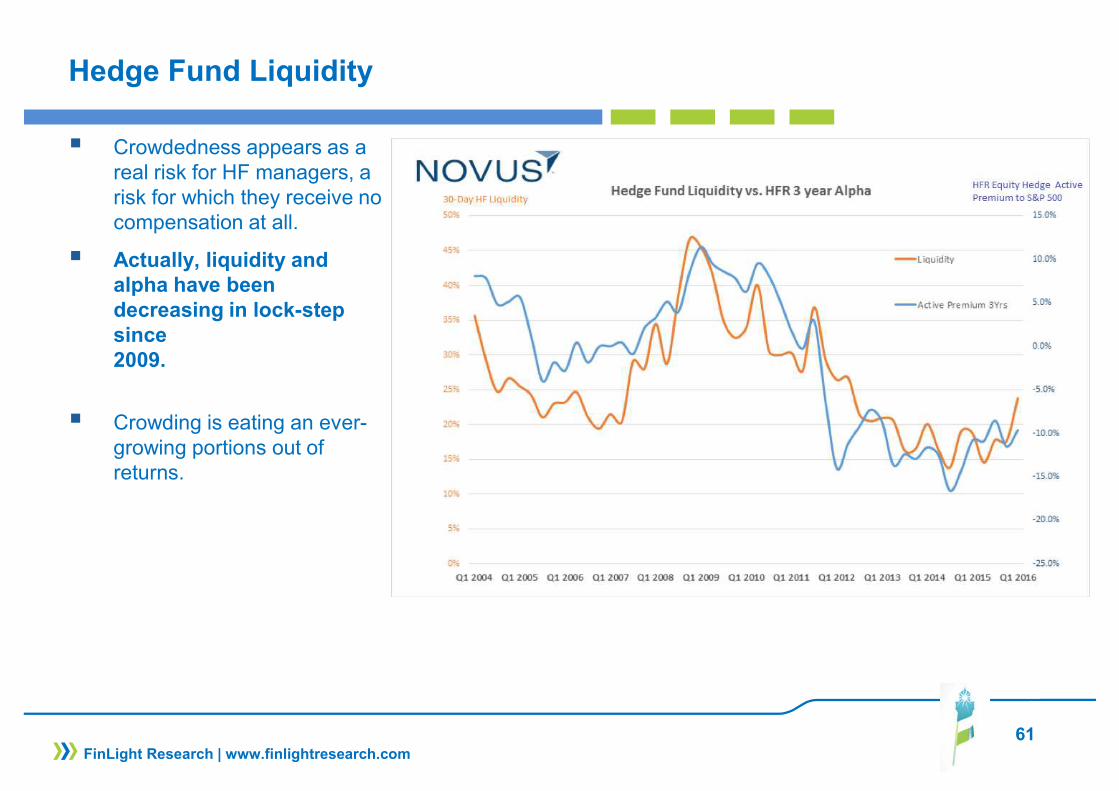
Hedge Fund Liquidity
� Using the universe of equity HF on their platform (~1200 managers), Novus calculate the “30-day Liquidity” metric: the portion of a given portfolio the manager can liquidate over 30 consecutive trading days, assuming that managers can sell 20% or less of the 90-day trailing average trading volume for each security without adversely affecting price
� According to this metric, in 2015, the average manager has been able to liquidate 92% of his equity holdings over 30 trading days without impacting prices.
� The “30-day Liquidity” metric has been stable over the last 6 years.
FinLight Research | www.finlightresearch.com
Source: Novus

60
Hedge Fund Liquidity
� However, calculating liquidity using strictly the “30-day Liquidity” metric may be misleading.
� This metric is based on each fund’s holdings, and doesn’t capture the concentration / crowdedness risk due to the increased tendency of HFs (with growing AUMs) to chase the same ideas. � Novus calculate another 30-Day Liquidity indicator based on an aggregated view of all the portfolios they manage on their platform.
� According to this measure, liquidity has receded to record lows. It stands at half its value in 2009!
FinLight Research | www.finlightresearch.com
Source: Novus
61
Hedge Fund Liquidity
� Crowdedness appears as a real risk for HF managers, a risk for which they receive no compensation at all.
� Actually, liquidity and alpha have been decreasing in lock-step since 2009.
� Crowding is eating an ever-growing portions out of returns.
FinLight Research | www.finlightresearch.com

Bottom Line: Global Asset Allocation
� Markets remain in “Goldilocks” situation. Data are bad enough to lower the chance of an imminent Fed rate hike, but not ugly enough to suggest a recession is imminent.
� The summer was so quiet. September is expected to be more stressful as there is quite a lot of uncertainties about growth and Central Banks meetings.
� The growing divergence between earnings and market prices is dangerous
� More signs seem to reflect secular stagnation: implied long-term dividend growth, payout rates for US equities, 5y-5y forward rates, 10y real rates, lack of growth in productivity…
� A key concern at this stage remains the lack of diversification as most safe assets appear too stretched
� Central banks continue their irrational game, with the hope to levitate financial asset prices long enough to allow fundamentals to catch up. The inevitable result in our opinion is that inflation will take off, and do so with a vengeance.
� We make minor adjustments to our asset allocation this month, except on stocks where we’ve moved from OW to Neutral..
� We summarize our views as follows �
62FinLight Research | www.finlightresearch.com

63
Disclaimer
FinLight Research | www.finlightresearch.com
This writing is for informational purposes only and does not constitute an
offer to sell, a solicitation to buy, or a recommendation regarding any
securities transaction, or as an offer to provide advisory or other services
by FinLight Research in any jurisdiction in which such offer, solicitation,
purchase or sale would be unlawful under the securities laws of such
jurisdiction. The information contained in this writing should not be
construed as financial or investment advice on any subject matter.
FinLight Research expressly disclaims all liability in respect to actions
taken based on any or all of the information on this writing.
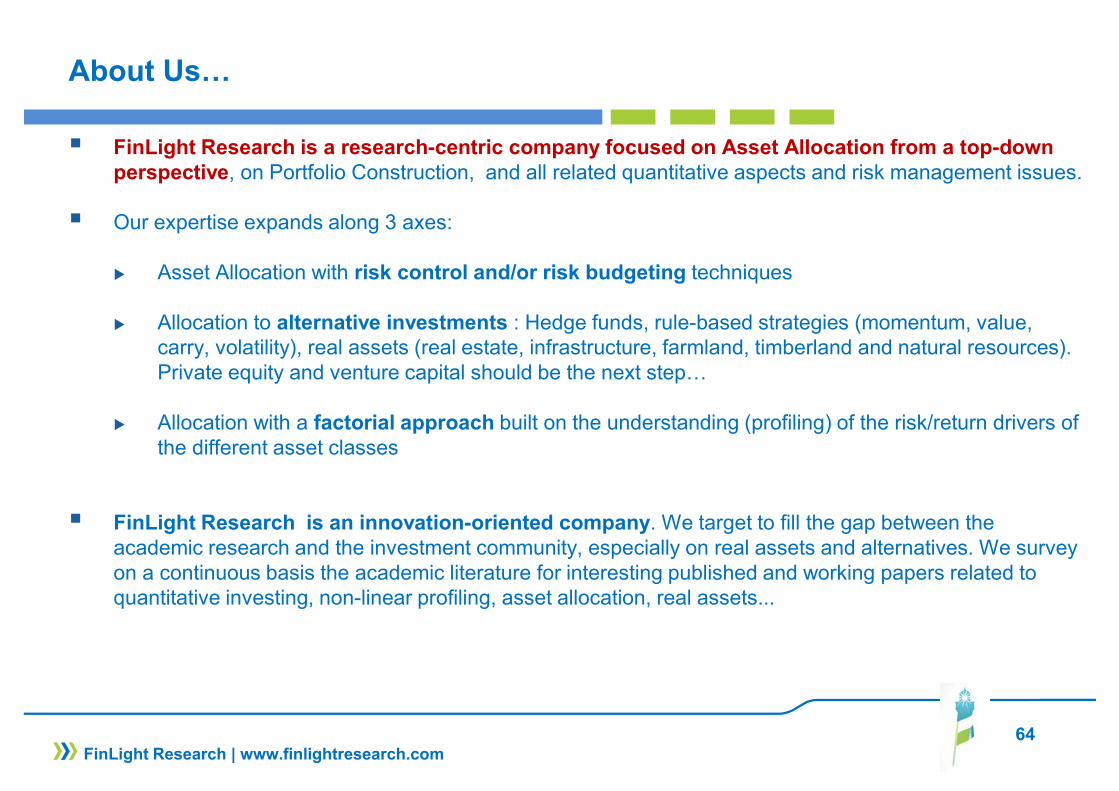
About Us…
� FinLight Research is a research-centric company focused on Asset Allocation from a top-down perspective, on Portfolio Construction, and all related quantitative aspects and risk management issues.
� Our expertise expands along 3 axes:
� Asset Allocation with risk control and/or risk budgeting techniques
� Allocation to alternative investments : Hedge funds, rule-based strategies (momentum, value, carry, volatility), real assets (real estate, infrastructure, farmland, timberland and natural resources). Private equity and venture capital should be the next step…
� Allocation with a factorial approach built on the understanding (profiling) of the risk/return drivers of the different asset classes
� FinLight Research is an innovation-oriented company. We target to fill the gap between the academic research and the investment community, especially on real assets and alternatives. We survey on a continuous basis the academic literature for interesting published and working papers related to quantitative investing, non-linear profiling, asset allocation, real assets...
64FinLight Research | www.finlightresearch.com
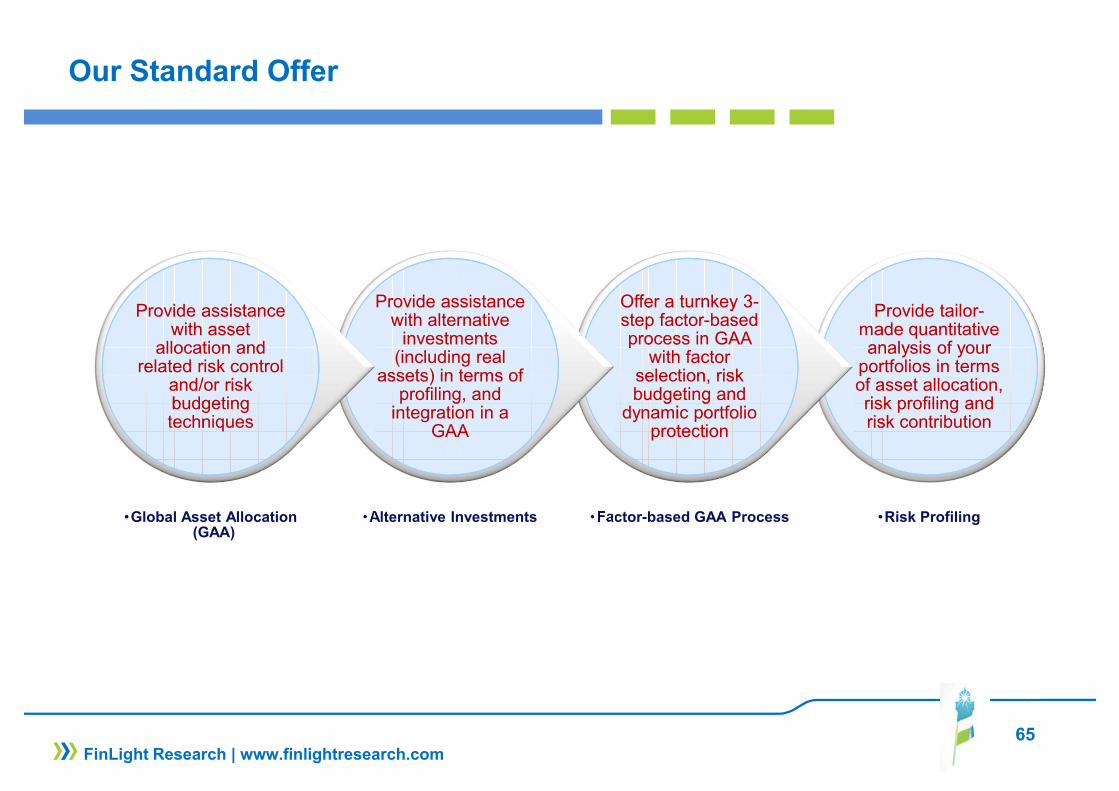
Our Standard Offer
Provide tailor-made quantitative analysis of your
portfolios in terms of asset allocation, risk profiling and risk contribution
Provide tailor-made quantitative analysis of your
portfolios in terms of asset allocation, risk profiling and risk contribution
•Risk Profiling
Offer a turnkey 3-step factor-based process in GAA
with factor selection, risk budgeting and
dynamic portfolio protection
Offer a turnkey 3-step factor-based process in GAA
with factor selection, risk budgeting and
dynamic portfolio protection
•Factor-based GAA Process
Provide assistance with alternative
investments (including real
assets) in terms of profiling, and
integration in a GAA
Provide assistance with alternative
investments (including real
assets) in terms of profiling, and
integration in a GAA
•Alternative Investments
Provide assistance with asset
allocation and related risk control
and/or risk budgeting techniques
Provide assistance with asset
allocation and related risk control
and/or risk budgeting techniques
•Global Asset Allocation (GAA)
65FinLight Research | www.finlightresearch.com