Finlight Research - Market Perspectives - May 2015
49
Market Perspectives May 2015 May. 8 th , 2015 www.finlightresearch.com "May Day! May Day!"
-
Upload
finlight-research -
Category
Economy & Finance
-
view
127 -
download
0
Transcript of Finlight Research - Market Perspectives - May 2015
Market Perspectives
May 2015
May. 8th, 2015
www.finlightresearch.com
"May Day! May Day!"
“There is accumulation; there is responsibility;
after these, there is unrest, great unrest.”– Julian Barnes – The Sense of an Ending
2
FinLight Research | www.finlightresearch.com

Executive Summary: Global Asset Allocation
� After 6 years of monetary pumping and low volatility, dark clouds are now
rising on risky assets
� In April, weak US GDP has raised questions about the timing of Fed rate hikes
� The market repriced monetary policy and anticipated the Fed would be more dovish
than previously expected. The dollar weakened, driving commodities to the upside.
� The market interpreted the April employment report as disappointing, but we think
data continue to support a first Fed hike in June or September and a strengthening
of the US dollar.
� Sentiment is also shifting on U.S. inflation expectations as fresh signs appear that
US inflation has bottomed, pushing long-term yields higher
� The coming rate hikes (probably in Jun. or Sep.) is not priced in yet. It will depress
all asset prices for at least part of next year, in our view
� The prospect of rising interest rates, a stronger US dollar and economic uncertainty ,
could also be a trigger for higher cross-asset volatility.
� Historically, the mixture of rising volatility and interest rates has had a bad
effect on equity prices
� At this stage, valuation levels in equity (coupled with a deteriorating US corporate
earnings growth and a slowing productivity) and credit are high enough to make us
cautious. But we stay Neutral equities as far as our hurdles are not breached.
� We still see a solid case for further dollar strength, lower oil prices and lower
commodities.
� Maintain UW government bonds and corporate credit overall (but with an intra-
asset class preference for IG vs HY, Eurozone vs US in HY, US vs Eurozone in IG),
OW US dollar and UW commodities (especially energy and precious metals)
� We summarize our views as follows �
3
FinLight Research | www.finlightresearch.com

MACRO VIEW
� The Good
� Last Employment Cost Index (ECI) wage release has shown the sharpest increase since 08’ and jobless claims collapsed to a low since 2000
� In contrast to the US, top-line results were strong in Europe with 73% of the companies beating sales estimates
� The ISM Manufacturing report was unchanged from prior month (51.5), but came in with an increasing New Orders (53.5)
� The Bad
� Q1 GDP was quite weak(annualized +0.2%), while YoY revenue growth contracted 4.1%� US Earnings picture is a bit negative with a 71% beat rate on earnings, and only 46% on
revenue. Both numbers are below average. � Durable goods as a whole were up, but "core" durable goods were down for the 6th month in a
row.� China PMI declines for the 4th consecutive month
� The Ugly
� Greece remains the wild card in Europe� Main systemic risk resides in China: China data depicts a weakening economic picture.
China’s economy is supported by approximately six trillion dollars of 'shadow debt', coupled with an unprecedented credit-fueled construction madness, and now a bubble-like stock market (Shanghai Shenzhen 300 index +17% in April, 37% YTD) � Systemic risk is around the corner
4
FinLight Research | www.finlightresearch.com

5
FinLight Research | www.finlightresearch.com
The Big Four Economic Indicators
� The overall picture had been one of a slow recovery, but there is no indication of a recession using the indicators monitored by the NBER.
� Personal Income (excluding Transfer Receipts) in March declined -0.27% in real terms. This was its first decline in 15 months. But it is still 3.09% up YoY.
� The Big Four average has decreased for the second month in a row.

6
FinLight Research | www.finlightresearch.com
GS – Global Leading Indicator (GLI)
� Nothing exiting yet on the GLI
front!
� After 2 months in contractionphase, we are now in ‘Recovery’,right on the border of ‘Expansion’
� 6 of the 10 underlying componentsof the GLI improved in April
� We’ve been thinking for a while
now that the acceleration we’ve
seen last year was quite modest
for a typical expansion phase.
7
FinLight Research | www.finlightresearch.com
Consumer Confidence
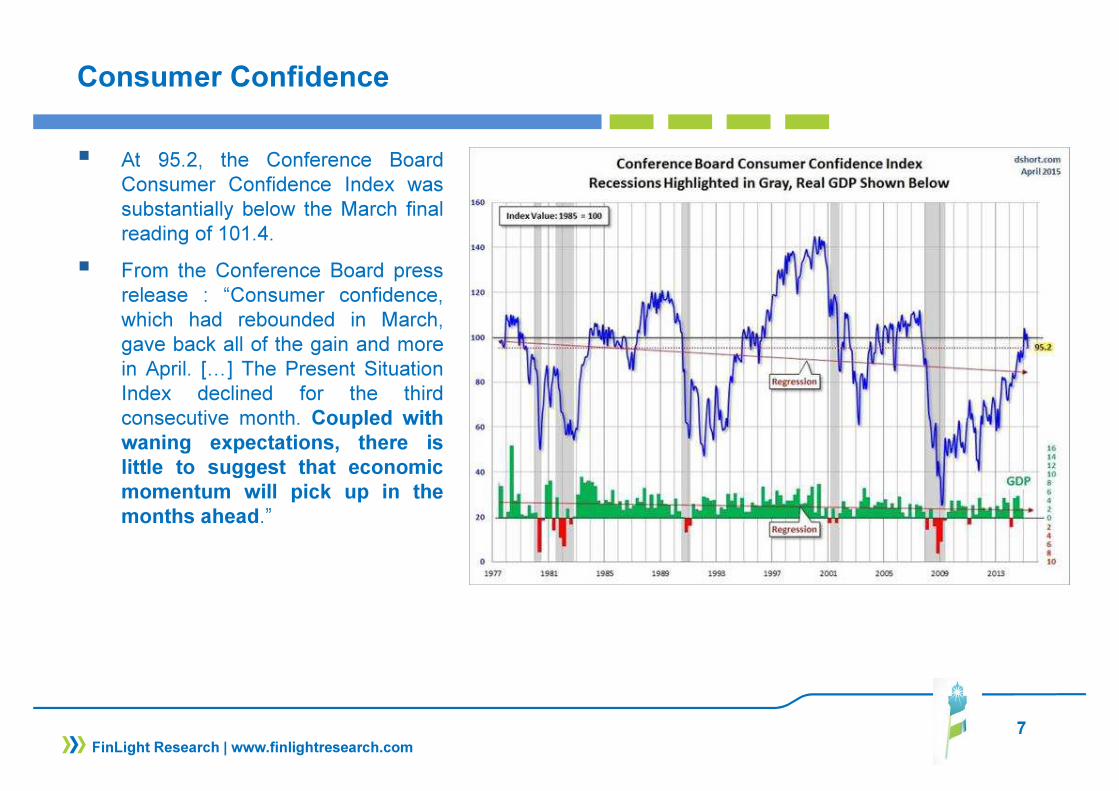
� At 95.2, the Conference BoardConsumer Confidence Index wassubstantially below the March finalreading of 101.4.
� From the Conference Board pressrelease : “Consumer confidence,which had rebounded in March,gave back all of the gain and morein April. […] The Present SituationIndex declined for the thirdconsecutive month. Coupled with
waning expectations, there is
little to suggest that economic
momentum will pick up in the
months ahead.”

8
FinLight Research | www.finlightresearch.com
US Economy
� The Economic Activity Surprise Index (EASI) has been negative this year, highlighting weaker USgrowth data
� But the index is now retracing toward zero, implying that data have been less disappointing
9
FinLight Research | www.finlightresearch.com
US GDP
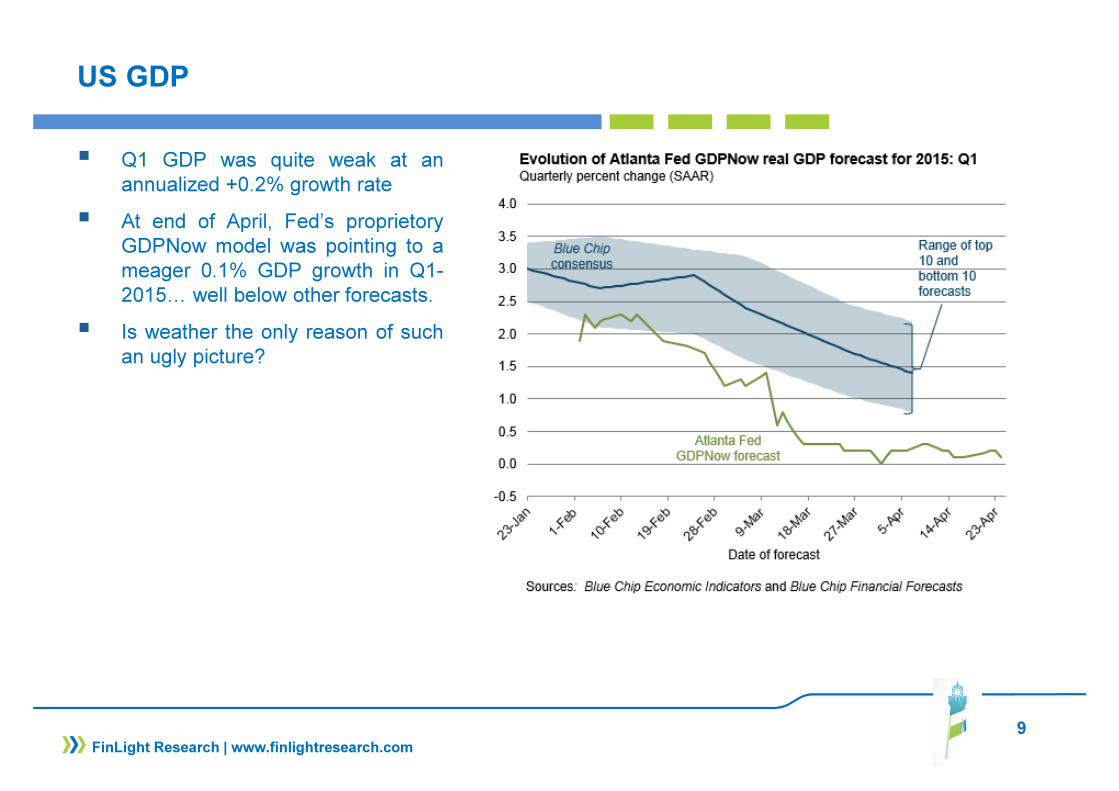
� Q1 GDP was quite weak at anannualized +0.2% growth rate
� At end of April, Fed’s proprietoryGDPNow model was pointing to ameager 0.1% GDP growth in Q1-2015… well below other forecasts.
� Is weather the only reason of suchan ugly picture?

10
FinLight Research | www.finlightresearch.com
US Economy – Unemployment & Inflation
� US unemployment rate declined further. Labor
market continues to approach full employment.
� The US unemployment rate is now 0.3% from
the Fed’s estimate of NAIRU (level ofunemployment below which inflation rises)… �
increase in Fed’s confidence on inflation returning
to trend
� We witness an unusual situation that combines
the weakest real GDP growth with the strongestgrowth in employment.
� We are convinced that:
� US economy (like global economy) is operatingnear its (new / lower) potential
� The drop in labor productivity growth and weakpotential GDP growth are both pointing to a“new normal” of lower equilibrium interest ratesand lower GDP growth.
� The declining supply of new labor shouldcreate inflation earlier than previously expectedand induce earlier rate hikes.

11
FinLight Research | www.finlightresearch.com
US Economy – Cost of Labor
� Three measures of hourly wages areshowing slightly different pictures of thelabor cost:
� The trend in average hourly earnings isslowing for production andnonsupervisory workers, but looksstable for all workers.
� The Employment Cost Index (ECI)
shows that wages are accelerating
to the upside.
� This is probably another sign of theshortage in labor supply

12
FinLight Research | www.finlightresearch.com
Student Loans
� According to the New York Fed’s quarterlyreport on household credit, 17% of all student-
loan borrowers were delinquent (at least 30days behind on a payment) at the end of 2014
� The official measure gives delinquency rate as ashare of all Americans with student debt, but45% of borrowers are not required to makepayments yet (still in the grace period or haspermission to suspend payments).
� The real picture gets gloomier, whenexcluding borrowers not in repayment. Newresearch from the Federal Reserve Bank of St.Louis shows that 31.5% of those who are now
having to pay down their student debt are at
least a month behind on their payments
13
FinLight Research | www.finlightresearch.com
Eurozone Economy
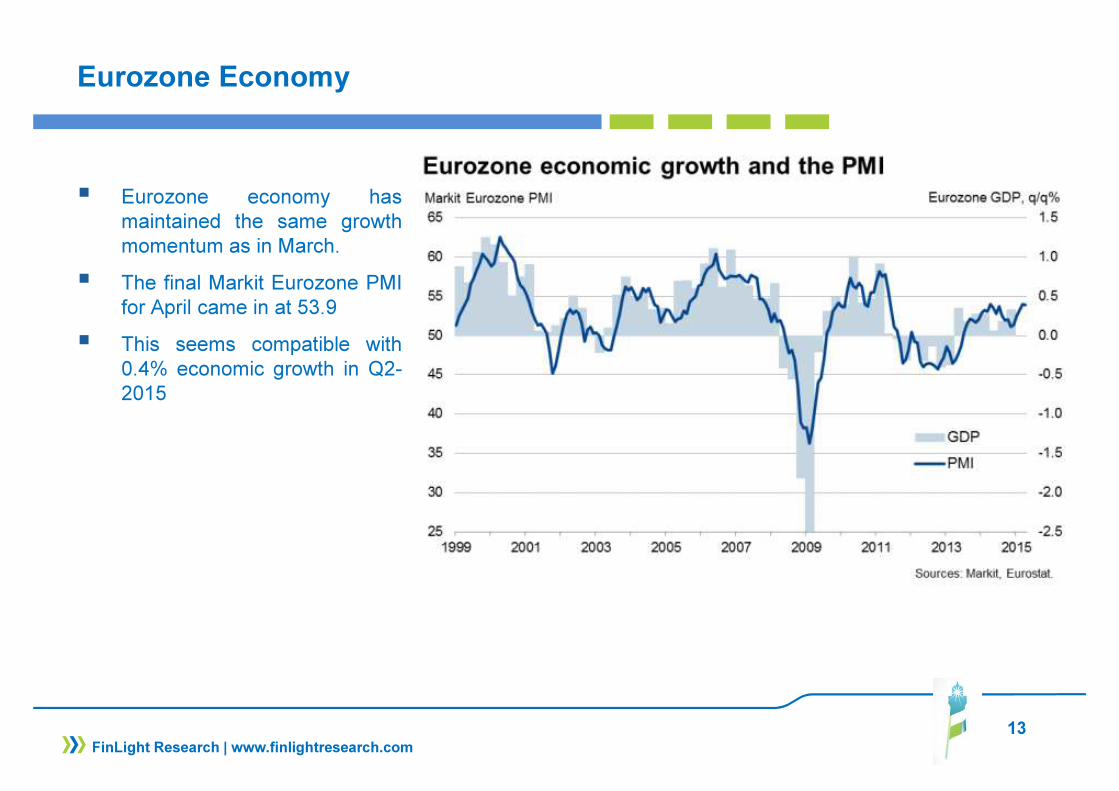
� Eurozone economy hasmaintained the same growthmomentum as in March.
� The final Markit Eurozone PMIfor April came in at 53.9
� This seems compatible with0.4% economic growth in Q2-2015

14
FinLight Research | www.finlightresearch.com
Chinese Economy
� China data shows a weakening
economic picture
� The HSBC final PMI fell to 48.9(from 49.6 in March). This is itsfastest drop over 12 months
� China factory activity is sluggish,making more stimulus measures bythe central government inevitable(especially now that housing andfood prices have cooled)
15
FinLight Research | www.finlightresearch.com
EQUITY
� Is the market at an inflection point after 6 years of (almost) straight rally? The answer seems
imminent.
� The medium-term uptrend in stocks remains technically intact. The S&P500 is still trying to make new highs. But the market seems trapped in a sideways trading range, probably awaiting a catalyst (earnings? FOMC?) to breakout one way or another.
� We still believe that equity markets are living on borrowed time because…� Earnings season hasn't provided the catalyst needed for the breakout to the upside� No earnings growth is expected in the first half of 2015� Valuations are well above historical norms, especially when we take into account the slower
revenue growth and the starting wage pressures � Stocks are entering a seasonally unfavorable period� The coming rate hikes (probably in Jun. or Sep.) is not priced in yet. It will depress all asset
prices for at least part of next year, in our view� Some of the high beta parts of the market (Russell 2000, Nasdaq) have started to show
exhaustion
� Recent data shows more evidence of lower productivity, lower potential GDP growth and
higher inflation risk. � This is a bad scenario for stocks

16
FinLight Research | www.finlightresearch.com
EQUITY
� Bottom line :
� Nothing new compared to our previous report. We remain Neutral equities as long as they stay trapped in their sideways trading range
� We may revise our view to OW after a clean break of the 2070-2125 range to the upside on the S&P500, and to UW below the trend since Nov. ‘12 lows
� We think it is wise to incrementally "de-risk" your portfolios by focusing on higher quality / more defensive / more favorably priced companies
� We remain long-term OW on Japan (always on an FX hedged basis) as we see further upside for Japanese stocks from the improvement in macro data and corporate earnings momentum. Tactically, we stay Neutral on Japan waiting for an imminent consolidation.
� We remain Neutral on Europe vs. US despite the massive ECB’s QE. According to the 12 month forward P/E, Europe is now trading at 15 year highs, relative to the US
� We switch to OW EM stocks (ex-China) given the improvement in relative growth forecasts in EM vs DM and the strong momentum in place. We prefer to keep away from Chinese market.
� We remain UW in US small caps vs large caps.
17
FinLight Research | www.finlightresearch.com
Earnings
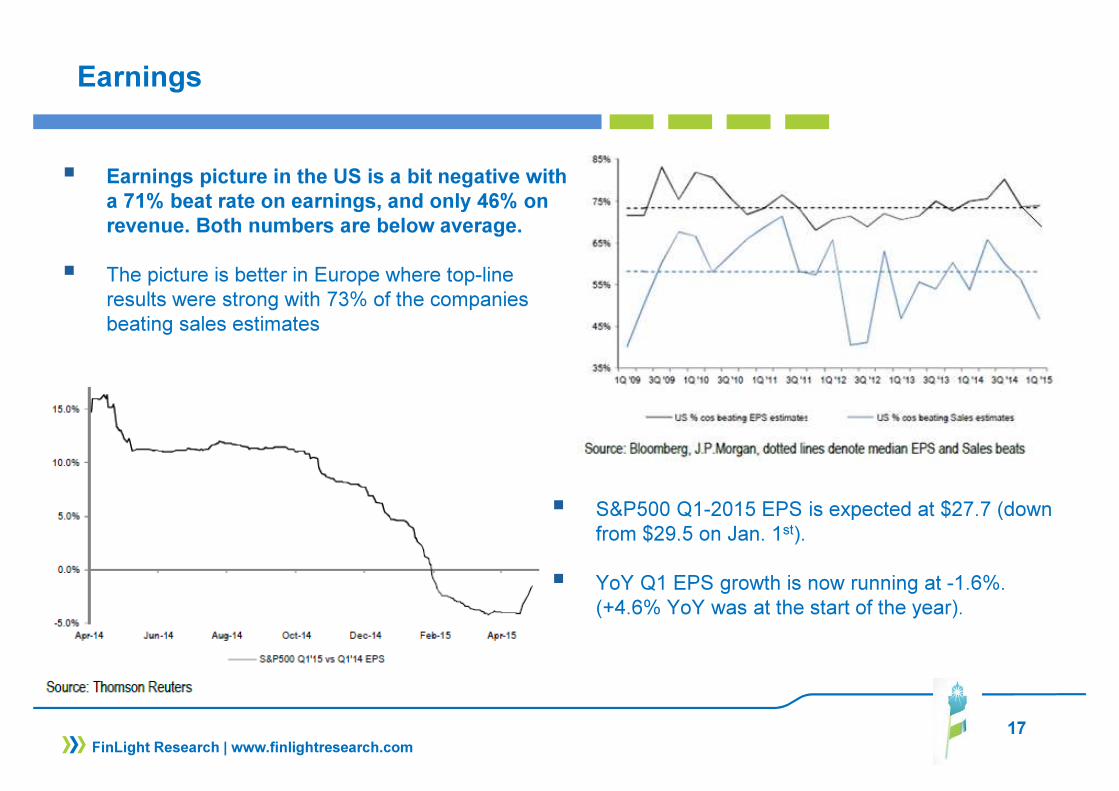
� S&P500 Q1-2015 EPS is expected at $27.7 (down from $29.5 on Jan. 1st).
� YoY Q1 EPS growth is now running at -1.6%. (+4.6% YoY was at the start of the year).
� Earnings picture in the US is a bit negative with
a 71% beat rate on earnings, and only 46% on
revenue. Both numbers are below average.
� The picture is better in Europe where top-line results were strong with 73% of the companies beating sales estimates
18
FinLight Research | www.finlightresearch.com
Earnings
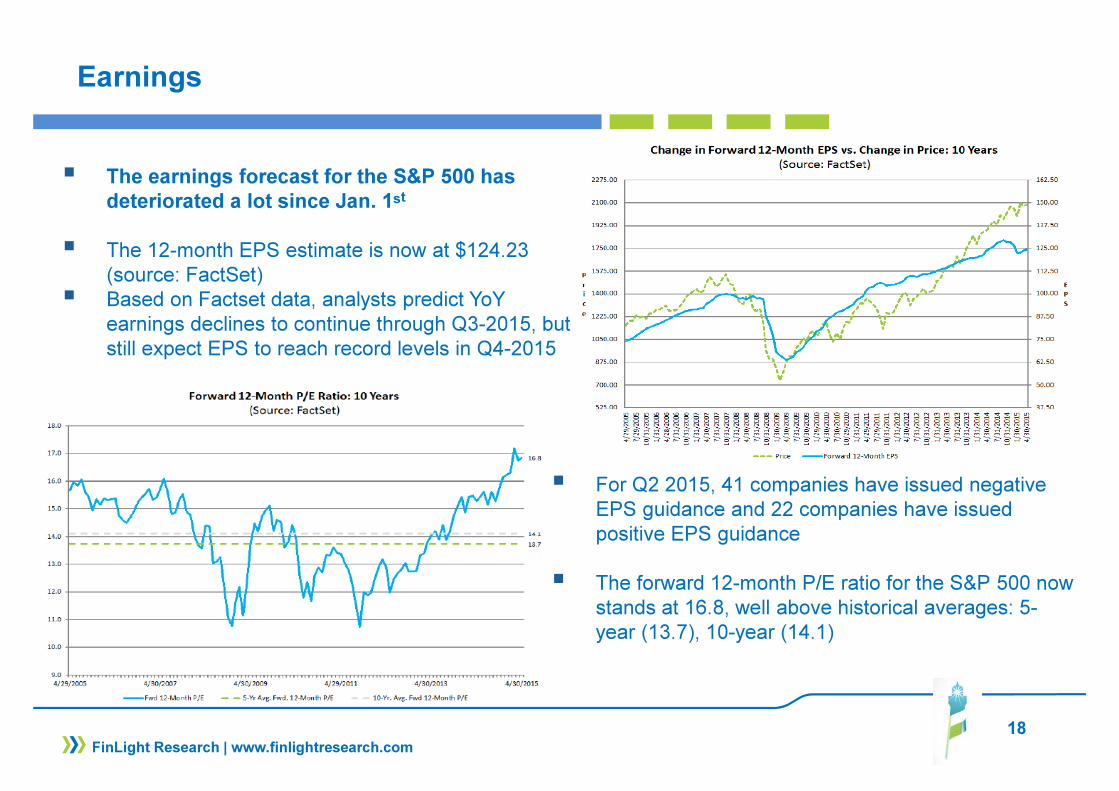
� For Q2 2015, 41 companies have issued negative EPS guidance and 22 companies have issued positive EPS guidance
� The forward 12-month P/E ratio for the S&P 500 now stands at 16.8, well above historical averages: 5-year (13.7), 10-year (14.1)
� The earnings forecast for the S&P 500 has
deteriorated a lot since Jan. 1st
� The 12-month EPS estimate is now at $124.23(source: FactSet)
� Based on Factset data, analysts predict YoYearnings declines to continue through Q3-2015, but still expect EPS to reach record levels in Q4-2015
19
FinLight Research | www.finlightresearch.com
US Stocks vs Govies
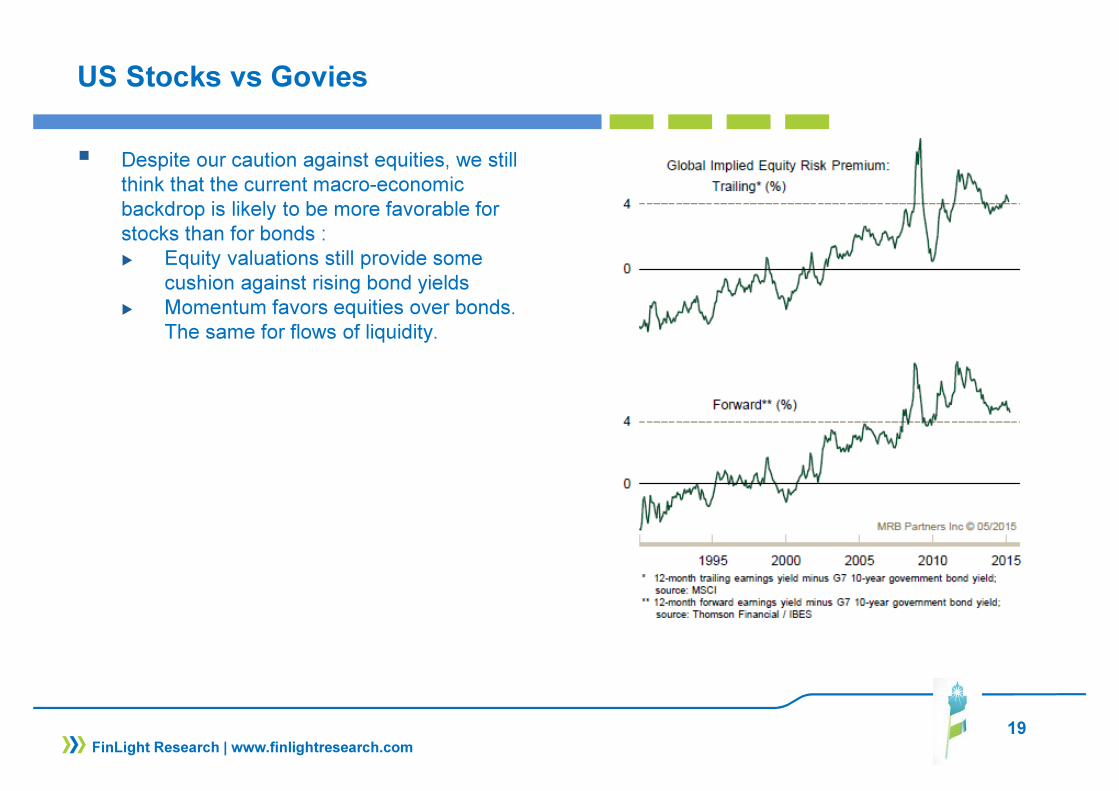
� Despite our caution against equities, we still think that the current macro-economic backdrop is likely to be more favorable for stocks than for bonds :� Equity valuations still provide some
cushion against rising bond yields� Momentum favors equities over bonds.
The same for flows of liquidity.

20
FinLight Research | www.finlightresearch.com
S&P500 – a Long-Term Perspective
� The Q Ratio (or Tobin’s Ratio) is the total market price divided by the replacement cost of all its companies
� According to this indicator, market is heading deeper in
overvaluation territories

21
FinLight Research | www.finlightresearch.com
S&P500 – A Short-Term View
� S&P500 chart should be monitored closely… Some key technical hurdles
should be cleared before we can hope
seeing the S&P substantially higher.
� The rising wedge pattern we’ve been watching since Nov. ’14 should reach a resolution shortly (2-3 weeks?). Things will break one way or another.
� 2 levels to keep in mind: 2125 on the
upside and 2070 on the downside.
� Without a clean breakout to the upside,
selling pressure will be back.

22
FinLight Research | www.finlightresearch.com
Chinese Stocks
� “When Your Banana-Guy Starts Trading Stocks, You Know It's Over” (Source: Zerohedge)
� 4.13 million new A-Share accounts were opened during
just the last week of April!
Source: Zerohedge

23
FinLight Research | www.finlightresearch.com
Chinese Stocks
� The picture is even worse when compared to the Nasdaq during the internet bubble

24
FinLight Research | www.finlightresearch.com
Trading Model – S&P500
� As of May 8th, our prop. Short-Term trading model is modestly short on the S&P500 (2116.1).
� The model went massively short on Apr. 15th (2106.63), reversed its position on May 6th (2080.15) and went short again on May 8th (2116.1)
� The model targets 2083, 2062 and 2041 on the downside

25
FIXED INCOME & CREDIT
� Sentiment is shifting on U.S. inflation expectations with new signs showing that US inflation has bottomed.
� The induced surge in UST yields was reinforced by the last ECI wage release (strongest since 2008) and the favorable jobless claims report (at lowest level of the past 15 years)
� German inflation numbers are also coming in hotter than expected. Evidence of stabilizing inflation in Europe triggered an impressive sell-off in Bunds (by magnitude and duration). It seems that German yields set a low in April.
� The market interpreted the April employment report as disappointing (implying a curve steepening in the US), but we think data continue to support a first Fed hike in June or September. We continue to
bet on a significant flattening of the US yield curve and stay tactically short 3-year Treasuries
� We still look for the bear market on USTs to resume.
� We’ve been Neutral UST since end of Nov. ’14. US long-term rates are stuck in a range. 10-year yield is poised to trade 1.85-2.05% (perhaps 1.75-2.25%) until we get closer to Fed hikes. Our medium-term outlook would stay neutral as far as the 10y UST yield remains below 2.25.
� We interpret the last sell-off in German Bund as the reversal we’ve been awaiting. We move UW on
German Bund (within the sovereign FI asset class) and remain so as long as the 10-year yield
stays above the 0.45 – 0.50 area.
� We will switch to Neutral again as the 10-year yield reaches our short-term target around 0.75 – 0.90.Bund yields will rise hardly further given the intensive buying by the ECB
FinLight Research | www.finlightresearch.com
26
FIXED INCOME & CREDIT
� The search for yield within the fixed income complex remains strong� It is obvious in such a macro economic environment that yield-starved investors should be more
selective and look for yield by taking on more credit risk, rather than duration risk.� Lower rated new-issue volume has been increasing since the financial crisis. That should drive the
default rate higher and HY spreads wider.
� We remain UW on corporate credit, due to valuation, to rising corporate leverage (specially in the US), to rising volatility, to position within the credit cycle and given the weak total return forecast
� Within the credit pocket, and over the very short-term, we stick with our preference for Eurozone HY
corps vs US HY corps, because of the ECB massive QE, more resilient macro in the Eurozone, and the still elevated beta of US credit spreads to oil prices.
� However, we remain UW on Eurozone vs US IG. Our last month switch from OW to UW has proved to be a wise choice given the move we’ve seen on Govies
� We still prefer IG over HY on a risk-adjusted basis as we expect higher volatility on spreads
� Bottom line : UW Govies, UW Eurozone vs. US Govies, Long flatteners on the US yield curve, UW credit, OW Eurozone vs US HY credit, UW Eurozone vs US IG credit, Neutral TIPS and OW HICP Inflation, UW High Yield vs High Grade, Neutral on EM corporates
FinLight Research | www.finlightresearch.com

27
Eurozone Govies – 10y Bund
� April move on the 10-year Germanyields was impressive… Abloodbath among the eternal longs!
� Is that the true reversal we’ve beenwaiting for, or just a correctivepullback before the downtrendresumes?
� At this stage, we favor alternative 1and move UW on German Bund
(within the sovereign FI assetclass)
� We expect the reversal to persist
and remain UW on German Bund
as long as we stay above the 0.45(the downtrend from Jan ‘14) –0.50 area.
� We target 0.75-0.90. Bund yieldswill rise hardly further given thebuying by the ECB.
FinLight Research | www.finlightresearch.com

28
US Govies – 10y UST
� Sentiment is shifting on U.S.inflation expectations with newsigns showing that US inflation hasbottomed.
� We’ve been Neutral UST since endof Nov. ’14, waiting for the 10-yearyield to break out of its 1.75-2.25%range before changing our view.
� Our medium-term outlook would
stay neutral as far as the 10y
UST yield remains below 2.25
� 10y-UST yield is now very close tothe 2.25 threshold, struggling tobreak the previous March high at2.257.
� Holding above the 200d-MA at
2.186% is needed to feel
comfortable with a bearish view
on USTs.
FinLight Research | www.finlightresearch.com

29
Europe vs US Credit
� In April, in contrast to IG where Europe continues to trade in line with US, Europe underperformed
in HY: CDX.HY tightened by 5bp while iTraxx Xover widened by 13bp. � The remaining spread gap (~50bp, half its level in mid March) is primarily explainable by single name
risk.� The recent underperformance of iTraxx Xover is mainly attributable to one or two names: Norske
Skogindustrier and Abengoa.
FinLight Research | www.finlightresearch.com

30
Credit Trends
� The rolling 12-month upgrade to downgrade ratio by issuer increased slightly to 1.00 (and 1.04 in par amount). We should keep an eye on it.
� Lower rated new-issue volume has been increasing since the financial crisis. It should drive the default rate higher.
FinLight Research | www.finlightresearch.com

31
EXCHANGE RATES
� EUR/USD failed to clear 1.1390, which needs to be cleared to eliminate the persistent risk of a renewed downtrend
� The sharp reversal we’ve seen on EUR-USD was mainly driven by Bunds.� From a strategic perspective, We still see a solid case for further dollar strength, based on monetary
policy divergence between the US and other DMs.� Historically, USD cycles have been persistent, lasting 5-6 years in the appreciation phase. We thus see
further medium term USD gains against the major crosses (especially EUR and JPY) and expect a cyclical low in EUR/USD somewhere in 2016 (with the ECB tapering)
� We made however some adjustments to our tactical positioning on USD:� On the DXY index, our 100 hurdle was not reached and we decided to switch from a bullish to a
more neutral stance as the 96 level was broken to the downside.
� On EUR-USD, we decide to move Neutral around 1.12 and wait to see how the pivot behaves near the 1.1296. EUR/USD needs to clear 1.1390 to erase the downtrend risk. We need to break below 1.10 before switching to UW again.
� USD-JPY was unable to break the 122.04 highs, but held nicely against its 100-days MA. We remain OW
USD-JPY as far as the pivot stays above 1.18 and below the 124-125 area
FinLight Research | www.finlightresearch.com

32
US Dollar Index - DXY
� From our previous report: “The spot has finally broken above our first target of 96.00[…] Our ultimate target remains at 102.50. To feel more comfortable with our bullish view, the 100 threshold should
be meaningfully breached to the
upside”.
� Unfortunately, the 100 threshold was not reached and we’ve
switched from a bullish to a
more neutral stance as the 96
level was broken to the
downside.
� The DXY has even broken its uptrend from the August low.
� We need to see the index
reemerging above this trendline
(~95.15) and the 96.25 level
before moving to OW again.
FinLight Research | www.finlightresearch.com

33
EUR-USD
� In our previous report, we said : “We remain UW EUR-USD as long as the pivot stays below 1.11 - 1.13 and move Neutral above to play the correction towards 1.17-1.18.”
� In April, EUR-USD did break below our target of 1.0690, but was unable to reach our ultimate target at 1.0250-0.98
� We decide to move Neutral around
1.12 and wait to see how the pivot behaves near the 1.1296 level
� We need to break below 1.10 before switching to UW again.
FinLight Research | www.finlightresearch.com

34
EUR-USD
� From a longer term (techs) perspective, 1.1237 looks to be the level to be watched.
� Given the very low level of monthly oscillators, a Neutral stance
seems more appropriate at this
stage. The recent lows at 1.0495 could be a big turning point.
� Our medium-term view remains
biased towards a strengthening
of USD as far as the 1.16 level
(given by the downtrend from
Jul. ‘14) is preserved
FinLight Research | www.finlightresearch.com
35
COMMODITY
� Despite the rally seen in April (mainly driven by a weaker US dollar and expectation of morestimulus in China), the trend remains bearish. There is no indication of a bottom formation yet.
� Global commodity prices could stay suppressed as less demand from China leads to greateroversupply
� We remain UW commodities. We continue, however, to like owning the GSCI index, and think
that commodities hold value as cross-asset portfolio diversifiers.
Bottom Line :
� Base Metals: Base metals prices were up over 7% in April, without any fundamental justification(except Copper for which we’ve seen a modest increase in Chinese demand). We remain Neutral on
base metals, but do not like holding Copper as it appears highly overvalued relative to the dollarand the global growth. We are also UW aluminum and zinc as the recent price increases have runahead of fundamentals
� Agri: Excess supply and substantial stocks (built since the 2012 drought) are weighing on prices.Absent a severe weather shock, it is unlikely that agriculture prices will spike this year. We stillanticipate they will revert to 2009 level, over the medium-term. Nevertheless, we decided to
tactically switch from UW to Neutral because of the bearish bets on agricultural commoditiesaccumulated by managed money. Short positions are near all-time record highs, particularly in cornand wheat. A crowded deal we don’t like…
FinLight Research | www.finlightresearch.com

36
COMMODITY
� Energy: In April, and according to our trading rule (please see our previous monthly report), we
switched to Neutral at 54 on WTI.
� We will move to OW if the WTI breaks above 63, and to UW again if it trades below 56.5 (to targetMarch lows).
� We still think it is too early to expect major upside for the price of oil as the US is sinking deeper
in a glut of excess oil.
� Precious Metals: We change nothing to our view on precious metals. The stimulus provided by the ECB & BoJ is already factored in gold prices. Precious metals are vulnerable to higher US real
yields and stronger dollar
� We think that as long as gold is trading below 1225, it could be heading back down to test the March low� We remain UW above 1150-1170 band. We will move Neutral below 1150 and switch
progressively to OW (accumulate) as the spot slides down towards 1000-980, which is likely the
final leg down. Only a clean break above 1225 may push us to reconsider our view.
� Our first target on silver stands at 14.70. We still think that Silver (like gold) is probably ready for its final leg down towards 12.50. At current levels, we are UW. we will switch progressively to OW (accumulate) as the spot breaks the first material resistance around 14.70 and slides down towards 12.50
� We may reconsider our UW position if the Silver breaks above 16.7-17.
FinLight Research | www.finlightresearch.com

37
S&P GSCI Index
� Commodity indices picked up in April
� Commodity prices were boosted by:� A weaker dollar and the rebound in oil prices� Market expectation of more stimulus measures by the central government in China given the
disappointing factory activity. Base metals were driven to the upside without any fundamentalsupport.
FinLight Research | www.finlightresearch.com
Source: Bloomberg

38
Crude Oil – Tech. Perspective
� In our previous report, we saidabout WTI “There are some LTsignals of a base forming. […] Aweekly close above the 53-54area will oblige us to switch toNeutral (if not OW)”
� We indeed switched to Neutral
at 54.
� Just below 63 (38.2% of thedecline since Sep ‘14), the spotshowed some signs of exhaustion,and turned south.
� The next important support towatch stands at 56.5. The spotneeds to break below it in order toreintegrate its previous range.
� We will move to OW if the WTIbreaks above 63, and to UWagain if it trades below 56.5 (totarget March lows)
FinLight Research | www.finlightresearch.com

39
Gold
� Gold is still testing importantsupport at 1,175. A break belowwill open the door to 1165 andthen to March lows (1142).
� We change nothing to ourstrategy: We remain UW Gold. Wemove Neutral below 1150 andswitch progressively to OW(accumulate) as the spot slides
down towards 1000-980, which
is likely the final leg down.
� Only a clean break above 1225may push us to reconsider ourview.
� We think that as long as gold is
trading below 1225, it could be
heading back down to test the
March low.
FinLight Research | www.finlightresearch.com
40
Gold Bugs
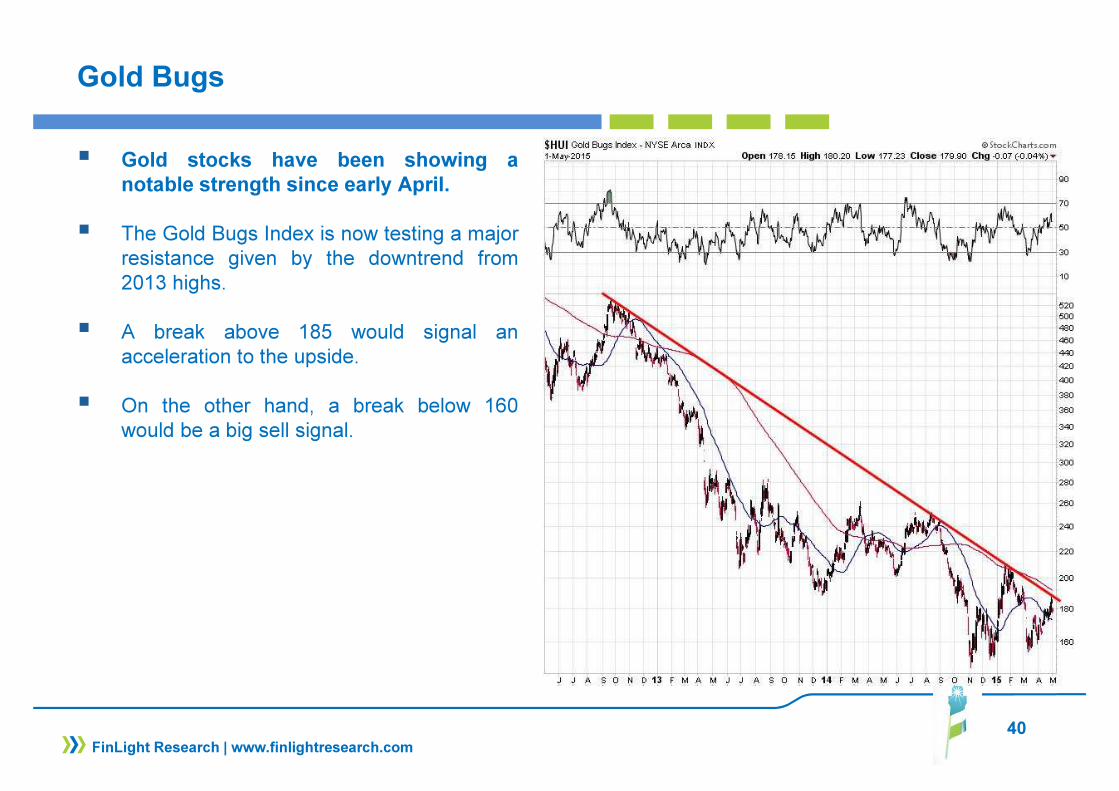
� Gold stocks have been showing a
notable strength since early April.
� The Gold Bugs Index is now testing a majorresistance given by the downtrend from2013 highs.
� A break above 185 would signal anacceleration to the upside.
� On the other hand, a break below 160would be a big sell signal.
FinLight Research | www.finlightresearch.com
41
Silver
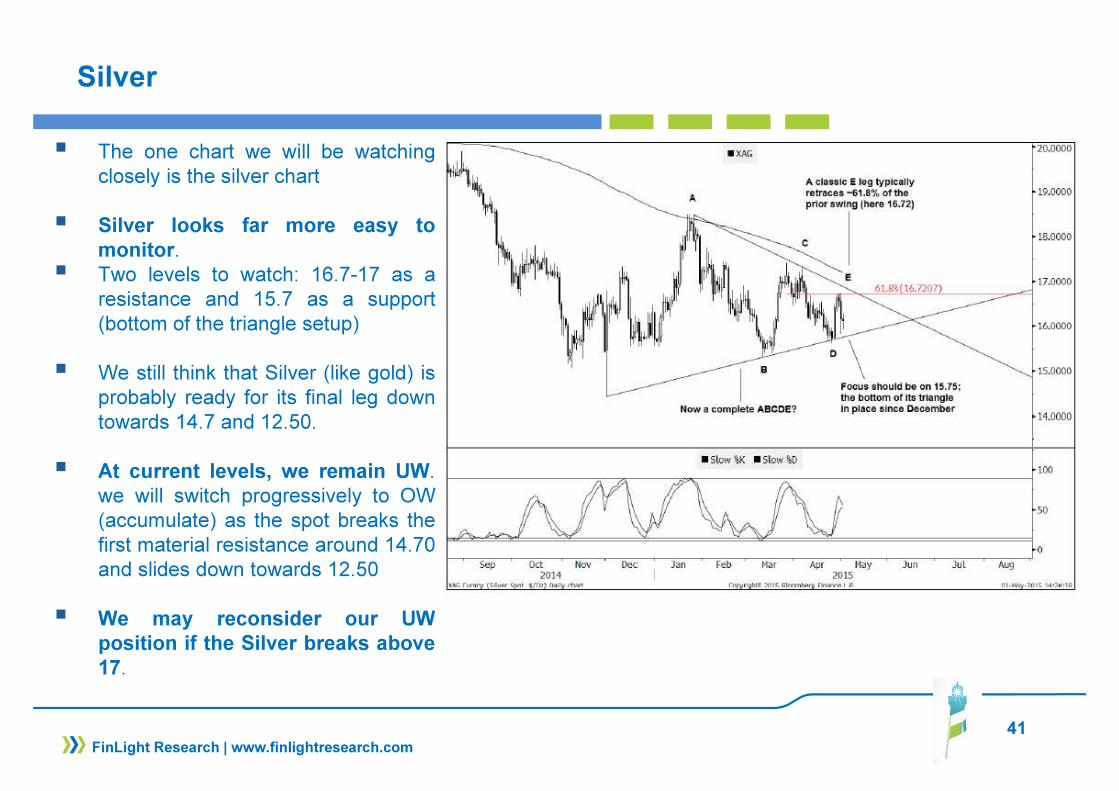
� The one chart we will be watchingclosely is the silver chart
� Silver looks far more easy to
monitor.� Two levels to watch: 16.7-17 as a
resistance and 15.7 as a support(bottom of the triangle setup)
� We still think that Silver (like gold) isprobably ready for its final leg downtowards 14.7 and 12.50.
� At current levels, we remain UW.we will switch progressively to OW(accumulate) as the spot breaks thefirst material resistance around 14.70and slides down towards 12.50
� We may reconsider our UW
position if the Silver breaks above
17.
FinLight Research | www.finlightresearch.com
42
FinLight Research | www.finlightresearch.com
Silver
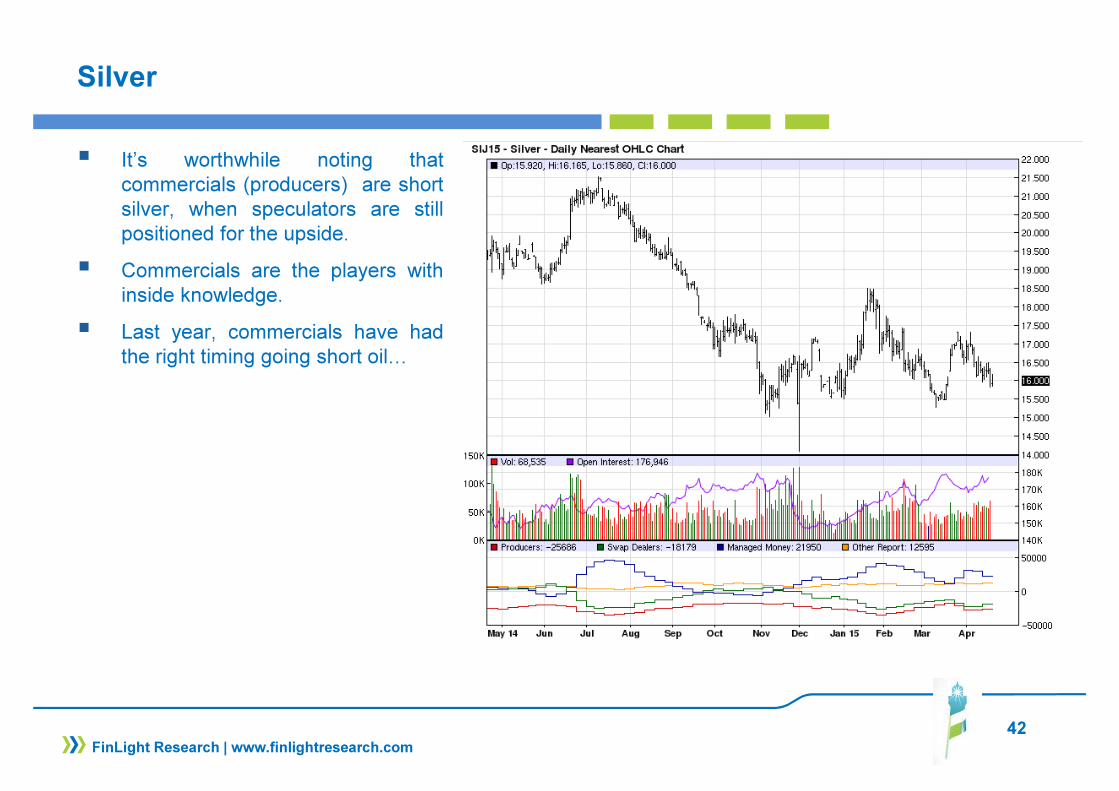
� It’s worthwhile noting thatcommercials (producers) are shortsilver, when speculators are stillpositioned for the upside.
� Commercials are the players withinside knowledge.
� Last year, commercials have hadthe right timing going short oil…

43
ALTERNATIVE STRATEGIES
� Hedge funds ended April on a positive note (+0.83% MTD and +3.07% YTD on the HFRI Weighted Composite Index). Performance was led by the HFRI Emerging Markets Index (+7% MoM thanks to China among others)
� Best performers were Equity Hedge (+2.0% MTD) thanks to energy. � April was a bad month for Trend-following CTAs (-2.2%), Global Macro ( -1.2%) and Equity Market-
Neutral (-0.5%)
� In April, the market repriced monetary policy and anticipated the Fed would be more dovish that previously expected. Thus, the dollar weakened, driving commodities up.
� CTAs suffered from this trend reversals, especially on FX, fixed income and Commos.� Global macro funds were negative as gains posted on short European duration and long commodities
were more than offset by losses on European equities and short EUR positions.
� We stick to our preference for risk diversifiers (pure alpha generation strategies) over return enhancers.
� We change nothing to our strategy selection. We maintain our previous OW positioning on:� Equity Market Neutrals both for their “intelligent” beta and their alpha contribution. � CTA’s and Global Macro as a diversifier and tail hedge. � Vol. Arb strategy and prefer funds that trade volatility globally (all assets / all regions). This is our
way to position for a higher volatility regime.
FinLight Research | www.finlightresearch.com

44
Global Macro Funds
� In April, MF funds suffered from the sharpdrop in the US dollar and the bad performanceof Eurozone equities.
� Fortunately, these losses were offset by profitsmade in:� FI as MF funds were globally short
duration in European Govies� Through long positioning in commodities
(especially industrial metals)
FinLight Research | www.finlightresearch.com

45
CTAs
� In April, trend-following strategies (with their popular trades: short EUR vs USD, short energy, longGovies) suffered from trend reversals in fixed income, FX and commodity markets.
� On the positive side, CTAs made money on equity longs.
� Even the biggest names were hurt hard: Winton post its worst month since 2008 (-4%) and AQR’sManaged Futures Managed Futures Fund was down -3.21%,
� Some short-term CTAs had proved to be more resilient as they managed to adjust rapidly theirpositioning to trend reversals (in FI, FX and Commos).
� Most CTAs are now reversing their positioning on rates, going short FI, and reducing their shorts onenergy.
FinLight Research | www.finlightresearch.com
Source: Attain Capital

Bottom Line: Global Asset Allocation
� After 6 years of monetary pumping and low volatility, dark clouds are now
rising on risky assets
� In April, weak US GDP has raised questions about the timing of Fed rate hikes
� The market repriced monetary policy and anticipated the Fed would be more dovish
than previously expected. The dollar weakened, driving commodities to the upside.
� The market interpreted the April employment report as disappointing, but we think
data continue to support a first Fed hike in June or September and a strengthening
of the US dollar.
� Sentiment is also shifting on U.S. inflation expectations as fresh signs appear that
US inflation has bottomed, pushing long-term yields higher
� The coming rate hikes (probably in Jun. or Sep.) is not priced in yet. It will depress
all asset prices for at least part of next year, in our view
� The prospect of rising interest rates, a stronger US dollar and economic uncertainty ,
could also be a trigger for higher cross-asset volatility.
� Historically, the mixture of rising volatility and interest rates has had a bad
effect on equity prices
� At this stage, valuation levels in equity (coupled with a deteriorating US corporate
earnings growth and a slowing productivity) and credit are high enough to make us
cautious. But we stay Neutral equities as far as our hurdles are not breached.
� We still see a solid case for further dollar strength, lower oil prices and lower
commodities.
� Maintain UW government bonds and corporate credit overall (but with an intra-
asset class preference for IG vs HY, Eurozone vs US in HY, US vs Eurozone in IG),
OW US dollar and UW commodities (especially energy and precious metals)
� We summarize our views as follows �
46
FinLight Research | www.finlightresearch.com

47
Disclaimer
FinLight Research | www.finlightresearch.com
This writing is for informational purposes only and does not constitute an
offer to sell, a solicitation to buy, or a recommendation regarding any
securities transaction, or as an offer to provide advisory or other services
by FinLight Research in any jurisdiction in which such offer, solicitation,
purchase or sale would be unlawful under the securities laws of such
jurisdiction. The information contained in this writing should not be
construed as financial or investment advice on any subject matter.
FinLight Research expressly disclaims all liability in respect to actions
taken based on any or all of the information on this writing.

About Us…
� FinLight Research is a research-centric company focused on Asset Allocation from a top-down
perspective, on Portfolio Construction, and all related quantitative aspects and risk management issues.
� Our expertise expands along 3 axes:
� Asset Allocation with risk control and/or risk budgeting techniques
� Allocation to alternative investments : Hedge funds, rule-based strategies (momentum, value, carry, volatility), real assets (real estate, infrastructure, farmland, timberland and natural resources). Private equity and venture capital should be the next step…
� Allocation with a factorial approach built on the understanding (profiling) of the risk/return drivers of the different asset classes
� FinLight Research is an innovation-oriented company. We target to fill the gap between the academic research and the investment community, especially on real assets and alternatives. We survey on a continuous basis the academic literature for interesting published and working papers related to quantitative investing, non-linear profiling, asset allocation, real assets...
48
FinLight Research | www.finlightresearch.com

Our Standard Offer
Provide tailor-made quantitative analysis of your
portfolios in terms of asset allocation, risk profiling and risk contribution
Provide tailor-made quantitative analysis of your
portfolios in terms of asset allocation, risk profiling and risk contribution
•Risk Profiling
Offer a turnkey 3-step factor-based process in GAA
with factor selection, risk budgeting and
dynamic portfolio protection
Offer a turnkey 3-step factor-based process in GAA
with factor selection, risk budgeting and
dynamic portfolio protection
•Factor-based GAA Process
Provide assistance with alternative
investments (including real
assets) in terms of profiling, and
integration in a GAA
Provide assistance with alternative
investments (including real
assets) in terms of profiling, and
integration in a GAA
•Alternative Investments
Provide assistance with asset
allocation and related risk control
and/or risk budgeting techniques
Provide assistance with asset
allocation and related risk control
and/or risk budgeting techniques
•Global Asset Allocation (GAA)
49
FinLight Research | www.finlightresearch.com