Financial Performance, Risk, and...
14
Journal of Agricultural and Applied Economics, 29, l(July 1997): 149–161 0 1997 Southern Agricultural Economics Association Financial Performance, Risk, Specialization Barry M. Purdy, Michael R. Langemeier, Allen M. Featherstone ABSTRACT and and A sample of Kansas farms was used to examine the impact of risk and specialization on mean financial performance. Mean financial performance was hypothesized to be influ- enced by risk, age of the operator,percentage of acres owned, financial efficiency, leverage, specialization, and farm size. Risk, age of operator, financial efficiency, and farm size had the largest impacts on mean financial performance. Specializing in swine, dairy, or crop production increased mean financial performance, while specializing in beef production decreased mean financial performance. Farms with both crops and a livestock enterprise (beef, swine, or dairy) tended to have less variability in financial performance. Key Words: financial efficiency, return on equity, specialization. The agricultural sector is facing a transitional period that is commonly referred to as the in- dustrialization of agriculture. Boehlje de- scribes this industrialization as “the applica- tion of modern industrial manufacturing, production, procurement, distribution, and co- ordination concepts to the food and industrial product chain” (p. 163). One of the charac- teristics of this industrialization is increased specialization or business focus. The impact of specialization on the mean and variability of financial performance is not well understood. The impact of specialization on mean fi- nancial performance depends on the relative importance of economies of size and econo- Barry M. Purdy is a credit administrator for Bank IV in Salina, Kansas.Michael R. Langemeierand Allen M. Featherstoneare associateprofessorandprofessor of agricultural economics, respectively,atKansasState University. This is ContributionNo. 97-162-J of the Kansas AgriculturalExperimentStation. The authorswould like to acknowledge the helpful comments of two anonymousjournalreviewers. mies of scope. If economies of size for a par- ticular enterprise are significant, specializing in the production of that enterprise would in- crease mean financial performance. However, if economies of scope are prevalent, an in- crease in specialization will result in a relative decrease in mean financial performance (Pan- zer and Willig; Jovanovic). For instance, di- versification may be used to fully employ la- bor or to ensure the quality of crops or hay for livestock feed. Specialization also may affect the variabil- ity of financial performance. Enterprise diver- sification can be an important tool for man- aging risk (Fleisher; Robison, and Barry; Sonka and Patrick). Enterprise diversification is particularly effective when the returns be- tween two enterprises or groups of enterprises are uncorrelated or negatively correlated. His- torically, many farms diversified their opera- tions by producing both crops and livestock. By specializing, farms may be able to capture product-specific economies of size, but in the
Transcript of Financial Performance, Risk, and...
Journal of Agricultural and Applied Economics, 29, l(July 1997): 149–1610 1997 Southern Agricultural Economics Association
Financial Performance, Risk,Specialization
Barry M. Purdy, Michael R. Langemeier,Allen M. Featherstone
ABSTRACT
and
and
A sample of Kansas farms was used to examine the impact of risk and specialization onmean financial performance. Mean financial performance was hypothesized to be influ-enced by risk, age of the operator,percentage of acres owned, financial efficiency, leverage,specialization, and farm size. Risk, age of operator, financial efficiency, and farm size hadthe largest impacts on mean financial performance. Specializing in swine, dairy, or cropproduction increased mean financial performance, while specializing in beef productiondecreased mean financial performance. Farms with both crops and a livestock enterprise(beef, swine, or dairy) tended to have less variability in financial performance.
Key Words: financial efficiency, returnon equity, specialization.
The agricultural sector is facing a transitionalperiod that is commonly referred to as the in-dustrialization of agriculture. Boehlje de-scribes this industrialization as “the applica-tion of modern industrial manufacturing,production, procurement, distribution, and co-ordination concepts to the food and industrialproduct chain” (p. 163). One of the charac-teristics of this industrialization is increasedspecialization or business focus. The impact ofspecialization on the mean and variability offinancial performance is not well understood.
The impact of specialization on mean fi-nancial performance depends on the relativeimportance of economies of size and econo-
Barry M. Purdyis a credit administratorfor Bank IVin Salina,Kansas.Michael R. Langemeierand AllenM. Featherstoneare associateprofessor and professorof agriculturaleconomics, respectively,atKansasStateUniversity.
This is ContributionNo. 97-162-J of the KansasAgriculturalExperimentStation. The authorswouldlike to acknowledge the helpful comments of twoanonymousjournal reviewers.
mies of scope. If economies of size for a par-
ticular enterprise are significant, specializingin the production of that enterprise would in-crease mean financial performance. However,
if economies of scope are prevalent, an in-
crease in specialization will result in a relativedecrease in mean financial performance (Pan-
zer and Willig; Jovanovic). For instance, di-versification may be used to fully employ la-bor or to ensure the quality of crops or hayfor livestock feed.
Specialization also may affect the variabil-ity of financial performance. Enterprise diver-
sification can be an important tool for man-
aging risk (Fleisher; Robison, and Barry;
Sonka and Patrick). Enterprise diversificationis particularly effective when the returns be-
tween two enterprises or groups of enterprisesare uncorrelated or negatively correlated. His-torically, many farms diversified their opera-
tions by producing both crops and livestock.By specializing, farms may be able to captureproduct-specific economies of size, but in the
150 Journal of Agricultural and Applied Economics, July 1997
process may also reduce their ability to man-age risk or capture economies of scope.
Recent studies have examined the impor-tance of diversification in explaining nonagri-cultural corporate financial performance.Montgomery noted that firms have diversifiedinto related industries to improve mean finan-cial performance. However, other research(Wernerfelt and Montgomery; Lang and Stulz;Hoskisson and Hitt) found evidence that di-versification reduces mean financial perfor-mance. Firms that are more specialized tendto improve strategic control.
Farm management research that has inves-tigated the relationship between specializationand mean financial performance is limited.Haden and Johnson examined the relationshipbetween farm income and milk sales as a per-centage of total farm sales for a sample ofTennessee dairy farms. Milk sales as a per-centage of total farm sales were negatively re-lated to cash farm income, but were unrelatedto net farm income or returns to operator laborand management. Kauffman and Tauer did notfind a significant relationship between special-ization and labor and management income orthe rate of return on equity for a sample ofNew York dairy farms. However, neither ofthese studies addressed the potential impact ofspecialization on nondairy farms or includedrisk in the analysis.
The objective of this study is to investigatethe impact of risk and specialization on meanfinancial performance. Specifically, the impactof specialization on the mean and variance ofreturn on equity is examined.
Conceptual Framework
The relationship between risk and return hasbeen studied extensively (Robison and Barry;Sonka and Patrick). Since its development byMarkowitz, the E-V model has been a popularmethod to examine the relationship betweenrisk and return. The E-V model typically isused as a method to approximate all risk-averse utility functions (Levy and Markowitz).The advantage of the E-V model is that allchoices can be summarized by the first twomoments (mean and variance). Tobin notes
that expected utility-maximizing decisions arepart of the E-V efficient set when choices in-volve a risky and a safe asset. As indicated byRobison and Barry, if choices can be repre-sented by various combinations of a risky anda safe asset, the following linear relationshipbetween risk and return can be specified:
(1) E(j) = a +- N2 Var(y),
where E(y) is the expected or mean outcome,Var(y) is the variance of outcomes, u is theintercept, and h is the Pratt-Arrow absoluterisk aversion coefficient.
Specialization or diversification impactboth the mean and variance of financial per-formance, or the dependent and independentvariables in equation (l). A positive relation-ship between specialization and mean financialperformance would indicate that specializationimproves mean financial performance. Con-versely, if economies of scope are relativelyimportant, the degree of specialization couldbe negatively related to mean financial perfor-mance. To the extent that diversification re-duces risk, the degree of specialization wouldbe expected to be positively related to risk orthe variance of financial performance.
In addition to risk and specialization, manyother factors have been analyzed in previousfarm success or financial performance studies(Fox, Bergen, and Dickson). These other fac-tors include operator age (Haden and Johnson;Kauffman and Tauer; Tauer), land tenure (El-linger and Barry; Plumley and Hornbaker),financial efficiency (Ford and Shonkwiler;Plumley and Hornbaker), leverage (Ford andShonkwiler; Haden and Johnson; Plumley andHornbaker), and farm size (Boessen et al.;Ford and Shonkwiler; Haden and Johnson;Kauffman and Tauer; Sonka, Hornbaker, andHudson). Previous research suggests that op-erator age, land tenure, financial efficiency,and leverage are negatively related to meanfinancial performance.
Previous research addressing the impact offarm size on mean financial performance is in-conclusive. Several different variables havebeen used to measure the impact of farm sizeon financial success or mean financial perfor-
Purdy, Langemeier, and Featherstone: Financial Performance and Specialization 151
mance, When analyzing farms of a specifictype (such as dairy farms), it is typical to useherd size or acres operated to measure size.When examining the performance for farmswith several enterprises, it is typical to use ei-ther total acres operated or gross farm incometo measure farm size. Both of these measuresare problematic. It is difficult to use total acresoperated to measure the performance of farmswith a wide variation in land type or quality.However, there are even more problems as-sociated with using gross farm income to mea-sure size. Problems associated with using thismeasure of farm size include changing pricelevels across years, changing enterprise pricerelationships, and changing effects of weather
across years (Stanton). Thus, in the currentstudy, total acres operated was used as themeasure of farm size. Furthermore, to capturethe possibility of a nonlinear relationship be-tween financial performance and farm size,linear and quadratic terms were used,
Using the variables described above, thefollowing relationship was specified:
(2) MROE = f(VROE, AGE, PO WN, OER,DER, DTAR, SPEC, pACRES),
where MROE is the mean return on equity foreach farm, VROE is the variance of return onequity for each farm, AGE is the age of theoperator, POWN is the percentage of totalacres owned, OER is the operating expenseratio, DER is the depreciation expense ratio,DTAR is the debt-to-asset ratio, SPEC is ameasure or set of measures relating to spe-cialization or diversification, and A CRES is thetotal number of acres operated,
Four different specifications of equation (2)were used to determine the impact of special-ization on mean financial performance. Spe-cialization measures used included a special-ization of income index, interaction termsbetween crop and livestock income, percent-age of income from crops, and percentage ofincome from livestock. The specialization ofincome index was used to examine the impactof whole-farm specialization on mean finan-
cial performance. The interaction terms wereused to analyze the impact of crop and live-
stock diversification on mean financial perfor-mance. These interaction terms were comput-ed by multiplying the percentage of incomefrom crops by the percentage of income de-rived from beef, dairy, or swine production.The percentage of income from specific cropand livestock enterprises was used to examinethe impact of specializing in crop or livestockproduction.
Equation (2) could be estimated with or-dinary least squares. However, if VROE is astochastic regressor, estimating equation (2)with ordinary least squares could result in in-consistent estimates (Judge et al.). To obtainconsistent estimates, a separate equation wasestimated for risk. Following Schurle andTholstrup, the risk equation was specified as
(3) VROE = f(AGE, DTAR, SPEC, GOVTACRES, REGION),
where GOVT is the percentage of gross farmincome derived from government payments,REGION denotes a set of dummy variables in-dicating the Kansas Farm Management Asso-ciation region in which the farm was located,and all other terms are as previously defined.
Four different specifications of equation(3), one for each of the specialization specifi-cations, were estimated. Specialization (diver-sification) was expected to be positively (neg-atively) related to VROE. Age of operator, thedebt-to-asset ratio, and total acres operatedwere expected to be positively related toVROE (Schurle and Tholstrup). Governmentpayments as a percentage of gross farm in-come was expected to be negatively related toVROE. In other words, participation in gov-ernment programs was expected to reduce riskor variability of financial performance. The re-gional dummy variables accounted for differ-ences in weather and cropping practicesamong regions of Kansas.
To obtain consistent estimates, equations(2) and (3) could be estimated using an instru-mental variable approach or as a system ofequations (Kmenta). With the instrumentalvariable approach, the independent variableswould be used as instruments to estimateequation (2). The systems approach would es-timate both equations together and would re-

152 Journal of Agricultural and Applied Economics, July 1997
suit in estimates that were not only consistent,but also asymptotically efficient. A systemsapproach or three-stage least squares (3SLS)was used in this study, with all percentagevariables expressed in decimal form,
Elasticities were computed using the re-gression coefficients in equations (2) and (3).The chain rule was used to calculateticities for variables that appearedequations.
Kansas Farm Management Data
the elas-in both
Data for 320 farms in the Kansas Farm Man-agement Associations with continuous datafrom 1985 through 1994 were used in thisstudy. These 320 farms represented about 1270of the total farms enrolled in the Kansas FarmManagement Associations in 1994.1
Data from the Kansas Farm ManagementAssociations are well suited for examining fi-nancial performance. Income, expense, andbalance sheet information was available foreach farm. Income was expressed on an ac-crual basis and could be separated into threecategories: crop, livestock, and custom work.Livestock income was reported on a value--added basis. Each farm recorded both cash andnoncash (e.g., depreciation) expenses. Assetsand liabilities were broken down into enoughdetail so that current, intermediate, and long-term categories could be identified. In addi-tion, the data were checked by area Associa-tion economists to improve accuracy andcompleteness.
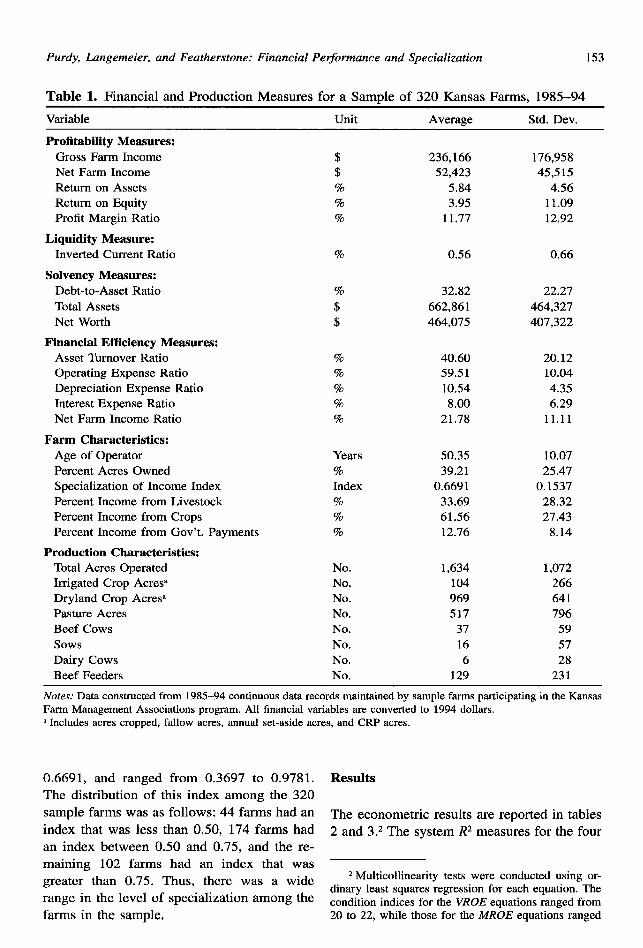
Table 1 presents the averages and standarddeviations of selected annual production andfinancial factors for the 320 farms used in thisstudy. All financial variables are converted to1994 dollars using the implicit price deflatorfor personal consumption expenditures (U.S.Department of Commerce). The financial ra-tios reported in table 1 were calculated usingthe Recommendations of the Farm Financial
1The 320 farmsused in this study do not representa random sample. Farms that left the Kansas FarmManagement Associations because of retirement, bank-ruptcy, or for other reasons were not included in theanalysis. Also, farms with one or more years of incom-plete data were not included in the sample.
Standards Council (Farm Financial StandardsCouncil). Market values for assets were usedin the computations. The current ratio in table1 was calculated by dividing current liabilitiesby current assets. Several of the farms hadzero current liabilities. Thus, the current ratiowas inverted so that this ratio could be cal-culated for each farm. The return on equityreported in table 1 accounts for unpaid oper-ator labor and management as well as capitalgains and losses on land. Data on capital gainsfor assets other than land were not available.Following the procedures of the Kansas FarmManagement Associations, a flat labor chargeper operator ($22,500 in 1994) and a manage-ment charge of 590 of gross farm income wereused to compute unpaid operator labor andmanagement charges. Nonfarm assets and li-abilities were not included in any of the finan-cial ratios.
Average gross farm income for the 320farms over the 1985–94 period was $236,166,and ranged from $38,297 to $1,150,813. Onaverage, 61.6% of gross farm income was de-rived from crop income (47.8~0 from corn,grain sorghum, wheat, and other small grains;11.89tofrom soybeans and sunflowers; and 290from hay and forage production). Livestockproduction accounted for 33.7% of gross farmincome and was comprised of income frombeef (20. 1Ye), swine (890), dairy (4.970), andsheep and poultry (0.790). The remaining4.7% of gross farm income was derived fromcustom work.
Herfindahl indices (Greer) were computedto examine the extent to which the 320 farmswere diversified or specialized. Using averageincome information for each farm, the Herfin-dahl index summed the squares of the per-centage of income from crops, livestock, andcustom work. The Herfindahl index for a spe-cific farm depended on the percentage of in-come derived from each of the three sources.For example, a farm that reported 50?lo of itsincome from crops and 5090 from livestockincome had a specialization of income indexof 0.50. A diversified farm had a low index(slightly above 0.33), while that for a special-ized farm was close to 1.00. As shown in table1, the specialization of income index averaged
Purdy, L.ungemeier, and Featherstone: Financial Performance and Specialization 153
Table 1. Financial and Production Measures for a Sample of 320 Kansas Farms, 1985–94
Variable Unit Average Std. Dev.
Profitability Measures:
Gross Farm IncomeNet Farm IncomeReturn on AssetsReturn on EquityProfit Margin Ratio
$$TO%Vo
236,16652,423
5,843.95
11.77
176,95845,515
4.5611.0912.92
Liquidity Measure:Inverted Current Ratio 0.56 0.66
SolvencyMeasures:Debt-to-Asset RatioTotal AssetsNet Worth
70
$$
32.82662,861464,075
22.27464,327407,322
Financial Etliciency Measures:Asset ‘Nu-never RatioOperating Expense RatioDepreciation Expense RatioInterest Expense RatioNet Farm Income Ratio
%9Z0
%
$zO
%
40.6059.5110.54
8.0021.78
20.1210.044.356.29
11.11
Farm Characteristics:Age of OperatorPercent Acres OwnedSpecialization of Income IndexPercent Income from LivestockPercent Income from CropsPercent Income from Gov’t. Payments
Years70Index%910
70
50.3539.21
0.669133.6961.5612.76
10.0725.47
0.153728.3227.43
8.14
Production Characteristics:Total Acres OperatedIrrigated Crop AcresaDryland Crop Acres’Pasture AcresBeef CowssowsDairy CowsBeef Feeders
No.No.No.No.No.No.No.No.
1,634104969517
37166
129
1,072266641796
595728
231
Notes: Data constructed from 19S5–94 continuous data records maintained by sample farms participating in the KansasFarm Management Associations program. All financial variables are converted to 1994 dollars.a Includes acres cropped, frdlow acres, annurd set-aside acres, and CRP acres.
0.6691, and ranged from 0.3697 to 0.9781.The distribution of this index among the 320sample farms was as follows: 44 farms had an
index that was less than 0.50, 174 farms hadan index between 0.50 and 0.75, and the re-maining 102 farms had an index that wasgreater than 0.75. Thus, there was a widerange in the level of specialization among thefarms in the sample.
Results
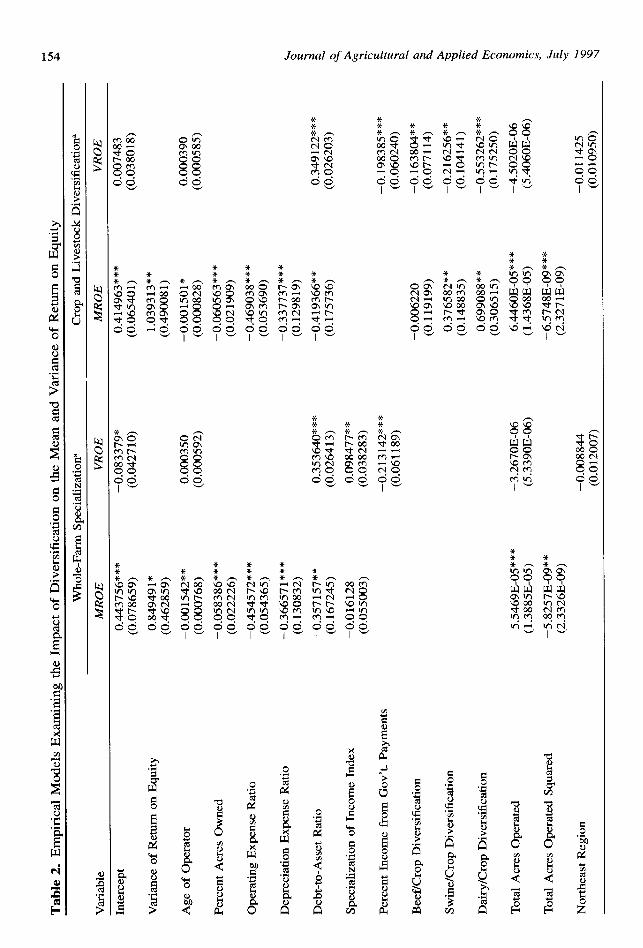
The econometric results are reported in tables2 and 3.2 The system R2 measures for the four
2Multicollinearity tests were conducted using or-dinary least squares regression for each equation. Thecondition indices for the VROE equations ranged from20 to 22, while those for the MROE equations ranged
Journal of Agricultural and Applied Economics, July 1997
*‘k*-coomm0=mmWv)TO00IQ
‘x *++ *
***44
0
Purdy, Langemeier, and Featherstone: Financial Pe@ormance and Specialization 155
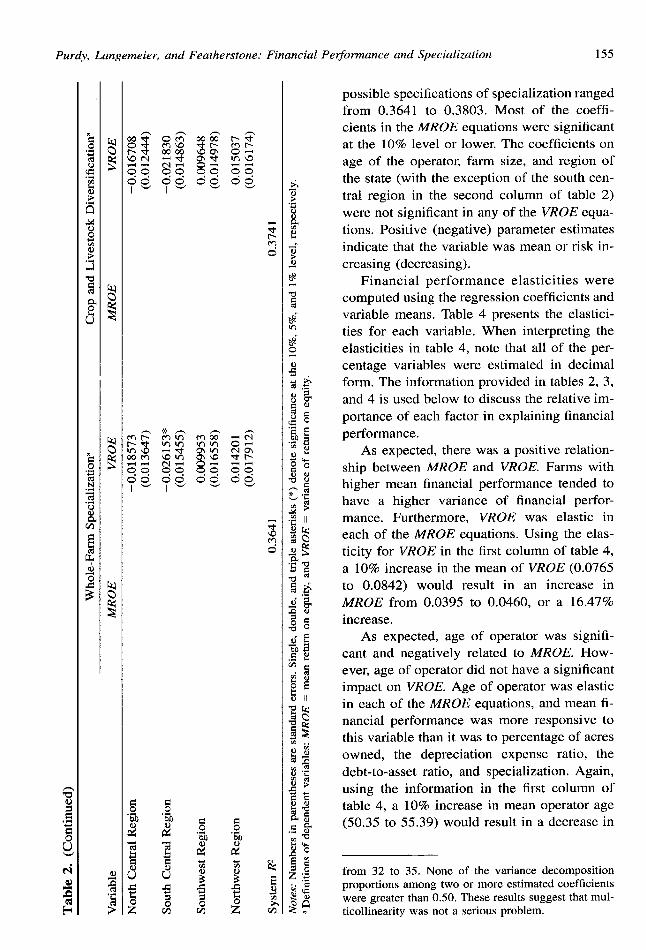
possible specifications of specialization rangedfrom 0.3641 to 0.3803. Most of the coeffi-cients in the MROE equations were significantat the 10% level or lower. The coefficients onage of the operator, farm size, and region ofthe state (with the exception of the south cen-tral region in the second column of table 2)were not significant in any of the VROE equa-tions. Positive (negative) parameter estimatesindicate that the variable was mean or risk in-creasing (decreasing).
Financial performance elasticities werecomputed using the regression coefficients andvariable means. Table 4 presents the elastici-ties for each variable. When interpreting theelasticities in table 4, note that all of the per-centage variables were estimated in decimalform. The information provided in tables 2, 3,
and 4 is used below to discuss the relative im-portance of each factor in explaining financialperformance.
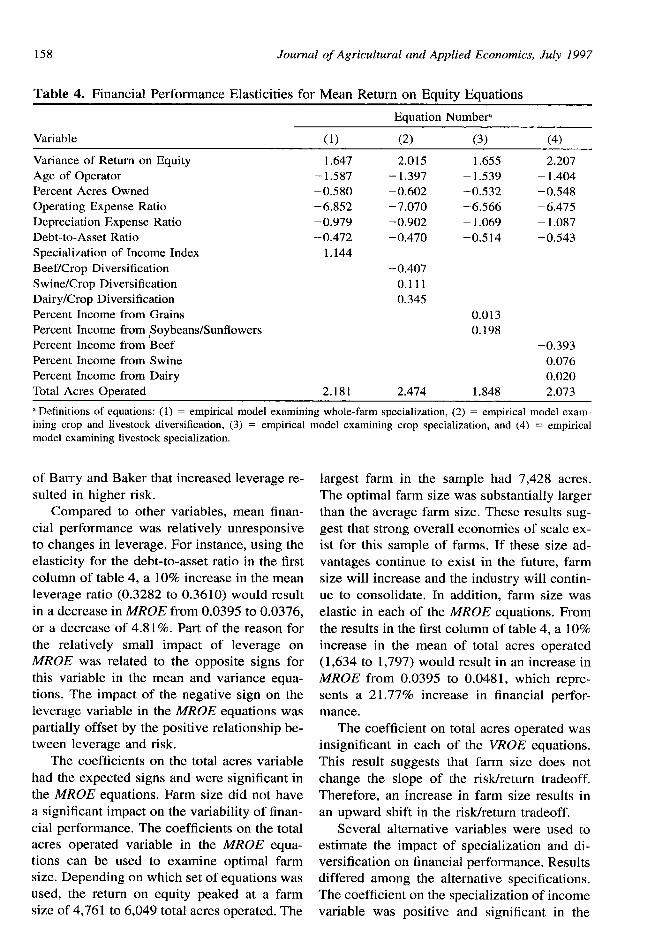
As expected, there was a positive relation-ship between MROE and VROE. Farms withhigher mean financial performance tended tohave a higher variance of financial perfor-mance. Furthermore, VROE was elastic ineach of the MROE equations. Using the elas-ticity for VROE in the first column of table 4,a 10% increase in the mean of VROE (0.0765
to 0.0842) would result in an increase inMROE from 0.0395 to 0.0460, or a 16.47%increase.
As expected, age of operator was signifi-cant and negatively related to MROE. How-ever, age of operator did not have a significantimpact on VROE. Age of operator was elasticin each of the MROE equations, and mean fi-nancial performance was more responsive tothis variable than it was to percentage of acresowned, the depreciation expense ratio, thedebt-to-asset ratio, and specialization. Again,using the information in the first column oftable 4, a 10% increase in mean operator age(50.35 to 55.39) would result in a decrease in
from 32 to 35. None of the variance decompositionproportions among two or more estimated coefficientswere greater than 0.50. These results suggest that mul-ticollinearity was not a serious problem.
Journal of Agricultural and Applied Economics, July 1997
.x. * **
* *4.. ?4
***-mr-I+vlmm~~
001-
Purdy, Langemeier, and Featherstone: Financial Pe~ormance and Specialization 157
m0coVI
0
MROE from 0.0395 to 0.0332, or a 15.9590decrease.
The coefficient on percentage of acresowned had the expected negative sign and was
significant in each of the MROE equations.This result is consistent with research by El-linger and Barry, and Plumley and Hornbaker,who found that ownership of land decreasedmean rates of return. Percentage of acresowned was inelastic for each of the MROE
equations. Using the results in the first columnof table 4, a 1070 increase in the mean per-centage of acres owned (0.3921 to 0.4313)would result in a decrease in MROE from0.0395 to 0.0372, or a decrease of 5.82910.
The coefficients on the operating expenseratio and the depreciation expense ratio hadthe expected negative signs and were signifi-cant in each of the MROE equations. Thus,higher expense ratios reduce rates of return.Mean financial performance was more respon-sive to changes in the operating expense ratiothan it was to any other independent variable.The depreciation expense ratio was less elasticthan the operating expense ratio in each of theMROE equations. Based on the results in thefirst column of table 4, a 10% increase (0.5951to 0.6546) in the mean of the operating ex-
pense ratio would result in a decrease inMROE of 0.0271 (0.0395 to 0.0124), or a de-crease of 68.61%. Thus, controlling produc-tion costs, particularly operating costs, wascritical to financial success. Given the relativeimportance of operating costs in profit and re-turn calculations, this result was not surpris-ing.
The debt-to-asset ratio was negatively re-lated to MROE and positively related toVROE. Thus, on average, a decrease in lev-erage resulted in a decrease in mean financialperformance and an increase in the variabilityof financial performance. The average returnon equity for the sample of farms was 3.95%,
while the average return on assets was 5 .84~o.Given this relationship between ROA andROE, it was not surprising to find a negative
relationship between leverage and the returnon equity. The positive relationship betweenleverage and risk is consistent with the finding
158 Journal of Agricultural and Applied Economics, July 1997
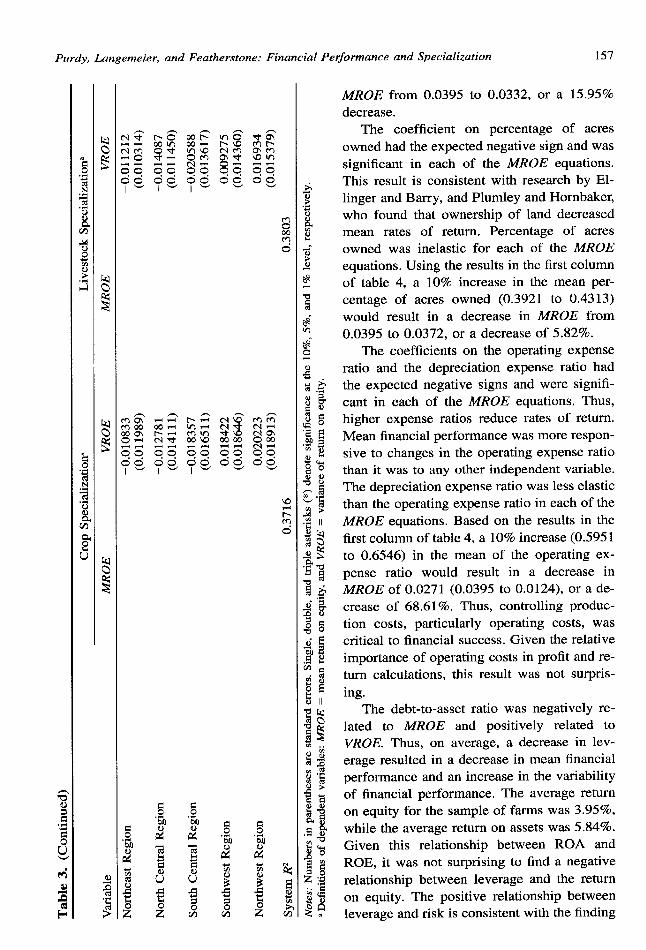
Table 4. Financial Performance Elasticities for Mean Return on Equity Equations
Equation Numbera
Variable (1) (2) (3) (4)
Variance of Return on EquityAge of OperatorPercent Acres OwnedOperating Expense RatioDepreciation Expense RatioDebt-to-Asset RatioSpecialization of Income IndexBeef/Crop DiversificationSwine/Crop DiversificationDairy/Crop DiversificationPercent Income from GrainsPercent Income from ,SoybeansfSunflowersPercent Income from BeefPercent Income from SwinePercent Income from Dairy
1.647 2.015
–1.587 –1.397
–0.580 –0.602
–6.852 –7.070–0.979 –0.902–0.472 –0.470
1.144–0.407
0.1110.345
1.655–1.539–0.532–6.566– 1.069–0.514
2.207– 1.404–0.548–6.475– 1.087–0.543
0.0130.198
–0.3930.0760.020
Total Acres Operated 2.181 2.474 1.848 2.073
‘ Definitions of equations: (1) = empirical model examining whole-farm specialization, (2) = empirical model exam-ining crop and livestock diversification, (3) = empirical model examining crop specialization, and (4) = empiricalmodel examining livestock specialization.
of Barry and Baker that increased leverage re-
sulted in higher risk.
Compared to other variables, mean finan-
cial performance was relatively unresponsive
to changes in leverage. For instance, using the
elasticity for the debt-to-asset ratio in the first
column of table 4, a 10% increase in the mean
leverage ratio (0.3282 to 0.3610) would result
in a decrease in A4ROE from 0.0395 to 0.0376,or a decrease of 4.8 19io.Part of the reason forthe relatively small impact of leverage onklROE was related to the opposite signs forthis variable in the mean and variance equa-tions. The impact of the negative sign on theleverage variable in the MROE equations was
partially offset by the positive relationship be-
tween leverage and risk.
The coefficients on the total acres variable
had the expected signs and were significant in
the MROE equations. Farm size did not havea significant impact on the variability of finan-cial performance. The coefficients on the totalacres operated variable in the MROE equa-tions can be used to examine optimal farmsize. Depending on which set of equations wasused, the return on equity peaked at a farmsize of 4,761 to 6,049 total acres operated. The
largest farm in the sample had 7,428 acres.The optimal farm size was substantially largerthan the average farm size. These results sug-gest that strong overall economies of scale ex-ist for this sample of farms. If these size ad-vantages continue to exist in the future, farmsize will increase and the industry will contin-ue to consolidate. In addition, farm size waselastic in each of the A4ROE equations. Fromthe results in the first column of table 4, a 10%increase in the mean of total acres operated(1,634 to 1,797) would result in an increase inMROE from 0.0395 to 0.0481, which repre-sents a 21.77% increase in financial perfor-mance.
The coefficient on total acres operated wasinsignificant in each of the VROE equations.This result suggests that farm size does notchange the slope of the riskheturn tradeoff.Therefore, an increase in farm size results inan upward shift in the riskheturn tradeoff.
Several alternative variables were used toestimate the impact of specialization and di-versification on financial performance. Resultsdiffered among the alternative specifications.The coefficient on the specialization of incomevariable was positive and significant in the
Purdy, Langemeier, and Featherstone: Financial Pe<ormance and Specialization 159
VROE equations, but was insignificant in theA4ROE equations. This suggests that whole-farm specialization (diversification) increases(decreases) the variability of financial perfor-mance. Due to the positive relationship be-tween whole-farm specialization and risk, theelasticity with respect to this variable was pos-itive (table 4).
The coefficients for the crop and livestockdiversification variables are reported in thethird and fourth columns of table 2. The co-efficients on the three diversification variableswere significant and negative in the VROE
equations. Thus, diversification between beef,swine, or dairy production and crop produc-tion decreased the variability of return on eq-uity. In the MROE equations, the coefficientsfor the swine/crop and dairy/crop variableswere significant and positive, while the coef-ficient for the beef/crop variable was insignif-icant.
The results for the three diversificationvariables reveal two notable implications.First, either scope economies were associatedwith producing swine or dairy and crops, ordairy and swine production were considerablymore profitable than the other enterprises. Theresults discussed below for swine and dairyspecialization support the latter explanation.Second, producing both beef and crops did notincrease MROE, but did reduce risk. Over80% of the farms in the sample had both beefand crop enterprises. The results suggest thatthe primary reason for producing these twoenterprises together revolves around risk re-duction.
The elasticities for the three diversificationvariables were relatively small in comparisonto those for the other factors affecting financialperformance. Thus, the impact of crop/live-stock diversification on mean financial perfor-mance was relatively small compared to theimpact of factors such as age of operator, fi-nancial efficiency, or farm size.
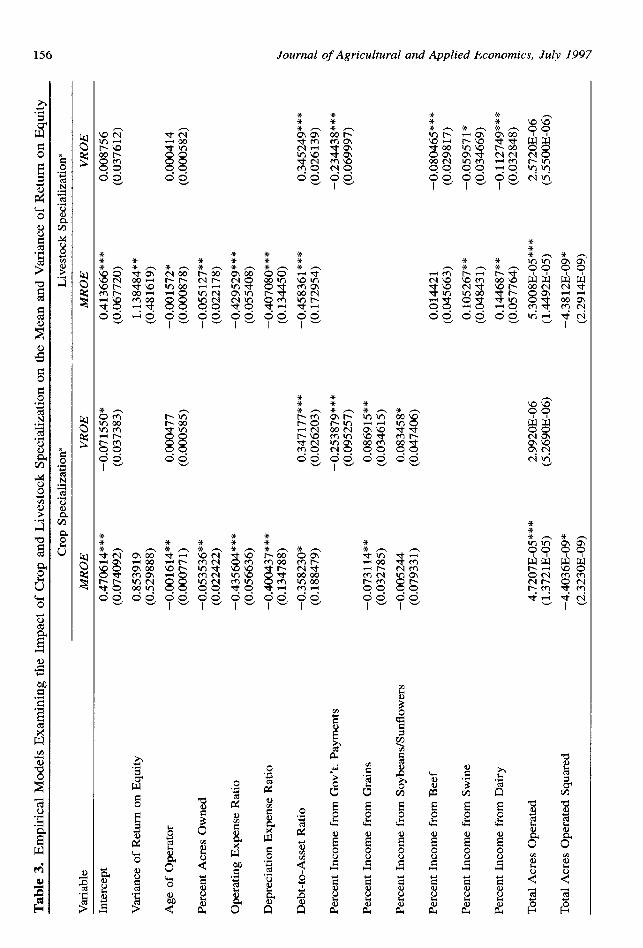
The impact on MROE and VROE of spe-cializing in crop or livestock production canbe found in table 3. The coefficients on thetwo crop variables in the VROE equationswere significant and positive, while the coef-ficients on the three livestock variables were
significant and negative. Specializing either ingrain production (corn, grain sorghum, wheat,or other small grain production) or in soybeansand sunflowers increased the variability of fi-nancial performance. Conversely, specializingin livestock production (beef, swine, or dairyproduction) reduced the variability of financialperformance. The results in table 4 indicatethat specialization in swine, dairy, or crop pro-duction increased mean financial performance,while specialization in beef production de-creased mean financial performance. The in-crease in mean financial performance associ-ated with swine or dairy production was morelikely due to product-specific economies ofscale or the profitability of these two enter-prises, while the increase in mean financialperformance associated with crop productionwas more likely the result of an increase inrisk. Obviously, there were large benefits as-sociated with producing swine or dairy. Thesetwo enterprises were mean increasing and riskreducing. These results are consistent with theincreases in farm size and consolidation thathave taken place in these two industries.
The elasticities for the crop and livestockspecialization variables in the third and fourthequations were relatively small compared tomany of the other variables, suggesting thatmean financial performance was not particu-larly responsive to changes in crop or live-stock specialization. The impact of specializa-tion on VROE tended to offset the directrelationship between specialization andMROE.
Conclusions and Implications
Industrialization of agriculture has resulted inan increased emphasis on business focus orspecialization. The impact of specialization onthe mean and variability of financial perfor-mance is not well understood. This study useda sample of Kansas farms to examine the im-pact of specialization on the mean return onequity per farm and the variance of return onequity per farm. An index for whole-farm spe-cialization was computed using informationon livestock income, crop income, and incomefrom custom work. The impact of specializing
160 Journal of Agricultural and Applied Economics, July 1997
in crop or livestock production also was stud-
ied. Other factors used in the analysis included
age of operator, percentage of acres owned,
financial efficiency ratios, leverage, and farm
size.
Age of operator, percentage of acres
owned, financial efficiency, and leverage were
negatively related to financial performance,
while farm size was positively related to fi-
nancial performance. Unlike crop production,
specializing in livestock production (beef,
swine, or dairy production) reduced the vari-
ability of financial performance. Specializing
in swine, dairy, or crop production increased
mean financial performance, and specializing
in beef production decreased mean financial
performance. The increase in mean financial
performance associated with swine and dairy
production was more likely the result of prod-
uct-specific economies of scale, while the in-
crease in mean financial performance associ-
ated with crop production was more likely the
result of an increase in risk.
The results have important implications for
farm managers, analysts, and financial insti-
tutions. First, the relative importance of finan-
cial efficiency on mean financial performance
suggests that industry benchmarks for these
measures need to be computed and that man-
agers should focus attention on these mea-
sures. Second, compared to many of the other
factors, mean financial performance is quite
responsive to increases in farm size. This, cou-
pled with the fact that farm size does not im-
pact the variability of financial performance,
suggests that there are large benefits associated
with increasing farm size. Further consolida-
tion of farms will likely result. Third, special-
izing in swine and dairy production decreased
the variability of financial performance and in-
creased mean financial performance. This
finding indicates that recent trends toward spe-
cialization in these two industries are likely to
continue. Fourth, farms with both crop andbeef enterprises tended to have less variabilityin financial performance, suggesting that thesemixed crop/beef farms have reduced riskthrough diversification. If this advantage con-tinues, this farm type will continue to be prev-alent in the Great Plains.
Further research could investigate the ro-bustness of the results of this study to otherregions. Results may differ for farms in othergeographical areas. Given the recent trend to-ward specialization, this additional research isimportant to our understanding of the effectsof industrialization and should be given highpriority.
References
Barry, F!J., and C.B. Baker. “Financial Responsesto Risk in Agriculture. ” In Risk Management in
Agriculture, cd., I?J. Barry. Ames IA: IowaState University Press, 1984.
Boehlje, M. “Industrialization of Agriculture: WhatAre the Policy Implications?” In Increasing
Understanding of Public Problems and Poli-
cies, 1995, eds., S.A. Halbrook and C.E. Merry.Oak Brook IL: Farm Foundation, 1996.
Boessen, C.R., A.M. Featherstone, L.N. Lange-meier, and R.O. Burton, Jr. “Financial Perfor-mance of Successful and Unsuccessful Farms. ”J. Amer. Sot. Farm Managers and Rural Ap-
praisers 54(April 1990):6–15.Ellinger, EN., and F?J. Barry. “The Effects of Ten-
ure Position on Farm Profitability and Solvency:An Application to Illinois Farms. ” Agr. Fin.
Rev. 47(1987): 10618.
Farm Financial Standards Council. Recommenda-
tions of the Farm Financial Standards Council.
Financial Guidelines for Agricultural Producers.American Bankers’ Assoc., Washington DC,May 1991.
Fleisher, B. Agricultural Risk Management. Boul-der CO: Lynne Reiner Publications, 1990.
Ford, S .A., and J.S. Shonkwiler. “The Effect ofManagerial Ability on Farm Financial Suc-cess, ” Agr. and Resour. Econ. Rev. 23(October1994):150–57.
Fox, G,, P.A. Bergen, and E. Dickson. “Why AreSome Farms More Successful than Others? AReview. ” In Size, Structure, and the Changing
Face of American Agriculture, ed., A. Hallam.
Boulder CO: Westview Press, 1993.
Greer, D.17 Industrial Organization and Public Pol-
icy, 2nd ed. New York: Macmillan PublishingCo., 1984.
Haden, K.L., and L.A. Johnson. “Factors WhichContribute to the Financial Performance of Se-lected Tennessee Dairies. ” S. J. Agr. Econ.21(July 1989): 105–12.
Hoskisson, R.E., and M.A. Hitt. Downscoping;
Purdy, Langemeier, and Featherstone: Financial Performance and Specialization 161
How to Tame the Diverstjied Firm. New York:Oxford University Press, 1994.
Jovanovic, B. “The Diversification of Production. ”Brookings Papers on Economic Activity: Ma-
croeconomics 1(1993): 197–247.Judge, G. G., R.C. Hill, W.E. Griffiths, H. Lutke-
pohl, and T.C. Lee. Introduction to the Theory
and Practice of Econometrics, 2nd ed. NewYork: John Wiley, 1988.
Kauffman, J., and L. Tauer. “Successful DairyFarm Management Strategies Identified by Sto-chastic Dominance Analysis of Farm Records. ”Northeast. J. Agr. and Resour. Econ. 15(Octo-ber 1986): 168–77.
Kmenta, J. Elements of Econometrics. New York:Macmillan Publishing Co., 1971.
Lang, L.H. I?, and R.M. Stulz. “Tobin’s q, Corpo-rate Diversification, and Firm Performance. ” J.
Polit. Econ. 102(December 1994): 1249–80.Levy, H., and H.M. Markowitz. “Approximating
Expected Utility by a Function of Mean andVariance. ” Amer. Econ. Rev. 69(June 1979):308–17.
Markowitz, H. “Portfolio Selection. ” J. Finance
7(March 1952):77–91.Montgomery, C.A. “Corporate Diversification. ” J.
Econ. Perspectives 8(Summer 1994): 163–78.Panzer, J.C., and R.D. Willig. “Economies of
Scope.” Amer. Econ. Rev. 71 (May 1981 ):268–72.
Plumley, G. O., and R.H. Hornbaker. “FinancialManagement Characteristics of Successful FarmFirms.” Agr. Fin. Rev. 5 1(1991):9–20.
Robison, L.J., and PJ. Barry. The CompetitiveFirm’s Response to Risk. New York: Macmillan
Publishing Co., 1987.Schurle, B., and M. Tholstrup. “Farm Character-
istics and Business Risk in Production Agricul-ture. ” N. Cent. J. Agr. Econ. 1l(July 1989):183–88.
Sonka, S.T., R.H. Hornbaker, and M.A. Hudson.“Managerial Performance and Income Variabil-ity for a Sample of Illinois Cash Grain Produc-ers.” N. Cent. J. Agr. Econ. 1l(January 1989):39–47.
Sonka, S.T., and G.l? Patrick. “Risk Managementand Decision Making in Agricultural Firms. ” InRisk Management in Agriculture, cd., F?J.Barry.Ames IA: Iowa State University Press, 1984.
Stanton, B.17 “Changes in Farm Size and Structurein American Agriculture in the ‘ISventieth Cen-tury. ” In Size, Structure, and the Changing
Face of American Agriculture, cd., A. Hallam.Boulder CO: Westview Press, 1993.
Tauer, L. “Age and Farmer Productivity.” Rev.
Agr. Econ. 17(January 1995):63–69.Tobin, J. “Liquidity Preference as Behavior Toward
Risk.” Rev. Econ. Stud. 25(February 1958):65–86.
U.S. Department of Commerce. Survey of CurrentBusiness. USDC/Bttreau of Economic Analysis,Washington DC. Various issues, 1985–94.
Wernerfelt, B., and C.A. Montgomery. “Tobin’s q
and the Importance of Focus in Firm Perfor-mance. ” Amer. Econ. Rev. 78(March 1988):246-50.