Financial Development and Technology Di usion
39
Financial Development and Technology Diffusion * Diego Comin Dartmouth College Ramana Nanda Harvard Business School July 2018 Abstract We examine the extent to which financial market development impacts the dif- fusion of 16 major technologies, looking across 17 countries, from 1870 to 2000. We find that greater depth in financial markets leads to faster technology diffusion for more capital-intensive technologies, but only in periods closer to the invention of the technology. In fact, we find no differential effect of financial depth on the diffusion of capital-intensive technologies in the late stages of diffusion or in late adopters. Our results are consistent with a view that local financial markets play a critical role in facilitating the process of experimentation that is required for the initial commercialization and diffusion of technologies. * [email protected] and [email protected]. We are extremely grateful to Bo Becker, Xavier Duran, Christian Fons-Rosen, Sabrina Howell, Lakshmi Iyer, Victoria Ivashina, Bill Kerr, James Lee, Aldo Musacchio and Tom Nicholas, and to the seminar participants at the Bank of Finland, George Washington University School of Business, Copenhagen Business School, MIT Sloan, HBS International Seminar, and the NBER Productivity Lunch for helpful discussions. Zeynep Kabukcuoglu provided excellent research support. Comin thanks the INET Foundation for its generous support and Nanda acknowledges support from the Kauffman Foundation’s Junior Faculty Fellowship and the Division of Research and Faculty Development at Harvard Business School. All errors are our own. 1
Transcript of Financial Development and Technology Di usion
Financial Development and Technology Diffusion∗
Diego CominDartmouth College
Ramana NandaHarvard Business School
July 2018
Abstract
We examine the extent to which financial market development impacts the dif-fusion of 16 major technologies, looking across 17 countries, from 1870 to 2000.We find that greater depth in financial markets leads to faster technology diffusionfor more capital-intensive technologies, but only in periods closer to the inventionof the technology. In fact, we find no differential effect of financial depth on thediffusion of capital-intensive technologies in the late stages of diffusion or in lateadopters. Our results are consistent with a view that local financial markets playa critical role in facilitating the process of experimentation that is required for theinitial commercialization and diffusion of technologies.
∗[email protected] and [email protected]. We are extremely grateful to Bo Becker, XavierDuran, Christian Fons-Rosen, Sabrina Howell, Lakshmi Iyer, Victoria Ivashina, Bill Kerr, James Lee,Aldo Musacchio and Tom Nicholas, and to the seminar participants at the Bank of Finland, GeorgeWashington University School of Business, Copenhagen Business School, MIT Sloan, HBS InternationalSeminar, and the NBER Productivity Lunch for helpful discussions. Zeynep Kabukcuoglu providedexcellent research support. Comin thanks the INET Foundation for its generous support and Nandaacknowledges support from the Kauffman Foundation’s Junior Faculty Fellowship and the Division ofResearch and Faculty Development at Harvard Business School. All errors are our own.
1

1 Introduction
A central issue in the economics and finance literature is the extent to which financial
market development drives economic growth (e.g., Beck et al. 2000; Levine 1997; Levine
et al. 2000; Laeven et al 2015). There is increasing evidence that better financing envi-
ronments lead to higher economic growth because they reduce financing constraints for
entrepreneurs (Rajan and Zingales 1998; Guiso, Sapienza and Zingales 2004) and facilitate
more efficient allocation of capital across investment opportunities in the real economy
(e.g., King and Levine 1993a,b; Jayaratne and Strahan 1996; Rajan and Zingales 2003;
Bertrand et al 2007). While the relationship between financial development and product
market efficiency is well-documented, far less attention has been paid to the specific role
that capital markets might play in the faster adoption and diffusion of new technologies.
Technology adoption is believed to be a key channel through which productivity growth is
achieved (Aghion and Howitt, 1992), and differences in the diffusion of new technologies
has been found to explain a significant portion of the large cross-country differences in
total factor productivity (Comin and Hobjin, 2010).1
In this paper, we examine whether, and if so how, financial markets contribute to
technology diffusion. Examining this question requires data that both span a long period
of time and are also comparable across countries. We combine a cross-country panel data-
set spanning 16 general purpose technologies (such as electricity, railways, telephones and
motor cars) over 17 countries and 130 years with data on financial market development
over the same extended period of time.2 The long time span and extensive coverage across
1There is a related theoretical literature that links financial to economic development. See for example,Greenwood and Jovanovic (1990) and Acemoglu and Zilibotti (1997) for models where financial marketsreduce the risks associated with modern technologies inducing faster capital accumulation. These modelsdo not capture technology diffusion and innovation. Jovanovic and MacDonald (1994) model the risksfaced by entrepreneurs while the market settles in the final shape of innovations. Michalopoulos, Laevenand Levine (2015) develop a model of growth through innovation with a financial sector that screens newprojects. Unlike the focus of our paper, this paper emphasizes teh screening role of financiers instead ofits risk pooling role.
2Our core estimations focus on 17 countries with the most comprehensive data over this period,but we also show the consistency of our results with a broader set of 55 countries where we have less
2
countries and technologies allows us to examine the diffusion of technology both within and
across countries. A key challenge with such an analysis is untangling the extent to which
an observed correlation between financial market development and technology diffusion is
in fact causal. Our identification strategy therefore focuses on two types of cross sectional
variation to understand the causal impact of financial development on technology diffu-
sion. First, some of these technologies (such as the railroads or electricity generation) are
significantly more capital intensive to commercialize than others (such as the ring spindles
or radios) and hence more reliant on financial markets for their commercialization. By
exploiting cross-technology variation in the reliance on financial markets, we therefore
examine whether the relative rate of diffusion for more vs. less capital intensive technolo-
gies is greater in countries with deeper financial markets than in countries with less-well
developed financial markets. Second, as we point out in greater detail below, commer-
cializing technologies at their birth requires extensive experimentation by entrepreneurs,
as the customers, business models, and even the way the technology will be used is often
unknown. Indeed, there tends to be a consistent pattern of hundreds of new entrants into
these nascent markets that is then followed by a shakeout as the technology matures and
industry leaders emerge (Klepper, 1996, Klepper and Simons 2005). We exploit the fact
that the governance required to commercialize new ventures in these early periods is much
higher (and hence the need for well-developed local financial markets is much greater),
compared to later stages of an industry’s development when commercialization can more
easily take place through arms length financing of larger well-established corporations.
We therefore also examine the relative importance of local financial development on the
diffusion of technologies closer to their date of invention compared to when they are more
established.
We find that deeper financial markets in a country accelerate technology diffusion of
more capital intensive technologies. Importantly, however, this benefit of financial mar-
comprehensive data.
3
ket depth is only present in the early stages of a technology’s commercialization. These
results are robust to the inclusion of important control variables as well as a stringent set
of fixed effects. The difference in the importance of financial development for technology
diffusion in the early and late stages of the technology’s lifecycle is important in two
respects. From an econometric standpoint, it reduces concerns about unobserved hetero-
geneity driving the results, as this would likely have a consistent effect at all stages of a
technology’s life. From a substantive perspective, these results highlight the important
role of domestic capital markets in the diffusion of technologies in a country, particularly
in the early stages of the technology’s lifecycle. They are consistent with a view that in
addition to reducing frictions, deeper financial markets play a critical role in facilitating
the process of experimentation that is required for the adoption and diffusion of new
technologies close to their date of invention. While this mechanism has been explored
in the context of venture capital (Kortum and Lerner, 2000; Samila and Sorenson, 2010;
Nanda and Rhodes-Kropf 2010, 2011; Kerr, Nanda and Rhodes-Kropf, 2014), it has not
been examined in a larger cross-country setting and points to a potentially important
channel through which financial development affects economic growth Beck et al. 2000;
Levine 1997; Levine et al. 2000; Laeven et al 2015).
The rest of the paper is structured as follows. In Section 2, we use historical examples
to outline the mechanisms through which we believe financial market development impacts
the commercialization, and diffusion of new technologies. Section 3 relates these examples
to the data and identification strategy used in our empirical analysis. Section 4 presents
our main findings and robustness checks and Section 5 concludes.
4
2 Finance and the Commercialization of New Techno-
logies
Startup firms play a central role in the commercialization of new technologies (Akcigit and
Kerr, 2012). While the role of startups in the emergence of more recent industries such as
semiconductors, the internet and biotechnology is well known, historical accounts of the
commercialization of the railways, motor cars and other new technologies also illustrate
the important role of new firms. Indeed, Lamoreaux and Sokoloff (2007), writing about
US innovation from the 1870s to the present day, highlight that startups have played
a critical role in the development of cutting edge technologies for over a century. They
point out that while individual inventors played a disproportionate role in commercializing
their own innovations in the early and mid-1800s, the greater complexity and capital
intensity of new technologies being commercialized from the late 1800s onwards drove
an increasing amount of innovation to happen within the boundaries of new firms. For
example, they write that “most of the firms that invested heavily in R&D facilities in
the early twentieth century originated as entrepreneurial companies formed to exploit
the discoveries of particular inventors. Perhaps the most famous [example of such an
occurrence is the case of] General Electric, formed from a merger of two core enterprises
that had been organized by investors with the aim of commercializing the innovations of
Thomas Edison and Elihu Thompson.”
The increasing complexity and capital intensity of new technologies being developed
across the world from the late 1800s onwards created a key role for the financial markets
in helping to fund the commercialization of these innovations. In the context of the US
economy, Lamoreaux and Sokoloff (2007) point out that: “by the late nineteenth cen-
tury, it was clear to observers that technological change was a permanent feature of the
industrial economy and that substantial returns could be obtained through investing in
5
the development of frontier technologies. Railroads and telegraphy were perhaps the first
grand-scale examples of industries created or revolutionalized by important inventions,
but others such as electricity, telephones, steel, chemicals and automobiles soon followed.
An interest in these sorts of opportunities grew, technologically creative entrepreneurs
increasingly sought out investors (and vice versa) because the greater technical complex-
ity and capital intensity of new technologies meant that effective programs of inventive
activity and commercial exploration required more financial backing than before.”
As is still true to this day with early stage investors, much of the initial financing for
these startups “typically was raised informally from local backers, many of whom were
personally acquainted with the inventors involved” (p.14) For example, Lowell was a hot
bed of economic activity in the early nineteenth century and its growth, based on the
textile industry and immigrant labor, was extraordinary. The Boston Associates (a group
of rich investors who made their money in trade) provided finance for investment in the
mills and they are often considered to be the pre-history of venture capital. Lamoreaux,
Levenstein and Sokoloff (2007) provide a detailed study of Cleveland, Ohio, “a center
of inventive activity in a remarkable number of important industries, including electric
light and power, steel, petroleum, chemicals and automobiles”. They found that financing
and active involvement by wealthy angel investors often played an important role in the
success of these ventures. For example, George Eastman, the founder of the Eastman
Kodak Company first founded the Eastman Dry Plate Company in 1881, with the backing
of angel investor, Henry Strong, while the Ford Motor Company was founded in 1903 with
investments from twelve local angel investors.
The active role played in the governance of new ventures seems particularly important
early in the life of industries, when hundreds of new entrants are typically experimenting
with the way in which the technology will be put to use. Gort and Klepper (1982) and
Klepper and Simons (2005) have documented these patterns of entry across a wide range
of industries, including in televisions and automobiles. For example, Klepper (2007)
6
notes that while the motor car industry was dominated by just 9 firms by 1940, the
industry was characterized by widespread experimentation in its early years, with over
270 automobile startups in the 1909. Klepper notes that “the growth of the industry was
spurred by tremendous technological change. The original automobiles had low-power
steam, electric or gasoline engines. They were buggy-like contraptions with engines under
the body, tiller steering, chain transmissions, open bodies and hand-cranked starters”.
Some were designed for urban use while others were meant for rural settings. In fact,
in many instances early in the life on a new technology, it was even unclear what the
technology would be used for. Janeway (2012) notes that one of the early application of
the telephone was to broadcast entertainment to the home. He writes that “in the first
years of the 1890s, the Electrophone Company in London was offering concerts, opera,
music hall variety and even church services by subscription; the entertainments were
delivered to homes, hospitals and other venues via telephone”. On the other hand, “point-
to-point communication by wireless telegraphy served as the principal application of radio
communications until the introduction of public broadcasting after the First World War”!
Relatedly, Nye (1992) documents the several decade long search for commercially viable
applications of electric power.
Our hypothesis is that the depth of local financial markets and the ability of local
financiers to help commercialize these innovations was central to the rate and trajectory of
technology diffusion. While the importance of financial markets in the commercialization
and diffusion of new technologies over the past century has been documented in these
detailed accounts of particular industries, regions or periods of time, it has not been
studied in terms of a systematic role it might play in the rate of technology diffusion
across countries. In this paper, therefore, we address this issue by asking the following
question: Do cross-country differences in financial market development help to explain
differences in the degree to which new technologies are commercialized and diffuse across
countries? This question is of particular relevance, as technology adoption is increasingly
7
viewed as a key channel through which countries achieve economic growth, and hence,
may be an important (under-explored) mechanism linking financial market development
to subsequent economic growth.
3 Data and Empirical Strategy
A key challenge to such a study is the availability of the relevant data. We overcome this
challenge by combining three distinct types of data. First, we use measures of technology
diffusion from the CHAT data set introduced in Comin and Hobijn (2004, 2009, 2010).
This data set contains historical data on the diffusion of several major technologies over the
last 200 years across a large set of countries. We construct panel data at the technology-
country-year level, measuring the intensity with which each technology is used in each
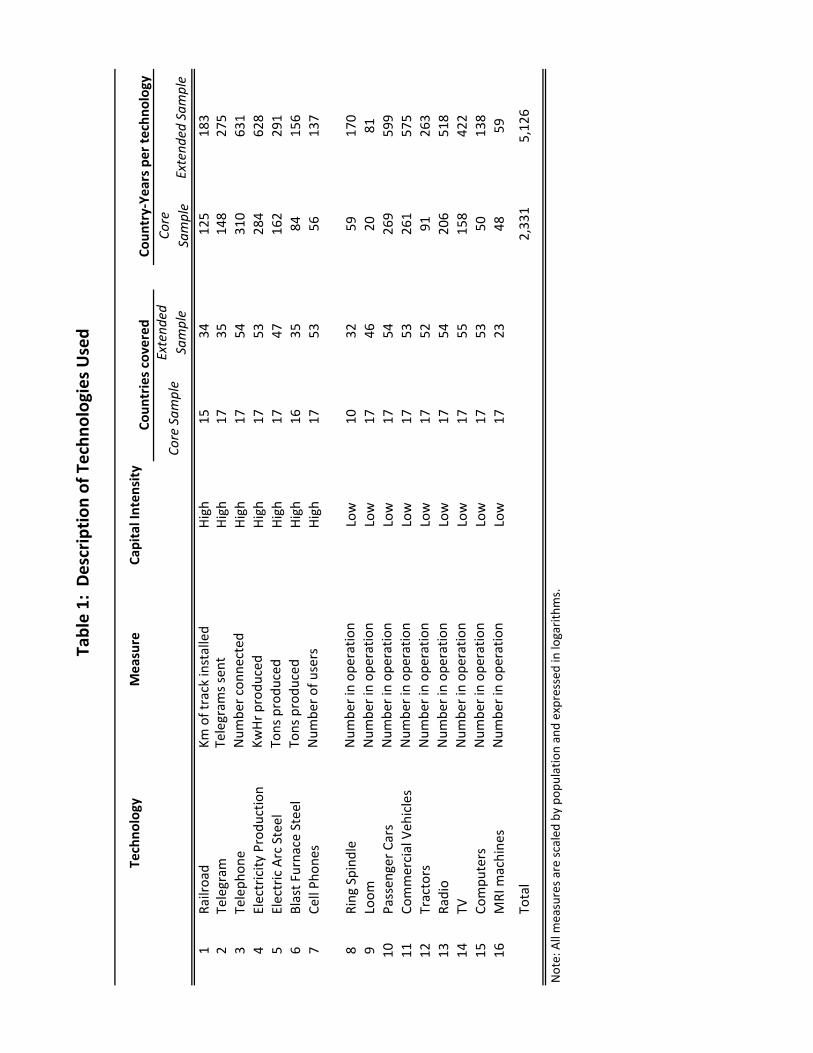
country over time. Table 1 lists the technologies we use. As can be seen from Table 1,
the set of technologies cover a wide span of sectors. This broad coverage should inform
us about the relevance of the mechanism explored in the economy. The heterogeneous
nature of the technologies explored is also reflected in their measures. Some technologies
embodied in capital goods (e.g., cars, computers, MRI machines) are measured by the
number of units in operation. Some technologies that capture the ability to produce
something (e.g., electric arc steel, electricity, telegraphic services) are measured by the
total production or by the number of users (e.g., cellphones). All measures are scaled
by population. We deal with the heterogeneity of measures in two ways. First, we take
logarithms of the per capita technology measures. This removes the units of the analysis
which go to the constant term. Second, we introduce a full set of technology-specific time
dummies that captures the average diffusion path for each technology. In addition, since
we are interested in understanding the diffusion of new technologies along the transition
path, we censor the data for each technology at the year when the level of technology
8

diffusion across countries becomes stable.
The second variable that is necessary for our analysis is a measure of domestic fi-
nancial development. Our primary measure of financial development comes from the
Jorda-Schularick-Taylor [J-S-T] Macrohistory database (Jorda et. al, 2017). We use the
measure of total loans to non-financial private sector (in nominal currency), scaled by
GDP (in nominal currency) in each year as our measure of financial development. These
data are available for only 17 countries, however, so we also use the ratio of deposits in
commercial and savings banks divided by GDP as a measure of financial development for
a larger sample of 55 countries to show the robustness of these results to a broader set of
countries. The source for data on bank deposits is Mitchell (2000).
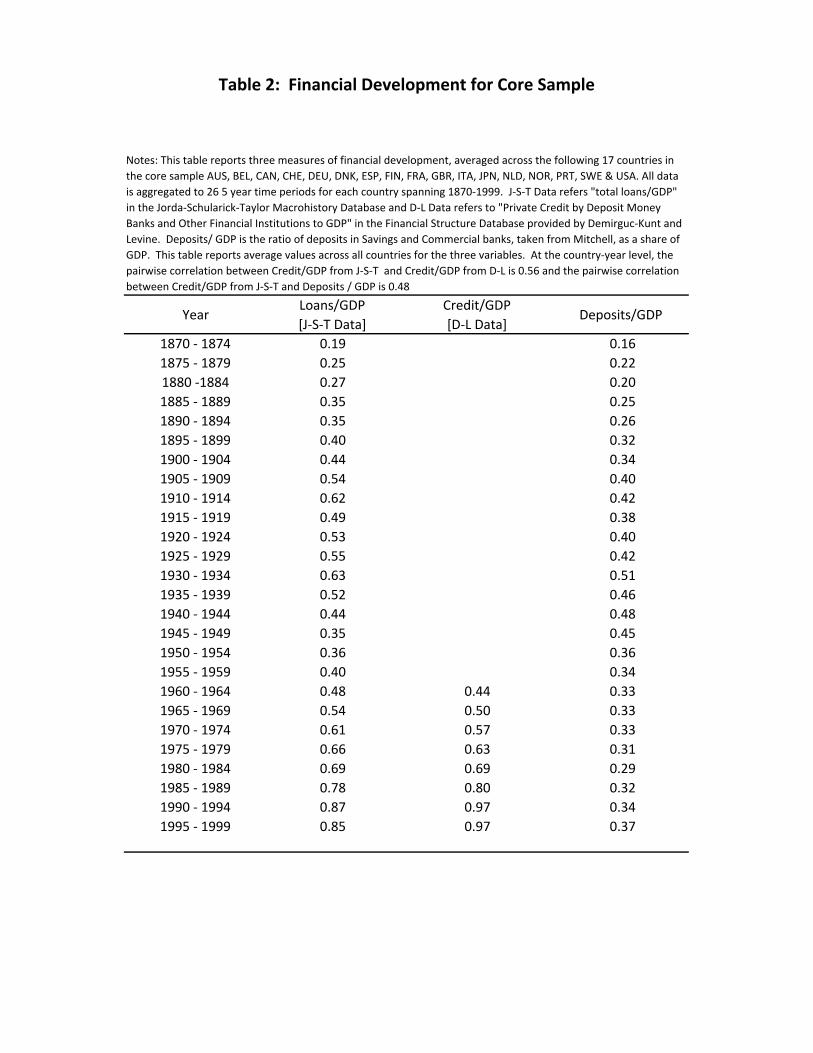
Table 2 provides descriptive statistics on our measures of financial market depth for
the 17 countries in our core sample. In addition to the two measures thatw e use in our
analysis, we also presnet for comparison purposes a measure of credit to GDP provided by
Beck et. al (2001) which is available for 1960 onwards. All three measures are positively
correlated, with the two credit measures in particularly correlated at 0.56. This gives us
confidence in our measure of financial market depth. Aside from the practical advantage
of bank credit data being available for such a long time period, we believe that the depth
of the banking sector is also a substantively useful proxy for several of the functions that
financial markets provide (Levine, 1997). At the most basic level, the banking sector
depth measures the degree to which savings are mobilized towards the availability of
funds for credit, which, as was outlined above, was a key way through which startups
were funded, either through angel investments or through institutionalized sources of
finance. Better developed financial markets also reduce intermediation costs, facilitate
risk management, as well as play a role in governance, all of which are critical factors for
helping to commercialize new technologies.3
3We see bank credit and deposits as a proxy for the overall level of financial development, not justthat of the banking sector. Nevertheless, it is also worth noting that there is growing evidence that banksplay a (surprisingly) large role in directly financing innovation(e.g. Mann (2014), Chava et al (2013),
9
The third variable we need to conduct our analysis is the classification of technologies
based on their capital intensity. In our analysis, we exploit the fact that some technologies
are more capital intensive than others and hence will need to depend more on external
finance for their commercialization. Because of that, the financial market development
will accelerate the diffusion of capital-intensive technologies to a greater degree than those
that are less capital-intensive. Note that, measuring the capital intensity of technologies,
rather than industries, facilitates our analysis, since the capital intensity of technologies
is a truly technological attribute and therefore it is likely to be more stable over time and
across countries than the capital needs of the companies in an industry.
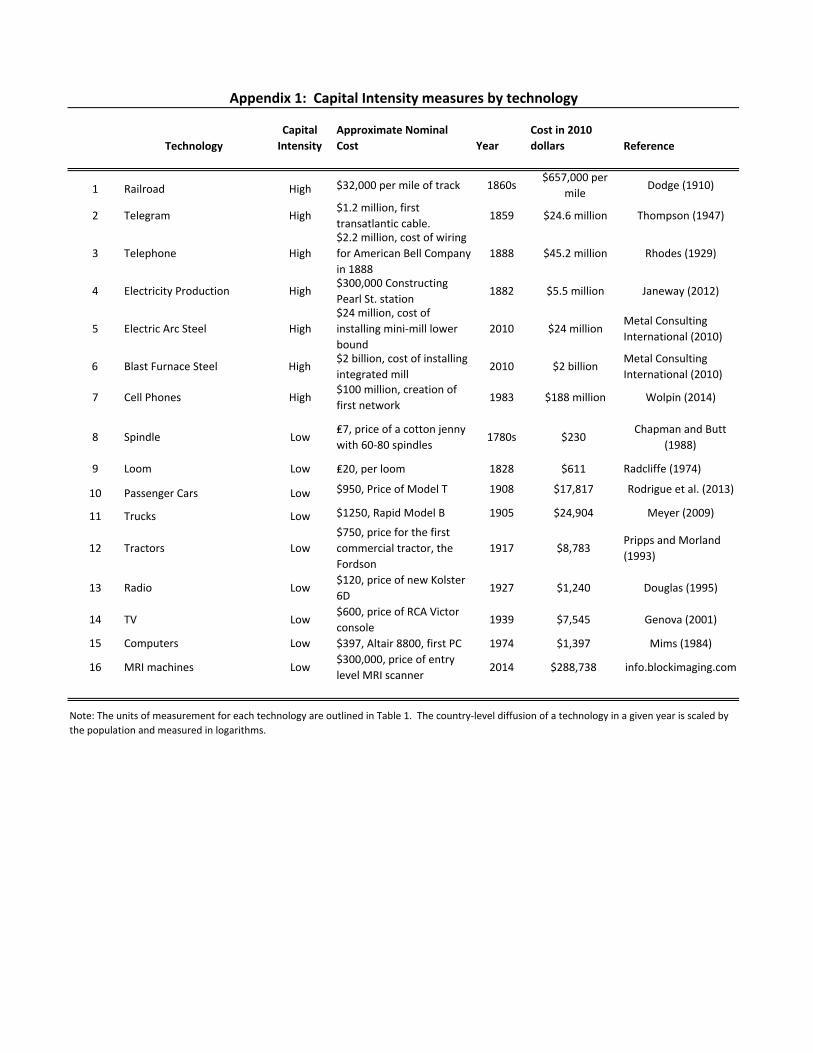
The classification of technologies according to their capital intensity is outlined in Ta-
ble 1. Appendix 1 provides detail on the sources, measures and coverage of the different
technologies. Despite our efforts, it is impossible to obtain precise estimates about the
costs of these technologies that apply universally to all countries and time periods. Howe-
ver, we believe that the differences in the costs of acquiring the capital intensive vs. less
capital intensive technologies are large enough that they dominate the potential measure-
ment error that the exercise is bound to have. We consider that the more capital intensive
technologies are railways, telegraphy, telephones, electricity production, the production
of steel with electric arc and blast oxygen furnaces, and cell-phone communications. The
less capital intensive technologies are technologies that are embodied in smaller machines
and in consumer durables such as ring spindles, automatic looms, cars, trucks, tractors,
radios, TVs, computers and MRI machines.
Our baseline econometric specification therefore takes the form:
yict = ηit + φc + β1Xct + β2FINct + β3(FINct ∗DEPi) + εict. (1)
where yict denotes our measure of the adoption of technology i in country c at time
Nanda and Nicholas (2014)). See Kerr and Nanda (2015) for a review.
10
t. To allow for the fact that technologies follow different diffusion paths as well as to ac-
count for the fact that we measure different technologies using different units, we include
a full set of technology-times-year fixed effects, denoted by ηit in our regression specifi-
cation. Effectively these fixed effects imply that our dependent variable is the deviation
of a country’s adoption of a technology from the average adoption of that technology
across countries in each period. Many of the concerns related to confounding factors in
cross-country econometric studies are country–specific (and, to a first order, symmetri-
cally affect the adoption of all kind of technologies). We therefore include country-fixed
effects, denoted by φc, to control for other country-specific factors that might impact the
rate of diffusion of technologies. Xct is a vector of time-varying control variables such as
income per capita, a country’s stock of human capital, and the adoption of complementary
technologies, that also impact technology diffusion. FINct is our time-varying measure
of financial market depth (i.e., loans to GDP ratio) across countries. Hence β2 measures
the relationship between financial market depth and country’s relative rate of adoption
of technologies.
Given concerns about endogeneity and omitted variables that may bias this relati-
onship, our main coefficient of interest is β3, which is the coefficient on the interaction
between financial market depth and an indicator variable for whether a given technology
is highly capital intensive to commercialize. It therefore measures a country’s relative rate
of adoption of more vs. less capital intensive technologies. Our identification hinges on
the assumption that our indicator variable creates a substantive distinction between the
capital needs required for the commercialization of new technologies, and furthermore,
does not confound any other mechanism that may also cause these technologies to be
grouped together and that happens to be the true driver of faster technology diffusion in
deeper capital markets.
More specifically, three assumptions are necessary for the validity of our identification
strategy. (i) Loans to GDP ratio is a good measure of financial market development;
11
(ii) any factor that differentially affects the diffusion of capital-intensive (vs. non-capital-
intensive) technologies is not correlated with financial market development, and (iii) our
classification of technologies truly captures their capital intensity and not something else
that correlates with capital-intensity. Below we discuss the validity of these assumptions.
For all the variables used in our analysis, we compute five-year averages and use non-
overlapping data in our regressions. Taking these five year averages increases the signal-
to-noise ratio of our variables and, a priori, does not reduce much of the relevant variation
in the data since both technology diffusion and financial market depth are relatively low
frequency phenomena.
4 Empirical Results
4.1 Basic Results
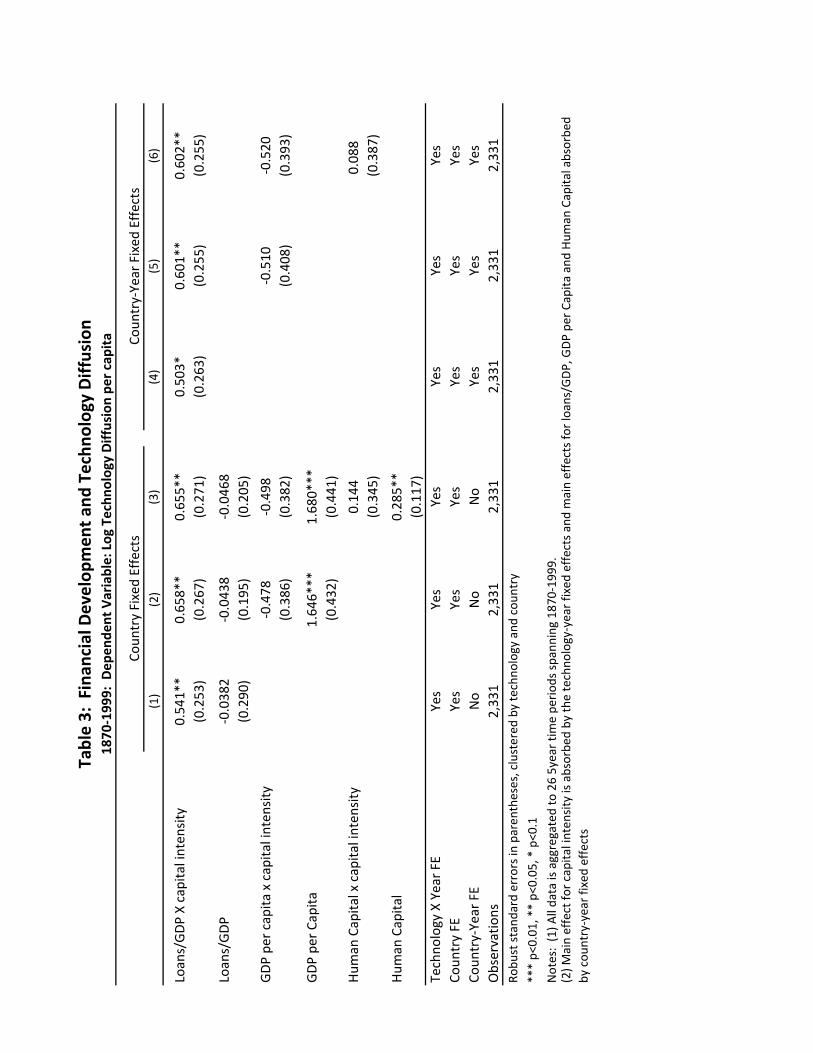
Table 3 reports the results from our baseline regression. As can be seen from column 1 of
Table 3, the level of financial development (second row) is insignificantly correlated with
the speed of technology diffusion. More importantly, the association between financial
market development and technology diffusion is larger for capital intensive technologies.
To understand the economic magnitude of these coefficients, we conduct the following
exercise. We first run our baseline regression in column 1 of Table 3, but only including
the set of Technology x Year and Country Fixed Effects as explanatory variables. We com-
pute the standard deviation of the residuals from this regression, to understand variation
remaining in our dependent variable, once we account for fixed effects in our analyses.
We next run the a regression with FINct ∗DEPi as dependent variable on the same set
of dummies. We compute the standard deviation of the residuals from this regression
and interact them with β3, the coefficient on FINct ∗ DEPi in Table 3. Dividing this
interaction by the standard deviation of the residuals from the first regression provides
12
us with an estimate of the share of one standard deviation in technology diffusion that is
explained by a one standard deviation change in FINct ∗DEPi. This calculation yields
an estimate of 14%, suggesting that the size of the relationship is non-trivial.
Thus far, we have shown that there is a significant positive association between the
level of financial development and the differential diffusion of technologies that are capi-
tal intensive and that the economic magnitudes are not trivial. We now discuss various
hypotheses about the origin of this association with the hope that the discussion brings us
closer to uncovering a causal link between financial development and technology diffusion.
One concern that typically arises in cross-country empirical analysis is that of reverse cau-
sality. In our context, this means that our baseline results may not indicate that financial
development fosters technology adoption but rather that technology adoption leads to the
development of financial institutions. One formulation of this reversed mechanism is that
technology adoption increases income, and in richer societies there is a higher supply of
financial resources (in this case more credit relative to GDP).
Alternatively, the adoption of capital-intensive technologies could lead to an increase
in investment (for a given income) and that could in turn spur financial development.
However, the total amount of investment involved in the adoption of our technologies is
not necessarily correlated with their capital intensity. Take for example computers since
the 1990s or cars since the 1920s. Though not very capital-intensive, investment in these
capital goods represented a significant portion of total investment in the economy during
these time periods. Hence, there is little reason to believe that it is precisely the adoption
of capital intensive technologies what stimulates investment and, through this channel,
the development of financial markets.
One way to study this reverse causality hypothesis more systematically is to control for
per capital income and by allowing per capita income to affect differentially the diffusion
of capital intensive technologies. The rationale for this strategy stems from the fact
that investment-output ratios are highly correlated with income at high and medium
13

term frequencies (see, e.g., Prescott, 1984 , and Klenow and Rodriguez-Clare, 1997).
If this correlation is driven by the expansion of capital intensive industries, allowing
for a differential effect of income on the diffusion of technologies in capital intensive
industries should capture the reverse channel of technology diffusion on financial market
development. Column 2 of Table 3 implements this exercise. While GDP per capita is
associated with technology diffusion, we find that per capita income is not differentially
associated with the diffusion of capital intensive technologies. Furthermore, allowing for a
differential effect of income on capital intensive technologies does not affect the significance
of the differential association between financial development and the diffusion of capital
intensive technologies.4
Another variable variable that may impact the estimates of β3 is human capital. If
financial marketd evelopment favors the accumulation of human capital and human capi-
tal is more relevant for the diffusion of capital-intensive technologies, we could observe a
differential correlation between financial market development and the diffusion of capital-
intensive technologies. To explore whether the estimates of β3 in Table 3 reflect this
mechanism, we control in column 3 for the level of human capital and the interaction
between human capital and capital intensive technologies. We measure human capital
by the secondary enrollment rate. This exercise yields two findings. First, we find no
significant complementarity between human capital and the capital intensity of techno-
logies. Second, we find that the estimates of β3 are completely robust to controlling for
human capital. Therefore, we do not find evidence that any potential link betwen financial
market development and human capital are behind the point estimates of β3.
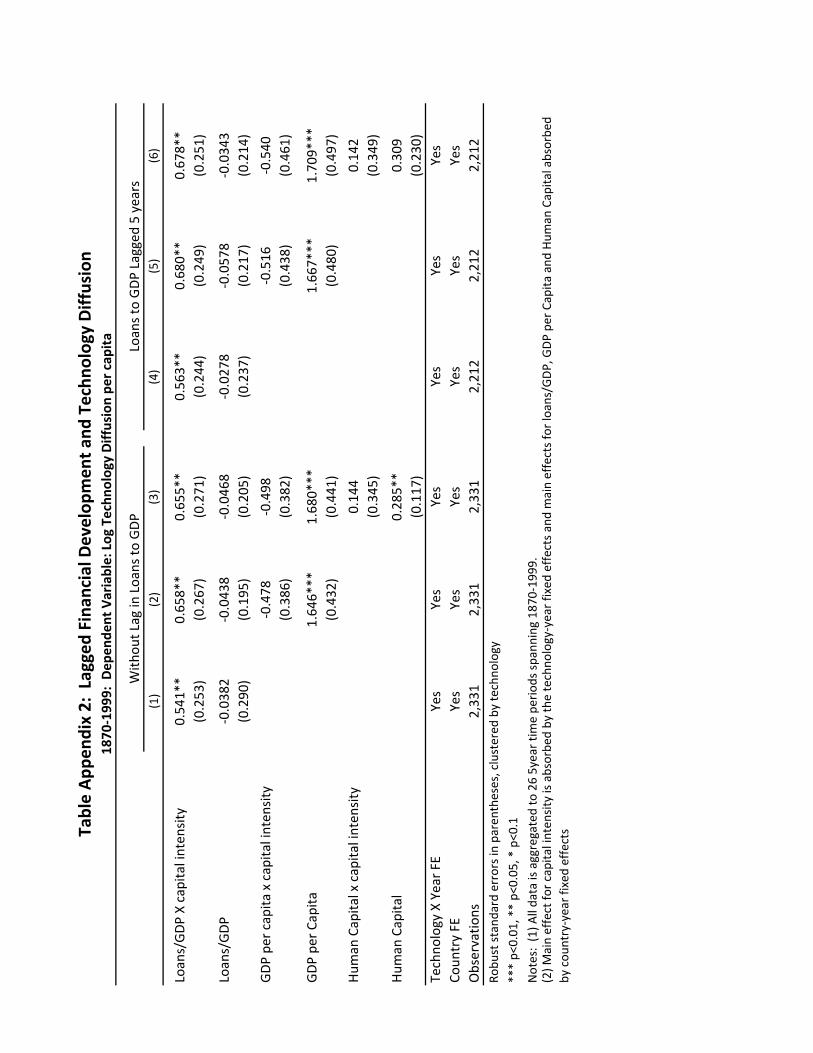
In columns 4-6 of Table 3, we include country x time period fixed effects so that we now
absorb any time-varying unobserved heterogeneity at the country level. Our coefficient of
interest attenuates very slightly, but continues to remain statistically significant and with
4In Appendix 2, we also report the results from regressions where we look at lagged financial develop-ment. Our results continue to remain robust using this specification.
14
an equivalent economic magnitude, suggesting that our time varying control variables
have addressed the relevant sources of omitted variable bias.
4.2 Late vs. Early Stage of Technology’s Lifecycle
In the previous section, we have documented that the diffusion of capital-intensive techno-
logies is more correlated with financial market development as measured by the loans to
GDP ratio than the diffusion of less capital-intensive technologies. At this point, the
reader may note that this finding is reminiscent of the key finding by Rajan and Zingales
that financial market development favors the growth of industries where there is a greater
external finance need (i.e. a greater gap between current cash flows and current invest-
ments, which may proxy for future expected cash flows). To the extent that technologies
are embodied in new capital, as it is the case with some of the technologies in our dataset,
and if capital inetnsity proxies for external finance need, equation (1) can capture the
Rajan-Zingales mechanism.
There are, however, other mechanisms that could be consistent with the estimates in
Table 3. Suppose for example that deep local credit helps adopters to lower the risk from
implementing technologies early in their diffusion process where there is much uncertainty
about the evolution of the technology and about the demand for the goods and servcies
associated with the technology. This mechanism is also consistent with equation (1) and
with the estimates from Table 3.
A natural question is whether we can empirically identify the Rajan-Zingales me-
chanism from the effect of financial markets in the reducing uncertainty faced by early
adopters. One significant difference between these two hypotehses is that, for a given level
of external finance need, the Rajan-Zingales mechanism applies to any form of capital re-
gardless of how long ago the technology (that embeds) was invented. In contrast, the risk
from uncertainty about the nature of demand and technology faced by adopters seems to
15
be much larger early on than when the market and the technology have matured.
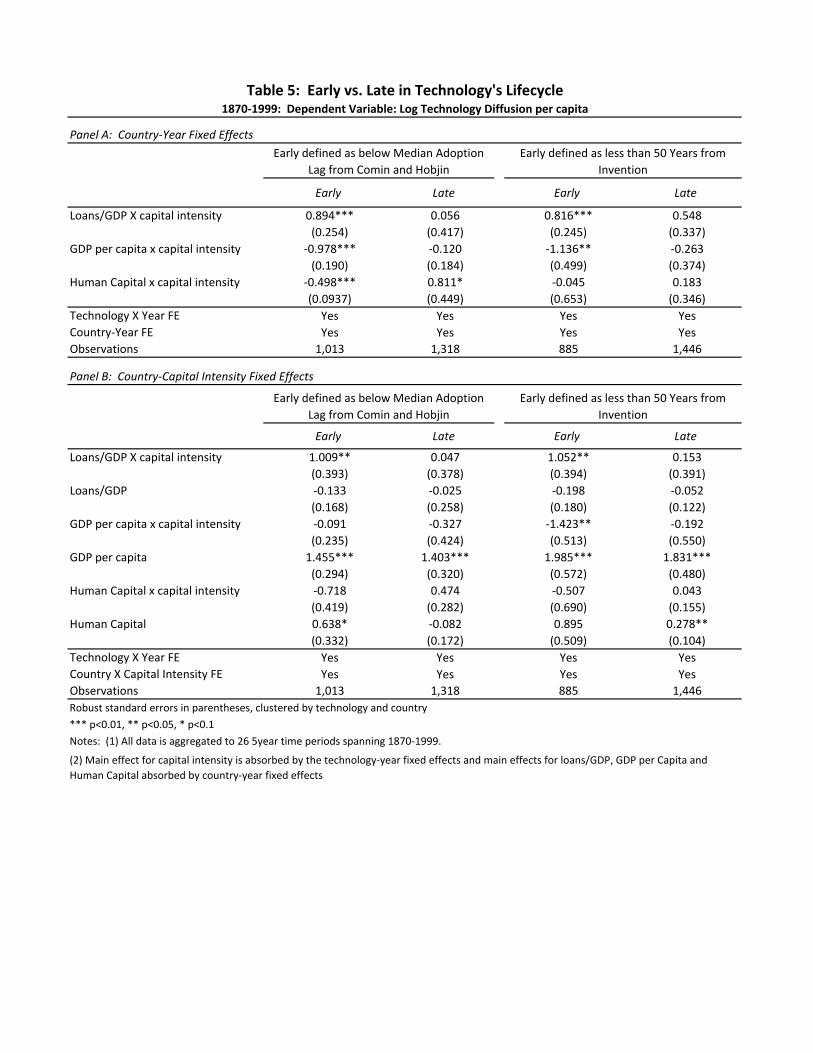
To obtain a better understanding of the mechanism that drives our findings, we divide
our sample between the early and the late stages of technology diffusion. We implement
this division using two distinct criteria. First, we split our sample into periods before and
after 50 years from the invention of a technology. Thus, for each technology and country,
the early adoption period comprises the periods prior to the invention year plus 50, and
the late adoption, the periods afterwards. Second, we use the estimates of the adoption
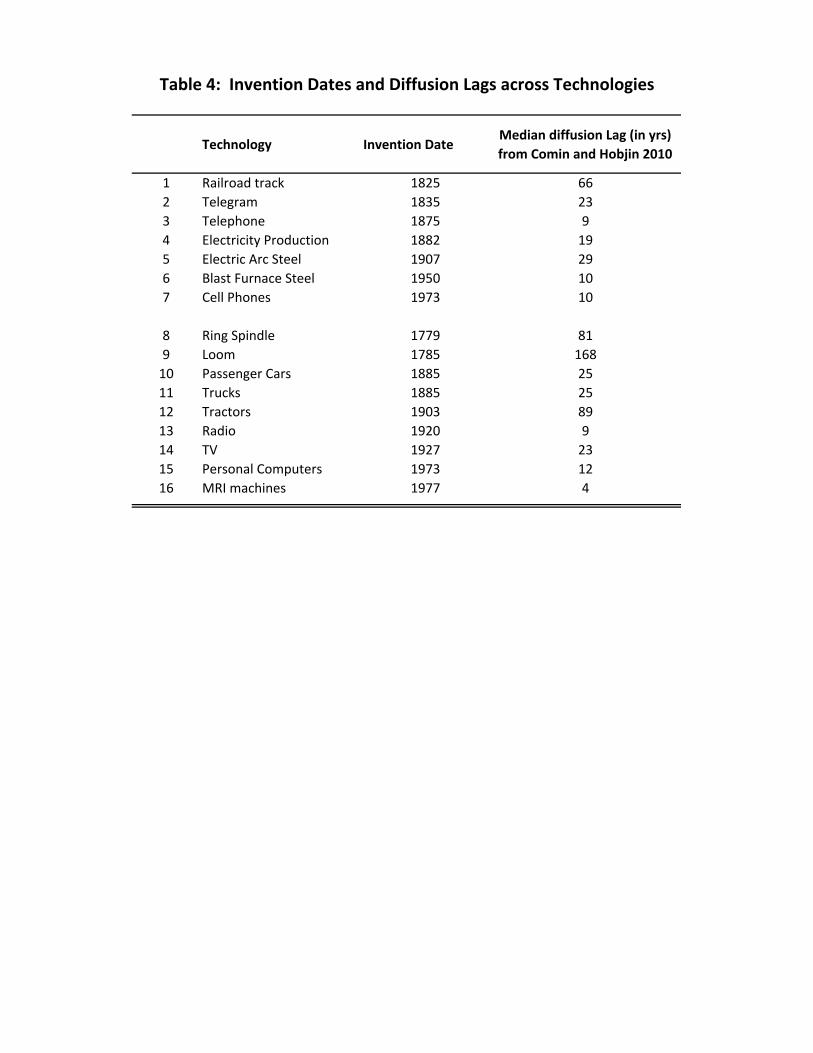
lags for each technology-country pair from Comin and Hobjin (2010). We define the early
adoption stage as the period between the invention of the technology and the median
adoption date for all the countries in sample for that technology. The late adoption stage
comprises the subsequent years. Table 4 outlines the invention dates, and technology
lags from Comin and Hobjin (2010). Note that, a key difference between these two
classifications is that in the first the length of the early adoption stage is the same across
technologies, while in the second it varies. Also note that early adopting countries will
tend to have their diffusion process split in both samples, with the early stage covering
the initial observations and the late stage covering diffusion once the technology is more
widespread worldwide.
Table 5 presents the results for the two diffusion stages. We find that financial market
development affects the diffusion of technology only in the early stages of diffusion. This
is true both for splits made using a cutoff of 50 years from the invention of all technologies
as well as a more nuanced split based on the median adoption lag for each technology as
outlined in Table 4. In Figure 1, we report the results from dynamic specifications where
we look at the relative importance of financial development in the diffusion of more capital
intensive technologies, but do so for a series of time periods with successively increasing
time from invention. This dynamic specification provides further evidence that the effects
we measure are most important early in the life of the technology, in years closest to the
invention.
16
The lack of association between financial market development and the diffusion of
capital-intensive technologies for late adopters is hard to reconcile with the reversed cau-
sation hypothesis. If adopting capital-intensive technologies caused the development of
financial markets, why don’t we see a similar association between these two variables for
both early and late adopters? On the other hand, the fact that the effect is much more
salient in the early stages of a technology’s lifecycle highlights the particularly important
role of domestic capital markets in the initial diffusion of technologies. One natural in-
terpretation of this finding is that local financial market development may facilitate the
experimentation required with helping to commercialize new technologies.
4.3 Omitted Variables
Aside from reverse causality which we address through our time-varying controls, there
may be concerns that an omitted variable that is correlated with our interaction term
(i.e., financial development * capital intensity) may be driving technology diffusion. Next
we argue that our findings are unlikely to be driven by the omission of a relevant va-
riable and instead they are substantive. Many of the sources of omitted variable bias
stem from factors that have been shown to predict long-term cross-country differences in
development such as culture (Guiso, Sapienza and Zingales, 2008, and Tabellini, 2009),
geography (Sachs and Warner, 1995) and the quality of institutions (Acemoglu, Johnson
and Robinson, 2001). However, they typically do not have predictive power over develop-
ment measures at higher frequencies once we include country-fixed effects which control
for persistent country-level characteristics as we do.
For an omitted variable to drive our findings, it would have to be correlated with finan-
cial development and differentially affect the diffusion of capital intensive technologies.
While many of the channels through which an omitted country-level factor affects
technology diffusion are likely symmetric across technologies, certain geographical varia-
17

bles could have a differential effect on the diffusion of capital intensive technologies. Take
for example country size. Since the diffusion of certain capital intensive technologies such
as telephone lines or railways often require large sunk costs and lead to network externali-
ties one could argue that larger countries may be more prone to adopting intensively these
technologies than small countries. Similarly the ruggedness of the terrain may also affect
the costs of setting up the networks involved in the diffusion of these capital intensive
technologies.
All these geographical variables are arguably constant. Therefore, we could collectively
capture their effect on technology diffusion by interacting the country fixed-effects with
the capital intensity indicator. This set of dummy variables also captures any differential
effect of other variables that are fixed at the country-level on the diffusion of capital-
intensive technologies. Therefore, the dummies capture the potential effect of certain
institutional traits such as property right protection or the rule of law that are persistent
but might differentially impact more capital intensive technologies.
As can be seen from Panel B of Table 5, the inclusion of the set of country-dummies
interacted with our capital intensity indicator does not significantly alter our estimates of
the effect of financial market development on technology diffusion. In fact, the estimated
effect of financial development x capital intensity increases marginally for the early years.
Overall, our results suggest that fixed country-level characteristics that affect differentially
the diffusion of capital-intensive technologies do not account for our findings.
We note also that our specification include interactions between per capita income and
capital intensity as well as the interaction between human capital and capital intensity.
The former provides a control for many omitted variables that tend to be correlated with
income. For example, suppose capital-intensive technologies had different Engel curves
than less capital-intensive technologies. Allowing the log of per capita income to have a
differential effect on the adoption of capital-intensive technologies addresses this concern.
The robustness of our results to including the interaction between income and capital
18

intensity suggests that the differential effect of financial depth we identify is distinct from
other channels that operate through proxies of development. The interaction between
this measure and capital intensity controls for the possibility that more capital intensive
technologies may systematically depend on more, or less, on human capital, which could
bias our estimates. We observe no differential effect of human capital on the diffusion of
capital-intensive technologies.
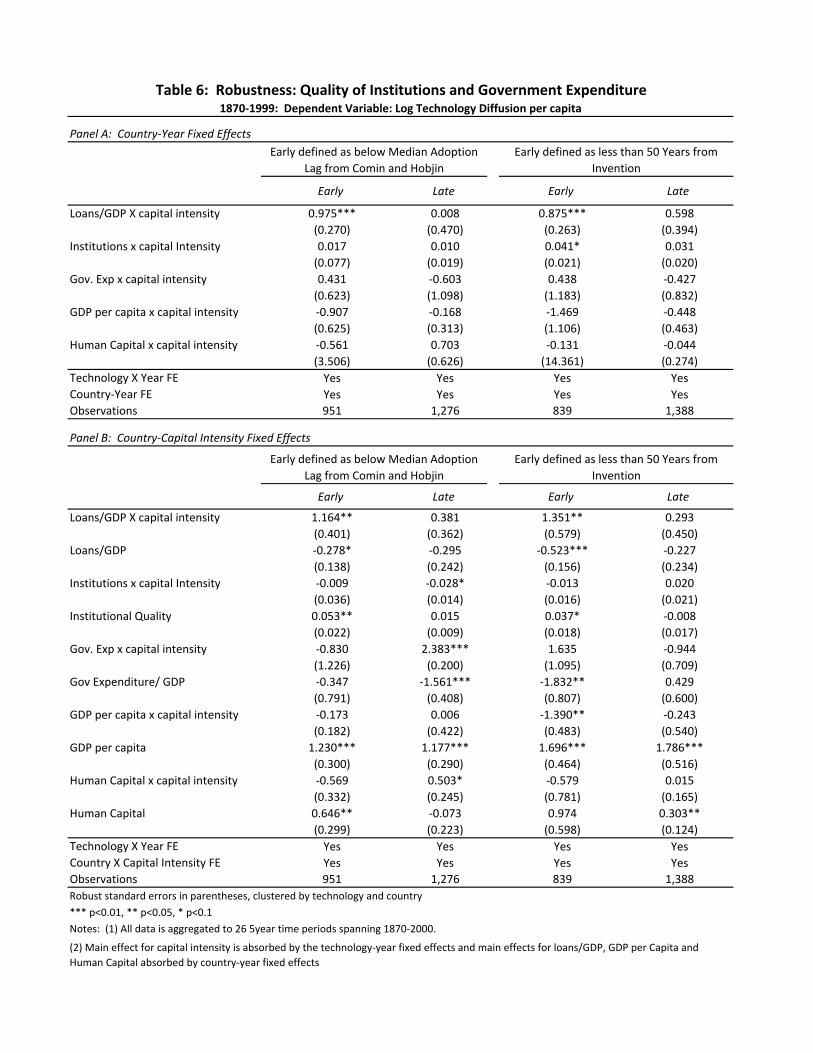
Another argument that could be made in this regard is that capital-intensive techno-
logies may also benefit more from government involvement in the economy since this
involvement may be directed towards building or financing the infrastructures required
for these technologies to diffuse. If government investment in infrastructures was correla-
ted with financial market development, omitting government investment measures would
bias our estimates. In Table 6, we therefore include a time varying measure of government
expenditure, available from Jorda et. al (2017) and a measure of the quality of political
institutions, available from the Polity IV Project and find our results are robust to the
inclusion of these controls and their interaction with our measure of financial development.
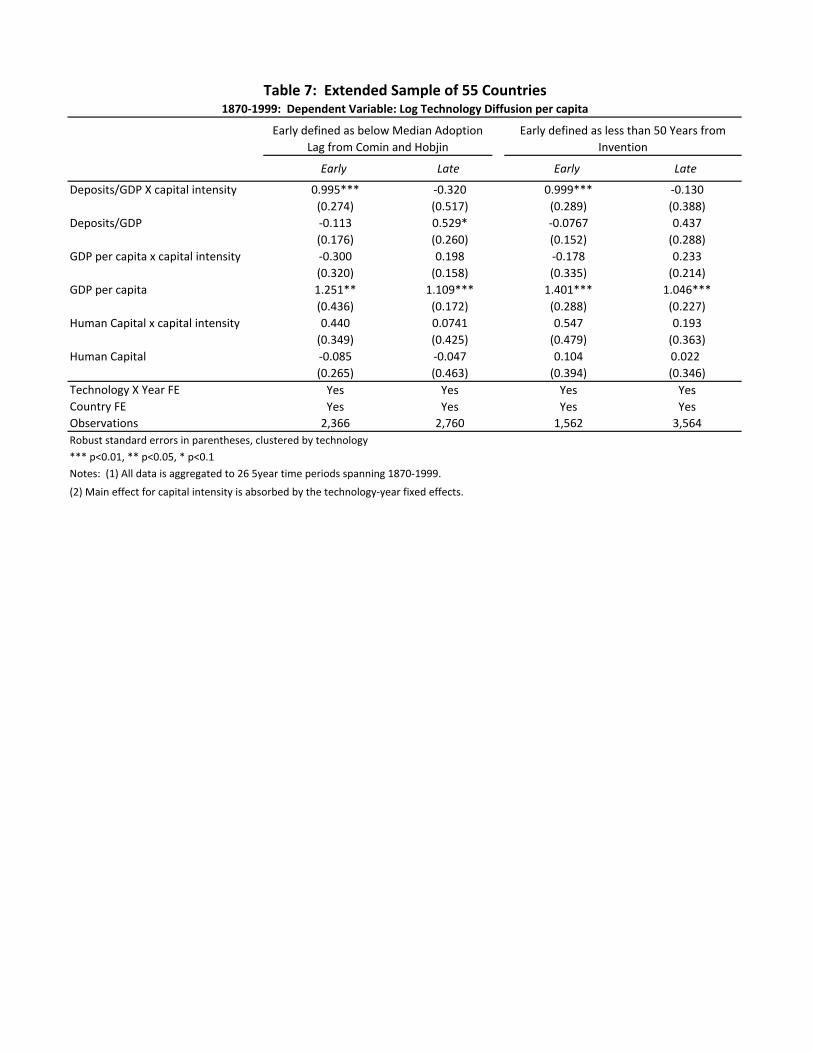
One caveat of our analysis is that the sample of countries is quite limited due to con-
straints imposed by the data on financial market development. To explore the robustness
of our findings to the sample, we adopt as measure of financial market development the
deposits to GDP ratio instead of the loans to GDP ratio. Admitedly, this measure cap-
tures the liability side of banks while loans reflects the asset side of the banks which is
closer to our mechanism. Note however that both side of the banks balance sheet must
balance, hence deposits should be informative about the banks ability to issue loans. As
a result of this change, we can extend the analysis from 17 countries to 55. Table 7 shows
the estimates of regression (1). The key finding is that the estimates of β3 do not change
with the new sample and financial development measure. This suggests that our findings
are more general than the limited country sample we consider in the baseline regressions.
19

4.4 Alternative interpretations of the classification
An assumption we have explicitly made to identify the role of financial markets on techno-
logy diffusion is that the classification of technologies according to their capital-intensity
does not proxy for other classifications of technologies. That is, that there is no omitted
variable in the capital intensive classification.
A possible classification that is correlated with ours is based on whether the techno-
logies are tradable. It is easy to see that all the technologies in the less capital-intensive
group are traded, while some technologies in the more capital-intensive group such as
KMs of railroad tracks laid, telegrams sent, telephones installed are non-traded. Tradable
technologies are directly embodied in goods whose import may be easier when importers
have access to credit. Therefore, if this is the channel by which financial development
affects technology diffusion, we should observe a positive differential effect of financial
development on the diffusion of tradable technologies vs. non-tradable ones. To the ex-
tent that tradability is associated with less capital intensity, we find the exact opposite.
Therefore, this is clearly not the mechanism we have identified in our analysis.5
Finally, we have observed that though human capital tended to matter in the diffusion
of technology (see Table 3), but we did not find that it mattered more for the diffusion
of capital intensive technologies. This suggests, a priori, that our classification based on
capital intensity does not capture the degree of complementarity with human capital of
the technologies. Inspection of the classification supports this conclusion.6 Technologies
whose operation require significant human capital, such as computers or MRI are in the
less capital-intensive group.
The number of possible technology-classifications is extremely large and we cannot go
through all of them. But given this evidence, we feel confident that our classification of
5Furthermore, there is no apparent reason why tradability should matter only in the initial stages ofadoption.
6A similar argument implies that the capital-intensity classification is not proxying for whethergoods/services are superior (i.e., have higher income elasticity of demand).
20
technologies based on their capital intensity is not proxying for alternative classifications of
technology. Furthermore, we hope to have convinced the reader that the differential effect
that financial development has on the diffusion of capital-intensive technologies in the early
stages of technology diffusion of the leading countries, is evidence of the importance of
local access to financial markets by the companies that develop new products and services
that embody the specific new technologies.
5 Conclusions
Prior work looking at the role of financial market development in productivity and eco-
nomic growth has largely focused on the role of better developed financial markets in
allocating capital efficiently across investment opportunities. In this paper, we provide
evidence for another key role played by well-developed financial markets: reducing the
frictions associated with the adoption and the diffusion of new technologies. We use a
cross-country panel dataset that covers the diffusion of 16 major technologies across 130
years to examine whether greater depth in the banking sector leads to faster diffusion of
these new technologies.
Our results provide compelling evidence that banking sector depth facilitates the faster
diffusion of more capital intensive technologies. This effect operates in the early stages
of diffusion and in the early adopters of technology. In contrast, we find no differential
effect of financial depth on the diffusion of capital-intensive technologies in the late stages
of diffusion or in late adopters.
While not conclusive, this evidence suggests that a potentially important role of finance
is to facilitate the experimentation required to overcome the initial hurdles around the
adoption and diffusion of new technology. This mechanism has begun to be explored
more deeply in the context of financial intermediaries such as venture capital investors
who facilitate technology commercialization today, but it has not been examined more
21
broadly as a driver of technology diffusion across countries. Our evidence suggests an
opportunity for further research to deepen our understanding of this potentially important
mechanism relating financial development to economic growth.
References
[1] Acemoglu, Daron, Simon Johnson and James A. Robinson, 2001. ”The Colonial Ori-
gins of Comparative Development: An Empirical Investigation,” American Economic
Review, vol. 91(5), pages 1369-1401, December
[2] Acemoglu, Daron, and Fabrizio Zilibotti, 1997. “Was Prometheus Unbound by
Chance? Risk, Diversification, and Growth.” Journal of Political Economy, 105(4),
709-751
[3] Aghion, P., T. Fally, and S. Scarpetta. 2007. “Credit constraints as a barrier to the
entry and post-entry growth of firms.” Economic Policy, 22, pp. 731-79.
[4] Aghion, P., and P. Howitt. 1992. “A Model of Growth through Creative Destruction.”
Econometrica, 60, pp. 323-51.
[5] Alcoa Inc., Alcoa’s 125 Years Company Website 2014.
[6] Archer, G, History of Radio to 1926 (New York: American Historical Society, Ame-
rican Book, Stratford Press, 1938).
[7] Beck, T. and R. Levine. 2002. “Industry growth and capital allocation: Does having
a market - or bank - based system matter?” Journal of Financial Economics, 64:2,
pp. 147-80.
[8] Beck, T., R. Levine, and N. Loayza. 2000. “Finance and the sources of growth.”
Journal of Financial Economics, 58:1-2, pp. 261-300.
[9] Beemer, Rod, Chester, Peterson. Ford-N-Series-Tractors. 1997. Print
[10] Bertrand, M., A. Schoar, and D. Thesmar. 2007. “Banking deregulation and industry
22

structure: Evidence from the French banking reforms of 1985.” Journal of Finance,
62:2, pp. 597-628.
[11] Cetorelli, N. and P. E. Strahan. 2006. “Finance as a barrier to entry: Bank compe-
tition and industry structure in local U.S. markets.” Journal of Finance, 61:1, pp.
437-61.
[12] Chapman, S. D., and J. Butt. 1988. “The Cotton Industry, 1775–1856.” In Studies in
Capital Formation in the United Kingdom, 1750–1920, edited by Charles H. Feinstein
and Sidney Pollard, 105–25. Oxford: Clarendon Press, 1988.
[13] Chava, S, A. Oettl, A. Subramanian and K Subramanian 2013. “Banking Deregula-
tion and Innovation.” Journal of Financial Economics, 109, pp. 759-774.
[14] Comin, D. and B. Hobjin 2004 “Cross-Country Technology Adoption: Making the
Theories Face the Facts.” Journal of Monetary Economics, 51(1), pp. 39-83
[15] Comin, D. and B. Hobjin 2009 “The CHAT Dataset.” HBS WP 10-035.
[16] Comin, D. and B. Hobjin 2009 “Lobbies and Technology Diffusion.” The Review of
Economics and Statistics, 91(2), pp. 229-244
[17] Comin, D. and B. Hobjin 2010 “An Exploration of Technology Diffusion.” American
Economic Review, 100(5), pp.2031-59.
[18] Demirguc-Kunt, A. and R. Levine 2001 “Financial Structure and Economic Growth:
A Cross-Country Comparison of Banks, Markets, and Development, ” MIT Press.
[19] Dodge, Grenville, How We Built the Union Pacific Railway and other Railway Pa-
pers and Addresses presented by the author to the New York Public Library on 24
October, 1910
[20] Duncan, Geoff. Ed Roberts, Maker of First Successful Personal Computer, Dies at
68. Digital Trends April 2, 2010. Web Article.
[21] Douglas, A. 1995. Radio Manufacturers of the 1920’s: Vol. 2 Sonoran Pub.
[22] Galloway, John D. The First Transcontinental Railroad: Central Pacific, Union Pa-
cific (New York: Simmons-Boardman, 1950).
23

[23] Genova, T. 2001. “Television History – The First 75 Years.” April 9, 2001. Web
Article.
[24] Gort, M. and S. Klepper. 1982. “Time Paths in the Diffusion of Product Innovations
” Economic Journal, 92, pp.630-53.
[25] Greenwood, Jeremy, and Boyan Jovanovic. 1990. Financial Development, Growth,
and the Distribution of Income. Journal of Political Economy, vol. 98, no. 5, pp.
10761107.
[26] Guiso, L., Sapienza, P., and L. Zingales. 2004. “Does local financial development
matter?” Quarterly Journal of Economics, 119:3, pp.929-69.
[27] Guiso, L., Sapienza, P., and L. Zingales. 2006. “Does Culture Affect Economic Out-
comes?” Journal of Economic Perspectives, 20:2, pp.23-48.
[28] Hamilton, Robert. Hospitals to Share Costly Equipment. The New York Times. July
31, 1988. Web Article.
[29] French, Gilbert, The Life and Times of Samuel Crompton of Hall-in-the Woods,
Inventor of the Spinning Machine Called the Mule (Manchester: Charles Simms and
Co, 1862).
[30] Ichino, A and G. Maggi. 2000. “Work Environment and Individual Background:
Explaining Regional Shirking Differentials in a Large Italian Firm” Quarterly Journal
of Economics, 115:3, 1057-90.
[31] Janeway, W. 2012. “Doing Capitalism in the Innovation Economy ” Cambridge Uni-
versity Press, Cambridge, UK.
[32] Jayaratne, J. and P. E. Strahan. 1996. “The finance-growth nexus: Evidence from
bank branch deregulation.” Quarterly Journal of Economics, 111:3, pp. 639-70.
[33] Jorda, O, M. Schularick, and A. M. Taylor. 2017. “Macrofinancial History and the
New Business Cycle Facts.”in NBER Macroeconomics Annual 2016, volume 31, edi-
ted by Martin Eichenbaum and Jonathan A. Parker. Chicago: University of Chicago
Press.
24
[34] Jovanovic, Boyan and Glenn M. MacDonald, 1994. ”The Life Cycle of a Competitive
Industry,” Journal of Political Economy, University of Chicago Press, vol. 102(2),
pages 322-347, April.
[35] Kerr, W.R., R. Nanda and M. Rhodes-Kropf. 2014 “Financing Innovation” Annual
Review of Financial Economics 7 (November 2015): 445ae“462.
[36] Kerr, W.R., R. Nanda and M. Rhodes-Kropf. 2014 “Entrepreneurship as Experimen-
tation” Journal of Economic Perspectives, 23(3), pp.25-48.
[37] King, R. G. and R. Levine. 1993a. “Finance and growth - Schumpeter might be
right.” Quarterly Journal of Economics, 108:3, pp. 717-37.
[38] King, R. G. and R. Levine. 1993b. “Finance, entrepreneurship, and growth - Theory
and evidence.” Journal of Monetary Economics, 32:3, pp. 513-42.
[39] Klenow, P.J. and A. Rodriguez-Clare. 1997.“Economic Growth: A Review Essay”
Journal of Monetary Economics, 40:3, pp.597-617.
[40] Klepper, S. 1996. ”Entry, Exit, Growth, and Innovation over the Product Life Cycle,”
American Economic Review, 86(3), pp 562-83.
[41] Klepper, S. 2007. “The Organization and Financing of Innovative Companies in the
Evolution of the US Automobile Industry ” Chapter 2 in Financing Innovation in
the United States, 1870 to the Present, edited by Naomi Lamoreaux and Kenneth L.
Sokoloff, MIT Press, Cambridge, MA.
[42] Klepper, S. and Kenneth L. Simons, 2005. ‘Industry shakeouts and technological
change’, International Journal of Industrial Organization, 23(1-2), pp. 23-43.
[43] Kornblum, Richard J. The Design of an Endpoint Control System for the Basic
Oxygen Steel Furnace. , 1968. Print
[44] Kortum, S. and J. Lerner, 2000. “Assessing the Contribution of Venture Capital to
Innovation.”RAND Journal of Economics, 31(4), pp. 674-692.
[45] Laeven, L, S. Michalopoulos and R. Levine, 2015 “Financial Innovation and Endo-
genous Growth.”Journal of Financial Intermediation, January, 24(1):1–24.
25
[46] Lamoreaux, N., M. Levenstein and K. L. Sokoloff 2007. “Financing Invention du-
ring the Second Industrial Revolution: Cleveland, Ohio 1870-1920” Chapter 1 in
Financing Innovation in the United States, 1870 to the Present, edited by Naomi
Lamoreaux and Kenneth L. Sokoloff, MIT Press, Cambridge, MA.
[47] Lamoreaux, N. and K. L. Sokoloff 2007. “The Organization and Finance of Innovation
in American History” Introduction to Financing Innovation in the United States, 1870
to the Present, edited by Naomi Lamoreaux and Kenneth L. Sokoloff, MIT Press,
Cambridge, MA.
[48] Levine, R. 1997. “Financial development and economic growth: Views and agenda.”
Journal of Economic Literature, 35:2, pp. 688-726.
[49] Levine, R., N. Loayza, and T. Beck. 2000. “Financial intermediation and growth:
Causality and causes.” Journal of Monetary Economics, 46:1, pp. 31-77.
[50] Mann, W. 2014. “Creditor Rights and Innovation: Evidence from Patent Collateral
” working paper.
[51] Metals consulting international Limited, 2008 “Capital investment costs for plant &
equipment in iron & steelmaking”
[52] Meyer, D. E. 2009. “The First Century of GMC Truck History”. web article.
[53] Mims, F. M. 1984. “The Altair story; early days at MITS”. Creative Computing 10
(11): p. 17.
[54] Mitchell, B. 2003. “International Historical Statistics 1750-2000: Africa, Asia and
Oceania” Palgrave Macmillan.
[55] Mitchell, B. 2003. “International Historical Statistics 1750-2000: Europe” Palgrave
Macmillan.
[56] Mitchell, B. 2003. “International Historical Statistics 1750-2000: The Americas” Pal-
grave Macmillan.
[57] Nanda, R. and T. Nicholas. 2014. “Did Bank Distress Stifle Innovation During the
Great Depression?” Journal of Financial Economics, 114:2, 273-292.
26
[58] Nanda, R. and M. Rhodes-Kropf. 2010. “Financing Risk and Innovation.” Harvard
Business School Working Paper 10-013.
[59] Nye, J. 1992. “Electrifying America: Social Meanings of a New Technology.” MIT
Press, Cambridge, MA.
[60] Perez, C. 2002. “Technological Revolutions and Financial Capital.” Edward Elgar,
Cheltenham, UK.
[61] Phelps, Christina, The Persian Gulf Submarine Telegraph of 1864 The Geographical
Journal 135:2 (1969), 169–190.
[62] Price, D., I. Delakis, C. Renaud, and R. Dickinson. 2008. “MRI Scanners: A Buy-
ers’guide”, web article, accessed 11-2-2014
[63] Pripps, Robert N.; Morland, Andrew Farmall Tractors: History of International
McCormick-Deering Farmall Tractors. Farm Tractor Color History Series. 1993
[64] Radcliffe, W. 1974 Origin of the New System of Manufacture Commonly Called
Power-Loom Weaving: Fully Explained in a Narrative Containing William Radcliffe’s
Struggles Through Life A.M. Kelley, Clifton, N.J.
[65] Rajan, R. G. and L. Zingales. 1998. “Financial dependence and growth.” American
Economic Review, 88:3, pp. 559-86.
[66] Rajan, R. G. and L. Zingales. 2003. “The great reversals: The politics of financial
development in the twentieth century.” Journal of Financial Economics, 69:1, pp.
5-50.
[67] Rhodes, Frederick, Beginnings of Telephony (New York and London: Harper & Brot-
hers, 1929).
[68] Rodrigue, J. P., C. Comtois, and B. Slack. 2013. The Geography of Transport Systems
Routledge
[69] Sachs, J. and A. Warner. 1995. “Economic Reform and the Process of Global Inte-
gration.” Brookings Papers on Economic Activity, 1995:1, pp. 1-118
27
[70] Samila, S. and O. Sorenson. 2011. “Venture Capital, Entrepreneurship and Economic
Growth.” The Review of Economics and Statistics, 93:1, pp. 338-349.
[71] Sulzberger, Carl. The Pearl Street Generating Station, 1882. IEEE Global History
Network. 2014. Web Article.
[72] Thompson, Robert, Wiring a Continent: The History of the Telegraph Industry in
the United States, 1832–1866 (Princeton, NJ: Princeton University Press, 1947).
[73] Walton, P. 1925 The Story of Textiles Walton Advertising and Printing Co, Boston.
[74] Wolpin, S. 2014 “The First Cellphone went on Sale 30 Years Ago for $4,000”, March
13. Web Article.
28
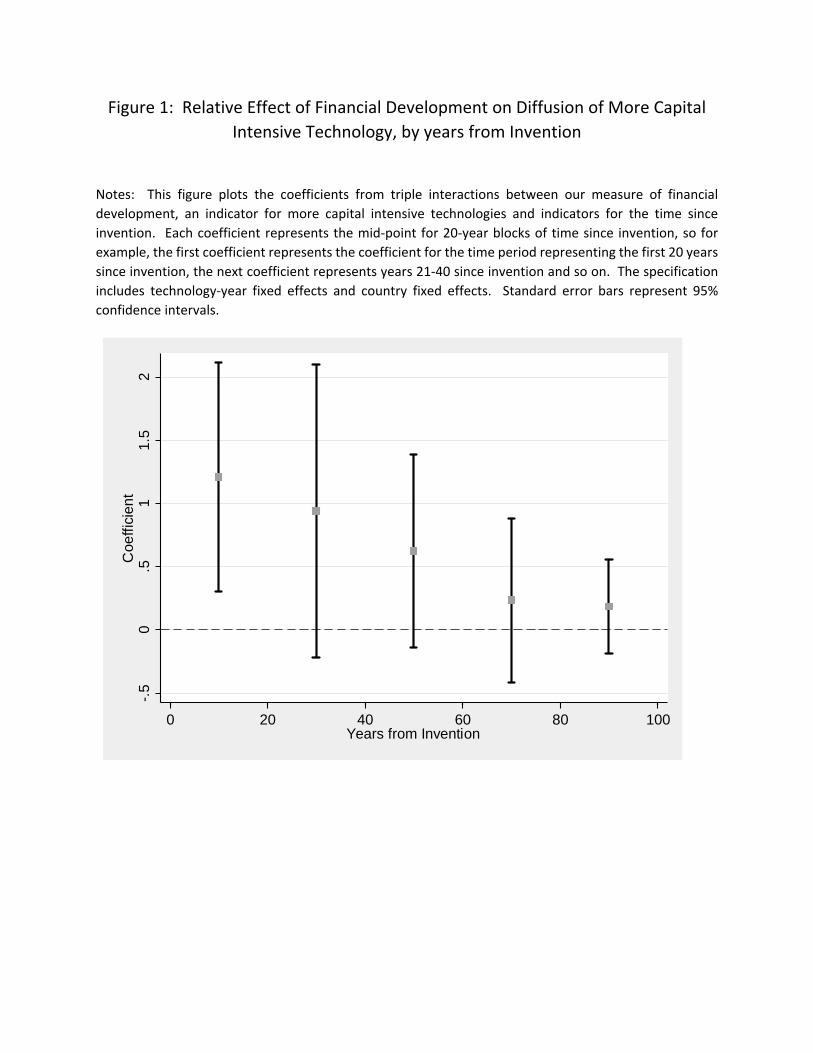
Figure 1: Relative Effect of Financial Development on Diffusion of More Capital
Intensive Technology, by years from Invention
Notes: This figure plots the coefficients from triple interactions between our measure of financial
development, an indicator for more capital intensive technologies and indicators for the time since
invention. Each coefficient represents the mid‐point for 20‐year blocks of time since invention, so for
example, the first coefficient represents the coefficient for the time period representing the first 20 years
since invention, the next coefficient represents years 21‐40 since invention and so on. The specification
includes technology‐year fixed effects and country fixed effects. Standard error bars represent 95%
confidence intervals.
-.5
0.5
11.
52
Coe
ffici
ent
0 20 40 60 80 100Years from Invention
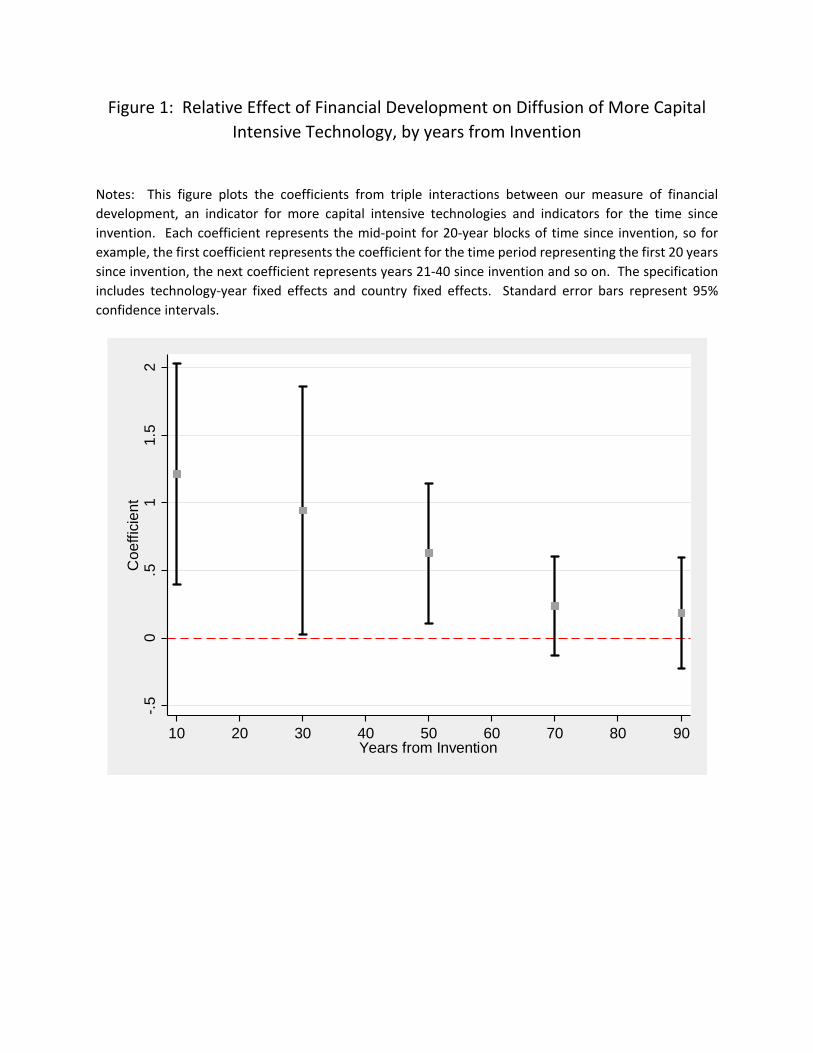
Figure 1: Relative Effect of Financial Development on Diffusion of More Capital
Intensive Technology, by years from Invention
Notes: This figure plots the coefficients from triple interactions between our measure of financial
development, an indicator for more capital intensive technologies and indicators for the time since
invention. Each coefficient represents the mid‐point for 20‐year blocks of time since invention, so for
example, the first coefficient represents the coefficient for the time period representing the first 20 years
since invention, the next coefficient represents years 21‐40 since invention and so on. The specification
includes technology‐year fixed effects and country fixed effects. Standard error bars represent 95%
confidence intervals.
-.5
0.5
11
.52
Co
effic
ient
10 20 30 40 50 60 70 80 90Years from Invention
Techno
logy
Measure
Capital Inten
sity
Core Sam
ple
Extend
ed
Sample
Core
Sample
Extend
ed Sam
ple
1Railroad
Km of track installed
High
15
34
125
183
2Telegram
Telegram
s sent
High
17
35
148
275
3Telephone
Number connected
High
17
54
310
631
4Electricity Production
KwHr produced
High
17
53
284
628
5Electric Arc Steel
Tons produced
High
17
47
162
291
6Blast Furnace Steel
Tons produced
High
16
35
84
156
7Cell Phones
Number of users
High
17
53
56
137
8Ring Spindle
Number in
operation
Low
10
32
59
170
9Loom
Number in
operation
Low
17
46
20
81
10
Passenger Cars
Number in
operation
Low
17
54
269
599
11
Commercial Veh
icles
Number in
operation
Low
17
53
261
575
12
Tractors
Number in
operation
Low
17
52
91
263
13
Radio
Number in
operation
Low
17
54
206
518
14
TVNumber in
operation
Low
17
55
158
422
15
Computers
Number in
operation
Low
17
53
50
138
16
MRI m
achines
Number in
operation
Low
17
23
48
59
Total
2,331
5,126
Note: A
ll measures are scaled
by population and expressed
in logarithms.
Coun
tries c
overed
Coun
try‐Ye
ars pe
r techn
ology
Table 1: D
escriptio
n of Techn
ologies U
sed
YearLoans/GDP
[J‐S‐T Data]
Credit/GDP
[D‐L Data]Deposits/GDP
1870 ‐ 1874 0.19 0.16
1875 ‐ 1879 0.25 0.22
1880 ‐1884 0.27 0.20
1885 ‐ 1889 0.35 0.25
1890 ‐ 1894 0.35 0.26
1895 ‐ 1899 0.40 0.32
1900 ‐ 1904 0.44 0.34
1905 ‐ 1909 0.54 0.40
1910 ‐ 1914 0.62 0.42
1915 ‐ 1919 0.49 0.38
1920 ‐ 1924 0.53 0.40
1925 ‐ 1929 0.55 0.42
1930 ‐ 1934 0.63 0.51
1935 ‐ 1939 0.52 0.46
1940 ‐ 1944 0.44 0.48
1945 ‐ 1949 0.35 0.45
1950 ‐ 1954 0.36 0.36
1955 ‐ 1959 0.40 0.34
1960 ‐ 1964 0.48 0.44 0.33
1965 ‐ 1969 0.54 0.50 0.33
1970 ‐ 1974 0.61 0.57 0.33
1975 ‐ 1979 0.66 0.63 0.31
1980 ‐ 1984 0.69 0.69 0.29
1985 ‐ 1989 0.78 0.80 0.32
1990 ‐ 1994 0.87 0.97 0.34
1995 ‐ 1999 0.85 0.97 0.37
Table 2: Financial Development for Core Sample
Notes: This table reports three measures of financial development, averaged across the following 17 countries in
the core sample AUS, BEL, CAN, CHE, DEU, DNK, ESP, FIN, FRA, GBR, ITA, JPN, NLD, NOR, PRT, SWE & USA. All data
is aggregated to 26 5 year time periods for each country spanning 1870‐1999. J‐S‐T Data refers "total loans/GDP"
in the Jorda‐Schularick‐Taylor Macrohistory Database and D‐L Data refers to "Private Credit by Deposit Money
Banks and Other Financial Institutions to GDP" in the Financial Structure Database provided by Demirguc‐Kunt and
Levine. Deposits/ GDP is the ratio of deposits in Savings and Commercial banks, taken from Mitchell, as a share of
GDP. This table reports average values across all countries for the three variables. At the country‐year level, the
pairwise correlation between Credit/GDP from J‐S‐T and Credit/GDP from D‐L is 0.56 and the pairwise correlation
between Credit/GDP from J‐S‐T and Deposits / GDP is 0.48
(1)
(2)
(3)
(4)
(5)
(6)
Loans/GDP X capital intensity
0.541**
0.658**
0.655**
0.503*
0.601**
0.602**
(0.253)
(0.267)
(0.271)
(0.263)
(0.255)
(0.255)
Loans/GDP
‐0.0382
‐0.0438
‐0.0468
(0.290)
(0.195)
(0.205)
GDP per capita x capital intensity
‐0.478
‐0.498
‐0.510
‐0.520
(0.386)
(0.382)
(0.408)
(0.393)
GDP per Capita
1.646***
1.680***
(0.432)
(0.441)
Human
Capital x capital intensity
0.144
0.088
(0.345)
(0.387)
Human
Capital
0.285**
(0.117)
Technology X Year FE
Yes
Yes
Yes
Yes
Yes
Yes
Country FE
Yes
Yes
Yes
Yes
Yes
Yes
Country‐Year FE
No
No
No
Yes
Yes
Yes
Observations
2,331
2,331
2,331
2,331
2,331
2,331
Robust standard errors in
paren
theses, clustered
by technology and country
*** p<0.01, ** p<0.05, * p<0.1
Notes: (1) All data is aggregated to 26 5year tim
e periods spanning 1870‐1999.
(2) Main effect for capital intensity is absorbed
by the technology‐year fixed effects and m
ain effects for loans/GDP, G
DP per Capita and Human
Capital absorbed
by country‐year fixed
effects
1870
‐199
9: D
epen
dent Variable: Log
Techn
ology Diffusion pe
r cap
itaTable 3: Finan
cial Develop
men
t and
Techn
ology Diffusion
Country Fixed Effects
Country‐Year Fixed
Effects
Technology Invention DateMedian diffusion Lag (in yrs) from Comin and Hobjin 2010
1 Railroad track 1825 66
2 Telegram 1835 23
3 Telephone 1875 9
4 Electricity Production 1882 19
5 Electric Arc Steel 1907 29
6 Blast Furnace Steel 1950 10
7 Cell Phones 1973 10
8 Ring Spindle 1779 81
9 Loom 1785 168
10 Passenger Cars 1885 25
11 Trucks 1885 25
12 Tractors 1903 89
13 Radio 1920 9
14 TV 1927 23
15 Personal Computers 1973 12
16 MRI machines 1977 4
Table 4: Invention Dates and Diffusion Lags across Technologies
Early Late Early Late
Loans/GDP X capital intensity 0.894*** 0.056 0.816*** 0.548
(0.254) (0.417) (0.245) (0.337)
GDP per capita x capital intensity ‐0.978*** ‐0.120 ‐1.136** ‐0.263
(0.190) (0.184) (0.499) (0.374)
Human Capital x capital intensity ‐0.498*** 0.811* ‐0.045 0.183
(0.0937) (0.449) (0.653) (0.346)
Technology X Year FE Yes Yes Yes Yes
Country‐Year FE Yes Yes Yes Yes
Observations 1,013 1,318 885 1,446
Early Late Early Late
Loans/GDP X capital intensity 1.009** 0.047 1.052** 0.153
(0.393) (0.378) (0.394) (0.391)
Loans/GDP ‐0.133 ‐0.025 ‐0.198 ‐0.052
(0.168) (0.258) (0.180) (0.122)
GDP per capita x capital intensity ‐0.091 ‐0.327 ‐1.423** ‐0.192
(0.235) (0.424) (0.513) (0.550)
GDP per capita 1.455*** 1.403*** 1.985*** 1.831***
(0.294) (0.320) (0.572) (0.480)
Human Capital x capital intensity ‐0.718 0.474 ‐0.507 0.043
(0.419) (0.282) (0.690) (0.155)
Human Capital 0.638* ‐0.082 0.895 0.278**
(0.332) (0.172) (0.509) (0.104)
Technology X Year FE Yes Yes Yes Yes
Country X Capital Intensity FE Yes Yes Yes Yes
Observations 1,013 1,318 885 1,446
Robust standard errors in parentheses, clustered by technology and country
*** p<0.01, ** p<0.05, * p<0.1
Notes: (1) All data is aggregated to 26 5year time periods spanning 1870‐1999.
Table 5: Early vs. Late in Technology's Lifecycle1870‐1999: Dependent Variable: Log Technology Diffusion per capita
Early defined as below Median Adoption
Lag from Comin and Hobjin
Early defined as less than 50 Years from
Invention
(2) Main effect for capital intensity is absorbed by the technology‐year fixed effects and main effects for loans/GDP, GDP per Capita and
Human Capital absorbed by country‐year fixed effects
Panel A: Country‐Year Fixed Effects
Panel B: Country‐Capital Intensity Fixed Effects
Early defined as below Median Adoption
Lag from Comin and Hobjin
Early defined as less than 50 Years from
Invention
Early Late Early Late
Loans/GDP X capital intensity 0.975*** 0.008 0.875*** 0.598
(0.270) (0.470) (0.263) (0.394)
Institutions x capital Intensity 0.017 0.010 0.041* 0.031
(0.077) (0.019) (0.021) (0.020)
Gov. Exp x capital intensity 0.431 ‐0.603 0.438 ‐0.427
(0.623) (1.098) (1.183) (0.832)
GDP per capita x capital intensity ‐0.907 ‐0.168 ‐1.469 ‐0.448
(0.625) (0.313) (1.106) (0.463)
Human Capital x capital intensity ‐0.561 0.703 ‐0.131 ‐0.044
(3.506) (0.626) (14.361) (0.274)
Technology X Year FE Yes Yes Yes Yes
Country‐Year FE Yes Yes Yes Yes
Observations 951 1,276 839 1,388
Early Late Early Late
Loans/GDP X capital intensity 1.164** 0.381 1.351** 0.293
(0.401) (0.362) (0.579) (0.450)
Loans/GDP ‐0.278* ‐0.295 ‐0.523*** ‐0.227
(0.138) (0.242) (0.156) (0.234)
Institutions x capital Intensity ‐0.009 ‐0.028* ‐0.013 0.020
(0.036) (0.014) (0.016) (0.021)
Institutional Quality 0.053** 0.015 0.037* ‐0.008
(0.022) (0.009) (0.018) (0.017)
Gov. Exp x capital intensity ‐0.830 2.383*** 1.635 ‐0.944
(1.226) (0.200) (1.095) (0.709)
Gov Expenditure/ GDP ‐0.347 ‐1.561*** ‐1.832** 0.429
(0.791) (0.408) (0.807) (0.600)
GDP per capita x capital intensity ‐0.173 0.006 ‐1.390** ‐0.243
(0.182) (0.422) (0.483) (0.540)
GDP per capita 1.230*** 1.177*** 1.696*** 1.786***
(0.300) (0.290) (0.464) (0.516)
Human Capital x capital intensity ‐0.569 0.503* ‐0.579 0.015
(0.332) (0.245) (0.781) (0.165)
Human Capital 0.646** ‐0.073 0.974 0.303**
(0.299) (0.223) (0.598) (0.124)
Technology X Year FE Yes Yes Yes Yes
Country X Capital Intensity FE Yes Yes Yes Yes
Observations 951 1,276 839 1,388
Robust standard errors in parentheses, clustered by technology and country
*** p<0.01, ** p<0.05, * p<0.1
Notes: (1) All data is aggregated to 26 5year time periods spanning 1870‐2000.
Early defined as below Median Adoption
Lag from Comin and Hobjin
Early defined as less than 50 Years from
Invention
(2) Main effect for capital intensity is absorbed by the technology‐year fixed effects and main effects for loans/GDP, GDP per Capita and
Human Capital absorbed by country‐year fixed effects
Table 6: Robustness: Quality of Institutions and Government Expenditure1870‐1999: Dependent Variable: Log Technology Diffusion per capita
Panel A: Country‐Year Fixed EffectsEarly defined as below Median Adoption
Lag from Comin and Hobjin
Early defined as less than 50 Years from
Invention
Panel B: Country‐Capital Intensity Fixed Effects
Early Late Early Late
Deposits/GDP X capital intensity 0.995*** ‐0.320 0.999*** ‐0.130
(0.274) (0.517) (0.289) (0.388)
Deposits/GDP ‐0.113 0.529* ‐0.0767 0.437
(0.176) (0.260) (0.152) (0.288)
GDP per capita x capital intensity ‐0.300 0.198 ‐0.178 0.233
(0.320) (0.158) (0.335) (0.214)
GDP per capita 1.251** 1.109*** 1.401*** 1.046***
(0.436) (0.172) (0.288) (0.227)
Human Capital x capital intensity 0.440 0.0741 0.547 0.193
(0.349) (0.425) (0.479) (0.363)
Human Capital ‐0.085 ‐0.047 0.104 0.022
(0.265) (0.463) (0.394) (0.346)
Technology X Year FE Yes Yes Yes Yes
Country FE Yes Yes Yes Yes
Observations 2,366 2,760 1,562 3,564
Robust standard errors in parentheses, clustered by technology
*** p<0.01, ** p<0.05, * p<0.1
Notes: (1) All data is aggregated to 26 5year time periods spanning 1870‐1999.
Early defined as below Median Adoption
Lag from Comin and Hobjin
Early defined as less than 50 Years from
Invention
(2) Main effect for capital intensity is absorbed by the technology‐year fixed effects.
Table 7: Extended Sample of 55 Countries1870‐1999: Dependent Variable: Log Technology Diffusion per capita
TechnologyCapital Intensity
Approximate Nominal Cost Year
Cost in 2010 dollars Reference
1 Railroad High $32,000 per mile of track 1860s$657,000 per
mileDodge (1910)
2 Telegram High$1.2 million, first
transatlantic cable.1859 $24.6 million Thompson (1947)
3 Telephone High
$2.2 million, cost of wiring
for American Bell Company
in 1888
1888 $45.2 million Rhodes (1929)
4 Electricity Production High$300,000 Constructing
Pearl St. station1882 $5.5 million Janeway (2012)
5 Electric Arc Steel High
$24 million, cost of
installing mini‐mill lower
bound
2010 $24 millionMetal Consulting
International (2010)
6 Blast Furnace Steel High$2 billion, cost of installing
integrated mill2010 $2 billion
Metal Consulting
International (2010)
7 Cell Phones High$100 million, creation of
first network1983 $188 million Wolpin (2014)
8 Spindle Low₤7, price of a cotton jenny
with 60‐80 spindles1780s $230
Chapman and Butt
(1988)
9 Loom Low ₤20, per loom 1828 $611 Radcliffe (1974)
10 Passenger Cars Low $950, Price of Model T 1908 $17,817 Rodrigue et al. (2013)
11 Trucks Low $1250, Rapid Model B 1905 $24,904 Meyer (2009)
12 Tractors Low
$750, price for the first
commercial tractor, the
Fordson
1917 $8,783Pripps and Morland
(1993)
13 Radio Low$120, price of new Kolster
6D1927 $1,240 Douglas (1995)
14 TV Low$600, price of RCA Victor
console1939 $7,545 Genova (2001)
15 Computers Low $397, Altair 8800, first PC 1974 $1,397 Mims (1984)
16 MRI machines Low$300,000, price of entry
level MRI scanner2014 $288,738 info.blockimaging.com
Appendix 1: Capital Intensity measures by technology
Note: The units of measurement for each technology are outlined in Table 1. The country‐level diffusion of a technology in a given year is scaled by
the population and measured in logarithms.
(1)
(2)
(3)
(4)
(5)
(6)
Loans/GDP X capital intensity
0.541**
0.658**
0.655**
0.563**
0.680**
0.678**
(0.253)
(0.267)
(0.271)
(0.244)
(0.249)
(0.251)
Loans/GDP
‐0.0382
‐0.0438
‐0.0468
‐0.0278
‐0.0578
‐0.0343
(0.290)
(0.195)
(0.205)
(0.237)
(0.217)
(0.214)
GDP per capita x capital intensity
‐0.478
‐0.498
‐0.516
‐0.540
(0.386)
(0.382)
(0.438)
(0.461)
GDP per Capita
1.646***
1.680***
1.667***
1.709***
(0.432)
(0.441)
(0.480)
(0.497)
Human
Capital x capital intensity
0.144
0.142
(0.345)
(0.349)
Human
Capital
0.285**
0.309
(0.117)
(0.230)
Technology X Year FE
Yes
Yes
Yes
Yes
Yes
Yes
Country FE
Yes
Yes
Yes
Yes
Yes
Yes
Observations
2,331
2,331
2,331
2,212
2,212
2,212
Robust standard errors in
paren
theses, clustered
by technology
*** p<0.01, ** p<0.05, * p<0.1
Notes: (1) All data is aggregated to 26 5year tim
e periods spanning 1870‐1999.
Table Ap
pend
ix 2: Lagged
Finan
cial Develop
men
t and
Techn
ology Diffusion
1870
‐199
9: D
epen
dent Variable: Log
Techn
ology Diffusion pe
r cap
ita
Without Lag in Loans to GDP
Loans to GDP Lagged 5 years
(2) Main effect for capital intensity is absorbed
by the technology‐year fixed effects and m
ain effects for loans/GDP, G
DP per Capita and Human
Capital absorbed
by country‐year fixed
effects