Keystone XL Pipeline Supplemental Environmental Impact Statement Executive Summary

FINAL SUPPLEMENTAL ENVIRONMENTAL IMPACT STATEMENT FOR THE
CROTON WATER TREATMENT PLANT
8.1.2. New Croton Aqueduct Shaft No. 9 ......................................................................... 1 8.1.2.1. Introduction..................................................................................................... 1 8.1.2.2. Baseline Conditions ........................................................................................ 1
8.1.2.2.1. Existing Conditions...................................................................................... 1 8.1.2.2.2. Future Without the Project......................................................................... 39
8.1.2.3. Potential Impacts........................................................................................... 45 8.1.2.3.1. Project Impacts........................................................................................... 45 8.1.2.3.2. Construction Impacts ................................................................................. 54
FIGURE 8.1.2-1. TRAFFIC COUNT STUDY LOCATIONS FOR NCA SHAFT NO. 9. .......... 4 FIGURE 8.1.2-2. NEW CROTON AQUEDUCT SHAFT NO. 9 EXISTING TRAFFIC
VOLUME – AM/PM HOUR.................................................................................................. 6 FIGURE 8.1.2-3. NEW CROTON AQUEDUCT SHAFT NO. 9 ROUTE SEGMENTS
MOBILE SOURCE NOISE ANALYSIS............................................................................. 14 FIGURE 8.1.2-4. NEW CROTON AQUEDUCT SHAFT NO. 9 MOBILE NOISE SOURCE
MONITORING LOCATION ............................................................................................... 15 FIGURE 8.1.2-5. NEW CROTON AQUEDUCT SHAFT NO. 9 STATIONARY NOISE
SOURCE MONITORING LOCATIONS ............................................................................ 17 FIGURE 8.1.2-6. NATURAL RESOURCES NCA SHAFT NO. 9............................................ 24 FIGURE 8.1.2-7. NEW CROTON AQUEDUCT SHAFT NO. 9 2013 FUTURE WITHOUT
THE PROJECT TRAFFIC VOLUMES – AM/PM HOUR ................................................. 41 FIGURE 8.1.2-8. EXTENT OF FLOODING UNDER BASE-FLOW WITH 290 MGD
BLOWOFF NCA SHAFT NO. 9 ......................................................................................... 51 FIGURE 8.1.2-9. EXTENT OF FLOODING UNDER 10-YEAR FLOOD WITH 290 MGD
BLOWOFF NCA SHAFT NO. 9 ......................................................................................... 52 FIGURE 8.1.2-10. EXTENT OF FLOODING UNDER 100-YEAR FLOOD WITH 290 MGD
BLOWOFF NCA SHAFT NO. 9 ......................................................................................... 53 FIGURE 8.1.2-11. NEW CROTON AQUEDUCT SHAFT NO. 9 CONSTRUCTION TRAFFIC
DISTRIBUTION – AM/PM HOUR..................................................................................... 57 FIGURE 8.1.2-12. NEW CROTON AQUEDUCT SHAFT NO. 9 2013 CONSTRUCTION
YEAR TRAFFIC VOLUME – AM/PM HOUR .................................................................. 58 FIGURE 8.1.2-13. NEW CROTON AQUEDUCT SHAFT NO. 9 LATERAL EXTENT OF
NOISE LEVELS EXCEEDING THRESHOLD .................................................................. 65 TABLE 8.1.2-1. 2002 EXISTING TRAFFIC CONDITIONS FOR NCA SHAFT NO. 9. .......... 8 TABLE 8.1.2-2. NCA SHAFT NO. 9 INVENTORY OF ACCIDENTS.................................... 10 TABLE 8.1.2-3. COMPARISON OF EXISTING PCES TO FUTURE PCES IN VICINITY OF
NCA SHAFT NO. 9.............................................................................................................. 12 TABLE 8.1.2-4. ROUTE SEGMENTS CONSIDERED FOR MOBILE SOURCE NOISE
ANALYSIS AT NCA SHAFT NO. 9................................................................................... 13 TABLE 8.1.2-5. EXISTING CONDITIONS AT RECEPTOR NCA9-M1 ON SLEEPY
HOLLOW ROAD................................................................................................................. 16 TABLE 8.1.2-6. EXISTING CONDITIONS ALONG SLEEPY HOLLOW ROAD USING
TRAFFIC COUNT PROGRAM DATA .............................................................................. 16
FINAL SUPPLEMENTAL ENVIRONMENTAL IMPACT STATEMENT FOR THE
CROTON WATER TREATMENT PLANT
TABLE 8.1.2-7. MEASURED BASELINE NOISE LEVELS AT NCA SHAFT NO. 9 ON A WEEKDAY .......................................................................................................................... 18
(LEQ, DBA) ................................................................................................................................. 18 TABLE 8.1.2-8. MEASURED BASELINE NOISE LEVELS AT NCA SHAFT NO. 9 ON A
SUNDAY.............................................................................................................................. 18 (LEQ, DBA) ................................................................................................................................. 18 TABLE 8.1.2-9. TWENTY-MINUTE MEASURED NOISE LEVELS AT SENSITIVE
RECEPTOR NEAR NCA SHAFT NO. 9 ON A WEEKDAY ............................................ 18 (LEQ, DBA) ................................................................................................................................. 18 TABLE 8.1.2-10. TWENTY-MINUTE NOISE LEVELS AT SENSITIVE RECEPTOR NEAR
NCA SHAFT NO. 9 ON A SUNDAY ................................................................................. 19 (LEQ, DBA).................................................................................................................................. 19 TABLE 8.1.2-11. VEGETATION OBSERVED AT NCA SHAFT NO. 9 ................................. 25 TABLE 8.1.2-12. WATER QUALITY MEASUREMENTS AT NCA SHAFT NO. 9 STREAM
(CARL’S BROOK)............................................................................................................... 27 TABLE 8.1.2-13. BENTHIC INVERTEBRATE SPECIES IDENTIFIED AT NCA SHAFT NO.
9 STREAM (CARL’S BROOK) .......................................................................................... 28 TABLE 8.1.2-14. AVIAN SPECIES OBSERVED AND POTENTIALLY OCCURRING AT
NCA SHAFT NO. 9.............................................................................................................. 29 TABLE 8.1.2-15. HERPETILE SPECIES POTENTIALLY OCCURRING IN THE VICINITY
OF NCA SHAFT NO. 9........................................................................................................ 33 TABLE 8.1.2-16. MAMMALS POTENTIALLY OCCURRING IN THE VICINITY OF NCA
SHAFT NO. 9 ....................................................................................................................... 35 TABLE 8.1.2-17. WATER QUALITY MEASUREMENTS AT NCA SHAFT NO. 9 STREAM
(CARL’S BROOK)............................................................................................................... 37 TABLE 8.1.2-18. POCANTICO RIVER EXISTING FLOWS .................................................. 37 TABLE 8.1.2-19. 2013 FUTURE WITHOUT THE PROJECT TRAFFIC CONDITIONS FOR
NCA SHAFT NO. 9.............................................................................................................. 42 TABLE 8.1.2-20. FUTURE WITHOUT THE PROJECT NOISE LEVELS FOR SLEEPY
HOLLOW ROAD AT NCA SHAFT NO. 9......................................................................... 44 (LEQ, DBA) ................................................................................................................................. 44 TABLE 8.1.2-21. EXTENT OF FLOODING DURING MEAN ANNUAL FLOW PLUS 290
MGD, 10-YEAR FLOOD PLUS 290 MGD AND 100-YEAR FLOOD PLUS 290 MGD . 49 TABLE 8.1.2-22. STRUCTURES POTENTIALLY IMPACTED BY 290 MGD BLOW-OFF
AT NCA SHAFT NO. 9 ....................................................................................................... 50 TABLE 8.1.2-23. CONSTRUCTION RESOURCE REQUIREMENTS..................................... 55 TABLE 8.1.2-24. CONSTRUCTION TRIP GENERATION..................................................... 56 TABLE 8.1.2-25. 2013 POTENTIAL CONSTRUCTION IMPACTS. ...................................... 59 TABLE 8.1.2-26. CONSTRUCTION NOISE LEVELS FOR SLEEPY HOLLOW ROAD AT
NCA SHAFT NO. 9.............................................................................................................. 62 (LEQ, DBA) ................................................................................................................................. 62 TABLE 8.1.2-27. NOISE LEVELS AND USAGE FACTORS FOR EQUIPMENT USED AT
NCA SHAFT NO. 9.............................................................................................................. 63 (DBA) ........................................................................................................................................... 63

FINAL SUPPLEMENTAL ENVIRONMENTAL IMPACT STATEMENT FOR THE
CROTON WATER TREATMENT PLANT
TABLE 8.1.2-28. NOISE LEVELS FROM CONSTRUCTION ACTIVITIES AT RECEPTOR NEAR NCA SHAFT NO. 9 WEEKDAY CONSTRUCTION HOURS (LEQ, DBA) ........ 66
TABLE 8.1.2-29. NOISE LEVELS FROM CONSTRUCTION ACTIVITIES AT RECEPTOR NEAR NCA SHAFT NO. 9 SUNDAYS AND WEEKDAY NON-WORKING HOURS (LEQ, DBA).......................................................................................................................... 67
TABLE 8.1.2-30. POSSIBLE APPROVALS AND PERMITS REQUIRED FOR NCA SHAFT NO. 9 FOR THE WTP AT THE EASTVIEW SITE............................................................ 71

8.1.2. New Croton Aqueduct Shaft No. 9 8.1.2.1. Introduction
The New Croton Aqueduct (NCA) Shaft No. 9 (Shaft) is an above grade structure in the Village of Sleep Hollow, Westchester County, New York. The City of New York (City) currently owns approximately six acres of privately owned space. The Shaft Site is surrounded on three sides by Rockefeller State Park Preserve, with access to the Shaft from Sleepy Hollow Road. The NCA is above grade at this point, and appears as a linear mound covered with grass for several hundred feet. The Shaft building is approximately 42 x 44 feet and 20 feet tall. The building extends down approximately 20 feet below the surface. A blow-off outlet that was designed for emergency discharge of the NCA is adjacent to the structure. The stone structure was constructed in the late 19th century. In the proposed project, NCA Shaft No. 9 would serve as a raw water surge blow-off and an NCA drainage location. The existing overflow weir would be rehabilitated and upgraded as part of the baseline rehabilitation work that would be conducted in two phases during 2004-2007. The NCA Baseline Rehabilitation work is a separate action that will be conducted regardless of where the Croton water treatment plant is located. The NCA Baseline Rehabilitation would be conducted in two phases; the first phase (which was subject to an independent environmental review that resulted in a Negative Declaration being issued on June 7, 2004) is scheduled to begin in Fall 2004 and continue to Spring 2006 and the second phase (which would be subject to a future environmental review once the scope and need for the work is defined) is anticipated to begin Summer 2006 and continue to Spring 2007. The NCA rehabilitation work would be completed before any NCA work associated with the Croton WTP is started. If the Eastview Site is selected for the Croton WTP, and the NCA is used as the treated water conveyance, the NCA Shaft No. 9 would be used as an access point for the pressurization construction during 2011-2015. In addition, the potential for plant overflows and unexpected system shutdowns would be increased under this treated water conveyance alternative. This overflow would divert raw water to a small tributary of the Pocantico River, alternatively known locally as Carl’s Brook or Welker’s Brook. If the Kensico City Tunnel (KCT) is selected for the conveyance of treated water from the Eastview Site, or if the Mosholu or Harlem River Sites were selected, there would be no change in operations from the existing conditions. The following sections describe the operational impacts of more frequent use of the blow-off and the construction impacts of the proposed pressurization work. The operation year used for these analyses is 2015, and the peak construction year is 2013. A study area of up to one-mile was established from the Shaft Site in conducting the following analyses. The methodology used to prepare these analyses is presented in Section 4, Data Collection and Impact Methodologies. 8.1.2.2. Baseline Conditions
8.1.2.2.1. Existing Conditions Land Use, Zoning and Public Policy. There would be no change to Land Use, Zoning, or Public Policy as part of this project. As discussed below under Water Resources, the
Final SEIS S9 1

increased frequency of flooding that could be a result of using the blow-off, would not affect land uses in the parkland through which the Pocantico River flows. Because of this, a detailed analysis of the potential impacts of the project on this parameter was not conducted. Potential impacts during construction are discussed in the Potential Construction Impacts section below.
Visual Character. There would be no change to the visual character of the area as part of this project. Because of this, a detailed analysis of the potential impacts of the project on this parameter was not conducted. Potential visual character impacts during construction are discussed in the Potential Construction Impacts section below.
Community Facilities. No impacts to the area community facilities are anticipated as
part of this project. Because of this, a detailed analysis of the potential impacts of the project on this parameter was not conducted. Potential community facilities impacts during construction are discussed in the Potential Construction Impacts section below.
Open Space. As discussed below under Water Resources, the increased frequency of flooding that could be a result of using the blow-off, would not affect open space uses in the parkland through which the Pocantico River flows. Therefore, a detailed open space analysis was not conducted for this site.
Neighborhood Character. There would be no change to neighborhood character in the vicinity of NCA Shaft No. 9 as part of this project. Because of this, a detailed analysis of the potential impacts of the project on this parameter was not conducted. Potential impacts during construction are discussed in the Potential Construction Impacts section below.
Socioeconomic Analysis. No impacts to the study area socioeconomic conditions are anticipated as part of this project. Because of this, a detailed analysis of the potential impacts of the project on this parameter was not conducted. Potential impacts during construction are discussed in the Potential Construction Impacts section below.
Water Rate Structure. For this information, refer to the Water Rate Structure discussion for the Eastview Site (Section 5.7, Socioeconomic Analysis).
Growth Inducement. This analysis addresses the proposed NCA work, which would be conducted in conjunction with the proposed Croton Water Treatment Plant at the Eastview Site. Therefore, the analysis of any growth inducement effects related to improvements to the NCA is addressed in the Growth Inducement analysis prepared for the Eastview Site (Section 5.8, Growth Inducement).
Traffic and Transportation. The existing operating conditions of the nearby transportation system, including traffic, parking, pedestrian safety and transit are presented. The study areas were established based upon volumes, logical traffic routes, and potentially problematic areas.
Traffic Study Area. The NCA Shaft No. 9 is located in the Village of Sleepy Hollow,
New York. This study area has been selected to encompass those roadways most likely to be
Final SEIS S9 2

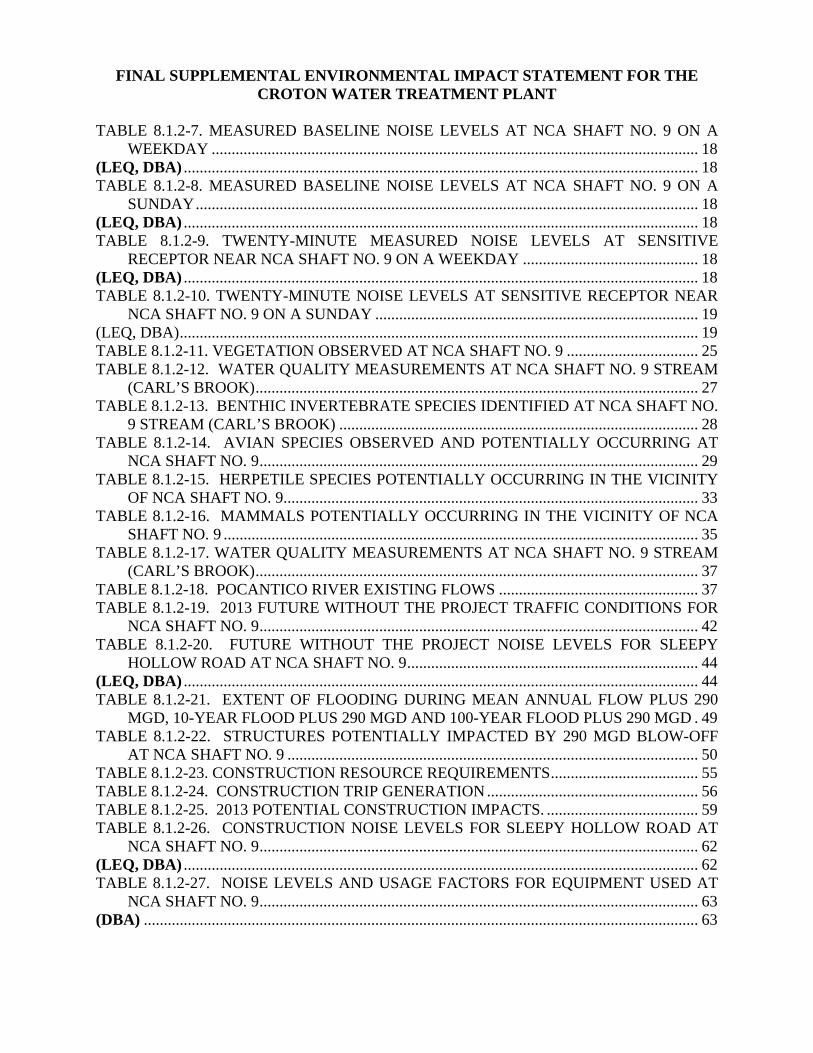
used by the majority of vehicular traffic traveling to and from the Shaft Site. The study area for NCA Shaft No. 9 is primarily bounded by Phelps Way (Route 117) to the north, Bedford Road (Route 448) to the south and east, and Sleepy Hollow Road to the west. The traffic study area for NCA Shaft No. 9 is presented in Figure 8.1.2-1.
Final SEIS S9 3

Croton Water Treatment Plant
0118
WE
BB
ER
AV
E.
LEGEND
Turning Movement Count Locations
ATR Count Locations
ATR-C: ATR Locations that included classification counts
N
Eastview Site
ATR-C
ATR-C
SLAASGR NDS RD. (ROUTE 100C)
EN PE
RA
N
RD.
COUNTY HOUSE D R .
D RDRFODE
B
BEDFORD RD
DR
DR
OFDEB
SLE
EP
Y H
OLLO
W R
D.
.DR WOLLOH YPEELS
)7
11 E
T
UOR( YAW SPLEHP
BE
EC
H H
ILL R
D.
.EVA DROFDEB
)A
9 .E
TR(
DR
RE
VIR
LLI
M W
AS
YA
WK
RAP
ET
AT
S CI
NO
CAT
OLD
SLE
EP
Y
9
ET
UO
R Y
AW
DA
OR
BN
OR
TH
BR
OA
DW
AY
RO
UT
E 9
YW
KP
RE
VIR
LLI
M W
AS . Y
WK
P E
TAT
S CI
NO
CAT
HO
LLO
W R
D. E
XT.
NCA Shaft No. 9
Not to Scale
Figure 8.1.2-1
Traffic Count Study Locations for NCA Shaft No. 9
M&
E F
ile: H
:\E
nvi
ron
me
nta
l Q
ua
lity\
Cro
ton
\20
04
Fin
al S
EIS
\GR
AP
HIC
S\0
8-O
FF
SIT
E\0
1-N
CA
\02
-SH
9\T
RA
\SH
9-t
ra-e
xco
nA
-11
-22
-03
.cd
r 5
/13
/04
WILSON PARK DR.
SA
W M
ILL R
IVE
R R
D (
RO
UT
E 9
A)
NO
RT
H B
RO
AD
WA
Y
TE
9
RO
U
DANA RD.
AVE.
ST
S
EVE N
CLE
AR
BR
OO
K R
D.
OLD SAW MILL RIVER RD.
ATR-C
WA
LK
ER
RD
Traffic Conditions and Analysis. Traffic counts were collected during June 2002 and
September/October 2002. The counts documented traffic conditions on key study area roadways and intersections. The data collection included manual turning movement counts, automatic traffic recorders (ATR), vehicle classification counts, and travel speed runs along principal corridors. Below is a list of intersections where turning movement counts were performed:
• Bedford Road at Taconic State Parkway Northbound and Southbound Ramps • Bedford Road at Route 9A (Expressway) Northbound and Southbound Ramps • Bedford Road and Phelps Way (Route 117) at Beech Hill Road • Bedford Road at Sleepy Hollow Road • Sleepy Hollow Road and Old Sleepy Road • Sleepy Hollow Road/ County House Road and Bedford Road • Sleepy Hollow Road at Webber Avenue • Webber Avenue and Bedford Road • Bedford Road (Route 448) and Broadway (Route 9)/North Broadway • Bedford Road (Route 448)/Beekman Avenue and Broadway (Route 9)/Hudson Terrace
The turning movement counts (TMC) conducted at the identified intersections were performed on weekdays from 7 AM to 10 AM and from 2 PM to 6 PM to capture the morning and afternoon peak hours.
In addition to the TMCs, automated traffic recorder (ATR) counts were performed for a 24-hour period for seven days at the following locations:
• County House Road – South of Bedford Road • Sleepy Hollow Road – North of Webber Avenue • Bedford Road – South of Beech Hill Road
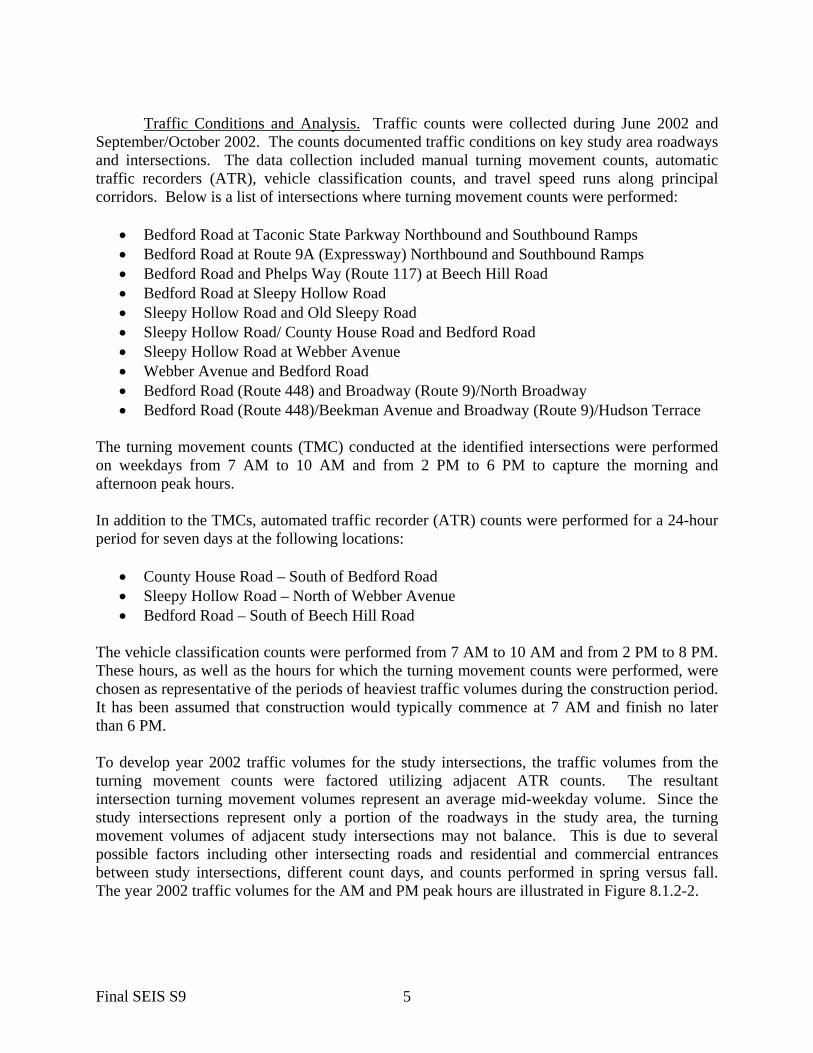
The vehicle classification counts were performed from 7 AM to 10 AM and from 2 PM to 8 PM. These hours, as well as the hours for which the turning movement counts were performed, were chosen as representative of the periods of heaviest traffic volumes during the construction period. It has been assumed that construction would typically commence at 7 AM and finish no later than 6 PM. To develop year 2002 traffic volumes for the study intersections, the traffic volumes from the turning movement counts were factored utilizing adjacent ATR counts. The resultant intersection turning movement volumes represent an average mid-weekday volume. Since the study intersections represent only a portion of the roadways in the study area, the turning movement volumes of adjacent study intersections may not balance. This is due to several possible factors including other intersecting roads and residential and commercial entrances between study intersections, different count days, and counts performed in spring versus fall. The year 2002 traffic volumes for the AM and PM peak hours are illustrated in Figure 8.1.2-2.
Final SEIS S9 5

N
26
/ 3
10
/ 0
5 / 1
11 / 25
276 / 213
13 / 3
11 / 8
0 / 0
34 / 7
7
4 / 1
148 / 418
35 / 31
6 / 7
46 / 70
222 / 131
5 / 11
11 / 20
100 / 295
14 /
2010
0 / 1
11
9 / 1
48 / 9
25 / 1
4
5 / 9
26 / 2
5
1 / 1
21 / 35
35 / 27
17 / 20
1 / 18 / 26
26 / 10
10 /
8
20 /
28
28 /
1449
/ 28
50 / 4418 / 8
10 / 7
107 / 2
64
40 / 6
5224 / 1
64
58 / 140
491 / 516
221 / 188
133 / 5
8
45 / 2
2
19 / 2
0
3 / 20639 / 38813 / 10
3 / 1
89 / 5
8152 / 2
22
27 / 10
457 / 519
25 / 67
51 / 48
745 / 449
50 / 11
6
22 / 24
4 / 6
7 / 28
67 / 1
42
42 / 9
3
245 / 3
64
85 / 150
544 / 620
170 / 114
402 / 1
50
2 / 2
212 / 8
678 /1
88
1 / 4
80 / 1
68
95 / 126
404 / 372
551 / 264
4 / 14 / 15 / 3
115
/ 1
63
62
4 / 6
21
4 / 0
1 / 3
436 / 6
36
65 / 4
4
138 / 1323 / 1
132 / 97
4 / 2
56 / 162
174 / 264
540 / 5
33
173 / 8
01 / 4
35 / 2248 / 334 / 2
397 / 6
02
14 / 2
72
19 / 1
87
LEGEND NCA Shaft No. 9 Intersection AnalyzedXXX / XXX AM / PM Peak Traffic Count
Saw
Mill
Riv
er P
kwy.
Bed
ford
Rd.
Taco
nic
Sta
te P
kwy.
County H
ouse
Rd.
Sle
epy
Hollo
w R
d.
Bro
adw
ay (R
te. 9
)
Bedford Rd.
Phelps Way (
Rte. 1
17)
Sleepy Hollow
Rd.
Old
Sle
epy
Hollo
w R
d.
Bro
ad
wa
y(R
te. 9)
Webber A
ve.
New Croton Aqueduct Shaft No. 9Existing Traffic Volume - AM / PM Hour
Figure 8.1.2-2
M&
E F
ile: P
:\E
nvi
ron
me
nta
l Qu
alit
y\C
roto
n\2
00
4 F
ina
l SE
IS\G
RA
PH
ICS
\08
-OF
FS
ITE
\01
-NC
A\0
2-S
H9
\TR
A\S
H9
-tra
-exc
on
B-1
1-2
2-0
3.c
dr
5/2
2/0
4
Not To Scale
Croton Water Treatment Plant

As noted above, each study area intersection was analyzed in terms of its capacity to accommodate existing traffic volumes and its resulting LOS using the HCM procedures. A summary of findings is presented in Table 8.1.2-1 with the key findings discussed below. See Section 4.9, Data Collection and Impact Methodologies, Traffic and Transportation for the procedural details. Currently, all 10 intersections in the study area operate at acceptable LOS D or better. The study area consists of five signalized and the five unsignalized intersections. A few individual movements or approaches of the signalized intersections do operate at unacceptable LOS D or worse. It is possible that there is insufficient green time to process the existing traffic demands for these movements. Such disproportions can be easily remedied by shifting a modest amount of time from one approach that has unused green time to another that is congested.
Safety. Accident data information was obtained from the period from 5/01/98 to 4/30/01. Table 8.1.2-2 below summarizes the accident data. Within the study area, there were a total of 47 reportable accidents that occurred between 5/01/98 and 4/30/01, of which none involved fatalities and 16 involved injuries.
Parking. There are no posted parking regulations on the local streets near the study locations, and because the area is generally commercial in nature, on-street parking demand is very low. Off-street lots provide parking for all of the offices and municipal buildings with ample parking-space supplies for employees and visitors.
Transit. The Shaft Site can be accessed from the Westchester County Bee-Line Route
No. 11. Route 11 provides service between White Plains and Croton-on-Hudson. The line services the Croton-Harmon station of the Metro North Railroad.
Final SEIS S9 7

EXISTING CONDITIONS
V/C DELAY V/C DELAYRATIO (SEC/ VEH) LOS RATIO (SEC/ VEH) LOS
EB – L 0.24 49.9 D 0.24 49.9 D EB – TR 0.66 33.8 C 0.48 29.9 C WB – L 0.12 47.7 D 0.33 52.0 D WB - TR 0.40 28.5 C 0.45 29.2 CNB – L 0.48 30.5 C 0.77 43.4 D
NB – TR 0.17 25.6 C 0.40 29.5 CSB – LT 0.14 44.1 D 0.16 44.5 DSB – R 0.03 42.0 D 0.11 43.3 D
Intersection 32.3 C 34.0 C
EB – L 0.39 21.6 C 0.39 15.2 BEB – T 0.47 30.7 C 0.34 21.2 CEB – R 0.94 62.3 E 0.35 21.4 CWB – L 0.55 21.7 C 0.25 12.9 B
WB – TR 0.77 37.9 D 0.72 26.5 CNB – LT 0.34 19.2 B 0.41 17.7 BNB – R 0.09 7.2 A 0.19 6.8 ASB – LT 0.95 55.4 E 0.39 17.6 BSB – R 0.25 8.1 A 0.07 6.2 A
Intersection 37.6 D 20.1 C
EB – L 0.01 10.7 B 0.06 13.1 BEB – TR 0.59 23.1 C 0.42 22.1 CWB – L 0.64 17.3 B 0.44 14.2 B
WB – TR 0.51 21.8 C 0.69 26.1 CNB – LT 0.29 19.3 B 0.43 16.0 BNB – R 0.45 21.0 C 0.16 13.8 B
SB – LTR 0.04 17.3 B 0.03 12.9 BIntersection 21.4 C 21.1 C
EB - LTR 0.61 60.2 E 0.38 53.6 DWB - LT 0.85 69.8 E 0.88 59.7 E WB – R 0.02 41.8 D 0.00 32.3 C
NB - LTR 0.47 25.1 C 0.52 32.1 CSB – LT 0.16 9.4 A 0.09 14.2 BSB – R 0.60 14.5 B 0.64 22.2 C
28.1 C 35.3 D
EB – LT 0.52 47.3 D 0.35 38.9 DEB – R 0.49 46.8 D 0.25 37.9 D
WB – LTR 0.11 53.1 D 0.03 48.8 DNB – LTR 0.43 19.4 B 0.48 18.3 BSB – LTR 0.40 11.4 B 0.48 18.4 B
Intersection 20.5 C 21.0 C
Broadway/Rt 9 at Beekman Avenue and
Hudson Terrace
Bedford Road at Taconic State
Parkway NB/SB Ramps
Bedford Rd @ Rt 9A NB/SB Ramps
Bedford Rd (Rt 117) / Phelps Way (Rt 117) /
Beech Hill Road
Beekman Avenue/Bedford Road
at Broadway (Route 9)/North Broadway
TABLE 8.1.2-1. 2002 EXISTING TRAFFIC CONDITIONS FOR NCA SHAFT NO. 9
SIGNALIZED INTERSECTIONS LANE GROUP WEEKDAY AM PEAK HOUR WEEKDAY PM PEAK HOUR
Final SEIS S9 8

EXISTING CONDITIONS
V/C DELAY V/C DELAYRATIO (SEC/ VEH) LOS RATIO (SEC/ VEH) LOS
NB – LT 0.01 7.9 A 0.01 7.8 AEB – LR 0.12 11.6 B 0.12 13.1 B
EB – LT 0.02 7.4 A 0.01 7.3 ASB – LR 0.04 8.8 A 0.04 9.1 A
EB – LTR 0.00 7.5 A 0.01 7.6 AWB – LTR 0.01 7.8 A 0.01 7.7 ANB – LTR 0.21 12.8 B 0.55 17.7 CSB – LTR 0.07 11.9 B 0.05 11.0 B
EB AWSC 7.44 A AWSC 7.43 ANB AWSC 7.22 A AWSC 7.20 ASB AWSC 7.11 A AWSC 6.97 A
EB – LTR 0.01 7.6 A 0.03 8.7 A WB – LTR 0.03 8.1 A 0.03 7.9 ANB – LTR 0.08 11.7 B 0.16 11.6 B SB – LTR 0.05 10.2 B 0.07 12.3 B
AWSC - All Way Stop Control
LANE GROUP
Sleepy Hollow Road at Webber Avenue1
Webber Avenue and Bedford Road
SEC/VEH - Seconds per Vehicle
Sleepy Hollow Rd at Bedford Road and County
House Road
Sleepy Hollow Road at Old Sleepy Hollow Road
V/C Ratio - Volume to Capacity Ratio
LOS - Level of Service
Note: 1. V/C values are not applicable for HCS analysis of All-Way Stop Controlled intersections.
TABLE 8.1.2-1. 2002 EXISTING TRAFFIC CONDITIONS FOR NCA SHAFT NO. 9
ABBREVIATIONS:EB-Eastbound, WB-Westbound, NB-Northbound, SB-SouthboundL-Left, T-Through, R-Right, E-W: East-West Roadway, N-S: North-South Roadway
WEEKDAY AM PEAK HOUR WEEKDAY PM PEAK HOUR UNSIGNALIZED INTERSECTIONS
Bedford Road at Sleepy Hollow Road
Final SEIS S9 9

Intersection Total # of
Reportable Accidents1
Total # of FTL
Total # of INJ
Total # of PDO
Bedford Road (Rt. 117) at Taconic State Parkway SB Off and NB On Ramps 17 0 2 15Bedford Road (Rt. 117) at Rt. 9A (Expwy.) Ramps 15 0 6 9Bedford Road (Rt. 117) and Phelps Way (Rt. 117) at Beech Hill Road 7 0 4 3
Bedford Road Sleepy Hollow Road 0 0 0 0Sleepy Hollow Road and Old Sleepy Road 1 0 0 1Sleepy Hollow Road at Bedford Road and County House Road 2 0 2 0Sleepy Hollow Road at Webber Ave. 0 0 0 0Webber Ave. and Bedford Road (Rt. 117) 1 0 1 0Broadway (Rt. 9) and North Broadway 4 0 1 3NOTES:
SOURCE:New York Department of TransportationABBREVIATIONS:FTL – Accidents with a fatalityINJ – Accidents with personal injuryPDO – Property Damage Only Accidents
TABLE 8.1.2-2 - NCA SHAFT NO. 9 INVENTORY OF ACCIDENTS
1. Reportable accidents consist of all fatal, injury or property damage accidents that exceed NYS criteria for minimum damage.
Final SEIS S9 10

Noise Analysis.
Preliminary Noise Screening for Mobile Source Noise Analysis. As outlined in the methodologies section, and as the initial step in the mobile source noise analysis, a preliminary noise screening using passenger car equivalence (PCE) values was performed to determine whether receptors located near the identified noise-sensitive route segments would experience an increase in noise level of 3 dBA or more as a result of the additional vehicular traffic generated by the project. Existing and future anticipated traffic data for the noise-sensitive route segments in the vicinity of the NCA Shaft No. 9 were analyzed to determine a PCE value for each segment for the morning peak hour, the afternoon peak hour, and the lowest traffic-volume off-peak (i.e. quietest) hour for the existing condition. The preliminary noise screening was performed by comparing the existing PCEs with existing PCEs plus the addition of the future project-generated PCEs. The equation shown below was used for this comparison. Future PCEs would be from additional traffic resulting from the proposed project.
If Existing PCEs + Future Project-Generated PCEs > 2.0 then an impact may occur.
Existing PCEs
This comparative analysis of existing PCEs and future PCEs was used to determine whether the receptors near the identified noise-sensitive route segments would potentially experience a doubling or more of PCEs. Three decibels (dBA) is the threshold used for screening purposes since it correlates to an increase that is perceptible to human auditory sensitivity. This threshold is used as a guideline to determine whether anticipated project impacts warrant further field measurements and subsequent Traffic Noise Model (TNM) analysis. A doubling of PCEs corresponds to a noise increase of three dBA. CEQR has established a project-induced noise level increase threshold of 3-5 dBA at receptors. Route segments that did not experience a doubling of PCEs due to project-induced traffic, therefore, would not exceed this impact threshold. Table 8.1.2-3 presents the comparison of existing PCEs to anticipated future maximum PCEs resulting from project related activities along route segments. The time period representing the largest increase in future PCEs resulting from the proposed project was used for this comparative analysis. The traffic generated by construction activities was not anticipated to change over the course of the construction period. As a result, mobile source noise levels would not fluctuate substantially over the course of the construction phase. The year 2013 was selected as a representative construction year because it falls at the approximate midpoint of the construction schedule. Following the preliminary noise screening using the comparative PCE analysis, it was determined that the only route segment that required a detailed analysis of potential impacts from mobile source noise was Sleepy Hollow Road between Old Sleepy Hollow Road Extension and County House Road because the predicted noise increase could be greater than 3 dBA. A detailed analysis using TNM was required for this route segment for the morning peak hour (8:00 – 9:00 AM).
Final SEIS S9 11

Period of Analysis (Weekday)
Existing PCEs Time New Passenger
Car New Trucks New PCEs PCE Ratio Incremental Change in dbA
Further Analysis Required?
1 Bedford Road btw Sleepy Hollow Road AM Peak 721 08:00 - 09:00 5 0 5 1.01 0.03 No& Saw Mill River Rd PM Peak 932 17:00 - 18:00 5 0 5 1.01 0.02 No
Quietest Period 267 06:00 - 07:00 0 0 0 1.00 0.00 No2 Sleepy Hollow Rd btw Bedford Rd & AM Peak 167 08:00 - 09:00 3 0 3 1.02 0.08 No
north of Old Sleepy Hollow Extension PM Peak 165 17:00 - 18:00 3 0 3 1.02 0.08 NoQuietest Period 27 06:00 - 07:00 0 0 0 1.00 0.00 No
3 Sleepy Hollow Rd btw Old Sleepy AM Peak 120 08:00 - 09:00 26 2 120 2.00 3.01 YesHollow Extension and County House PM Peak 147 17:00 - 18:00 26 1 73 1.50 1.75 NoRoad Quietest Period 108 12:00 - 13:00 0 2 94 1.87 2.72 No
4 County House Rd. btw Neperan & AM Peak 867 08:00 - 09:00 21 0 21 1.02 0.10 NoBedford Roads PM Peak 1036 17:00 - 18:00 21 0 21 1.02 0.09 No
Quietest Period 356 11:00 - 12:00 0 0 0 1.00 0.00 No5 Bedford Rd btw Webber Rd & North AM Peak 995 08:00 - 09:00 3 2 97 1.10 0.40 No
Broadway PM Peak 1140 17:00 - 18:00 3 1 50 1.04 0.19 NoQuietest Period 486 06:00 - 07:00 0 2 94 1.19 0.77 No
Notes:New PCEs = (no. of cars + no. of trucks(47))PCE ratio = (Existing PCEs + Project generated PCEs) / Existing PCEsIncremental change in dBA = 10 log (PCE ratio)
Methodology to establish AM/PM peak hour existing and project-induced PCEs discussed in Data Collection and Impact Methodologies, Section 4.10, Noise
the route segment. ATR and VC data from the nearest physically similar route sement for the quietest hour was used to establish volume and mix.
Quietest hour project-induced PCEs derived by assuming deliveries constant between 7 AM and 5 PM. Route segments established in Traffic Analysis Section.
Location
TABLE 8.1.2-3. COMPARISON OF EXISTING PCES TO FUTURE PCES FROM CONSTRUCTION IN VICINITY OF NCA SHAFT NO. 9 (2013)
Quietest hour existing PCEs calculated from traffic data (automatic traffic recorders, vehicle classifications, and turning movement counts). ATRs and VCs were used to establish traffic volume and mix along a route segment. Where ATRs were not available, the TMC count from the peak hour for the adjacent intersection was used to establish the trip assignment for
Draft SEIS S9 12

Mobile Source Noise. Mobile source noise monitoring was performed at NCA Shaft No. 9 in order to establish existing baseline conditions. The route segments considered for mobile source noise analysis are those presented in Table 8.1.2-4 and Figure 8.1.2-3. The roadways considered for analysis were those local routes identified as proposed transportation routes that connect the major thoroughfares to the Shaft Site. Sensitive receptors along the possible project’s transportation routes were identified. Route segments that did not contain sensitive receptors were not considered for further noise analysis. The major thoroughfares for commercial vehicles to the Shaft Site are Route 9 to the west and Route 9A to the east. In addition, the major thoroughfare that commuter traffic (i.e. passenger cars) could use to access the Shaft Site is the Saw Mill River Parkway to the east. Therefore, the potential for noise impacts along those roadways connecting North Broadway (Route 9), Saw Mill River Road (Route 9A), the Taconic Parkway, and the Saw Mill River Parkway to the Shaft Site were evaluated.
TABLE 8.1.2-4. ROUTE SEGMENTS CONSIDERED FOR MOBILE SOURCE NOISE ANALYSIS AT NCA SHAFT NO. 9
No. Route Segment 1 Sleepy Hollow Rd between Bedford Rd and north of Old Sleepy Hollow Extension 2 Sleepy Hollow Rd between Old Sleepy Hollow Extension and County House Road 3 County House Rd. between Neperan and Bedford Roads 4 Bedford Rd between County House Rd and North Broadway (Route 9)
On the basis of the comparative PCE analysis (Table 8.1.2-3), it was determined that a detailed analysis using TNM was required for Sleepy Hollow Road for the morning traffic peak hour (8:00 – 9:00 AM). Baseline noise measurements were collected at a representative noise-sensitive receptor location along Old Sleepy Hollow extension during the time of interest. The receptor identified for this Shaft Site, a private residence (NCA9-M1), was selected because it is the receptor closest to the Sleepy Hollow Road route segment. Receptor NCA9-M1 therefore would be the most impacted by project-related mobile sources traveling along the roadway. Figure 8.1.2-4 shows the location of receptor NCA9-M1. Traffic data (including traffic volume, vehicle classification, vehicle direction, and road geometries) were collected for the noise-sensitive route segment at the same time as the noise measurements were collected. These data were entered into the TNM model to determine if a good correlation existed between the measured existing Leq value and the TNM-calculated existing Leq value. Measured readings within three dBA of the TNM-calculated value represent a good correlation, as this increment of change in noise level is generally not perceptible to the human ear. A good correlation also indicates that vehicular traffic is the dominant noise source. Vehicular traffic was the dominant noise source at the various receptors along noise-sensitive route segments near the Shaft Site. Noise levels at mobile source receptors, therefore, vary with traffic volumes.
Final SEIS S9 13

Croton Water Treatment Plant
0118
WE
BB
ER
AV
E.
N
Eastview Site
SLAASGR NDS RD. (ROUTE 100C)
EN PE
RA
N
RD.
COUNTY HOUSE D R .
D RDRFODE
B
BEDFORD RD
DR
DR
OFDEB
SLE
EP
Y H
OLLO
W R
D.
.DR WOLLOH YPEELS
)71 E
T
UOR( YAW SPLEHP
BE
EC
H H
ILL R
D.
.EVA DROFDEB
)A
9 .E
TR(
DR
RE
VIR
LLI
M W
AS
YA
WK
RAP
ET
AT
S CI
NO
CAT
OLD
SLE
EP
Y
9
ET
UO
R Y
AW
DA
OR
BN
OR
TH
BR
OA
DW
AY
RO
UT
E 9
YW
KP
RE
VIR
LLI
M W
AS . Y
WK
P E
TAT
S CI
NO
CAT
HO
LLO
W R
D. E
XT.
NCA Shaft No. 9
Not to Scale
Figure 8.1.2-3
New Croton Aqueduct Shaft No. 9Route Segments
Mobile Source Noise Analysis
M&
E F
ile: H
:\E
nvi
ron
me
nta
l Qu
alit
y\C
roto
n\2
00
4 F
ina
l SE
IS\G
RA
PH
ICS
\08
-OF
FS
ITE
\01
-NC
A\0
2-S
H9
\NO
I\S
H9
-no
i-e
xco
nA
-11
-23
-03
.cd
r 5
/13
/04
WILSON PARK DR.
LEGEND
Route Segments Considered for Mobile Source Noise Analysis
SA
W M
ILL R
IVE
R R
D. (R
OU
TE
9 A
)
RO
UT
E 9
NO
RT
H B
RO
AD
WA
Y
NOTE: Numbers correspond to route segments listed in Table 8.1.2 - 6.
1
2
4
3
WA
LK
ER
RD

Croton Water Treatment Plant
New Croton Aqueduct Shaft No. 9Mobile Noise SourceMonitoring Location
Figure 8.1.2-4
M&
E F
ile: P
:\E
nvi
ron
me
nta
l Qu
alit
y\C
roto
n\2
00
4 F
ina
l SE
IS\G
RA
PH
ICS
\08
-OF
FS
ITE
\01
-NC
A\0
2-S
H9
\NO
I\S
H9
-no
i-e
xco
nB
-5-1
3-0
4.c
dr
5/1
3/0
4
NCA Shaft #7
LA
S
RD
LAKE
RA
FF
ENBERG
ROUTE 117
HUNTER AVE.
DEVRIES AVE.
ALB
AN
Y PO
ST R
D
HEM
LO
CK
DR
WEB
ER
AVE.
BEEKMAN AVE.
STIL
LMAN
RIVER
RD
BROWNS
DANARD
HIG
HLA
ND
BEDFORD
LA
CLE
AR
SAWMILL
RD
NO
RTH
BRO
AD
WAY
HU
DS
ON
RIV
ER
SAW
G R E E N B U R G H
RD
BEDFO
RD
RD
RD
.
GO
REY
BRO
OK
ROUTE 117
LEGEND
/u4
/cro
ton/e
is/lp
shft9
POCAN
TICO
RIV
ER
CARL’S BROOK
SLE
EP
Y H
OLLO
W R
D
N
500 0 500
SCALE IN FEET
LEGEND Mobile Source Monitoring Location
NCA9-M1
NCA SHAFT NO. 9

TABLE 8.1.2-5. EXISTING CONDITIONS AT RECEPTOR NCA9-M1 ON SLEEPY
HOLLOW ROAD (Leq, dBA)
Monitoring Location
Monitoring Period Measured Noise Level
Noise Level Calculated with TNM from
Monitoring Period Data
NCA9-M1 8:00 – 9:00 AM (AM Traffic Peak) 57.8 57.1
Once it was determined that the TNM model was a good predictor of traffic-generated noise, the traffic data collected for Sleepy Hollow Road during the traffic count program (corresponding to the morning traffic peak) were entered into TNM. Table 8.1.2-6 presents two TNM calculated Leq values, one calculated using the traffic count program data, and another calculated using data collected during the noise monitoring. The Leq calculated from noise monitoring data was 57.1, while the Leq calculated using traffic count program data was 57.5. This minor discrepancy between the TNM calculated Leq values is a result of anticipated traffic variations over different days. The measured noise level was considered a better reflection of actual noise levels as it included such elements as background noise. The measured existing noise level (57.8 dBA) therefore served as the basis for further analysis.
TABLE 8.1.2-6. EXISTING CONDITIONS ALONG SLEEPY HOLLOW ROAD USING TRAFFIC COUNT PROGRAM DATA
(Leq, dBA) Monitoring
Location Monitoring Period Noise Level Calculated
with TNM from Monitoring Period Data
Noise Level from TNM From Traffic Count
Program Data (dBA)
NCA9-M1 8:00 – 9:00 AM (AM Traffic Peak) 57.1 57.5
Stationary Source Noise. Stationary source noise monitoring was performed at the Shaft Site in order to establish existing baseline conditions. Noise monitoring was performed to reflect the construction times and to account for the receptor types that were within 1,500 feet of the Shaft Site. Baseline noise monitoring was performed on the west edge of the property boundary (see Figure 8.1.2-5). This location was chosen because it was the closest point on the property to a sensitive receptor. The dominant noise source at this location was traffic from Sleepy Hollow Road. Rockefeller State Park Preserve, the only sensitive receptor in the vicinity of the Shaft Site, is open from 7:00 AM until sunset. Noise level measurements were collected from 7:00 AM until 10:00 PM on both a weekday and a Sunday. Monitoring was performed in order to establish the period of the day with the potential for the greatest incremental change in noise. Monitoring periods were chosen to reflect both patron usage of the park and planned construction activities. Construction activities are anticipated to take place on Monday through Friday from 7:00 AM to 6:00 PM.
Final SEIS S9 16

Croton Water Treatment Plant
New Croton Aqueduct Shaft No. 9Stationary Noise Source
Monitoring Locations
Figure 8.1.2-5
M&
E F
ile: P
:\E
nvi
ron
me
nta
l Qu
alit
y\C
roto
n\2
00
4 F
ina
l SE
IS\G
RA
PH
ICS
\08
-OF
FS
ITE
\01
-NC
A\0
2-S
H9
\NO
I\S
H9
-no
i-e
xco
nC
-11
-23
-03
.cd
r 5
/13
/04
NCA Shaft #7
LA
S
RD
LAKE
RA
FF
ENBERG
ROUTE 117
HUNTER AVE.
DEVRIES AVE.
ALB
AN
Y PO
ST R
D
HEM
LO
CK
DR
WEB
ER
AVE.
BEEKMAN AVE.
STIL
LMAN
RIVER
RD
BROWNS
DANARD
HIG
HLA
ND
BEDFORD
LA
CLE
AR
SAWMILL
RD
NO
RTH
BRO
AD
WAY
HU
DS
ON
RIV
ER
SAW
G R E E N B U R G H
RD
BEDFO
RD
RD
RD
.
GO
REY
BRO
OK
ROUTE 117
LEGEND
/u4
/cro
ton/e
is/lp
shft9
POCAN
TICO
RIV
ER
CARL’S BROOK
SLE
EP
Y H
OLLO
W R
D
N
NCA9-S1
500 0 500
SCALE IN FEET
LEGEND 1,500 ft. Radius Study Area NCA Shaft No. 9 Proximate Receptor Monitoring Locations Baseline Monitoring Location
NCA SHAFT NO. 9
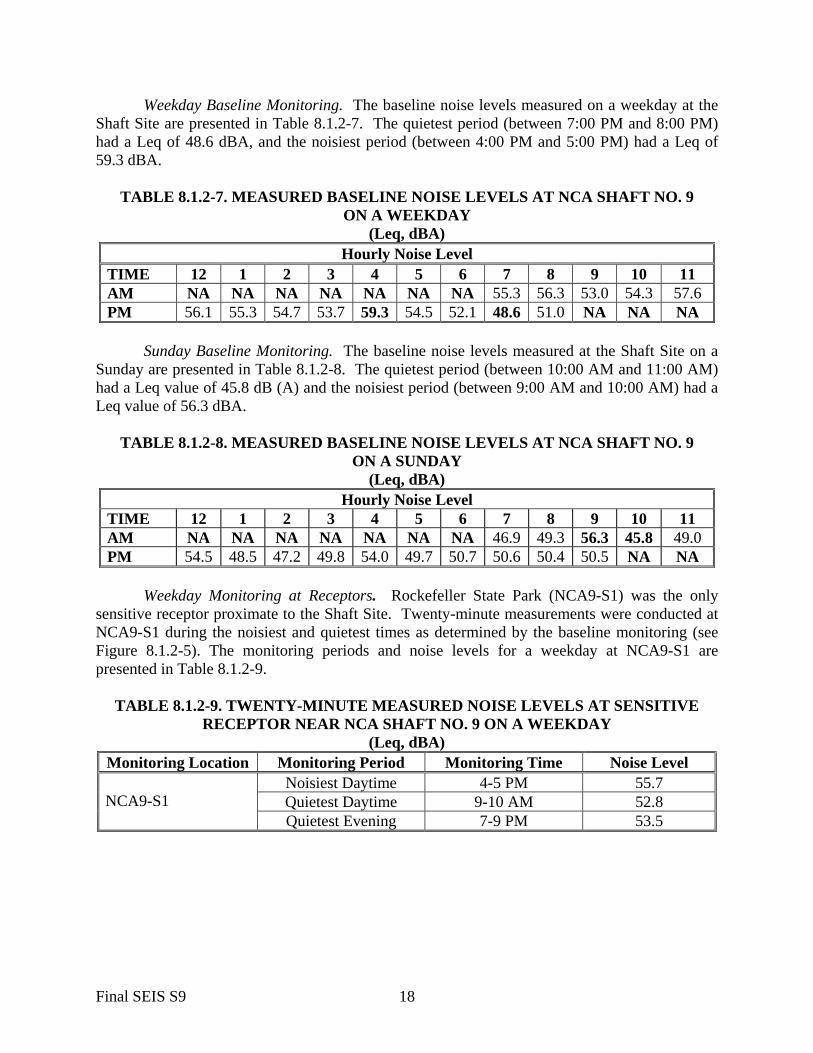
Weekday Baseline Monitoring. The baseline noise levels measured on a weekday at the Shaft Site are presented in Table 8.1.2-7. The quietest period (between 7:00 PM and 8:00 PM) had a Leq of 48.6 dBA, and the noisiest period (between 4:00 PM and 5:00 PM) had a Leq of 59.3 dBA.
TABLE 8.1.2-7. MEASURED BASELINE NOISE LEVELS AT NCA SHAFT NO. 9
ON A WEEKDAY (Leq, dBA)
Hourly Noise Level TIME 12 1 2 3 4 5 6 7 8 9 10 11 AM NA NA NA NA NA NA NA 55.3 56.3 53.0 54.3 57.6 PM 56.1 55.3 54.7 53.7 59.3 54.5 52.1 48.6 51.0 NA NA NA
Sunday Baseline Monitoring. The baseline noise levels measured at the Shaft Site on a
Sunday are presented in Table 8.1.2-8. The quietest period (between 10:00 AM and 11:00 AM) had a Leq value of 45.8 dB (A) and the noisiest period (between 9:00 AM and 10:00 AM) had a Leq value of 56.3 dBA.
TABLE 8.1.2-8. MEASURED BASELINE NOISE LEVELS AT NCA SHAFT NO. 9 ON A SUNDAY
(Leq, dBA) Hourly Noise Level
TIME 12 1 2 3 4 5 6 7 8 9 10 11 AM NA NA NA NA NA NA NA 46.9 49.3 56.3 45.8 49.0 PM 54.5 48.5 47.2 49.8 54.0 49.7 50.7 50.6 50.4 50.5 NA NA
Weekday Monitoring at Receptors. Rockefeller State Park (NCA9-S1) was the only
sensitive receptor proximate to the Shaft Site. Twenty-minute measurements were conducted at NCA9-S1 during the noisiest and quietest times as determined by the baseline monitoring (see Figure 8.1.2-5). The monitoring periods and noise levels for a weekday at NCA9-S1 are presented in Table 8.1.2-9.
TABLE 8.1.2-9. TWENTY-MINUTE MEASURED NOISE LEVELS AT SENSITIVE RECEPTOR NEAR NCA SHAFT NO. 9 ON A WEEKDAY
(Leq, dBA) Monitoring Location Monitoring Period Monitoring Time Noise Level
Noisiest Daytime 4-5 PM 55.7 Quietest Daytime 9-10 AM 52.8 NCA9-S1 Quietest Evening 7-9 PM 53.5
Final SEIS S9 18

Sunday Monitoring at Receptors. Twenty-minute monitoring periods and noise levels for a Sunday at Receptor NCA9-S1 are presented in Table 8.1.2-10.
TABLE 8.1.2-10. TWENTY-MINUTE NOISE LEVELS AT SENSITIVE RECEPTOR NEAR NCA SHAFT NO. 9 ON A SUNDAY
(Leq, dBA)
Monitoring Location Monitoring Period Monitoring Time Noise Level Noisiest 9-10 AM 52.7 NCA9-S1 Quietest 10-11 AM 51.4
Air Quality. A screening level analysis was performed based on the anticipated level of
construction activity at NCA Shaft No. 9. No operational impacts to the air quality within the study area are anticipated as part of this project. Potential impacts during construction are discussed in the Potential Construction Impacts section below. Historic and Archaeological Resources. Pre-contact Archaeological Potential. Documentary research found that the project site is sensitive for prehistoric cultural resources. According to early records of the area, the location of one of the main native villages, called Aliponeck (the place of many elms), was near the mouth of the Pocantico River in Sleepy Hollow. Further, the name Pocantico is derived from the native word “Po-can-tee-co” meaning “a swift dark stream running between two hills.” For the assessment of sensitivity, a review of archaeological literature was completed. As early as the 1920s, historian and archaeologist Arthur C. Parker identified two Native American sites within a two-mile radius of the project site. To the north, a small native village was identified in the Town of Ossining, and to the southwest, Native American fortifications and mounds were identified near the Pocantico River in the location of the Old Dutch Church in Sleepy Hollow. To the west of the site, from Croton to Dobbs Ferry, numerous prehistoric sites have been identified by Parker, historian Robert Bolton and archaeologist Louis Brennan along the Hudson River and its many tributaries. A site file search at the NYSM and the OPRHP found that there were 5 identified prehistoric sites within a one-mile radius of NCA Shaft No. 9. OPRHP or NYSM # Site Identifier Site Description 5235 ACP WEST NO# Traces of Occupation 5185 ACP WEST NO-49 Fortifications/Mounds 5236 ACP WEST NO# Traces of Occupation A11960.000015 Site #91 Late Archaic Campsite A11960.000014 Site #49 Late Archaic-Early Woodland
Final SEIS S9 19

In addition, four archaeological surveys have been conducted within the same radius. A Phase 1A Assessment of the Kendal-on-Hudson Project site, located approximately ½ mile west of NCA Shaft No. 9, found that the project area was sensitive for the presence of prehistoric cultural materials.1 Archaeological testing was recommended at this site. Adjacent to the Kendal Property, on the grounds of Phelps Memorial Hospital, a site assessment was completed for the location of a communications tower.2 Six test units were excavated and no trace of prehistoric material was encountered. Approximately ½ mile to the south of the Shaft No, 9, another survey was conducted along Route 448 in Sleepy Hollow.3 The survey was confined to the road and found that previous excavation and grading associated with road construction and drainage, as well as the installation of buried utility lines had disturbed the entire route. The final report examined was a Phase 1B Field Survey of the Proposed Pocantico Hill State Park, now the Rockefeller State Park Preserve.4 This survey identified Sites #91 and #49 dating the Late Archaic and Early Woodland periods, now on file with the State Historic Preservation Office. Both of these sites are located less than ¼ mile to the west of NCA Shaft No. 9. Historic documents describe the “sale” of the Native lands to European settlers throughout the seventeenth century. In 1680, the local Weckquaskeck Indians sold a large strip of land surrounding the Pocantico to Frederick Philipse. According to nineteenth century historian E. M. Ruttenber, the Weckquaskeck chieftaincy concentrated in the territory encompassing the towns of Greenburgh, White Plains and Mount Pleasant (1992). Pre-contact Archaeological Sensitivity. The physiographic characteristics of the current project site and surrounding park, together with the information extracted from the documentary record and the number of prehistoric sites identified in the vicinity, suggests that Native American peoples likely exploited the project site. The Pocantico River, which travels roughly northeast-southwest, is just north of the project site. The river provided an ample water supply and was well suited for supporting game animals and agricultural activity. Topographic maps from the nineteenth and twentieth centuries indicate that the terrain found in the location of the project site is characterized by low hills, brooks and ponds, and open fields that are surrounded by forest land. These attributes likely provided an ideal locale for primary and secondary prehistoric sites. The late nineteenth century construction of the standing stone building and associated spillway however, would have severely impacted any precontact resources in this location. Outside the footprint of these structures, the surrounding terrain may be sensitive for precontact resources. Two soil borings were drilled in the area to the east of the Shaft (Figure 9-2). The boring data indicate that there is at least 15 feet of fill to the east of the Shaft building. It is likely that the strata identified as fill during analysis may be displaced soils from the construction of the superstructure, which extends to a depth of approximately 20 feet below the
1 City/Scape Cultural Resource Consultants. 1998. Phase 1A Literature Review, Kendal-on-Hudson, Village of Sleepy Hollow, Westchester County, New York. Prepared for Divney, Tung and Schalbe. On file at the NYSM. 2 Oberon, Steven. 1999. Phase 1 Cultural Resources Survey Site Assessment and Site Identification Phases, Phelps memorial Hospital Tower Site, Village of Sleepy Hollow, Westchester County, New York. Prepared for Cough Harbour & Associates. 3 Santangelo, Mary C. 1991. A Cultural Resource Survey of Route 448 (Route 9 to Hamlet of Pocantico Hills), Village of North Tarrytown, Town of Mount Pleasant. Prepared for the NYDOT. On file at the NYSM. 4 Hartgen Archaeological Associates, Inc. 1982. Phase 1B Archaeological Field Survey for the Proposed Pocantico Hills State Park. Prepared for Sasaki Associates.
Final SEIS S9 20

ground surface. Therefore, any potential precontact resources may be deeply buried under the fill in the area to the east of the Shaft building. Historical Archaeological Potential. During the late seventeenth and through most of the eighteenth century, the project site was part of Philipsburgh Manor. Frederick Philipse, who began amassing property in 1680, eventually owned much of what is now Westchester County. All over his vast estate Philipse leased large sections of his property to tenant farmers. Small farmhouses with their associated outbuildings and cultivated fields were likely present until the Revolutionary War. Most of these dwellings were probably located along the main transportation routes, where the terrain is less hilly and more suited for homelots and agricultural pursuits. Sleepy Hollow Road was one of these old transportation corridors and historical maps indicate that numerous farms were located adjacent to it. The stone manor house, barn, stone arch bridges, and nearby dam that are in the Pocantico River valley to the west are all historic sites. The earliest maps that depict individual buildings in this location date to 1851 and 1867.5 In 1867 a large mill complex, called Harts Mills, was located on the west side of Sleepy Hollow Road, directly across from the project site (Beers 1867, Figure 9-3). The former village historian of North Tarrytown believes that this complex may have been the site of a Philipse mill during the colonial period. On the east side, a small structure, identified as “J. Carl” was depicted on the 1867 map. Historical records indicate that Mr. Carl also had a mill in the nineteenth century. It is unknown if he sold his mill to George Hart (Harts Mill) or built his own complex on the small tributary brook located on the east side of the road within the project site. The entire area, including the mill complex, was immortalized when author Washington Irving described the valley in his Legend of Sleepy Hollow. Irving further described a mill in the hollow as “an old goblin-looking mill, situated among rocks and waterfalls, with clanking wheels and rushing streams.” In a later book, Wolferts Roost, Irving wrote that “in a remote part of the hollow where the Pocantico forced its way down rugged rocks stood Carl’s Mill, the haunted house of the neighborhood.” These writings brought fame to the area and a drawing of Carl’s Mill was published in Gleason’s Pictorial in 1853. The buildings in the area fell into ruin during the 1890s and were razed by the Rockefeller family. Historical Archaeological Sensitivity. A site file search at the NYSM and the OPRHP found that there was one identified historical site within a one-mile radius of NCA Shaft No. 9. This site, along with other traces of historical occupation, was identified during an archaeological survey of Proposed Pocantico Hill State Park, now the Rockefeller State Park Preserve.6 Site #94 (A11908.000018), a rock quarry, was identified and recorded with the State Historic Preservation Office. In addition, to that site, the survey included information on the presence of fieldstone features near the Pocantico River. Although research found that the locale surrounding the stream was clearly exploited by historic peoples, there is no evidence that any structures or features were once present on the project site prior to the construction of NCA Shaft 5 Sidney and Neff. 1851. Map of Westchester County, New York. Newell S. Brown, White Plains, New York. Beers. 1867. Atlas of New York and Vicinity. F.W. Beers and Co., New York. 6 Hartgen Archaeological Associates, Inc. 1982. Phase 1B Archaeological Field Survey for the Proposed Pocantico Hills State Park. Prepared for Sasaki Associates.
Final SEIS S9 21

No. 9. Further, because the site was completely altered by the construction of the stone building and associated spillway, there is also no possibility that any unrecorded historical resources are still present within the footprint the building above NCA Shaft No. 9 and the associated spillway. Historic Resources in the Project Area. NCA Shaft No. 9 is situated above the New Croton Aqueduct (1884-1890). The stone building and adjacent stone-lined spillway, both associated with the large Croton water management system, are located on the site. Each of these facilities, including the underground aqueduct, is eligible for listing on the National Register of Historic Places. The stone building relates closely in design to other Shaft buildings and gate houses erected along the route of the New Croton Aqueduct. The existing building is approximately 42 x 44 feet and 20 feet tall. The building extends down approximately 20 feet below the surface. At present, the horizontal extent of disturbance from the construction of the stone building is unknown. Two twentieth century pump buildings are also present on the site to the east of the stone structure. These buildings are not considered contributing elements of the New Croton Aqueduct system. They are later structures that are part of the water supply system for the Village of Sleepy Hollow, and as such are not eligible for listing on the National Register of Historic Places. The surrounding Rockefeller State Park Preserve (1984) was once part of the vast holdings of the Rockefeller family. Beginning in 1893, John D. Rockefeller, Sr., and later John D. Rockefeller, Jr., began purchasing large land parcels, mostly old farms, in Mount Pleasant and North Tarrytown (now Sleepy Hollow). The main body of the family estate, including the main mansion called Kykuit, is located to the southwest of the site in the hamlet of Pocantico Hills. The Shaft feature is visually and physically separated from any standing historic structures associated with the Rockefeller family. During the early twentieth century, the Rockefellers demolished most of the old farmhouses, although many of the old stone fences, picturesque fields, and historic farm roads were maintained. The Rockefeller State Park Preserve itself may be considered historically important as a representative example of the American public park movement, but no formal process has been undertaken to definitively determine its eligibility for landmarking.
Hazardous Materials. There is the potential for hazardous materials to exist at NCA Shaft No. 9. These materials could consist of asbestos-containing materials (ACM) or lead-based paint. A hazardous material evaluation would be conducted within NCA Shaft No. 9 in order to ensure environmental safety for construction workers and NYCDEP personnel and to ensure compliance with all applicable hazardous material rules and regulations. In addition, potential contamination within NCA Shaft No. 9 would not pose a threat to public health or safety since the facility is a restricted use facility. The information gathered as part of this evaluation would be used to develop a Construction Contamination Management Plan (CCMP) and to determine the proper disposal requirements for material removed from the facility as part of the rehabilitation conducted as part of this project. The hazardous materials investigation to determine the appropriate level of material handling in accordance with a detailed CCMP would ensure the safety of public health.
Final SEIS S9 22
Natural Resources.
Vegetation. Lawn/landscaped habitat occurs east of Sleepy Hollow Road, surrounding the Shaft building and two other buildings. This habitat type is comprised primarily of grass-dominated areas with occasional red cedar (Juniperus virginiana) and sycamore (Platanus occidentalis). The periphery of the lawn area is occupied primarily by invasive vegetative species such as tree of heaven (Ailanthus altissima) in the overstory; Japanese knotweed (Polygonum cuspidatum), poison ivy (Rhus radicans) and wine raspberry (Rubus phoenicolasius) in the vine and shrub layers; and mugwort (Artemisia vulgaris), foxtail grass (Alopecurus sp.), curled dock (Rumex crispus), and crown vetch (Coronilla varia) in the herbaceous layers. These species make up the transition zone between the lawn/landscaped habitat and steeply sloped adjacent undisturbed woodlands (Figure 8.1.2-6). The on-site oak-tulip tree forest habitat upslope from the Shaft Site and extending east to the property boundary most closely resembles the “rich mesophytic forest” type as described in Ecological Communities of New York State7, a hardwood forest with species characteristic of well-drained soils favorable to the dominance of a variety of tree species. The on-site forest habitat is dominated in the overstory by red oak (Quercus rubra), sugar maple (Acer saccharum), and shagbark hickory (Carya ovata), with ironwood (Carpinus caroliniana), witch hazel (Hamamelis virginiana), flowering dogwood (Cornus florida), and sassafrass (Sassafras albidum) as the dominant understory shrubs. Although sparse, the herbaceous layer consists primarily of Christmas fern (Polystichum acrostichoides), and interrupted fern (Osmunda claytoniana). Closer to the on-site stream (Carl’s Brook, also known as Welker’s Brook), which traverses the site adjacent to the Shaft building (see below), tulip tree (Liriodendron tulipifera), black birch (Betula nigra), red maple (Acer rubrum), American elm (Ulmus americana), sycamore (Platanus occidentalis), American beech (Fagus grandifolia) and green ash (Fraxinus pennsylvanica) predominate with an understory of spicebush (Lindera benzoin), garlic mustard (Alliaria officinalis), and Christmas fern (Polystichum acrostichoides). Along the northern property boundary, the forest is dominated by sugar maple (Acer saccharum), American elm (Ulmus americana) and white ash (Fraxinus americana) in the overstory; privit (Ligustrum vulgare), wine Raspberry (Rubus phoenicolasius) and Oriental bittersweet (Celastrus orbiculata) in the shrub and vine layers; and garlic mustard (Alliaria officinalis) in the herbaceous layer. A portion of the stream corridor just east of the Shaft building consists primarily of open, successional old-field habitat with a mix of invasive and roadside species showing a history of disturbance/clearing that slowly grades into a succession southern hardwood forest. This portion of the Shaft Site borders the stream corridor as it flows west of the Shaft Site within a confined, bulkheaded drainage corridor prior to exiting the Shaft Site beneath Sleepy Hollow Road.
7 New York State Department of Environmental Conservation. 1990. Ecological Communities of New York State. New York Natural Heritage Program. New York, NY.
Final SEIS S9 23

Building
Natural ResourcesNCA Shaft No. 9
Figure 8.1.2-6
M&
E F
ile: P
:\E
nvi
ron
me
nta
l Qu
alit
y\C
roto
n\2
00
4 F
ina
l SE
IS\G
RA
PH
ICS
\08
-OF
FS
ITE
\01
-NC
A\0
2-S
H9
\NA
T\S
H9
-na
t-e
xco
nA
.cd
r 5
/22
/04
Croton Water Treatment Plant
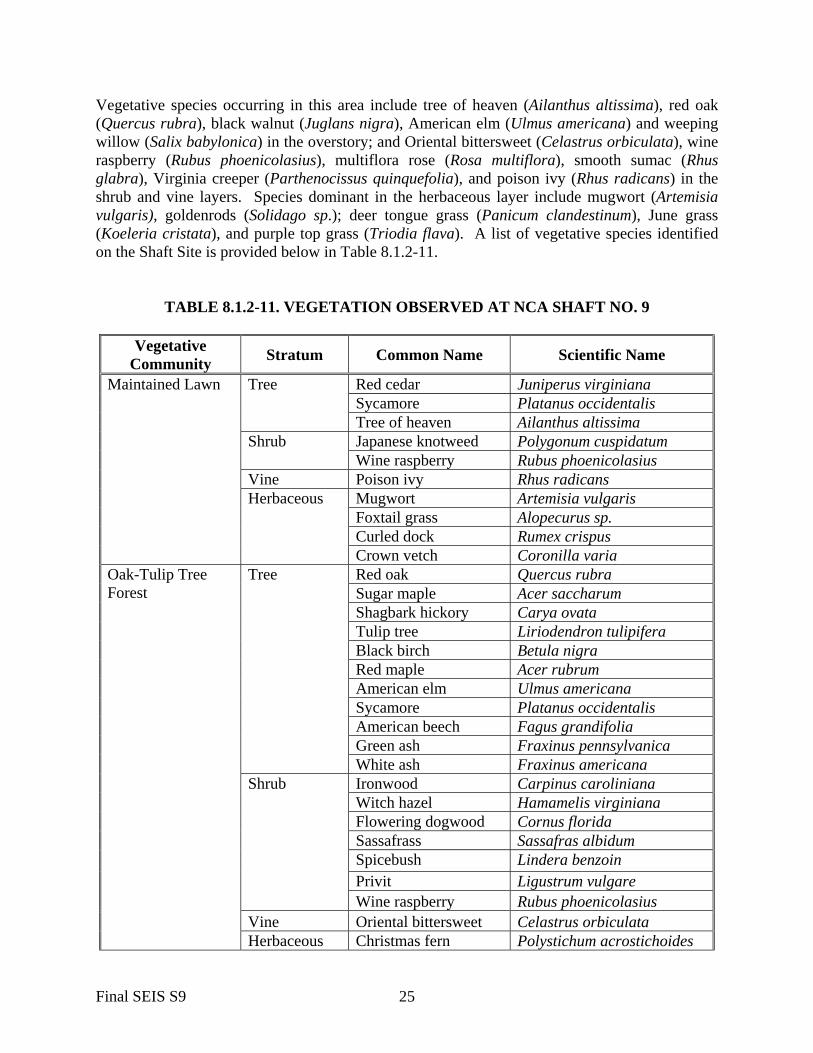
Vegetative species occurring in this area include tree of heaven (Ailanthus altissima), red oak (Quercus rubra), black walnut (Juglans nigra), American elm (Ulmus americana) and weeping willow (Salix babylonica) in the overstory; and Oriental bittersweet (Celastrus orbiculata), wine raspberry (Rubus phoenicolasius), multiflora rose (Rosa multiflora), smooth sumac (Rhus glabra), Virginia creeper (Parthenocissus quinquefolia), and poison ivy (Rhus radicans) in the shrub and vine layers. Species dominant in the herbaceous layer include mugwort (Artemisia vulgaris), goldenrods (Solidago sp.); deer tongue grass (Panicum clandestinum), June grass (Koeleria cristata), and purple top grass (Triodia flava). A list of vegetative species identified on the Shaft Site is provided below in Table 8.1.2-11.
TABLE 8.1.2-11. VEGETATION OBSERVED AT NCA SHAFT NO. 9
Vegetative Community Stratum Common Name Scientific Name
Red cedar Juniperus virginiana Sycamore Platanus occidentalis
Tree
Tree of heaven Ailanthus altissima Japanese knotweed Polygonum cuspidatum Shrub Wine raspberry Rubus phoenicolasius
Vine Poison ivy Rhus radicans Mugwort Artemisia vulgaris Foxtail grass Alopecurus sp. Curled dock Rumex crispus
Maintained Lawn
Herbaceous
Crown vetch Coronilla varia Red oak Quercus rubra Sugar maple Acer saccharum Shagbark hickory Carya ovata Tulip tree Liriodendron tulipifera Black birch Betula nigra Red maple Acer rubrum American elm Ulmus americana Sycamore Platanus occidentalis American beech Fagus grandifolia Green ash Fraxinus pennsylvanica
Tree
White ash Fraxinus americana Ironwood Carpinus caroliniana Witch hazel Hamamelis virginiana Flowering dogwood Cornus florida Sassafrass Sassafras albidum Spicebush Lindera benzoin Privit Ligustrum vulgare
Shrub
Wine raspberry Rubus phoenicolasius Vine Oriental bittersweet Celastrus orbiculata
Oak-Tulip Tree Forest
Herbaceous Christmas fern Polystichum acrostichoides
Final SEIS S9 25

TABLE 8.1.2-11. VEGETATION OBSERVED AT NCA SHAFT NO. 9
Vegetative Community Stratum Common Name Scientific Name
Interrupted fern Osmunda claytoniana Garlic mustard Alliaria officinalis Tree of heaven Ailanthus altissima Red oak Quercus rubra Black walnut Juglans nigra American elm Ulmus americana
Tree
Weeping willow Salix babylonica Wine raspberry Rubus phoenicolasius Multiflora rose Rosa multiflora
Shrub
Smooth sumac Rhus glabra Oriental bittersweet Celastrus orbiculata Virginia creeper Parthenocissus quinquefolia
Vine
Poison ivy Rhus radicans Mugwort Artemisia vulgaris Goldenrods Solidago sp. Deer tongue grass Panicum clandestinum June grass Koeleria cristata
Successional Southern Hardwood Forest
Herbaceous
Purple top grass Triodia flava Red maple Acer rubrum Tree Yellow birch Betula alleghaniensis Stinging nettle Urtica dioica Shrub Soft stem bulrush Scirpus validus Nut sedge Cyperus esculentus Soft rush Juncus effusus Sensitive fern Onoclea sensibilis Smartweeds Polygonum sp. Soft stem bulrush Scirpus validus Tearthumb Polygonum arifolium Skunk cabbage Symplocarpus foetidus
Floodplain Forest Wetland
Herbaceous
Jewelweed Impatiens capensis Notes: Based on field surveys conducted on August 2001 and June 2002.
Wetlands, Waterways, and Floodplains. An on-site stream, Carl’s Brook (also known
locally as Welker’s Brook), traverses the Shaft Site, entering from the upland woods southeast of the Shaft building. Located just south of the Shaft Site, the stream flows off-site beneath Sleepy Hollow Road and eventually drains into the Pocantico River. The portion of the stream located on-site is approximately 425 feet in length, five-feet in width and ranges in depth from approximately 3 to 10 inches at the time of the survey. This stream is not mapped by the NYSDEC and is therefore unlikely to be regulated pursuant to Article 15, Title 5 of the Environmental Conservation Law pertaining to the Protection of Waters Program. These regulations apply to any disturbance to the bed or banks of a regulated stream. Ultimately, the
Final SEIS S9 26

water quality classification of this stream would be determined by the NYSDEC. There are no mapped State or Federal wetlands along the upper reaches of the Pocantico River. Both the NYSDEC and United States Army Corps of Engineers (USACOE) regulate the river and shoreline. The tidal pools and riverine impoundment above the dam at Philipsburg Manor are mapped.
The southeastern portions of the stream lie within a riparian-forested area, shaded by a dense overstory, with surrounding rock outcrops. Towards the western end of the Shaft Site, starting at the Shaft building, the stream enters an open field type habitat where it is then contained in an artificial waterway—a “blow-off outlet” built for emergency discharge of the aqueduct at NCA Shaft No. 9. The water quality parameters measured are shown in Table 8.1.2-12, below. The parameters were measured using a Quanta Hydrolab Water Meter and a La Motte 2020 Turbidity Meter. Measurements were taken at two different locations along the stream, within both the open field and forested portions of the waterway.
TABLE 8.1.2-12. WATER QUALITY MEASUREMENTS AT NCA SHAFT NO. 9 STREAM (CARL’S BROOK)
Water Quality Parameter Measurement
Dissolved Oxygen (mg/L) 6.15-7.00 Temperature (◦C) 21.7-23.5 Turbidity (NTU) 0.81 Specific Conductivity (mS/cm) 0.27-0.28 Notes: Data collected on August 10, 2001.
The National Wetland Inventory (NWI) has classified the stream corridor and associated wetlands on-site as Riverine, Upper Perennial, Unconsolidated Bottom, and Permanently Flooded (R3UBH). This classification describes riverine systems as “all wetlands and deepwater habitats contained in natural or artificial channels periodically or continuously containing flowing water or which form a connecting link between the two bodies of standing water.” Upper perennial subsystems are characterized by a high gradient, perennial water flow. “Unconsolidated bottom” and “permanently flooded” characterizations refer to streams with a substrate having 25 percent of particles less than six to seven centimeters in size and having permanent coverage of water throughout the year.8 In August of 2001, the Shaft Site was inspected for regulated wetlands in accordance with the USACOE Wetlands Delineation Manual (1987) and found to have a narrow stretch of wetlands immediately adjacent to both sides of the stream corridor. These wetlands have been flagged and surveyed. Hydric vegetation documented within this riparian wetland include nut sedge (Cyperus esculentus), stinging nettle (Urtica dioica), soft rush (Juncus effusus), sensitive fern (Onoclea sensibilis), smartweeds (Polygonum sp.), soft stem bulrush (Scirpus validus), skunk cabbage (Symplocarpus foetidus), jewelweed (Impatiens capensis), red maple (Acer rubrum), tearthumb (Polygonum arifolium), and yellow birch (Betula alleghaniensis). A portion of the lower stream 8 Cowardin, L.M., V. Carter, F. Golet, and E. LaRoe.1979. Classification of Wetlands and Deepwater Habitats of the United States. U.S. Fish and Wildlife Service. 103 pp.
Final SEIS S9 27

north of the Shaft building also contains ACOE wetlands. However, this stream is largely confined by the stonewalls lining the streambed, which were built to handle the flows from the blow-off.
Fish and Benthic Macroinvertebrates. Benthic invertebrate samples were collected at the Shaft Site on August 10, 2001. Field sampling techniques are described in Section 4.14, Data Collection and Impact Methodologies, Natural Resources. Freshwater macroinvertebrates are aquatic organisms such as aquatic insects, worms, clams, snails, and crustaceans9. Because of their abundance and their sensitivity to environmental impacts, they are widely used in biomonitoring programs for assessing water quality. The results of this analysis are included in Table 8.1.2-13, below. TABLE 8.1.2-13. BENTHIC INVERTEBRATE SPECIES IDENTIFIED AT NCA SHAFT
NO. 9 STREAM (CARL’S BROOK)
Common Name Taxon Number Found in Sample Percent Tolerance
Index Tubeworms Tubificidae 2 2.2 10 Fingernail clams Sphaeriidae 1 1.1 6 Stoneflies Leuctridae 11 11.8 0 Caddisflies Hydropsychidae 5 5.4 5 Biting midges Ceratopogonidae 1 1.1 6 Midges Chironomidae 73 78.5 6 Total Specimens 93 100.0 Total Families 6 Hilsenhoff Family Biotic Index
5.32
(Water Quality Rating) “Good” (Degree of Organic Pollution)
“Some Organic Pollution”
Notes: 1. Sample matrix processed in entirety. 2. Tolerance indices and Hilsenhoff’s Biotic Index range from 0 to 10 (0 = Pollution Sensitive; 10 = Pollution Tolerant) Caddisflies and stonefly species found on-site are sensitive to pollution, and can be indicators of good water quality. Stonefly species, in particular, are often found in cool, clean streams with high levels of dissolved oxygen. Midge and aquatic worm species, however, are very tolerant of polluted aquatic conditions and their presence in large numbers may indicate eutrophication10. In addition to those species identified in Table 8.1.2-13 above, crayfish (Decapoda) and water striders (Hemiptera) were also observed on-site. Crayfish are found in a variety of locations, and can indicate a range of water quality from pristine to severely pollute.
9 NYSDEC. Key to Aquatic Macroinvertebrates. http://www.dec.state.ny.us/website/dow/stream/index.htm 10 Webb Rick et al. 1999. The Stream Study. http://www.people.virginia.edu/~sos-iwla/Stream-Study/StreamStudyHomePage/StreamStudy.HTML.
Final SEIS S9 28

Fish species identified on-site were limited to the black-nose dace (Rhinichthys atratulus). Black-nose dace are small minnows, about 2.5 inches long, and may be distinguished by the black lateral band, which extends around the snout backward through the eye to the tail. Their diet consists primarily of aquatic invertebrates, such as midges, which were identified at the Shaft Site. On-site stream depth and temperatures are likely to limit species variety.11
Birds. A variety of avian species were identified during the site visits. Bird species
included black cap chickadee (Parus bicolor), blue jay (Cyanocitta cristata), red tailed hawk (Buteo jamaicensis), wild turkey (Meleagris gallopavo), belted kingfisher (Ceryle alcyon), and northern cardinal (Cardinalis cardinalis). The open, mowed habitat at the Shaft and spillway would not be anticipated to support a diverse bird fauna. However, the woods surrounding the Shaft Site could be home to many species. Birds potentially occurring at the Shaft Site are listed in Table 8.1.2-14. TABLE 8.1.2-14. AVIAN SPECIES OBSERVED AND POTENTIALLY OCCURRING AT
NCA SHAFT NO. 9
Common Name Scientific Name Migratory (Y/N) Double-crested Cormorant Phalacrocor axauritus N Green Heron Butorides virescens (striatus) N Black-crowned Night-Heron Nycticorax nycticorax N Turkey Vulture Cathartes aura N Canada Goose Branta canadensis N Wood Duck Aix sponsa N American Black Duck Anas rubripes N Mallard Anas platyrhynchos N Sharp-shinned Hawk Accipiter striatus Y Broad-winged Hawk Buteo platypterus Y Red-tailed Hawk Buteo jamaicensis N American Kestrel Falco sparverius Y Ring-necked Pheasant Phasianus colchicus N Ruffed Grouse Bonasa umbellus N Wild Turkey Meleagris gallopavo N Killdeer Charadrius vociferus Y Spotted Sandpiper Actitis macularia Y American Woodcock Scolopax minor Y Ring-billed Gull Larus delawarensis N
11 Appalachian Ecological Consultants. 2000. Endangered and Threatened Animal Species Inventory Laurel Creek Project, Transylvania County, NC. http://www.sylvanhabitat.com/aqua.htm
Final SEIS S9 29

TABLE 8.1.2-14. AVIAN SPECIES OBSERVED AND POTENTIALLY OCCURRING AT NCA SHAFT NO. 9
Common Name Scientific Name Migratory (Y/N)
Rock Dove Columba livia N Mourning Dove Zenaida macroura N Black-billed Cuckoo Coccyzuserythropthalmus Y Yellow-billed Cuckoo Coccyzus americanus Y Eastern Screech-Owl Otus asio N Great Horned Owl Bubo virginianus N Barred Owl Strix varia N Chimney Swift Chaetura pelagica N Ruby-throated Hummingbird Archilochus colubris Y Belted Kingfisher Ceryle alcyon N Red-bellied Woodpecker Melanerpes carolinus N Downy Woodpecker Picoides pubescens N Hairy Woodpecker Picoides villosus N Northern Flicker Colaptes auratus N Pileated Woodpecker Dryocopus pileatus N Eastern Wood-Pewee Contopus virens Y Willow Flycatcher Empidonax traillii Y Least Flycatcher Empidonax minimus N Eastern Phoebe Sayornis phoebe Y Great Crested Flycatcher Myiarchus crinitus Y Eastern Kingbird Tyrannus tyrannus N White-eyed Vireo Vireo griseus Y Yellow-throated Vireo Vireo flavifrons Y Warbling Vireo Vireo gilvus N Red-eyed Vireo Vireo olivaceus Y Blue Jay Cyanocitta cristata N American Crow Corvus brachyrhynchos N Fish Crow Corvus ossifragus N Tree Swallow Tachycineta bicolor Y Northern Rough-winged Swallow Stelgidopteryx serripennis Y Barn Swallow Hirundo rustica N Black-capped Chickadee Poecile (Parus) atricapillus N Tufted Titmouse Baeolophus (Parus) bicolor N
Final SEIS S9 30

TABLE 8.1.2-14. AVIAN SPECIES OBSERVED AND POTENTIALLY OCCURRING AT NCA SHAFT NO. 9
Common Name Scientific Name Migratory (Y/N)
White-breasted Nuthatch Sitta carolinensis N Brown Creeper Certhia americana N Carolina Wren Thryothorus ludovicianus N House Wren Troglodytes aedon N Blue-gray Gnatcatcher Polioptila caerulea Y Ruby-crowned Kinglet Regulus calendula Y Eastern Bluebird Sialia sialis Y Veery Catharus fuscescens Y Wood Thrush Catharus mustelinus Y American Robin Turdus migratorius N Gray Catbird Dumetella carolinensis N Northern Mockingbird Mimus polyglottos N Brown Thrasher Toxostoma rufum Y European Starling Sturnus vulgaris N Cedar Waxwing Bombycilla cedrorum N Blue-winged Warbler Vermivora pinus N Tennessee Warbler Vermivora peregrina Y Nashville Warbler Vermivora ruficapilla Y Northern Parula Parula americana Y Yellow Warbler Dendroica petechia N Chestnut-sided Warbler Dendroica pensylvanica Y Magnolia Warbler Dendroica magnolia Y Cape May Warbler Dendroica tigrina Y Black-throated Blue Warbler Dendroica caerulescens Y Yellow-rumped (Myrtle) Warbler Dendroica coronata Y Black-throated Green Warbler Dendroica virens Y Blackburnian Warbler Dendroica fusca Y Pine Warbler Dendroica pinus Y Prairie Warbler Dendroica discolor Y Palm Warbler Dendroica palmarum Y Bay-breasted Warbler Dendroica castanea Y Blackpoll Warbler Dendroica striata Y Black-and-white Warbler Mniotilta varia Y
Final SEIS S9 31

TABLE 8.1.2-14. AVIAN SPECIES OBSERVED AND POTENTIALLY OCCURRING AT NCA SHAFT NO. 9
Common Name Scientific Name Migratory (Y/N)
American Redstart Setophaga ruticilla N Worm-eating Warbler Helmitheros vermivorus Y Kentucky Warbler Oporornis formosus Y Mourning Warbler Oporornis philadelphia Y Ovenbird Seiurus aurocapillus Y Northern Waterthrush Seiurus noveboracensis Y Louisiana Waterthrush Seiurus motacilla Y Common Yellowthroat Geothlypis trichas N Hooded Warbler Wilsonia citrina N Yellow-breasted Chat Icteria virens Y Scarlet Tanager Piranga olivacea Y Eastern (Rufous-sided) Towhee Pipilo erythrophthalmus N Chipping Sparrow Spizella passerina N Field Sparrow Spizella pusilla Y Savannah Sparrow Passerculus sandwichensis Y Song Sparrow Melospiza melodia N Lincoln’s Sparrow Melospiza lincolnii Y White-throated Sparrow Zonotrichia albicollis Y Northern Cardinal Cardinalis cardinalis N Rose-breasted Grosbeak Pheucticus ludovicianus N Indigo Bunting Passerina cyanea N Bobolink Dolichonyx oryzivorus N Red-winged Blackbird Agelaius phoeniceus N Eastern Meadowlark Sturnella magna Y Common Grackle Quiscalus quiscula N Brown-headed Cowbird Molothrus ater N Orchard Oriole Icterus spurius N Baltimore Oriole Icterus galbula N House Finch Carpodacus mexicanus N American Goldfinch Carduelis tristis N House Sparrow Passer domesticus N
Source: Based on fieldwork conducted within the NCA Shaft No. 9 study area in August 2001 and June 2002. In addition, information was derived from surveys conducted within the Eastview Site, Mt. Pleasant, NY during September 14,
Final SEIS S9 32

TABLE 8.1.2-14. AVIAN SPECIES OBSERVED AND POTENTIALLY OCCURRING AT NCA SHAFT NO. 9
Common Name Scientific Name Migratory (Y/N)
1997, May 1, 1998, and June 1, 1998 because the existing woods and surface water provide similar habitat, which is characteristic of the NCA Shaft No. 9 environment. The New York State Department of Environmental Conservation, New York Breeding Bird Atlas Program and the following books were also consulted. Andrle, R.F. and J.R. Carrol, ed. 1988. The Atlas of Breeding Birds in New York State. Cornell University Press. Ithaca, NY. Westchester County Department of Planning. 1987. The Wildlife Resources of Westchester County. Westchester County Department of Planning – May. Division of Housing and Community Development. White Plains, NY.
Amphibians and Reptiles. During the site visits in August 2001, a variety of herpetile species were identified. Herpetile species identified on-site included, leopard frog (Rana pipiens), wood frog (Rana sylvatica) and juvenile snapping turtle (Chelydra serpentina). Species were observed either within or along the stream corridor, which is likely to provide adequate habitat for the given species. A list of herpetiles potentially occurring in the Shaft Site area is provided in Table 8.1.2-15.
TABLE 8.1.2-15. HERPETILE SPECIES POTENTIALLY OCCURRING IN THE VICINITY OF NCA SHAFT NO. 9
Common Name Scientific Name
Salamanders/Newts Dusky Salamander Eastern Newt Four-toed Salamander Jefferson Salamander Spotted Salamander Marbled Salamander Two-lined Salamander Red-backed Salamander Red Salamander Slimy Salamander
Desmognathus fuscus Notophthalmus viridescens Hemidactylium scutatum Ambystoma jeffersonianum Ambystoma maculatum Ambystoma opacum Eurycea bislineata Plethodon cinereus Pseudotriton ruber Plethodon glutinosus
Frogs/Toads American Toad Bullfrog Chorus Frog Common Gray Treefrog Eastern Spadefoot Green Frog Pickerel Frog Spring Peeper Woodhouse Toad
Bufo americanus Rana catesbeiana Pseudacris triseriata Hyla versicolor Scaphiopus holbrooki Rana clamitans melanota Rana palustris Hyla crucifer Bufo woodhousei
Final SEIS S9 33

TABLE 8.1.2-15. HERPETILE SPECIES POTENTIALLY OCCURRING IN THE VICINITY OF NCA SHAFT NO. 9
Common Name Scientific Name
Wood Frog Rana sylvatica Turtles
Eastern Box Turtle Painted Turtle Snapping Turtle Spotted Turtle Stinkpot Wood Turtle
Terrapene carolina Chrysemys picta Chelydra serpentina Clemmys guttata Sternotherus odoratus Clemmys insculpta
Five-lined Skink Eumeces fasciatus Snakes
Brown Snake Common Garter Snake Eastern Hognose Snake Eastern Ribbon Snake Milk Snake Northern Water Snake Racer Rat Snake Red-bellied Snake Ringneck Snake Worm Snake
Storeria dekayi Thamnophis sirtalis Heterodon platyrhinos Thamnophis sauritus Lampropeltis triangulum Nerodia sipedon Coluber constrictor Elaphe obsoleta Storeria occipitomaculata Diadophis punctatus Carphophis amoenus
Source: Based on the ecological surveys conducted within the NCA Shaft No. 9 study area in August 2001 and June 2002. In addition, information was derived from surveys conducted within the Eastview Site, Town of Mt. Pleasant, NY during October 14, 1997 and April 14, 1998 because the existing woods and surface water provide similar habitat, which is characteristic of the NCA Shaft No. 9 environment. The following books were also consulted. Behler, J. and F. King. 1997. The Audubon Field Guide to North American Reptiles and Amphibians. Alfred A.
Knopf. New York, NY. Westchester County Department of Planning. 1987. The Wildlife Resources of Westchester County. Westchester
County Department of Planning – May. Division of Housing and Community Development. White Plains, NY.
Mammals. Mammal species identified on-site were limited to common species,
including white tailed deer (Odocoileus virginianus) and gray squirrel (Sciurus carolinensis). A list of additional wildlife species that potentially utilize the Shaft Site, based on habitat requirements, follows in Table 8.1.2-16.
Final SEIS S9 34

TABLE 8.1.2-16. MAMMALS POTENTIALLY OCCURRING IN THE VICINITY OF
NCA SHAFT NO. 9
Common Name Scientific Name
Coyote Canis latrans Virginia Opossum Didelphis virginiana Shrews/Moles Northern Short-tailed Shrew Eastern Mole
Blarina brevicauda Scalopus aquaticus
Bats Family Vespertilionidae (Evening Bats) Eastern Cottontail Sylvilagus floridanus Rodents Chipmunk Meadow Vole Norway Rat Groundhog Gray Squirrel Meadow Vole Muskrat House Mouse White-Footed Mouse
Flying Squirrel
Tamias Microtus pennsylvanicus Rattus norvegicus Marmota monax Sciurus carolinensis Microtus pennsylvanicus Ondatra zibethicus Mus musculus Peromyscus leucopus Glaucomys sp
Red Fox Vulpes vulpes Raccoon Procyon lotor Striped Skunk Mephitis mephitis White-tailed Deer Odocoileus virginianus Sources: Based on ecological surveys conducted within the NCA Shaft No. 9 study area in August 2001 and June 2002. In addition, information was derived from surveys conducted within the Eastview Site, Mt. Pleasant, NY on July 25-26, 1995, March 26, 1998, and April 14, 1998 because the existing woods and surface water provide similar habitat, which is characteristic of the NCA Shaft No. 9 environment. The following books were also consulted. Martin, A.C., H.S. Zim, and A.L. Nelson. 1951. American Wildlife and Plants, A Guide to Wildlife Food Habits.
Dover Publications, Inc. NY. Westchester County Department of Planning. 1987. The Wildlife Resources of Westchester County. Westchester County Department of Planning – May. Division of Housing and Community Development. White Plains, NY
Rare, Threatened, and Endangered Species. The New York Natural Heritage Program, in conjunction with NYSDEC and the Nature Conservancy, has an ongoing, systemic, scientific inventory whose goal is to compile and maintain computer assisted data on the rare pants and animals native to New York State, and significant ecological communities. Three State listed/regulated plant species were identified by The New York Natural Heritage as historically occurring in the vicinity of the Shaft Site: Rattlebox (Crotalaria sagittalis), Virginia False Gromwell (Onosmodium virginianum), and Shrubby St. John’s Wort (Hypericum prolificum).
Final SEIS S9 35
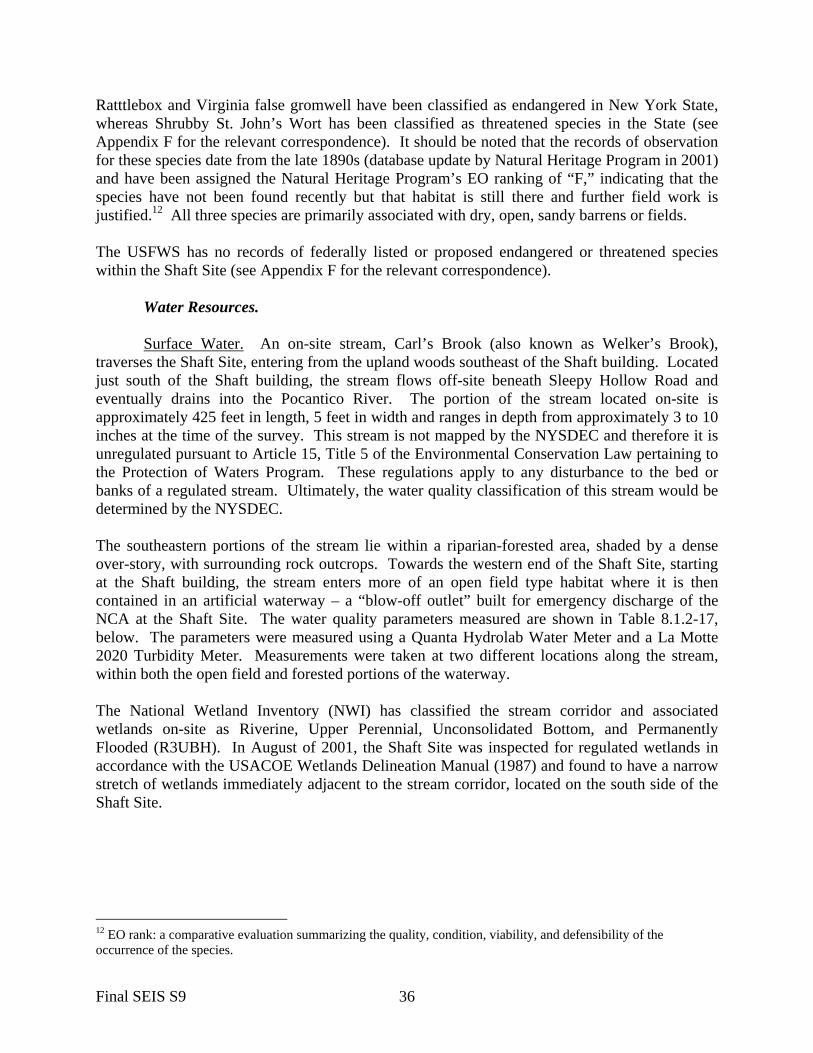
Ratttlebox and Virginia false gromwell have been classified as endangered in New York State, whereas Shrubby St. John’s Wort has been classified as threatened species in the State (see Appendix F for the relevant correspondence). It should be noted that the records of observation for these species date from the late 1890s (database update by Natural Heritage Program in 2001) and have been assigned the Natural Heritage Program’s EO ranking of “F,” indicating that the species have not been found recently but that habitat is still there and further field work is justified.12 All three species are primarily associated with dry, open, sandy barrens or fields.
The USFWS has no records of federally listed or proposed endangered or threatened species within the Shaft Site (see Appendix F for the relevant correspondence).
Water Resources.
Surface Water. An on-site stream, Carl’s Brook (also known as Welker’s Brook), traverses the Shaft Site, entering from the upland woods southeast of the Shaft building. Located just south of the Shaft building, the stream flows off-site beneath Sleepy Hollow Road and eventually drains into the Pocantico River. The portion of the stream located on-site is approximately 425 feet in length, 5 feet in width and ranges in depth from approximately 3 to 10 inches at the time of the survey. This stream is not mapped by the NYSDEC and therefore it is unregulated pursuant to Article 15, Title 5 of the Environmental Conservation Law pertaining to the Protection of Waters Program. These regulations apply to any disturbance to the bed or banks of a regulated stream. Ultimately, the water quality classification of this stream would be determined by the NYSDEC. The southeastern portions of the stream lie within a riparian-forested area, shaded by a dense over-story, with surrounding rock outcrops. Towards the western end of the Shaft Site, starting at the Shaft building, the stream enters more of an open field type habitat where it is then contained in an artificial waterway – a “blow-off outlet” built for emergency discharge of the NCA at the Shaft Site. The water quality parameters measured are shown in Table 8.1.2-17, below. The parameters were measured using a Quanta Hydrolab Water Meter and a La Motte 2020 Turbidity Meter. Measurements were taken at two different locations along the stream, within both the open field and forested portions of the waterway. The National Wetland Inventory (NWI) has classified the stream corridor and associated wetlands on-site as Riverine, Upper Perennial, Unconsolidated Bottom, and Permanently Flooded (R3UBH). In August of 2001, the Shaft Site was inspected for regulated wetlands in accordance with the USACOE Wetlands Delineation Manual (1987) and found to have a narrow stretch of wetlands immediately adjacent to the stream corridor, located on the south side of the Shaft Site.
12 EO rank: a comparative evaluation summarizing the quality, condition, viability, and defensibility of the occurrence of the species.
Final SEIS S9 36

TABLE 8.1.2-17. WATER QUALITY MEASUREMENTS AT NCA SHAFT NO. 9 STREAM (CARL’S BROOK)
Water Quality Parameter Measurement
Dissolved Oxygen (mg/L) 6.15-7.00 Temperature (°C) 21.7-23.5 Turbidity (NTU) 0.81 Specific Conductivity (mS/cm) 0.27-0.28 Notes: Data collected on August 10, 2001.
NCA Shaft No. 9 Blow-Off. The on-site stream (Carl’s Brook) contributes flow to the
Pocantico River that flows south from Pocantico Lake (located to the north of the Shaft Site) to the Hudson River at Tarrytown. The river mean annual flows and 10-year flood flows velocities and elevations are summarized in Table 8.1.2-18. The River Analysis System model (HEC-RAS version 3.0.1, March 2001) was utilized in the NCA Shaft No. 9 blow-off study and the modeling results show that under existing mean annual flows, no flooding occurs along the Pocantico River. Under 10-year and 100-year flood flows, floodplain width would increase along the Pocantico River but the bridges, the Philipsburg Manor, and the playground are not flooded based on the elevation increases (Table 8.1.2-18). From field inspection in August 2002, no residential and commercial areas are located in the Zone A floodplains13. The increase in river width caused by 10-year and 100-year flood flows does not affect any adjacent residential areas. The NCA Shaft No. 9 blow-off structure is located below-grade, connecting to the NCA under the Shaft building. The blow-off culvert outlet is a 12-foot diameter pipe that drains into Carl’s Brook. The culvert outlet is located partially under a section of the stone-lined open channel of Carl’s Brook. This outlet is currently partially blocked because the blow-off has never been utilized since the NCA began to operate.
TABLE 8.1.2-18. POCANTICO RIVER EXISTING FLOWS
Mean Annual Flow 10-year Flood 100-year Flood Location Elevation1
(ft MSL) Velocity(f/s)
Elevation (ft MSL)
Velocity(f/s)
Elevation (ft MSL)
Velocity (f/s)
Elevation(ft MSL)
Bridge 5 107 0.5 97 5.9 101 3.9 106 Bridge 6 101 0.8 77 5.5 81 6.2 85 Bridge 8 92 0.7 58 5.9 64 7.9 67 Bridge 9 58 0.4 35 4.5 39 5.8 42 Bridge 10 35 0.01 8 0.9 11 1.3 13 Philipsburg Manor: Upstream of Dam 14 0 8 0.4 11 0.6 13 Downstream of Dam 10 0.2 2 10.9 5 10.3 8 13 Zone A is the Flood Insurance Rate Map (FIRM, August 1981) classification that designated to areas of 100-year flood; base flood elevations, and flood hazard factors not determined.
Final SEIS S9 37

TABLE 8.1.2-18. POCANTICO RIVER EXISTING FLOWS
Mean Annual Flow 10-year Flood 100-year Flood Location Elevation1
(ft MSL) Velocity(f/s)
Elevation (ft MSL)
Velocity(f/s)
Elevation (ft MSL)
Velocity (f/s)
Elevation(ft MSL)
Playground 7 2 (Tidal2) 3.1 4 3.0 6 Note: 1. Approximate bridge elevations are the top of deck height at the center of each bridge span above the water surface elevation of the river (from the HEC-RAS model). Other location elevations are approximated based on the available USGS Topographic Map. 2. Elevations vary following the Hudson River Tides.
Stormwater. The Shaft Site currently maintains no subsurface stormwater infrastructure. The stormwater runoff that does not infiltrate the permeable ground is discharged overland to Carl’s Brook (also known as Welker’s Brook), which directs the flow to Pocantico River inside the Rockefeller State Park Reserve. The section of Carl’s Brook that travels through the Shaft Site area is a stone open channel structure, which was built to direct stream flow over the NCA.
Groundwater. Bore holes were advanced in October 2002. Two 2-inch diameter wells were placed in the vicinity of Shaft Site above the rock surface. Groundwater was found at 129.25 feet MSL at Well S9-PB1-02, which is near Sleepy Hollow Road, and 135.92 feet MSL at Well S9-B2-02, which is closer to the NCA.
Infrastructure and Energy. No impacts to infrastructure or energy resources within the study area are anticipated as part of this project. Potential impacts during construction are discussed in the Potential Construction Impacts section below.
Electric and Magnetic Fields (EMF) and Extremely Low Frequency Fields (ELF)
Analysis. No impacts related to electric and magnetic fields or extremely low frequency fields are anticipated as part of this project. Therefore, a detailed analysis of these parameters was not conducted for this site.
Solid Waste. No impacts related to solid waste handling or facilities are anticipated as
part of this project. Potential impacts during construction are discussed in the Potential Construction Impacts section below.
Public Health. The existing public health conditions at NCA Shaft No. 9 concern the project-related potential risks that can potentially affect the people living and working in the study area. These people live in a low risk environment for public health concerns. One concern could be the influence of West Nile Virus from the local mosquito population. Existing Federal, State and Local regulations protect this area and are responsible for preventing any new public health concerns from emerging. The presence of mosquitoes carrying West Nile Virus has been observed in Westchester County, and has caused regulatory agencies to become involved in their population control.
Final SEIS S9 38

8.1.2.2.2. Future Without the Project
The Future Without the Project considers the future through the year 2015. The peak construction year for work related to pressurization of the NCA at Shaft No. 9 is 2013; the operation year is 2015. The pressurization of the NCA that is associated with construction of the WTP at the Eastview site (scheduled for 2011-2015) would constitute the extent of the work related to the Croton Project at NCA Shaft No. 9.
Shaft Site. In the Future Without the Project, the Shaft Site would remain largely unchanged from the existing conditions. The existing buildings would remain and their current operation patterns would continue. Independent of the proposed project, the NYCDEP has plans to conduct general maintenance and repair on the 115-year old NCA and its access locations. Necessary repairs to cracks and leaks would be conducted following an inspection of the NCA. In addition, new security measures (i.e., doors, windows, roof and other measures) would be installed. These improvements would assist to protect the public utility and ensure its operation well into the future. This work would take place in two phases between the years of 2004 – 2007 and is subject to separate environmental reviews. The Shaft building, adjacent spillway, and the NCA are all eligible for listing on the National Register of Historic Places, and attention would be made to ensure that this work is consistent with the design patterns of the structures and special care is made to protect the historical structures.
Study Area. In the Future Without the Project, the predominantly open space and low-density residential character of the area surrounding the Shaft Site would be preserved. The 80-acre Rockefeller “Stone Barns” property is likely to be redeveloped just outside of the primary study area in the Pocantico Hills neighborhood of the Town of Mount Pleasant. On this property, the Rockefeller family is planning to convert a former cattle farm into an organic farm and education center. As part of this project, a restaurant, catering hall and café would also be developed in the existing stone barn structures. The property was recently rezoned to an “Open Space Resource District” to permit such uses. On a separate 30-acre parcel near the proposed Stone Barns redevelopment, the Rockefeller family has also developed preliminary plans for a hotel and spa. However, these uses would only be permitted on the property if a rezoning were to occur. The Village of Sleepy Hollow Planning Board has approved plans for a 10-home subdivision on County House Road and Wilson Park Drive. Construction is anticipated to begin on these lots as soon as they are sold, and the entire subdivision is likely to be built before the year of completion of the proposed NCA work.14 This subdivision, located southeast of the secondary study area, is far enough away from the Shaft Site so that land use trends in the study area would not be affected by this project. Based on proposed developments within the study area, the potential increased demands on community facilities would be re-evaluated and additional services would be provided where appropriate by the local municipality.
Traffic and Transportation. The Future Without the Project considerations include the
year of existing conditions (2002) and the anticipated year of peak construction activity (2013) 14 Information obtained from telephone conversation with Robert Stiloski, Director of Fire and Life Safety Department, on July 26, 2002 and Ray lee, Fire and Life Safety Department, on September 10, 2003.
Final SEIS S9 39

for the pressurization work. The 2013 Future Without the Project analysis year corresponds with the peak construction traffic year at NCA Shaft No. 9 for the pressurization work. Existing traffic volumes are anticipated to increase between 2002 and the 2013 Future Without the Project analysis year. To account for the potential general traffic increases in Westchester County, an annual growth rate of 1.5 percent per year was applied to the 2002 Existing Traffic Volumes. Any proposed area developments have been accounted for in the general traffic background growth rate. The traffic volumes due to the background growth have increased the congestion in the project area. Figure 8.1.2-7 illustrates the 2013 Future Without the Project traffic volumes. Results of the 2013 analysis are presented in Table 8.1.2-20. In the 2013 analysis year, two intersections would experience overall LOS E/F conditions for the AM and/or PM peak hours. These intersections are as follows:
1. Bedford Road (Route 117) and Route 9A Northbound/Southbound Ramps 2. Bedford Road (Route 448) and Broadway (Route 9)/North Broadway
Both of these intersections would have increased overall congestion compared to the 2002 Existing Conditions. At the Bedford Road and Route 9A Northbound/Southbound intersection, the AM peak hour conditions would change from marginally acceptable LOS D to LOS E. In the PM peak hour, the intersection would continue to operate at LOS C in the 2013 Future Without the Project Conditions.
Final SEIS S9 40

New Croton Aqueduct Shaft No. 92013 Future Without the Project
Traffic Volume - AM / PM Hour
Figure 8.1.2-7
M&
E F
ile: P
:\E
nvi
ron
me
nta
l Qu
alit
y\C
roto
n\2
00
4 F
ina
l SE
IS\G
RA
PH
ICS
\08
-OF
FS
ITE
\01
-NC
A\0
2-S
H9
\TR
A\S
H9
-tra
-fw
pA
-12
-08
-03
.cd
r 5
/22
/04
Not To Scale
Croton Water Treatment Plant
N
31
/ 3
70
/ 0
6 / 1
13 / 29
326 / 256
15 / 4
13 / 9
0 / 0
41 / 9
7
5 / 1
179 / 494
46 / 39
7 / 8
54 / 82
262 / 154
6 / 13
13 / 24
118 / 347
16 /
2411
8 / 1
31
11 /
16
9 / 11
29 / 1
6
6 / 11
31 / 2
9
1 / 1
25 / 41
41 / 32
20 / 24
1 / 19 / 31
31 / 12
12 /
9
24 /
33
33 /
1658
/ 33
59 / 5221 / 9
12 / 8
126 / 3
11
47 / 7
7264 / 1
93
68 / 165
578 / 608
260 / 221
157 / 6
8
53 / 2
6
22 / 2
4
4 / 24753 / 45715 / 12
4 / 2
111
/ 6
8179 / 2
62
32 / 12
538 / 611
29 / 79
60 / 57
878 / 529
59 / 137
26 / 28
5 / 7
8 / 33
79 / 1
67
49 / 11
0
289 / 4
29100 / 1
77
641 / 730
200 / 134
474 / 1
77
2 / 2
250 / 1
01
92 / 2
21
1 / 5
94 / 1
98
112 / 148
476 / 438
649 / 311
5 / 15 / 16 / 4
13
5 / 1
92
73
5 / 7
32
5 / 1
1 / 4
514 / 7
49
77 / 5
2
163 / 1554 / 1
155 / 114
5 / 2
66 / 191
205 / 311
5 / 2
57 / 3
941 / 2
6
1 / 5204 / 94636 / 628
468 / 7
09
16 / 3
22
58 / 2
20
LEGEND NCA Shaft No. 9 Intersection AnalyzedXXX / XXX AM / PM Peak Traffic Count
Saw
Mill
Riv
er P
kwy.
Bed
ford
Rd.
Taco
nic
Sta
te P
kwy.
County H
ouse
Rd.
Sle
epy
Hollo
w R
d.
Bro
adw
ay (R
te. 9
)
Bedford Rd.
Phelps Way (
Rte. 1
17)
Sleepy Hollow
Rd.
Old
Sle
epy
Hollo
w R
d.
(Rte
. 9)
Bro
adw
ay W
ebber A
ve.

2013 FUTURE WITHOUT THE PROJECT
V/C DELAY V/C DELAYRATIO (SEC/VEH) LOS RATIO (SEC/VEH) LOS
EB – L 0.28 50.8 D 0.29 50.9 D EB – TR 0.78 37.8 D 0.57 31.5 C WB – L 0.14 48.0 D 0.39 53.5 D
WB - TR 0.47 29.8 C 0.52 30.7 CNB – L 0.57 32.6 C 0.91 59.2 E
NB – TR 0.20 26.1 C 0.47 31.0 CSB – LT 0.17 44.8 D 0.20 45.3 DSB – R 0.03 42.1 D 0.13 43.6 D
Intersection 34.8 C 38.3 D
EB – L 0.46 23.3 C 0.46 16.6 BEB – T 0.55 31.9 C 0.40 21.7 CEB – R 1.19 142.9 F 0.44 22.4 CWB – L 0.70 27.5 C 0.31 13.3 B
WB – TR 0.91 48.2 D 0.84 31.7 CNB – LT 0.51 22.1 C 0.51 19.1 BNB – R 0.11 7.3 A 0.23 7.0 ASB – LT 1.16 122.3 F 0.50 18.9 BSB – R 0.29 8.4 A 0.09 6.3 A
Intersection 65.2 E 22.5 C
EB – L 0.01 11.2 B 0.07 13.8 BEB – TR 0.70 25.2 C 0.49 22.7 CWB – L 0.83 34.8 C 0.55 15.7 B
WB – TR 0.59 23.2 C 0.82 30.6 CNB – LT 0.35 19.8 B 0.51 16.9 BNB – R 0.58 23.6 C 0.19 14.0 B
SB – LTR 0.05 17.3 B 0.04 13.0 BIntersection 25.1 C 23.4 C
EB - LTR 0.72 69.5 E 0.44 54.4 DWB - LT 1.00 103.8 F 1.04 96.2 F WB – R 0.02 41.9 D 0.00 32.3 C
NB - LTR 0.57 35.5 D 0.60 51.5 DSB – LT 0.19 9.6 A 0.10 14.4 BSB – R 0.70 17.4 B 0.76 26.6 C
38.2 D 53.0 D
EB – LT 0.61 50.3 D 0.41 39.6 DEB – R 0.58 49.5 D 0.30 38.4 D
WB – LTR 0.14 53.3 D 0.03 48.8 DNB – LTR 0.55 21.2 C 0.62 20.8 CSB – LTR 0.47 12.1 B 0.57 19.8 B
Intersection 22.0 C 22.8 C
Bedford Rd @ Rt 9A NB/SB Ramps
Bedford Rd (Rt 117) / Phelps Way (Rt 117) /
Beech Hill Road
Beekman Avenue/Bedford Road at Broadway (Route
9)/North Broadway
Broadway/Rt 9 at Beekman Avenue and Hudson Terrace
WEEKDAY AM PEAK HOUR
Bedford Road at Taconic State Parkway NB/SB
Ramps
TABLE 8.1.2-19. 2013 FUTURE WITHOUT THE PROJECT TRAFFIC CONDITIONS FOR NCA SHAFT NO. 9
SIGNALIZED INTERSECTIONS
LANE GROUP
WEEKDAY PM PEAK HOUR
Final SEIS S9 42

2013 FUTURE WITHOUT THE PROJECT
V/C DELAY V/C DELAYRATIO (SEC/VEH) LOS RATIO (SEC/VEH) LOS
NB – LT 0.01 8.0 A 0.01 7.9 AEB – LR 0.15 12.5 B 0.17 14.7 B
EB – LT 0.02 7.4 A 0.01 7.3 ASB – LR 0.05 8.9 A 0.05 9.2 A
EB – LTR 0.00 7.5 A 0.01 7.6 AWB – LTR 0.01 8.0 A 0.01 7.7 ANB – LTR 0.27 14.4 B 0.70 25.0 DSB – LTR 0.09 12.8 B 0.06 11.5 B
EB AWSC 7.51 A AWSC 7.49 ANB AWSC 7.28 A AWSC 7.24 ASB AWSC 7.19 A AWSC 7.05 A
EB – LTR 0.01 7.7 A 0.04 9.0 A WB – LTR 0.04 8.3 A 0.04 8.0 ANB – LTR 0.11 12.9 B 0.22 13.0 B SB – LTR 0.06 10.8 B 0.09 13.5 B
AWSC - All Way Stop Control
Webber Avenue and Bedford Road
Bedford Road at Sleepy Hollow Road
Sleepy Hollow Road at Old Sleepy Hollow Road
Sleepy Hollow Rd at Bedford Road and County
House Road
Sleepy Hollow Road at Webber Avenue1
TABLE 8.1.2-19. 2013 FUTURE WITHOUT THE PROJECT TRAFFIC CONDITIONS FOR NCA SHAFT NO. 9
WEEKDAY PM PEAK HOUR WEEKDAY AM PEAK HOUR LANE GROUP
UNSIGNALIZED INTERSECTIONS
SEC/VEH - Seconds per VehicleLOS - Level of Service
Note: 1. V/C values are not applicable for HCS analysis of All-Way Stop Controlled intersections.
ABBREVIATIONS:EB-Eastbound, WB-Westbound, NB-Northbound, SB-SouthboundL-Left, T-Through, R-Right, E-W: East-West Roadway, N-S: North-South RoadwayV/C Ratio - Volume to Capacity Ratio
Final SEIS S9 43

Under the 2013 Future Without the Project conditions, the Bedford Road (Route 448) and Broadway (Route 9)/North Broadway intersection would operate at marginally acceptable LOS D and marginally unacceptable LOS D conditions in the AM and PM peak hours.
Noise Analysis.
Mobile Source Noise. Future baseline mobile source noise levels for the construction phase of the proposed rehabilitation work was determined for the peak construction-traffic year (2013). In the Future Without the Project, the noise environment was established by evaluating future traffic patterns and planned developments in the vicinity of the Shaft Site. As discussed in Traffic and Transportation above, a traffic growth factor of 1.5 percent accounted for nominal background traffic noise increases over time. This growth factor was applied to the existing traffic volumes present along those noise-sensitive route segments that required further analysis.
Based on the results of the PCE screening analysis, Sleepy Hollow Road between County House Road and Sleepy Hollow Road Extension required further analysis for the morning traffic peak hour (8:00 – 9:00 AM). As previously discussed, the existing traffic count program data was extrapolated by using the 1.5 percent growth factor to predict the total traffic volume and vehicle mix along this noise-sensitive route segment for the Future Without the Project year (2013). Once the future traffic data were established, noise levels for 2013 were predicted using TNM. The incremental change between the TNM-calculated existing condition and the TNM-calculated Future Without the Project noise levels was thereby established. This incremental change is an indication of the noise disturbance experienced by the sensitive receptor NCA9-M1 along the route segment. This incremental change then was added to the measured existing condition noise value to generate the predicted Future Without the Project noise level for 2013. Table 8.1.2-20 compares existing sound levels to the noise levels predicted for the Future Without the Project (2013) conditions for mobile source receptor NCA9-M1. Projected noise level increases over existing conditions were predicted to be 1.5 dBA for the morning peak hour (8:00 – 9:00 AM).
TABLE 8.1.2-20. FUTURE WITHOUT THE PROJECT NOISE LEVELS FOR SLEEPY HOLLOW ROAD AT NCA SHAFT NO. 9
(Leq, dBA)
Monitoring Location
Monitoring Period
Measured Existing
Noise Level
TNM-Calculated
Existing Noise Level
Noise Level TNM-
Calculated Future
Without (2013)
Incremental Change
Future Without
the Project Noise Level
(2013)
NCA9-M1 8:00 – 9:00 AM 57.8 57.5 59.0 1.5 59.3
Existing Leq calculated with TNM using data from Traffic Count Program Incremental Change=TNM-calculated future without minus TNM-calculated existing Future Without the Project (2013) = Measured Existing plus Incremental change
Final SEIS S9 44

Stationary Source Noise. Future baseline noise levels at the proximate receptor location
for the construction phase of the proposed NCA work were determined for the peak construction year (2013). New stationary sources of noise that had a potential to increase ambient noise levels measured during the monitoring program would have been assigned a decibel value. Afterwards, the total noise contribution anticipated from the new sources was added to the existing noise levels to arrive at a future baseline noise level for each stationary source receptor. However, no new sources were identified in the vicinity of the Shaft Site. Therefore, the future baseline noise levels at stationary source receptors located near the Shaft Site were not anticipated to change from existing noise levels measured during the noise-monitoring program. No changes in stationary sources were anticipated for the operation year (2015) in the vicinity of the Shaft Site. Since the future baseline for the stationary source noise was anticipated to remain unchanged, no further analysis of the build year was included.
Air Quality. Since the number of project-generated traffic is small, a mobile source analysis was not conducted for this site. There are no regulated stationary sources at the Shaft Site. Future air quality impacts from stationary sources without the project would be unchanged. Hazardous Materials. If the hazardous materials evaluation indicates that contaminants are present within NCA Shaft No. 9, these contaminants would be remediated prior to any subsurface disturbance. 8.1.2.3. Potential Impacts
Currently two sections of the NCA are pressurized, between Shaft Nos. 11A and 11C where the NCA drops below Gould’s Swamp in the Town of Greenburgh, and south of Gate House No. 1 in the Bronx to its terminus at the 135th Street Pumping Station in Manhattan. Under the proposed project the existing pressurized section would be increased to 143 psig while the remainder of the NCA (gravity flow portion) would be pressurized to 92 psig. Under the proposed project, in areas of low rock cover and cut-and-cover sections of the NCA a steel lining would be installed and in the high rock cover sections of the NCA reinforced concrete lining would be installed. The steel lined sections would be circular and backfilled with unreinforced concrete 12-inches thick. The concrete lined section would be circular and have reinforced concrete 12-inches thick. Contact grouting would be performed at the steel lining (with concrete reinforcement) and at concrete/brick and mortar lining interfaces, to seal any voids resulting from concrete shrinkage or temperature changes in the steel lining.
8.1.2.3.1. Project Impacts
The anticipated year of completion of the proposed pressurization work is 2015. Therefore, potential project impacts have been assessed by comparing the Future With the Project conditions against the Future Without the Project conditions for the year 2015.
Final SEIS S9 45
In the proposed project, NCA Shaft No. 9 would serve as a raw water surge blow-off and a NCA drainage location. The independent work to be completed as part of the planned rehabilitation of the NCA in 2004-2007 would be sufficient to upgrade the operations of NCA Shaft No. 9 for any of the proposed future operating scenarios. No new construction would be required for this project, but the operating conditions would change because the NCA would be plugged downstream of NCA Shaft No. 10, preventing open channel flow of raw water in the event of an unexpected system shutdown of the proposed water treatment plant at the Eastview Site. In this event, water would spill out the blow-off. Although this is the existing purpose of the blow-off, it could be used more frequently if the water treatment plant was built at the Eastview Site and the NCA was used for the transmission of treated water under pressure. In the anticipated year of completion (2015), NCA Shaft No. 9 would normally continue to operate as described in the Future Without the Project. The land uses would continue as public utility, no zoning changes would be required and the visual and neighborhood character of the area would remain as undeveloped private property surrounded by public open space. No employees would be assigned to this location; therefore, no services would be required and no additional infrastructure would be needed. With the end of the construction process no additional truck or vehicle trips to the Shaft Site would be required nor would the upgraded facility generate air emissions or noise. No public health impacts would occur. The historic character of the NCA Shaft No. 9 structure and the NCA at this location would be maintained because the proposed work would not require pressurization at this location. The proposed blow-off and drainage of the NCA under the proposed project could result in potential impacts to the natural resources and water resources at the Shaft Site; therefore, a detailed analysis is presented below.
Natural Resources. Vegetation. The existing on-site forest and riparian community would remain unchanged
during the operation of the rehabilitated NCA Shaft No. 9. No vegetation would be cleared for the proposed project; therefore, no significant adverse impacts are anticipated. Wetlands, Waterways, and Floodplains. As described below in the Water Resources discussion, the flooded areas would not likely suffer any structural damage, and no significant adverse impacts are anticipated to the residential neighborhoods and/or the historical landmarks. This modeling showed that the water from the NCA Shaft No. 9 blow-off would not exceed the natural floodplain. Increases in the flow rate would result in potential scouring along the banks of the Pocantico River due to erosion. Erosion would cause silt to be transported to the Pocantico River. The stream banks along the Pocantico River are composed of grasses and sedges that are strongly rooted and resistant to scouring. In some areas natural storm events, which are of a greater magnitude than the anticipated blow-off flooding, have already left the shoreline free of soil and glacial till rocks prevail as a substrate. In stream and stream bank flora/fauna would be anticipated to recolonize any potentially disturbed areas from regions upstream and downstream of the blow-off outlet. This potential adverse impact would be unmitigatable and, due to the rare occurrence of such events, is not considered significant.
Final SEIS S9 46
Fish and Benthic Macroinvertebrates. During operation of the proposed project, there is potential that pump failure at the proposed plant at the Eastview Site would cause a maximum of 290 mgd to be released from the NCA Shaft No. 9 blow-off into the Pocantico River for up to two hours. This rare occurrence may cause temporary (2-3 hours) elevated turbidity levels in the Pocantico River resulting from scouring and erosion. High turbidity levels could impact aquatic species sensitive to these conditions; however, the occurrence would be rare and temporary. The organisms currently in the river are occasionally naturally exposed to such conditions and would be able to tolerate a flood from the blow-off. Therefore, this potential unavoidable negative effect would not be considered significant. Reptiles and Amphibians, Avifauna, and Mammals. During operation of the proposed project, the habitat characteristics of the Shaft Site would remain unchanged from existing conditions. The stream corridor and adjacent forested area would be available for animals frequenting the Shaft Site. During the rare occurrence that water is released from the blow-off, nesting and foraging habitat would be inundated with water. This negative effect would be unavoidable. However, because this is a temporary situation and the blow-off of 290 mgd steady state flow would not significantly increase the flood levels from the 10-year or the 100-year anticipated floodplains, no significant adverse impact to herpetiles, avifauna, or mammals is anticipated. Rare, Threatened, and Endangered Species. As indicated in the existing conditions, no State or federally listed threatened or endangered, or rare species as defined by the New York Natural Heritage Program were observed at the Shaft Site, and none are anticipated to occur or to be affected by the proposed project. Historic records of three state-listed plants in the area of the Shaft Site occur. These plants (see existing conditions) are upland plants that would not naturally occur in the floodplain. Therefore, the potential release of water from the blow-off would not have any significant adverse impact on the rare, threatened, and endangered species in the study area.
Water Resources. In the event of a sudden pump failure at the Eastview Site, either by equipment failure or electrical power failure at the proposed plant, hydraulic surges would occur in the raw water conveyance system as a result of the cessation of flow from the wet well to the proposed plant. Instantaneously after the pump failure, the water level in the wet well would rise until water overflows into a detention tank in the pumping station chamber. The moment the hydraulic head in the wet well would reach 151 feet (MSL) and the detention tank is filled, raw water flow would reverse direction from the wet well back to the NCA, potentially causing surge inside the raw water tunnel and the raw water section of the NCA (from the Croton Lake Gate House to NCA Shaft No. 9). However, the proposed 0.72 million-gallon storage tank at Eastview Site (with an overflow weir elevation at 149.3 ft) would be designed to dampen the surge and prevent a catastrophic volume of water from reaching the NCA Shaft No. 9 blow-off. The valves at Croton Lake Gate House are anticipated to be closed within two hours after the pump failure at the proposed plant. However, it would take a few hours longer to drain the entire NCA raw water section. The raw water would overflow at the NCA Shaft No. 9 blow-off to Carl’s Brook, which flows into the Pocantico River. The maximum flow that could potentially be released from the blow-off is approximately 290 mgd. The overflow at the blow-off would be
Final SEIS S9 47
reduced steadily over time and eventually stopped after the valves closed at the Croton Lake Gate House and the NCA raw water section is drained. The raw water would also stop overflowing from the blow-off when the pumps are back online. Table 8.1.2-21 presents the extent of potential flooding along the Pocantico River if 290 mgd is released from the blow-off continuously. Table 8.1.2-22 shows the structures potentially affected by the steady flow of 290 mgd overflows from the blow-off. No significant negative affects on any structure along the Pocantico River (Figure 8.1.2-8) are anticipated in the event that a steady state flow of 290 mgd is released into the Pocantico River (on top of the base-flow) from the blow-off. In addition, the 290 mgd steady state flow does not significantly increase the flood levels from the 10-year and the 100-year anticipated floodplains. In the 10-year and the 100-year floods, the potential impact areas include sections of the Rockefeller State Park, a playground and parking lot near the Hudson River mouth, the Phillipsburg Manor parking lot, and the dam crest at Phillipsburg Manor property (see Figures 8.1.2-9 and 8.1.2-10). These flooded areas do not contain any sensitive structures (e.g. structures of historic significance) that would be flooded or damaged by the emergency release of 290 mgd steady flow over 10-year and 100-year flood. Therefore, no structural damage and no other significant adverse impacts are anticipated to the residential neighborhoods and/or the historical landmarks. Increases in the flow rate, however, would result in potential scouring along the banks of the Pocantico River due to erosion. Erosion would cause silt to be transported to the Pocantico River. The blow-off events at NCA Shaft No. 9 would be sporadic and infrequent. They would be similar in extent and frequency to heavy rainstorms. This possible negative effect would be unavoidable and is not considered significant.
Historic and Archaeological Resources. The analysis of increased water flows presented in the Water Resources section above was conducted in part to consider the potential for damage to historic structures in the Pocantico watershed. These structures are the Phillipsburg Manor and property, the dam at the Manor, and several stone bridges in the Rockefeller State Preserve. As described in the preceding section and presented below in Table 8.1.2-22, a temporary rise in water caused by a blow-off would not threaten any structures, even in the worst case conditions of a blow-off occurring during a 100-year flood.
As described above, NCA Shaft No. 9 is situated above the NCA and the stone building and adjacent stone-lined spillway are located on the site. Each of these facilities, including the underground aqueduct, is eligible for listing on the National Register of Historic Places. While the pressurization of the NCA downstream of Shaft No. 10 would result in significant impacts to the historic character of the NCA, the proposed project at NCA Shaft No. 9 would not significantly impact the historic character of the tunnel or the NCA Shaft No. 9 above ground structures because no pressurization work is proposed at this location and the on site above ground structures would not be modified in any significant manner. NYCDEP would consult with the New York State Office of Parks, Recreation and Historic Preservation in order to maintain the character of the NCA and NCA Shaft No. 9 in this location and therefore, no significant impacts to historic resources would occur at this location.
Final SEIS S9 48

TABLE 8.1.2-21. EXTENT OF FLOODING DURING MEAN ANNUAL FLOW PLUS 290 MGD, 10-YEAR FLOOD PLUS 290 MGD AND 100-YEAR FLOOD PLUS 290 MGD
Mean Annual Flow plus 290 mgd
10-Year Flood plus 290 mgd
100-Year Flood plus 290 mgd
Main Channel
Bottom
Elevation
Existing Water
Surface
Existing
Floodplain Floodplain Water Surface Floodplain Water
Surface Floodplain Water Surface
Cross
Section HEC-RAS
Width (ft) (ft) Elev. (ft) Width (ft) Width (ft) Elev. (ft) Width (ft) Elev. (ft) Width (ft) Elev. (ft) 22 16 116 116 41 W.B. 120 54 122 64 12321 16 107 107 27 W.B. 110 40 111 49 11320 20 97 97 162 W.B. 101 177 106 187 10719 20 87 87 33 W.B. 90 46 91 56 9218 20 77 77 45 W.B. 81 49 84 55 8517 20 73 74 170 W.B. 78 174 84 176 8516 20 65 65 31 W.B. 68 43 70 52 7215 20 58 58 52 W.B. 63 63 66 71 6814 20 55 55 33 W.B. 59 41 61 46 6413 20 45 45 24 W.B. 48 30 50 35 5212 40 35 35 60 W.B. 38 77 41 94 4311 50 25 25 W.B. W.B. 27 W.B. 29 55 3010 40 15 15 W.B. W.B. 17 W.B. 18 W.B. 199 150 5 8 166 W.B. 9 170 12 172 148 230 4 8 314 W.B. 9 324 12 331 147 275 4 8 436 W.B. 9 455 12 468 146 20 3 3 233 W.B. 9 264 12 284 135 20 1 2 254 W.B. 4 349 6 419 94 230 0 2 262 W.B. 2 422 5 454 83 250 -1 2 316 W.B. 2 423 5 444 82 40 -2 2 127 W.B. 2 250 5 267 71 50 -5 2 55 W.B. 2 81 4 81 6
Note: W.B. = Within Banks
Final SEIS S9 49

TABLE 8.1.2-22. STRUCTURES POTENTIALLY IMPACTED BY 290 MGD BLOW-OFF AT NCA SHAFT NO. 9
Mean Annual Flow 10-Year Flood 100-Year Flood Locations No
Blow-off 290 mgd overflow
No Blow-off
290 mgd overflow
No Blow-off
290 mgd overflow
Elev.1 Vel. 1 Elev. Vel. Elev. Vel. Elev. Vel Elev. Vel Elev. Vel Elev.
Bridge 5 107 0.5 97 5.9 101 5.9 101 3.8 106 3.9 106 5.1 107Bridge 6 101 0.8 77 6.2 81 5.5 81 6.4 84 6.2 85 8.1 85Bridge 8 92 0.7 58 4.9 63 5.9 64 7.2 66 7.9 67 8.7 68Bridge 9 58 0.4 35 3.7 38 4.5 39 5.4 41 5.8 42 6.3 43Bridge 10 35 0.01 8 0.8 9 0.9 11 1.1 12 1.3 13 1.5 14Phillipsburg Manor Upstream of Dam 14 0 8 0.3 9 0.4 11 0.5 12 0.6 13 0.7 14Downstream of Dam 10 0.2 2 9 4 10.9 5 12.6 6 10.3 8 10.5 9
Playground and Parking Lot 7 2 2 2.7 2 3.1 4 4.4 4 3.0 6 3.8 6Note: 1. Elev. is the elevation in feet mean sea level. Vel. is the flow velocity in feet per second. 2. Tidal following the Hudson River elevation.
Final SEIS S9 50
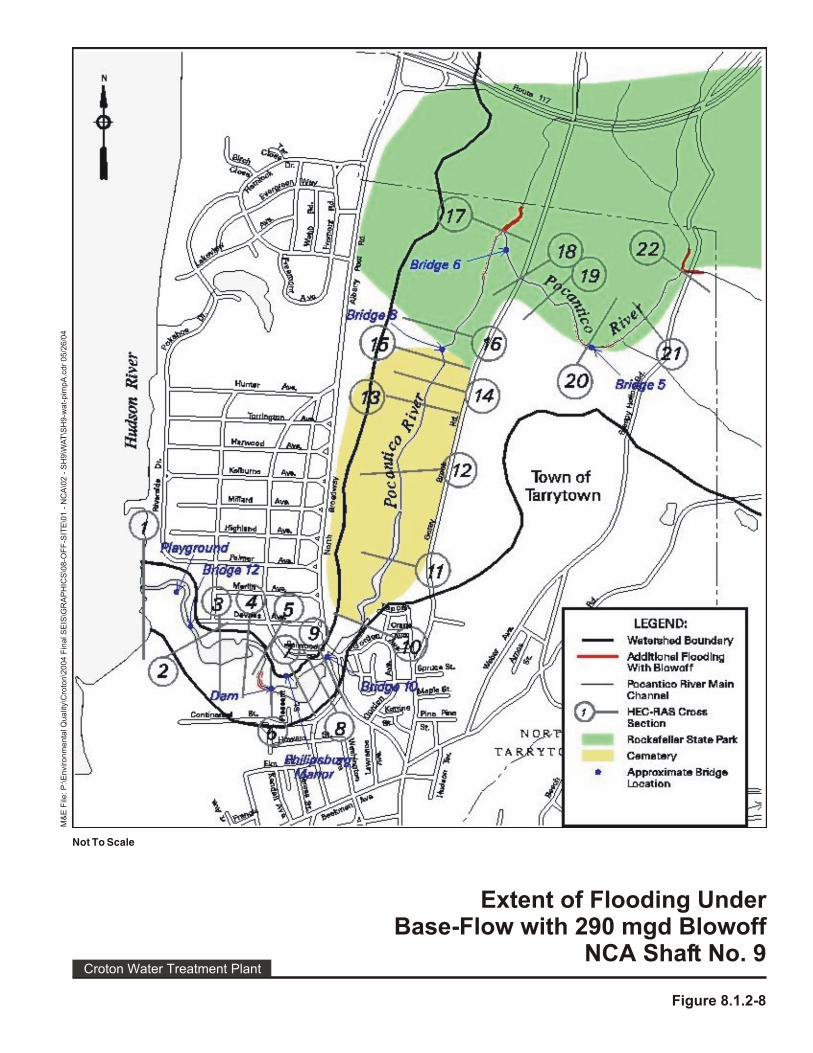
Not To Scale
Croton Water Treatment Plant
Extent of Flooding Under Base-Flow with 290 mgd Blowoff
NCA Shaft No. 9
Figure 8.1.2-8
M&
E F
ile: P
:\E
nvi
ron
me
nta
l Qu
alit
y\C
roto
n\2
00
4 F
ina
l SE
IS\G
RA
PH
ICS
\08
-OF
F-S
ITE
\01
- N
CA
\02
- S
H9
\WA
T\S
H9
-wa
t-p
imp
A.c
dr
05
/26
/04

Not To Scale
Croton Water Treatment Plant
Extent of Flooding Under10 Year Flood with 290 mgd
NCA Shaft No. 9
Figure 8.1.2-9
M&
E F
ile: P
:\E
nvi
ron
me
nta
l Qu
alit
y\C
roto
n\2
00
4 F
ina
l SE
IS\G
RA
PH
ICS
\08
-OF
FS
ITE
\01
-NC
A\0
2-S
H9
\WA
T\S
H9
-wa
t-p
imp
B.c
dr
5/2
2/0
4

Not To Scale
Croton Water Treatment Plant
Extent of Flooding Under100 Year Flood with 290 mgd
NCA Shaft No. 9
Figure 8.1.2-10
M&
E F
ile: P
:\E
nvi
ron
me
nta
l Qu
alit
y\C
roto
n\2
00
4 F
ina
l SE
IS\G
RA
PH
ICS
\08
-OF
FS
ITE
\01
-NC
A\0
2-S
H9
\WA
T\S
H9
-wa
t-p
imp
C.c
dr
5/2
2/0
4

8.1.2.3.2. Construction Impacts
The anticipated year of peak construction of the proposed pressurization work is 2013. Therefore, potential construction impacts have been assessed by comparing the Future With the Project conditions against the Future Without the Project conditions for the year 2013.
Land Use. During the proposed pressurization work, land use on the Shaft Site would change temporarily in terms of the overall level of activity occurring on-site. The proposed construction activities would not have any significant adverse land use impacts on the closest sensitive land use to the Shaft Site, the Rockefeller State Park Preserve. Most of the construction equipment and vehicles would be screened visually by existing vegetation on-site, particularly the line of trees and shrubs along Sleepy Hollow Road. All of the construction activity would be confined to the cleared areas of the Shaft Site. In order to secure the construction site and provide a safe working environment, a temporary chain-link fence would surround the construction area during the six-year construction period. The existing forested areas would be preserved to buffer adjacent land uses. Furthermore, the additional City-owned property immediately to the north of the Shaft Site would remain undeveloped and would further buffer land uses in the study area. The proposed pressurization work would not affect any residences in the study area; the closest residences are located over one-quarter mile away from the Shaft Site.
Community Facilities. The Westchester County Emergency Services representatives would work with the NYCDEP and its contractors to establish a safety and emergency response plan that would adequately assess the construction activities and identify potential needs. In the event of an emergency, the construction workers at the Shaft Site would activate the response plan. It is not anticipated that these needs would result in a significantly adverse impact to services provided in the study area.
Socioeconomic Analysis. During the peak construction year a maximum of 51 construction workers and approximately four construction trucks would visit the Shaft Site on any given weekday. Westchester County or the Village of Sleepy Hollow would not receive any income tax benefits from these construction workers; neither the County nor the Village taxes personal income. The 51 construction workers would likely add money to the local economy through their visits to area businesses. The RIMS II multipliers for the construction industry indicate that the sectors that would benefit most during construction are retail trade and business services. It is not possible to determine exactly where the workers may conduct business, but it is likely that they would visit nearby gas stations, convenience stores, and restaurants. It is likely that some of the economic benefits from the construction activity would spill over to nearby counties. The costs of construction activities for the proposed pressurization work would be included in overall costs for the proposed project. For the complete analysis of indirect effects, refer to the socioeconomic analysis for the Eastview Site (Section 5.7).
Historical and Archaeological Resources. Although the area outside of the existing Shaft and associated structures may be sensitive for precontact archaeological deposits, no ground disturbance is proposed in the location of the Shaft during the project and minimal
Final SEIS S9 54

ground disturbance is proposed for the creation of a staging area. In addition, the area to the east of the Shaft is covered with a layer of fill, protecting any potentially deeply buried archaeological resources. At this time, the extent and depth of the fill material across the site is unknown. During the project, the entire staging area surrounding the Shaft would be covered with a temporary artificial hard surface and geomembrane and surrounded by fencing and sediment erosion control measures, as required. These measures would ensure that the existing surface and any potential archaeological deposits are not disturbed. No impacts to archaeological resources. For the duration of the project, Shaft No.9 would be used as a construction access Shaft and would serve as a main access location for personnel, equipment and materials into the Aqueduct. Temporary use of this structure for access to the NCA would not constitute a potentially significant adverse impact.
Traffic and Transportation. Transportation data and planning assumptions for the
construction workers as well as the construction trucks during the 2013 peak construction period were presented previously in Section 4.9, Data Collection and Impact Methodologies, Traffic and Transportation. As described under existing conditions (Section 5.9.2.1), there are limited transit facilities in the vicinity of the NCA Shaft No. 9 site. For the purpose of traffic analysis, it was assumed that all construction workers would arrive in private vehicles. Table 8.1.2-23 shows the anticipated 2013 peak year construction resources based on preliminary engineering design for the pressurization work on the Shaft Site. Table 8.1.2-24 shows the resulting peak construction generated traffic based on preliminary engineering design. Typically, each construction vehicle is considered to be equivalent to 1.5 passenger cars for 2-axle trucks and 2.0 passenger cars for 3-axle trucks. For conservative results, however, each construction truck was assumed to be a 3-axle truck, or equivalent to 2.0 passenger vehicles.
TABLE 8.1.2-23. CONSTRUCTION RESOURCE REQUIREMENTS
Potential Construction Impacts NCA Shaft No. 9 Peak Year 2013 Construction Hours 7:00AM to 6:00 PM Construction Shifts 1 Construction workers on a peak day 51 Construction vehicles on a peak day 4 Peak time of arrival (workers) 6:00 AM to 7:00 AM Peak time of departure (workers) 6:00 PM to 7:00 PM Period of arrivals and departures (trucks) 7:00 AM to 6:00 PM
Final SEIS S9 55

TABLE 8.1.2-24. CONSTRUCTION TRIP GENERATION
AM Peak Hour PM Peak Hour In Out Total In Out Total
Auto 41 2 43 2 41 43 Trucks 1 0 1 0 1 1 Total 42 2 44 2 42 44
Traffic assignment of construction workers to and from the Shaft Site was determined through the use of population densities from census information within a 5-mile radius of the Shaft Site. Census areas that exhibited larger population densities within this area were assumed to generate a higher number of project related trips. Traffic assignment of construction trucks was based on anticipated truck origins and known truck routes in the study area. The project-generated construction traffic was added to the year 2013 Future Without the Project volumes in the AM and PM peak hours and capacity analyses were performed for these combined conditions. Figure 8.1.2-11 shows the construction generated traffic. Figure 8.1.2-12 shows the total combined traffic under construction conditions. Table 8.1.2-25 shows a comparison of the traffic conditions for the 2013 Future Without the Project and the 2013 Potential Construction Impacts. The following is a summary of potential impacts at the NCA Shaft No. 9 associated with pressurization work.
Traffic. Applying the potential traffic impact criteria described in the Potential Construction Impacts, Section 4.9.3.4, Methods of Analysis, Traffic and Transportation, none of the intersections would experience potential significant adverse impacts due to construction traffic in the AM and/or PM peak hours.
Parking. The Shaft Site is anticipated to provide on-site parking facilities for
construction vehicles and workers during project construction. Based on the transportation data and planning assumptions presented in Section 4.9, Data Collection and Impact Methodologies, Traffic and Transportation, this on-site parking facility would need to accommodate 43 construction worker vehicles. Since the Shaft Site would accommodate these parked vehicles, no potential significant adverse parking impacts are anticipated to occur to the public and private parking facilities in the vicinity of the Shaft Site.
Safety. Two intersections experienced a high rate of accidents between May 1998 and
April 2001, including Bedford Road at Taconic State Parkway Ramps and Bedford Road at Route 9A Ramps.
Final SEIS S9 56

New Croton Aqueduct Shaft No. 9Construction Traffic Distribution - AM / PM Hour
Figure 8.1.2-11
M&
E F
ile: P
:\E
nvi
ron
me
nta
l Qu
alit
y\C
roto
n\2
00
4 F
ina
l SE
IS\G
RA
PH
ICS
\08
-OF
FS
ITE
\01
-NC
A\0
2-S
H9
\TR
A\S
H9
-tra
-Cim
pA
-12
-08
-03
.cd
r 5
/13
/04
Not To Scale
Croton Water Treatment Plant
N
0 / 5
0 / 5
1 / 1
6
0 / 2
23 / 1
1 / 23
18 / 1
1 / 1
80
/ 2
0 / 2
0 / 2
2 / 0
2 / 0
4 / 0
0 / 3
0 / 2
2 / 0
3 / 0
0 / 5
5 / 0
LEGEND NCA Shaft No. 9 Intersection AnalyzedXXX / XXX AM / PM Peak Traffic Count
Saw
Mill
Riv
er P
kwy.
Bed
ford
Rd.
Taco
nic
Sta
te P
kwy.
County H
ouse
Rd.
Sle
epy
Hollo
w R
d.
Bro
adw
ay (R
te. 9
)
Bedford Rd.
Phelps Way (
Rte. 1
17)
Sleepy Hollow
Rd.
Old
Sle
epy
Hollo
w R
d.
2 / 0
0 / 2
1 / 1
51 / 1
6
15 / 1
6 / 1
0 / 4
Bro
adw
ay
(Rte. 9)
Webber A
ve.
5 / 0
5 / 0
2 / 0
16 / 1
2 / 0

New Croton Aqueduct Shaft No. 92013 Construction Year
Traffic Volume - AM / PM Hour
Figure 8.1.2-12
M&
E F
ile: P
:\E
nvi
ron
me
nta
l Qu
alit
y\C
roto
n\2
00
4 F
ina
l SE
IS\G
RA
PH
ICS
\08
-OF
FS
ITE
\01
-NC
A\0
2-S
H9
\TR
A\S
H9
-tra
-Cim
pB
-12
-08
-03
.cd
r 5
/22
/04
Not To Scale
Croton Water Treatment Plant
N
31
/ 3
70
/ 0
6 / 1
13 / 29
331 / 256
15 / 4
13 / 9
0 / 0
41 / 9
7
5 / 1
179 / 499
46 / 39
12 / 8
54 / 82
262 / 154
6 / 13
29 / 25
118 / 347
18 /
2411
8 / 1
31
11 /
16
9 / 1
3
30 / 3
2
6 / 1
6
54 / 3
0
1 / 1
25 / 41
42 / 55
20 / 24
1 / 19 / 31
49 / 13
12 /
9
26 /
33
34 /
3458
/ 35
59 / 5421 / 9
12 / 8
126 / 3
13
49 / 7
7266 / 1
93
68 / 165
578 / 608
260 / 221
157 / 6
8
57 / 2
6
22 / 2
4
4 / 24753 / 45715 / 12
4 / 2
111
/ 7
2179 / 2
62
32 / 12
538 / 611
29 / 79
60 / 57
878 / 529
59 / 137
26 / 28
5 / 7
8 / 33
79 / 1
67
49 / 11
0
289 / 4
29100 / 1
77
641 / 730
200 / 134
250 / 1
01
2 / 2
474 / 1
77
92 / 2
21
1 / 5
94 / 1
98
112 / 148
476 / 438
649 / 311
5 / 15 / 16 / 4
13
5 / 1
95
73
5 / 7
34
5 / 1
1 / 4
516 / 7
49
77 / 5
2
166 / 1554 / 1
155 / 114
5 / 2
66 / 191
205 / 316
636 / 6
28
204 / 9
41 / 5
5 / 257 / 3941 / 267
468 / 7
09
16 / 3
22
63 / 2
20
LEGEND NCA Shaft No. 9 Intersection AnalyzedXXX / XXX AM / PM Peak Traffic Count
Saw
Mill
Riv
er P
kwy.
Bed
ford
Rd.
Taco
nic
Sta
te P
kwy.
County H
ouse
Rd.
Sle
epy
Hollo
w R
d.
Bro
adw
ay (R
te. 9
)
Bedford Rd.
Phelps Way (
Rte. 1
17)
Sleepy Hollow
Rd.
Old
Sle
epy
Hollo
w R
d.
(Rte
. 9)
Bro
adw
ay W
ebber A
ve.

2013 FUTURE WITHOUT THE PROJECT 2013 CONSTRUCTION IMPACTS
V/C DELAY V/C DELAY V/C DELAY V/C DELAYRATIO (SEC/ VEH) LOS RATIO (SEC/ VEH) LOS RATIO (SEC/ VEH) LOS RATIO (SEC/ VEH) LOS
EB – L 0.28 50.8 D 0.29 50.9 D 0.28 50.8 D 0.29 50.9 D EB – TR 0.78 37.8 D 0.57 31.5 C 0.78 37.8 D 0.57 31.5 C WB – L 0.14 48.0 D 0.39 53.5 D 0.14 48.0 D 0.39 53.5 D WB - TR 0.47 29.8 C 0.52 30.7 C 0.47 29.8 C 0.52 30.7 CNB – L 0.57 32.6 C 0.91 59.2 E 0.57 32.6 C 0.91 59.2 E
NB – TR 0.20 26.1 C 0.47 31.0 C 0.20 26.1 C 0.47 31.0 CSB – LT 0.17 44.8 D 0.20 45.3 D 0.17 44.8 D 0.20 45.3 DSB – R 0.03 42.1 D 0.13 43.6 D 0.03 42.1 D 0.13 43.6 D
Intersection 34.8 C 38.3 D 34.8 C 38.3 D
EB – L 0.46 23.3 C 0.46 16.6 B 0.46 23.3 C 0.46 16.6 BEB – T 0.55 31.9 C 0.40 21.7 C 0.55 31.9 C 0.40 21.7 CEB – R 1.19 142.9 F 0.44 22.4 C 1.19 142.9 F 0.44 22.4 CWB – L 0.70 27.5 C 0.31 13.3 B 0.70 27.5 C 0.31 13.3 B
WB – TR 0.91 48.2 D 0.84 31.7 C 0.91 48.2 D 0.84 31.7 CNB – LT 0.51 22.1 C 0.51 19.1 B 0.51 22.1 C 0.51 19.1 BNB – R 0.11 7.3 A 0.23 7.0 A 0.11 7.3 A 0.23 7.0 ASB – LT 1.16 122.3 F 0.50 18.9 B 1.16 122.3 F 0.50 18.9 BSB – R 0.29 8.4 A 0.09 6.3 A 0.29 8.4 A 0.09 6.3 A
Intersection 65.2 E 22.5 C 65.2 E 22.5 C
EB – L 0.01 11.2 B 0.07 13.8 B 0.01 11.2 B 0.07 13.8 BEB – TR 0.70 25.2 C 0.49 22.7 C 0.70 25.2 C 0.49 22.7 CWB – L 0.83 34.8 C 0.55 15.7 B 0.83 34.8 C 0.55 15.7 B
WB – TR 0.59 23.2 C 0.82 30.6 C 0.59 23.2 C 0.82 30.6 CNB – LT 0.35 19.8 B 0.51 16.9 B 0.35 19.8 B 0.52 17.0 BNB – R 0.58 23.6 C 0.19 14.0 B 0.59 23.8 C 0.19 14.0 B
SB – LTR 0.05 17.3 B 0.04 13.0 B 0.05 17.3 B 0.04 13.0 BIntersection 25.1 C 23.4 C 25.1 C 23.4 C
EB - LTR 0.72 69.5 E 0.44 54.4 D 0.72 69.5 E 0.44 54.4 DWB - LT 1.00 103.8 F 1.04 96.2 F 1.00 103.8 F 1.05 99.3 F WB – R 0.02 41.9 D 0.00 32.3 C 0.02 41.9 D 0.00 32.3 C
NB - LTR 0.57 35.5 D 0.60 51.5 D 0.57 35.4 D 0.60 51.5 DSB – LT 0.19 9.6 A 0.10 14.4 B 0.19 9.6 A 0.10 14.4 BSB – R 0.70 17.4 B 0.76 26.6 C 0.70 17.4 B 0.76 26.6 C
38.2 D 53.0 D 38.1 D 53.8 D
EB – LT 0.61 50.3 D 0.41 39.6 D 0.63 50.9 D 0.41 39.6 DEB – R 0.58 49.5 D 0.30 38.4 D 0.58 49.5 D 0.30 38.4 D
WB – LTR 0.14 53.3 D 0.03 48.8 D 0.14 53.3 D 0.03 48.8 DNB – LTR 0.55 21.2 C 0.62 20.8 C 0.55 21.2 C 0.62 20.9 CSB – LTR 0.47 12.1 B 0.57 19.8 B 0.47 12.1 B 0.57 19.8 B
Intersection 22.0 C 22.8 C 22.1 C 22.9 C
Bedford Road at Taconic State Parkway
NB/SB Ramps
Bedford Rd @ Rt 9A NB/SB Ramps
Beekman Avenue/Bedford Road at Broadway (Route 9)/North Broadway
Broadway/Rt 9 at Beekman Avenue and
Hudson Terrace
Bedford Rd (Rt 117) / Phelps Way (Rt 117) /
Beech Hill Road
TABLE 8.1.2-25. 2013 POTENTIAL CONSTRUCTION IMPACTS TRAFFIC CONDITIONS FOR NCA SHAFT NO. 9
SIGNALIZED INTERSECTIONS LANE GROUP
WEEKDAY AM PEAK HOUR WEEKDAY PM PEAK HOUR WEEKDAY AM PEAK HOUR WEEKDAY PM PEAK HOUR
Final SEIS S9 59

2013 FUTURE WITHOUT THE PROJECT 2013 CONSTRUCTION IMPACTS
V/C DELAY V/C DELAY V/C DELAY V/C DELAY
RATIO (SEC/ VEH) LOS RATIO (SEC/ VEH) LOS RATIO (SEC/ VEH) LOS RATIO (SEC/ VEH) LOS
NB – LT 0.01 8.0 A 0.01 7.9 A 0.01 8.0 A 0.01 7.9 AEB – LR 0.15 12.5 B 0.17 14.7 B 0.16 12.5 B 0.17 14.9 B
EB – LT 0.02 7.4 A 0.01 7.3 A 0.02 7.4 A 0.02 7.4 ASB – LR 0.05 8.9 A 0.05 9.2 A 0.06 8.9 A 0.05 9.4 A
EB – LTR 0.00 7.5 A 0.01 7.6 A 0.01 7.5 A 0.01 7.6 AWB – LTR 0.01 8.0 A 0.01 7.7 A 0.01 8.0 A 0.01 7.7 ANB – LTR 0.27 14.4 B 0.70 25.0 D 0.31 15.1 C 0.73 28.0 DSB – LTR 0.09 12.8 B 0.06 11.5 B 0.09 13.0 B 0.11 12.0 B
EB AWSC 7.51 A AWSC 7.49 A AWSC 7.58 A AWSC 7.56 ANB AWSC 7.28 A AWSC 7.24 A AWSC 7.44 A AWSC 7.27 ASB AWSC 7.19 A AWSC 7.05 A AWSC 7.23 A AWSC 7.27 A
EB – LTR 0.01 7.7 A 0.04 9.0 A 0.01 7.7 A 0.04 9.1 A WB – LTR 0.04 8.3 A 0.04 8.0 A 0.04 8.3 A 0.04 8.0 ANB – LTR 0.11 12.9 B 0.22 13.0 B 0.11 12.9 B 0.22 13.0 B SB – LTR 0.06 10.8 B 0.09 13.5 B 0.06 10.8 B 0.10 13.6 B
AWSC - All Wheel Stop ControlNote: 1. V/C values are not applicable for HCS analysis of All-Way Stop Controlled intersections.
Sleepy Hollow Road at Webber Avenue1
Webber Avenue and Bedford Road
Bedford Road at Sleepy Hollow Road
Sleepy Hollow Rd at Bedford Road and
County House Road
Sleepy Hollow Road at Old Sleepy Hollow
L-Left, T-Through, R-Right, E-W: East-West Roadway, N-S: North-South RoadwayV/C Ratio - Volume to Capacity RatioSEC/VEH - Seconds per VehicleLOS - Level of Service
EB-Eastbound, WB-Westbound, NB-Northbound, SB-Southbound
WEEKDAY AM PEAK HOUR WEEKDAY PM PEAK HOURWEEKDAY AM PEAK HOUR WEEKDAY PM PEAK HOUR
TABLE 8.1.2-25. 2013 POTENTIAL CONSTRUCTION IMPACTS TRAFFIC CONDITIONS FOR NCA SHAFT NO. 9
UNSIGNALIZED INTERSECTIONS LANE GROUP
ABBREVIATIONS:
Final SEIS S9 60
At the intersection of Bedford Road at Taconic State Parkway Ramps, there are projected to be 2,052 vehicles entering the intersection in the AM peak hour and 2,198 vehicles entering in the PM peak hour. The construction activities would not increase these volumes in either the AM or PM peak hours. Therefore, no additional accidents would be anticipated throughout the construction period. At the intersection of Bedford Road at Route 9A Ramps, there are projected to be 3,091 vehicles entering the intersection in the AM peak hour and 2,643 vehicles entering in the PM peak hour. The construction activities would not increase these volumes in either the AM or PM peak hours. No additional accidents would be anticipated, therefore, throughout the construction period.
Transit. The construction at this location is not anticipated to generate any transit ridership.
Pavement Infrastructure. The construction at this location is not anticipated to generate any construction truck loads.
Noise Analysis. Traffic generated by construction activities and the construction equipment tally was not anticipated to change over the course of the construction period. As a result, mobile and stationary source noise levels resulting from construction would not fluctuate substantially over the course of the construction phase. A representative peak construction year of 2013 was selected because it falls at the approximate midpoint of the construction schedule. Construction activities would occur between 7:00 AM and 6:00 PM on weekdays. An electric fan would be placed at the Shaft access point and may operate continuously (24 hours a day, seven days a week) for the duration of construction activities. The fan would discharge through ventilation louvers that would be placed on top of the existing structure. Even though construction would not take place on weekends, analysis of construction impacts from stationary sources included both weekdays and weekends to account for this possible continuous use of the fan. The Shaft Site falls within the jurisdiction of the local ordinances for the Village of Sleepy Hollow. The Village of Sleepy Hollow does not provide absolute construction noise limits during the daytime. However, the local noise ordinance prohibits the generation of construction noise from 7:00 PM to 8:00 AM on weekdays and 6:00 PM and 9:00 AM on Saturdays. Construction is not permitted on Sundays.15 All approvals, permits, and variances shall be secured as necessary prior to the commencement of construction activities. In the absence of specific local limits, standards from CEQR that govern construction noise were used to evaluate potential impacts to the Shaft Site. Applicable standards relating to single-family residences were applied as the area surrounding the Shaft Site is zoned as single-family residences and open development. According to CEQR, a project-generated increase of five dBA or more over a daytime baseline noise level of 60 dBA or less recorded at a sensitive receptor is considered a significant impact. If the existing noise level is 62 dBA or more, a 3
15 Village of Sleepy Hollow. Municipal Code.
Final SEIS S9 61
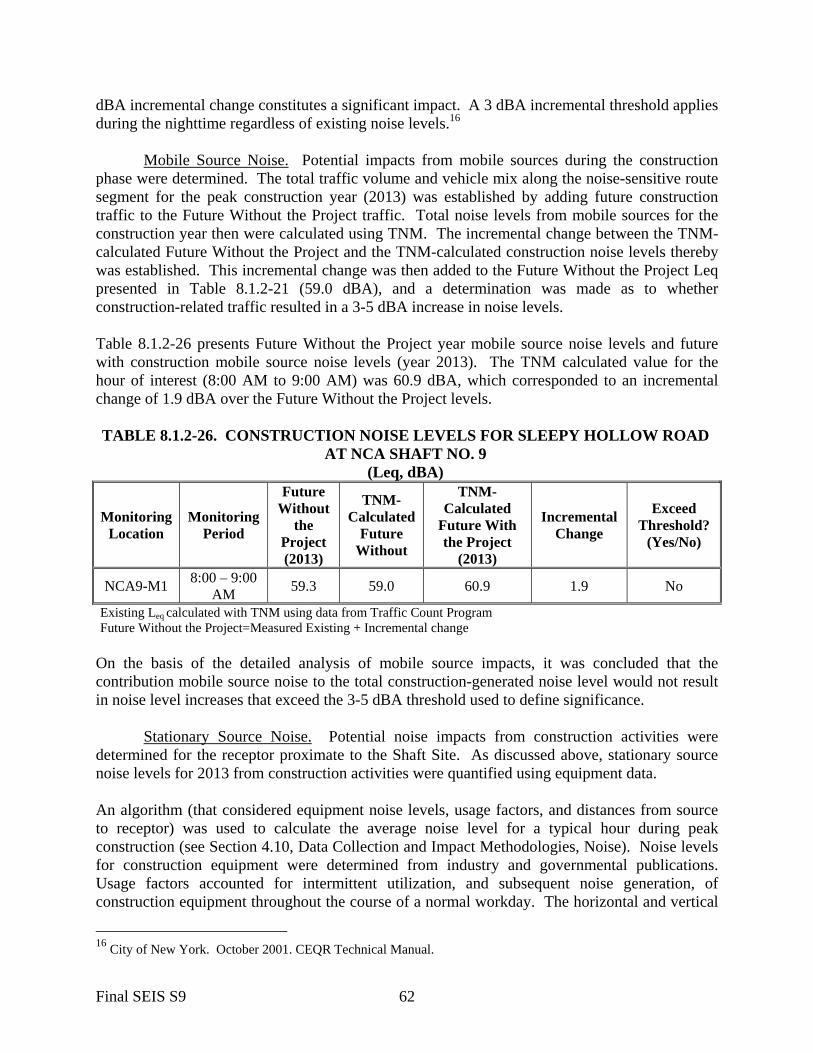
dBA incremental change constitutes a significant impact. A 3 dBA incremental threshold applies during the nighttime regardless of existing noise levels.16
Mobile Source Noise. Potential impacts from mobile sources during the construction phase were determined. The total traffic volume and vehicle mix along the noise-sensitive route segment for the peak construction year (2013) was established by adding future construction traffic to the Future Without the Project traffic. Total noise levels from mobile sources for the construction year then were calculated using TNM. The incremental change between the TNM-calculated Future Without the Project and the TNM-calculated construction noise levels thereby was established. This incremental change was then added to the Future Without the Project Leq presented in Table 8.1.2-21 (59.0 dBA), and a determination was made as to whether construction-related traffic resulted in a 3-5 dBA increase in noise levels. Table 8.1.2-26 presents Future Without the Project year mobile source noise levels and future with construction mobile source noise levels (year 2013). The TNM calculated value for the hour of interest (8:00 AM to 9:00 AM) was 60.9 dBA, which corresponded to an incremental change of 1.9 dBA over the Future Without the Project levels. TABLE 8.1.2-26. CONSTRUCTION NOISE LEVELS FOR SLEEPY HOLLOW ROAD
AT NCA SHAFT NO. 9 (Leq, dBA)
Monitoring Location
Monitoring Period
Future Without
the Project (2013)
TNM-Calculated
Future Without
TNM-Calculated
Future With the Project
(2013)
Incremental Change
Exceed Threshold?
(Yes/No)
NCA9-M1 8:00 – 9:00 AM 59.3 59.0 60.9 1.9 No
Existing Leq calculated with TNM using data from Traffic Count Program Future Without the Project=Measured Existing + Incremental change
On the basis of the detailed analysis of mobile source impacts, it was concluded that the contribution mobile source noise to the total construction-generated noise level would not result in noise level increases that exceed the 3-5 dBA threshold used to define significance.
Stationary Source Noise. Potential noise impacts from construction activities were determined for the receptor proximate to the Shaft Site. As discussed above, stationary source noise levels for 2013 from construction activities were quantified using equipment data. An algorithm (that considered equipment noise levels, usage factors, and distances from source to receptor) was used to calculate the average noise level for a typical hour during peak construction (see Section 4.10, Data Collection and Impact Methodologies, Noise). Noise levels for construction equipment were determined from industry and governmental publications. Usage factors accounted for intermittent utilization, and subsequent noise generation, of construction equipment throughout the course of a normal workday. The horizontal and vertical
16 City of New York. October 2001. CEQR Technical Manual.
Final SEIS S9 62

distances from construction equipment to the receptor being studied were measured in order to calculate the line-of-sight distance used in the algorithm.17 The noise levels from construction activity was then added to the 2013 Future Without the Project noise level to arrive at future construction noise level. Table 8.1.2-27 presents construction equipment, associated noise levels, and usage factors.18 Equipment noise levels (at their associated reference distances) and the usage factors are standard values established through noise studies. The usage factors are not anticipated to change because the scope of work would not change significantly over the construction duration.
TABLE 8.1.2-27. NOISE LEVELS AND USAGE FACTORS FOR EQUIPMENT USED AT NCA SHAFT NO. 9
(dBA)
Equipment Equipment Noise Level
Reference Distance (feet) Usage Factor
Ventilation Fans 59 5 1.0 20-Ton Crane 83 50 0.08 Concrete Pump 82 50 0.4 Trucks 88 50 0.16 Source: Bolt, Beranek, and Newman, Inc. December 1971. Noise from Construction Equipment and Operations, Buildings Equipment and Home Appliances.
Table 8.1.2-28 compares noise levels for weekday construction hours for the Future Without the Project (year 2013) to noise levels for year 2013 including contributions from project construction activities.
Rockefeller State Park Preserve (NCA9-S1). Noise levels predicted to occur as a result of the proposed construction at the Rockefeller State Park Preserve (NCA9-S1) would exceed the 3-5 dBA threshold used to define significance. The largest incremental change at this receptor (located immediately to the south of the Shaft Site) over the Future Without the Project level would be 10.3 dBA. Predicted noise levels would exceed the acceptable threshold during the construction period from 2011 to 2015 for this receptor. This noise level increase would constitute an adverse impact. An analysis was performed to determine the total distance beyond the receptor (and further to the west) that noise levels exceeding the 3-5 dBA threshold would extend. This was performed to determine both the maximum distance that the noise levels would extend into the park. Noise levels that exceed the 3-5 dBA threshold would extend from the west of the site to a maximum distance of approximately 570 feet beyond the monitoring location in the park (see Figure 8.1.2-13). Table 8.1.2-29 compares noise levels for Sundays and weekdays during quietest non-working hours for the Future Without the Project (2013) to noise levels for year 2013 levels including contributions form project construction activities. Note that noise from activities on Sundays and
17 City of New York. October 2001. CEQR Technical Manual. 18 City of New York. October 2001. CEQR Technical Manual
Final SEIS S9 63
weekday non-construction hours includes only noise emissions due to operation of the ventilation fan. For weekends and weekdays during non-working hours, the monitoring location did not show a noise level increase that would exceed the 5 dBA or more threshold value. It was therefore concluded that stationary noise sources resulting from the ventilation fan would not cause noise levels to exceed the 3-5 dBA threshold.
Combined Mobile and Stationary Source Noise. The park could be exposed to the combined effect of both mobile and stationary noise generated by construction activities at the Shaft Site. Based on the analysis presented in Table 8.1.2-26 above, there would be a potential incremental change in mobile source noise levels due to construction activities of 1.9 dBA. Receptors at this site already would have noise level increases in excess of the CEQR impact threshold used to determine significance due to contributions from stationary source noise. The contribution from mobile sources to the total noise would not appreciably change predicted noise levels.
The predicted construction noise levels would impact a limited number of park users due to the remote nature of the site. Due to the limited number of park users that were anticipated to be impacted, the remote nature of the site and the intermittent nature of construction noise, it was determined that the noise impacts at this site would not be significantly adverse and therefore, that no mitigation is necessary. Adverse impacts from construction related noise would remain unmitigated at this site.
Final SEIS S9 64

Croton Water Treatment Plant
Figure 8.1.2-13
M&
E F
ile: P
:\E
nvi
ron
me
nta
l Qu
alit
y\C
roto
n\2
00
4 F
ina
l SE
IS\G
RA
PH
ICS
\08
-OF
FS
ITE
\01
-NC
A\0
2-S
H9
\NO
I\S
H9
-no
i-C
imp
A-1
2-2
3-0
3.c
dr
5/1
3/0
4
NCA Shaft #7
LA
S
RD
LAKE
RA
FF
ENBERG
ROUTE 117
HUNTER AVE.
DEVRIES AVE.
ALB
AN
Y PO
ST R
D
HEM
LO
CK
DR
WEB
ER
AVE.
BEEKMAN AVE.
STIL
LMAN
RIVER
RD
BROWNS
DANARD
HIG
HLA
ND
BEDFORD
LA
CLE
AR
SAWMILL
RD
NO
RTH
BRO
AD
WAY
HU
DS
ON
RIV
ER
SAW
G R E E N B U R G H
RD
BEDFO
RD
RD
RD
.
GO
REY
BRO
OK
ROUTE 117
LEGEND
/u4
/cro
ton/e
is/lp
shft9
NCA Shaft #7
LA
S
RD
LAKE
RA
FF
ENBERG
ROUTE 117
HUNTER AVE.
DEVRIES AVE.
ALB
AN
Y PO
ST R
D
HEM
LO
CK
DR
WEB
ER
AVE.
BEEKMAN AVE.
STIL
LMAN
RIVER
RD
BROWNS
DANARD
HIG
HLA
ND
BEDFORD
LA
CLE
AR
SAWMILL
RD
NO
RTH
BRO
AD
WAY
HU
DS
ON
RIV
ER
SAW
G R E E N B U R G H
RD
BEDFO
RD
RD
RD
.
GO
REY
BRO
OK
ROUTE 117
LEGEND
/u4
/cro
ton/e
is/lp
shft9
NCA Shaft #7
LA
S
RD
LAKE
RA
FF
ENBERG
ROUTE 117
HUNTER AVE.
DEVRIES AVE.
ALB
AN
Y PO
ST R
D
HEM
LO
CK
DR
WEB
ER
AVE.
BEEKMAN AVE.
STIL
LMAN
RIVER
RD
BROWNS
DANARD
HIG
HLA
ND
BEDFORD
LA
CLE
AR
SAWMILL
RD
NO
RTH
BRO
AD
WAY
HU
DS
ON
RIV
ER
SAW
G R E E N B U R G H
RD
BEDFO
RD
RD
RD
.
GO
REY
BRO
OK
ROUTE 117
LEGEND
/u4
/cro
ton/e
is/lp
shft9
NCA Shaft #7
LA
S
RD
LAKE
RA
FF
ENBERG
ROUTE 117
HUNTER AVE.
DEVRIES AVE.
ALB
AN
Y PO
ST R
D
HEM
LO
CK
DR
WEB
ER
AVE.
BEEKMAN AVE.
STIL
LMAN
RIVER
RD
BROWNS
DANARD
HIG
HLA
ND
BEDFORD
LA
CLE
AR
SAWMILL
RD
NO
RTH
BRO
AD
WAY
HU
DS
ON
RIV
ER
SAW
G R E E N B U R G H
RD
BEDFO
RD
RD
RD
.
GO
REY
BRO
OK
ROUTE 117
LEGEND
/u4
/cro
ton/e
is/lp
shft9
NCA Shaft #7
LA
S
RD
LAKE
RA
FF
ENBERG
ROUTE 117
HUNTER AVE.
DEVRIES AVE.
ALB
AN
Y PO
ST R
D
HEM
LO
CK
DR
WEB
ER
AVE.
BEEKMAN AVE.
STIL
LMAN
RIVER
RD
BROWNS
DANARD
HIG
HLA
ND
BEDFORD
LA
CLE
AR
SAWMILL
RD
NO
RTH
BRO
AD
WAY
HU
DS
ON
RIV
ER
SAW
G R E E N B U R G H
RD
BEDFO
RD
RD
RD
.
GO
REY
BRO
OK
ROUTE 117
LEGEND
/u4
/cro
ton/e
is/lp
shft9
NCA Shaft #7
LA
S
RD
LAKE
RA
FF
ENBERG
ROUTE 117
HUNTER AVE.
DEVRIES AVE.
ALB
AN
Y PO
ST R
D
HEM
LO
CK
DR
WEB
ER
AVE.
BEEKMAN AVE.
STIL
LMAN
RIVER
RD
BROWNS
DANARD
HIG
HLA
ND
BEDFORD
LA
CLE
AR
SAWMILL
RD
NO
RTH
BRO
AD
WAY
HU
DS
ON
RIV
ER
SAW
G R E E N B U R G H
RD
BEDFO
RD
RD
RD
.
GO
REY
BRO
OK
ROUTE 117
LEGEND
/u4
/cro
ton/e
is/lp
shft9
POCAN
TICO
RIV
ER
CARL’S BROOK
SLE
EP
Y H
OLLO
W R
D
N
NCA9-S1
500 0 500
SCALE IN FEET
LEGEND 1,500 ft. Radius Study Area Approximate Lateral Extent of Noise Levels Exceeding Threshold NCA Shaft No. 9 Proximate Receptor Monitoring Locations Baseline Monitoring Location
NCA SHAFT NO. 9
New Croton Aqueduct Shaft No. 9Lateral Extent of Noise Levels
Exceeding Threshold (Before Mitigation)

TABLE 8.1.2-28. NOISE LEVELS FROM CONSTRUCTION ACTIVITIES AT RECEPTOR NEAR NCA SHAFT NO. 9
WEEKDAY CONSTRUCTION HOURS (Leq, dBA)
Proximate Receptor
Monitoring Period
Future Without Project
Noise Level (2013)
Predicted Construction Noise Level
Total Noise Level During Construction1
(2013)
Incremental Change
Exceed Threshold (Yes/No)
Quietest (9-10 am)
53.0 62.9 63.3 10.3 Yes
NCA9-S1 Noisiest (4-5 pm)
59.3 62.9 64.5 5.2 Yes
1Total Noise Level = logarithmic addition of Future Without Project and Predicted Construction Noise Level
Final SEIS S9 66

TABLE 8.1.2-29. NOISE LEVELS FROM CONSTRUCTION ACTIVITIES AT RECEPTOR NEAR NCA SHAFT NO. 9 SUNDAYS AND WEEKDAY NON-WORKING HOURS (Leq, dBA)
Proximate Receptor
Monitoring Period
Future Without Project
Noise Level (2013)
Predicted Construction Noise Level
Total Noise Level During Construction1
(2013)
Incremental Change
Exceed Threshold (Yes/No)
Sunday Quietest
(10-11 am)
45.8 15.6 45.8 0.0 No
Sunday Noisiest
(9-10 am)
56.3 15.6 52.7 0.0 No
NCA9-S1
Non-work Weekday Quietest (7-8 pm)
48.6 15.6 53.5 0.0 No
1Total Noise Level = logarithmic addition of Future Without Project and Predicted Construction Noise Level
Final SEIS S9 67

Air Quality. Shaft Site. The construction work at NCA Shaft No. 9 would result in emissions of air
pollutants associated with exhaust from construction activity. The construction activities at the Shaft Site would involve the use of one crane, one backhoe/loader and supply delivery trucks. In general, diesel-powered equipment and trucks are mainly a concern because of the potential particulate matter that they can emit. Also, a 200 hp electric-powered fan would provide ventilation for workers located below ground. Construction activities are also a potential source of fugitive dust emissions that may have a temporary effect on local air quality. Therefore, the rehabilitation work at the Shaft Site was examined for its potential to create a significant adverse impact from PM10 and PM2.5 emissions.
Particulate Analysis PM2.5
Mobile Sources. Since there is no defined methodology determining the potential for
significant PM2.5 impacts from vehicle sources of emissions an interim method has been developed by NYCDEP's Office of Environmental Planning and Assessment (OEPA). OEPA determined a screening procedure could be used if there were less than 21 truck trips per hour, maximum annual PM2.5 concentration would be less than 0.05 µg/m3. This is below the 0.1µg/m3 de minimis threshold value. Assuming no additional PM2.5 impacts, no further mobile source PM2.5 analysis would be required. Assuming no additional PM2.5 impacts from any other sources, the total PM2.5 impact would be below the 0.1 µg/m3 de minimis threshold value, and insignificant. Work at NCA Shaft No. 9 would result in emissions of PM2.5 associated with diesel exhaust. The locations of mobile source impacts and the locations of impacts from the below ground ventilation air would be different and would not overlap. Therefore, the construction at the Shaft Site would not be anticipated to have any significant adverse impacts on the air quality.
Stationary Sources. As mentioned in the earlier section, the Shaft would not be staffed after the completion of the construction activity, and there would not be any sources of stationary sources. During the construction, there would be a crane and a backhoe on-site. Since this equipment would be used only as needed, the construction stationary sources at the Shaft Site would not be anticipated to have any significant or adverse impacts on the air quality.
Hazardous Materials. Field work conducted in 2001 confirmed the presence of hazardous materials at the Shaft Site and determined that the hazardous materials primarily originated from on-site sources. Based on soil and groundwater testing data, the only environmental contaminants of potential concern at the Shaft Site are associated with the soil and include:
• Volatile Organic Compounds (m & p xylenes, 1,2,4-trimethylbenzene) • Total Petroleum Hydrocarbons (diesel-range TPH)
Final SEIS S9 68

It is likely that the volatile organic compounds found in the soil as well as the total petroleum hydrocarbons are the result of one or more fuel oil or diesel fuel releases (e.g., spills, tank leaks) in the area. The presence of hazardous or contaminated materials at the Shaft Site may threaten human health or the environment only when exposure to those materials occurs. The scope of construction work planned at the Shaft Site would not involve any excavation of soil around the Shaft building, the blow-off structure, or adjacent sections of the NCA.
Hazardous Materials Used During Construction. During the construction activities at the Shaft Site, the Contractor may introduce a variety of hazardous materials to the Shaft Site to support the construction activity. The specific types and quantities of hazardous materials stored and used on the construction site would depend on the nature and extent of activities being performed. In general, various hazardous materials would be used to support the operation of vehicles and heavy equipment (e.g., diesel fuel, gasoline, lubricants, glycol) as well as hazardous materials used in the construction process itself (e.g., concrete release agents, adhesives, paints and coatings). Each contractor would provide Material Safety Data Sheets (MSDS) for the construction-related hazardous materials that they would introduce to the project site. No impacts are anticipated from hazardous materials within NCA Shaft No. 9. These materials, if they were found within the structure, would have been remediated prior to any subsurface disturbance.
Natural Resources. Construction activities would be confined to a gravel road, maintained lawn areas, and a cleared area consisting of yard wastes and debris. Equipment would be located within the maintained lawn area. The heavily wooded eastern side of the Shaft Site would remain undisturbed, as would the mature trees along Sleepy Hollow Road. In addition, south of the Shaft building, the adjacent, forested portion of Carl’s/Welker’s Brook would be flagged and protected from construction disturbance. The introduction of silt fencing, with a row of hay bales, inside the construction fence would prevent the dust and soil mixing with the wash-water and stormwater runoff entering Carl’s Brook. No significant adverse impact is anticipated on the stormwater runoff and groundwater flow in the vicinity of the Shaft Site during the rehabilitation of the blow-off facility. Infrastructure and Energy. The introduction of 51 construction employees would require the availability of utilities to service the employees and the construction-related activities.
Water Supply. During the proposed work at the Shaft Site, the contractor would be
responsible for providing water for drinking and construction uses. The contractor would likely select a method of supplying water from alternate sources to best suit their method of working. No connection to the existing water supply system in the study area is anticipated. By using the independent source of water for construction, a potential impact on the study area water supply system would be averted. Therefore, the proposed work would not have any significant adverse impact on the water supply system in the study area.
Final SEIS S9 69

Sanitary Sewage. Throughout the construction period, portable rest rooms would be made available for the construction personnel. The sanitary sewage would be collected and properly disposed of through a contract with a private hauler. No connection or discharge to the existing sanitary sewer system would be made. No significant adverse impact on the sewage system is anticipated in the study area.
Stormwater System. A silt fence and a row of hay bales would be installed inside the construction fence to prevent the minimal dust and soil anticipated from the equipment wash-water within the staging area from entering Carl’s Brook. Surface runoff would continue to drain into Carl’s Brook, which flows into Pocantico River. The rehabilitation of the existing blow-off, which involves working in the on-site stream, would not alter the stormwater runoff pattern in the vicinity of the Shaft Site. No significant adverse impact is anticipated on the existing stormwater drainage system in the study area.
Energy Demand. The proposed work at the Shaft Site would involve installation of some minor ventilation equipment and placement of an office trailer on-site (see noise analysis above). The ventilation equipment and an office trailer are anticipated to require a temporary 500 to 1,000-kVA service that would be hard wired directly to the existing Con Edison grid. Con Edison would be responsible for supplying this temporary power independently of the existing system. Therefore, no significant adverse impact is anticipated on the existing electric utilities in the study area.
Gas Demand. Natural gas would not be utilized during construction. No connection to the existing gas main would be made. No significant adverse impact is anticipated on existing gas utilities in the study area.
Solid Waste. During construction activities the estimated manpower would be 51 individuals, whom would each generate 13 lbs/week of solid waste (according to the criteria given in the CEQR Technical Manual). This would make the total employee generated solid waste during construction 663 lbs/week of solid waste. The private hauler would transport this amount of solid waste off-site. The private hauler would generally transfer wastes to the Westchester County Sanitation System. Additional solid waste would be generated as a byproduct of construction. This material would be highly variable in nature; it would include concrete forms, packaging, scraps of pipe, ductwork, sheetrock, and electrical materials. This amount of waste would be added to the worker-generated waste described above. The increase in solid waste generated from construction activities would be minimal. The Future Without the Project considerations do not anticipate future solid waste generation at the Shaft Site. However, the quantity of solid waste generated during construction would be negligible compared to the amount handled by the County solid waste disposal system, and would be easily handled by the existing Westchester County Sanitation System. It is anticipated that the solid waste produced by construction workers would not result in a significant adverse impact on local or regional solid waste. Public Health. The presence of a crane and concrete pump, as well as a few delivery trucks, would not constitute a public health risk from air emissions or traffic. Therefore, no
Final SEIS S9 70

potential significant adverse impact is anticipated from the proposed construction activity at the Shaft Site.
Permits and Approvals. Table 8.1.2-30 below lists the discretionary approvals that would be required for the proposed project at the NCA Shaft No. 9 Site.
TABLE 8.1.2-30. POSSIBLE APPROVALS AND PERMITS REQUIRED FOR NCA SHAFT NO. 9 FOR THE WTP AT THE EASTVIEW SITE
DEPARTMENT PERMIT TITLE U.S. Federal Government Army Corps of Engineers • General Permit; NWP (Clean Water Act, Section 404) New York State Department of Environmental Conservation
• State Pollution Discharge Elimination System (Environmental Conservation Law, Article 17, Title 8; 6 NYCRR Parts 750 through 757)
• Water Quality Certification (Clean Water Act, Section 401)
• Protection of Waters Permit (Environmental Conservation Law, Article 15, Title 15; 6 NYCRR Part 608)
Department of Health • State Environmental Review Certification for New York Revolving Fund Program (Public Health Law, Sections 1161 and 1162; 21 NYCRR Part 2604)
NYSOPRHP • State Historic Preservation Office Approval Village of Sleepy Hollow Planning Board • Site Plan Approval (Mount Pleasant Code, Section 218-
97) • Freshwater Wetlands Permit (Mount Pleasant Code,
Section 111) Building Department • Building Permit (Mount Pleasant Code, Section 68-7)
• Variance for Construction Activity Prior to 8 AM (Mount Pleasant Code, Section 139-18)
Final SEIS S9 71