Final Supplemental Environmental Impact Statement In
165
Final Supplemental Environmental Impact Statement In CASE 15-E-0302 - Proceeding on Motion of the Commission to Implement a Large-Scale Renewable Program and a Clean Energy Standard. CASE 14-M-0101 – Proceeding on Motion of the Commission in Regard to Reforming the Energy Vision. CASE 14-M-0094 – Proceeding on Motion of the Commission to Consider a Clean Energy Fund. CASE 13-M-0412-- Petition of New York State Energy Research and Development Authority to Provide Initial Capitalization for the New York Green Bank. CASE 10-M-0457 - In the Matter of the System Benefits Charge IV. CASE 07-M-0548 - Proceeding on Motion of the Commission Regarding an Energy Efficiency Portfolio Standard. CASE 03-E-0188 - Proceeding on Motion of the Commission Regarding Retail Renewable Portfolio Standard. Prepared for: New York State Department of Public Service Prepared by: Industrial Economics, Incorporated and Optimal Energy, Incorporated Area Affected by Action: New York State Date of Issuance: May 19, 2016 Agency Contacts: Elizabeth Grisaru and Christina Palmero, New York State Department of Public Service, Three Empire State Plaza, Albany, NY 12223, (518) 473-4635
Transcript of Final Supplemental Environmental Impact Statement In

Final Supplemental
Environmental Impact Statement
In
CASE 15-E-0302 - Proceeding on Motion of the
Commission to Implement a Large-Scale Renewable
Program and a Clean Energy Standard.
CASE 14-M-0101 – Proceeding on Motion of the
Commission in Regard to Reforming the Energy Vision.
CASE 14-M-0094 – Proceeding on Motion of the
Commission to Consider a Clean Energy Fund.
CASE 13-M-0412-- Petition of New York State Energy
Research and Development Authority to Provide Initial
Capitalization for the New York Green Bank.
CASE 10-M-0457 - In the Matter of the System Benefits
Charge IV.
CASE 07-M-0548 - Proceeding on Motion of the
Commission Regarding an Energy Efficiency Portfolio
Standard.
CASE 03-E-0188 - Proceeding on Motion of the
Commission Regarding Retail Renewable Portfolio
Standard.
Prepared for:
New York State Department of Public Service
Prepared by:
Industrial Economics, Incorporated and Optimal Energy, Incorporated
Area Affected by Action: New York State
Date of Issuance: May 19, 2016
Agency Contacts: Elizabeth Grisaru and Christina Palmero, New York State Department of Public
Service, Three Empire State Plaza, Albany, NY 12223, (518) 473-4635
| i
TABLE OF CONTENTS
LIST OF ACRONYMS AND ABBREVIATIONS ...................................................................... viii
EXECUTIVE SUMMARY ....................................................................................................... ES-1
ES.1 SEQRA AND PROPOSED ACTION ............................................................. ES-2
ES.2 ANALYTIC APPROACH ............................................................................... ES-2
ES.3 ENVIRONMENTAL IMPACTS..................................................................... ES-3
The Renewable Supply Portfolio ................................................................... ES-3
Clean Energy Standard: Nuclear Tier ............................................................ ES-4
Socioeconomic Categories ............................................................................. ES-4
ES.4 MITIGATION OF POTENTIAL ADVERSE IMPACTS ............................... ES-5
CHAPTER 1 | SEQRA AND DESCRIPTION OF THE PROPOSED ACTION ......................... 1-1
1.1 COMPLIANCE WITH THE NEW YORK STATE ENVIRONMENTAL
QUALITY REVIEW ACT ................................................................................. 1-3
Preparation of a Supplemental Environmental Impact Statement ..................... 1-3
1.2 CLEAN ENERGY STANDARD: RENEWABLE ENERGY TIERS ............... 1-3
The CES Framework ......................................................................................... 1-3
CES: Renewable Supply ................................................................................... 1-4
Renewable Energy Tiers: Need and Purpose .................................................... 1-5
Proposed Actions: Renewable Energy Tiers ..................................................... 1-5
1.3 CLEAN ENERGY STANDARD: NUCLEAR TIER ........................................ 1-6
Nuclear Tier Need and Purpose ........................................................................ 1-6
Nuclear Tier Proposed Actions ......................................................................... 1-7
1.4 PUBLIC BENEFITS OF THE CES ................................................................... 1-7
1.5 LOCATION OF ACTION .................................................................................. 1-8
1.6 RELATIONSHIPS TO OTHER PLANS AND PROGRAMS ........................... 1-9
CHAPTER 2 | THE ELECTRIC INDUSTRY IN NEW YORK STATE ..................................... 2-1
2.1 TRENDS IN ELECTRICITY DEMAND .......................................................... 2-1
Geographical Distribution of Electricity Demand ............................................ 2-3
2.2 THE PRESENT ELECTRIC SYSTEM.............................................................. 2-3
Existing Power Plants and Capacity.................................................................. 2-4
Imports and Exports .......................................................................................... 2-9

| ii
CHAPTER 3 | ENVIRONMENTAL SETTING .......................................................................... 3-1
3.1 POPULATION ................................................................................................... 3-1
3.2 LAND USE ......................................................................................................... 3-3
Agriculture ........................................................................................................ 3-4
3.3 SPECIES BIODIVERSITY ................................................................................ 3-6
3.4 OPEN SPACE .................................................................................................. 3-10
3.5 SOCIOECONOMICS ....................................................................................... 3-12
Income and Wage Characteristics ................................................................... 3-12
Housing Characteristics .................................................................................. 3-13
3.6 COMMUNITY CHARACTER ........................................................................ 3-14
CHAPTER 4 | ALTERNATIVES CONSIDERED ...................................................................... 4-1
4.1 BASELINE AND ALTERNATIVES DEFINITION: RENEWABLE
SUPPLY ............................................................................................................. 4-1
Results ............................................................................................................... 4-3
4.2 NUCLEAR POWER NO ACTION ALTERNATIVE ....................................... 4-5
CHAPTER 5 | ENVIRONMENTAL IMPACTS OF PROPOSED ACTION .............................. 5-1
5.1 FRAMEWORK FOR EVALUATING THE ENVIRONMENTAL IMPACTS
OF THE CES ...................................................................................................... 5-1
Chapter Organization ........................................................................................ 5-2
5.2 DIRECT AND NEAR TERM EFFECTS ........................................................... 5-2
5.2.1 NUCLEAR ENERGY ........................................................................................ 5-2
Environmental Impact Overview ...................................................................... 5-6
No Action Alternative Impacts ....................................................................... 5-16
5.2.2 SOLAR ENERGY ............................................................................................ 5-16
Environmental Impact Overview .................................................................... 5-19
Land Use Requirements .................................................................................. 5-20
Visual Resources ............................................................................................. 5-21
5.2.3 LAND BASED WIND ENERGY .................................................................... 5-22
Environmental Impact Overview .................................................................... 5-27
Land Use Impacts ............................................................................................ 5-27
Species Biodiversity: Birds and Bats .............................................................. 5-33
Habitat Destruction and Fragmentation .......................................................... 5-35
Noise Pollution ................................................................................................ 5-38

| iii
Visual Aesthetics ............................................................................................. 5-38
5.2.4 OFFSHORE WIND ENERGY ......................................................................... 5-41
Environmental Impact Overview .................................................................... 5-44
Habitat Destruction and Fragmentation .......................................................... 5-44
Noise Pollution ................................................................................................ 5-46
Visual and Aesthetic Resources ...................................................................... 5-47
Cultural and Historical Resources ................................................................... 5-47
5.2.5 HYDROPOWER .............................................................................................. 5-48
Environmental Impact Overview .................................................................... 5-52
5.2.6 ANAEROBIC DIGESTION ............................................................................. 5-53
Environmental Impact Overview .................................................................... 5-56
5.2.7 BIOMASS ENERGY ....................................................................................... 5-58
Land Use ......................................................................................................... 5-61
Water Use and Quality .................................................................................... 5-62
Air Emissions .................................................................................................. 5-62
Health Impacts ................................................................................................ 5-63
Waste Impacts ................................................................................................. 5-64
5.3 LONGER-TERM EFFECTS ............................................................................ 5-64
5.4 OTHER UNANTICIPATED TECHNOLOGIES ............................................. 5-65
5.5 CUMULATIVE IMPACTS .............................................................................. 5-65
CHAPTER 6 | REGULATORY FRAMEWORK AND MITIGATION OF POTENTIAL
ADVERSE IMPACTS .................................................................................................................. 6-1
6.1 FEDERAL AND STATE REGULATIONS RELEVANT TO OPERATIONS
OF NUCLEAR FACILITIES ............................................................................. 6-1
6.2 FEDERAL AND STATE REGULATIONS AND GUIDANCE POTENTIALLY
RELEVANT TO UTILITY SCALE CLEAN ENERGY ACTIVITIES ............ 6-2
CHAPTER 7 | UNAVOIDABLE ADVERSE IMPACTS ............................................................ 7-1
CHAPTER 8 | IRREVERSIBLE AND IRRETRIEVABLE COMMITMENT OF
RESOURCES ............................................................................................................................... 8-1
CHAPTER 9 | GROWTH-INDUCING ASPECTS AND SOCIOECONOMIC IMPACTS ........ 9-1
9.1 POTENTIAL BENEFITS CATEGORIES ......................................................... 9-1
Categories of Potential Public Benefits ............................................................. 9-1
Regional Economic Benefits ............................................................................. 9-2

| iv
9.2 POTENTIAL PROGRAM COSTS .................................................................... 9-8
9.3 IMPACTS ON GROWTH AND COMMUNITY CHARACTER ..................... 9-9
9.4 ENVIRONMENTAL JUSTICE IMPACTS ..................................................... 9-10
CHAPTER 10 | EFFECTS ON ENERGY CONSUMPTION .................................................... 10-1
CHAPTER 11 | REFERENCES ................................................................................................. 11-1
CHAPTER 12 | LIST OF PREPARERS ..................................................................................... 12-1
APPENDIX A | RESPONSE TO COMMENTS ON THE DRAFT SEIS .................................. A-1
APPENDIX B | REVISIONS TO THE DRAFT SUPPLEMENTAL ENVIRONMENTAL
IMPACT STATEMENT .............................................................................................................. B-1
| v
LIST OF EXHIBITS
Exhibit 1-1. Proposed CES Framework .................................................................................. 1-4
Exhibit 2-1. New York State Electric Energy Usage Trends in NYS, Actual and Forecast ... 2-2
Exhibit 2-2. Peak Versus Average Demand in New York State: 1998-2014 ......................... 2-3
Exhibit 2-3. 2014 Electricity Demand, by New York Control Area Load Zone ................... 2-4
Exhibit 2-4. New York Capability and Generation by Fuel Type .......................................... 2-5
Exhibit 2-5. Location of Generation by Fuel Type, 2012-2013 .............................................. 2-6
Exhibit 2-6. 2015 Installed Generation Capacity by NYCA Load Zone ................................ 2-7
Exhibit 2-7. Locations of Generating Capacity in New York State ....................................... 2-8
Exhibit 2-8. Proposed Generation by Fuel Type (2015) ......................................................... 2-9
Exhibit 2-9. Average Net Imports (Mw) From Neighboring Areas During Peak Hours ...... 2-10
Exhibit 3-1. Change in Estimated Population by New York County (2010-2014) ................ 3-2
Exhibit 3-2. Domestic Migration Rates for NY Counties (2010-2014) .................................. 3-3
Exhibit 3-3. New York State Land Use Summary (2014) ...................................................... 3-3
Exhibit 3-4. Land Use Across New York State (2014) ........................................................... 3-4
Exhibit 3-5. Agricultural Sales by County (2012) .................................................................. 3-5
Exhibit 3-6. Top Ten New York Farming Counties (2012) .................................................... 3-6
Exhibit 3-7. U.S. FWS Listed Plant and Animal Species Believe or Known to Occur in
New York ............................................................................................................ 3-7
Exhibit 3-8. New York State Park System ............................................................................ 3-12
Exhibit 3-9. Select Income and Wage Characteristics of New York State (2010-2014) ...... 3-13
Exhibit 3-10. Unemployment Rates by County (November 2015) ........................................ 3-14
Exhibit 3-11. New York State Population Density by County (2010) .................................... 3-15
Exhibit 4-1. Large-Scale Renewables Generation and Installed Capacity, by Alternative..... 4-4
Exhibit 4-2. Emissions Reductions, by Alternative ................................................................ 4-5
Exhibit 4-3. Estimated GWH Electricity Generation Loss in the No Action Scenario .......... 4-5
Exhibit 5-1. Active Nuclear Sites in the United States and Nuclear Capacity ....................... 5-3
Exhibit 5-2. Nuclear Capacity for Top Ten U.S. States, 2015, Gigawatts.............................. 5-3
Exhibit 5-3. Active Nuclear Sites in New York State............................................................. 5-5
Exhibit 5-4. Active Nuclear Sites in New York State............................................................. 5-6
Exhibit 5-5. Summary of Impacts of Nuclear Facility Operation ........................................... 5-7
Exhibit 5-6. Taken from 10 CFR 51.51 on Uranium Fuel-Cycle Environmental Data ........ 5-12
| vi
Exhibit 5-7. Taken from 10 CFR 51.52 on the Environment Impact of Transporting of Fuel
and Waste to and From One Light-Water-Cooled Nuclear Power Reactor,
Normal Conditions of Transport ....................................................................... 5-15
Exhibit 5-8. Estimated USSE Projected to Develop Under the CES (2019-2030) ............... 5-18
Exhibit 5-9. New York State Global Solar Radiation ........................................................... 5-21
Exhibit 5-10. Operating and Proposed Wind Capacity in New York State (MW) ................. 5-23
Exhibit 5-11. Current Installed and Proposed Wind Capacity by County .............................. 5-24
Exhibit 5-12. Estimated Utility Scale Land-Based Wind Energy Projected to Develop Under
the CES (2019-2030) ........................................................................................ 5-26
Exhibit 5-13. Average Land Use Requirements by Cover Type ............................................ 5-28
Exhibit 5-14. Wind Speeds in New York State at 80M .......................................................... 5-29
Exhibit 5-15. Potential Wind Capacity at 110-Meters HUB Height ....................................... 5-30
Exhibit 5-16. Potential Wind Capacity at 140-Meters HUB Height ....................................... 5-31
Exhibit 5-17. Results of the New York Natural Heritage Program Study of Wind Energy’s
Impacts on Wildlife .......................................................................................... 5-32
Exhibit 5-18. New York State BAT Locations and Travel Zones Identified .......................... 5-35
Exhibit 5-19. Areas with Higher Regulatory Burden Due to Biodiversity and Number of
Rare Animals by Area ....................................................................................... 5-37
Exhibit 5-20. Estimated Offshore Wind Energy Projected to Develop Under the CES
(2019-2030) ...................................................................................................... 5-42
Exhibit 5-21. New York State Offshore Wind Potential ........................................................ 5-43
Exhibit 5-22. Summary of Major Taxonomoic Groups and Potential Adverse Effects from
Offshore Wind Development ............................................................................ 5-45
Exhibit 5-23. Hydropower Potential at Existing NPDS in New York State (2012) ............... 5-49
Exhibit 5-24. Estimated Hydropower Energy Projected to Develop Under the
CES (2019-2030) .............................................................................................. 5-51
Exhibit 5-25. Anaerobic Digestion Process Flow Chart ......................................................... 5-54
Exhibit 5-26. Distribution of New York State Wastewater Treatment Plants (2007) ............ 5-55
Exhibit 5-27. Estimated Anaerobic Digestion Energy Projected to Develop Under the CES
(Base Case, PPA Scenario, 2019-2030) ............................................................ 5-56
Exhibit 5-28. Common Types of Biomass Conversion Technologies .................................... 5-58
Exhibit 5-29. Estimated Biomass Energy Projected to Develop Under the CES
(2019-2030) ...................................................................................................... 5-60
Exhibit 6-1. U.S. NRC’s Regulatory Process ......................................................................... 6-2

| vii
Exhibit 6-2. Regulations, Permits, and Review Processes Potentially Applicable for Utility
Scale Wind Projects ............................................................................................ 6-4
Exhibit 9-1. Employment at Potentially Eligible NYS Nuclear Facilities .............................. 9-3
Exhibit 9-2. Wind and Solar Capacity by NYISO Zone ......................................................... 9-7
Exhibit 9-3. Solar PV Resource Potential and PEJA Locations ........................................... 9-11
Exhibit 9-4. Wind Resource Potential and PEJA Locations ................................................. 9-11

| viii
LIST OF ACRONYMS AND ABBREVIATIONS
ACS American Community Survey
ADR Acid Deposition Reduction
AMI Advanced Metering Infrastructure
BEC Bureau Electric Control
BEVs Battery electrical vehicles
bgd billion gallons per day
BMPs Best Management Practices
C&D Construction and Demolition
CAA Clean Air Act
CAES Compressed Air Energy Storage
CAFO Combined Animal Feeding Operation
CARIS Congestion Assessment and Resource Integration Studies
CCA Community Choice Aggregation
CEA Critical environmental areas
CEF Clean Energy Fund
CEQR City Environmental Quality Review
CHG&E Central Hudson Gas & Electric Company
CHP Combined Heat and Power
CMA Calcium Magnesium Acetate
CO Carbon monoxide
CO2 Carbon dioxide
COB Competitive Opportunities/Bypass Case
Commission New York State Public Service Commission
Con Edison Consolidated Energy Company of New York
CPP Clean Power Plan
CRRA Community Risk and Resiliency Act
CSA Combined statistical areas
CSP Concentrating Solar Power
CSRE Customer-Sited Renewable Energy
CST Customer-sited Tier
CWA Clean Water Act
DAM Department of Agriculture & Markets
DER distributed energy resources
DG distributed generation
DM Demand Management
DMM Document and Matter Management
DO Dissolved Oxygen
DOE U.S. Department of Energy
DOS Department of State
DOT Department of Transportation
DPS New York State Department of Public Service
DR Demand Response

| ix
DSP Distributed System Platform
DSPP Distributed System Platform Provider
EAF Environmental Assessment Form
ECL Environmental Conservation Law
EDTA Electric Drive Transportation Association
EE Energy Efficiency
EEPS Energy Efficiency Portfolio Standard
EIA U.S. Energy Information Administration
EIS Environmental Impact Statement
EJ Environmental Justice
ELF extremely low frequency
EMFs electric and magnetic fields
EMS Energy Management System
EO Executive Order
EPA U.S. Environmental Protection Agency
EPAct Energy Policy Act of 2005
ESCOs Energy Service Companies
EVs electrical vehicles
EVSE Electric Vehicle Supply Equipment
FACTS flexible AC transmission systems
FAQs Frequently Asked Questions
FCVs Fuel Cell Vehicles
FCZMA Federal Coastal Zone Management Act
FERC Federal Energy Regulatory Commission
FHWA Federal Highway Administration
FMP Forest Management Plan
GEIS Generic Environmental Impact Statement
GHG
GHP
Greenhouse Gases
Geothermal heat pump
GIV Grid Integrated Electric Vehicles
GWh Gigawatt hours
HCL Hydrogen Chloride
HEFPA Home Energy Fair Practices Act
HF Hydrogen Fluoride
HLRW high-level radioactive wastes
HOV High-occupancy vehicle
ICEs Internal Combustion Engines
IOUs Investor-Owned Utilities
IPCC Intergovernmental Panel on Climate Change
IPP independent power producers
ISO Independent System Operator
JFK
kV
kVA
John F. Kennedy International Airport
kilovolts
kilovolt-ampere
kWh kilowatt-hour
LEV Low emission vehicle
LFG Landfill Gas
LILCO Long Island Lighting Company
LIPA Long Island Power Authority
LISF Long Island Solar Farm
LLRW low-level radioactive wastes

| x
LMI Low and Moderate Income
LNG liquefied natural gas
MACT Maximum Achievable Control Technology
mG Milligauss
MMCR Market-to-Market Congestion Relief Coordination
MSA metropolitan statistical area
MSW Municipal Solid Waste
MTA Metropolitan Transportation Authority
MW Megawatt(s)
MWh megawatt-hour
NAAQS National Ambient Air Quality Standard
NADP National Acid Deposition Program
NEPA National Environmental Policy Act
NIMO Niagara Mohawk Power Corporation
NO2 nitrogen dioxide
NOX nitrous oxides
NPCC Northeast Power Coordinating Council
NPS National Park Service
NPV Net Present Value
NREL National Renewable Energy Laboratory
NRHP/SRHP National and State Registers of Historic Places
NSPS New Source Performance Standards
NWCC National Wind Coordinating Committee
NYCA New York Control Area
NYCHA New York City Housing Authority
NYCRR New York Codes, Rules and Regulations
NYGB New York Green Bank
NYISO New York Independent System Operator
NYNHP New York Natural Heritage Program
NYPA New York Power Authority
NYSDEC New York State Department of Environmental Conservation
NYSDPS New York State Department of Public Service
NYSEG New York State Electric & Gas Company
NYSERDA New York State Energy Research and Development Authority
NYSOPRHP New York State Office of Parks, Recreation and Historic Preservation
NYSRC New York State Reliability Council
O&R Orange & Rockland Company
O3 Ozone
OGS Office of General Services
OSHA Occupational Health and Safety Administration
OTEC Ocean Thermal Energy Conversion
OTR Ozone Transport Region
PB Lead
PEJAs Potential Environmental Justice Areas
PEM polymer electrolyte membrane
PEVs Plug-In Electric Vehicles
PHEVs Plug-In Hybrid Electric Vehicles
PHS Pumped Hydro Storage
PJM PJM Interconnection LLC
PM particulate matter
PMUs phasor measurement units
| xi
Port Authority New York and New Jersey Port Authority
ppm parts per million
PSC New York State Public Service Commission
PSD Prevention of Significant Deterioration
PSL Public Service Law
PV Photovoltaic
R&D research and development
RCRA Resource Conservation and Recovery
REV Reforming the Energy Vision
RG&E Rochester Gas & Electric Company
RGGI Regional Greenhouse Gas Initiative
ROW right-of-way
RPS Renewable Portfolio Standard
RPT Real estate property taxes
RTO Regional Transmission Operators
SADCA State Acid Deposition Control Act
SASS Scenic Areas of Statewide Significance
SBC System Benefits Charge
SCFWH Significant Coastal Fish and Wildlife Habitats
SDWA 1974 Safe Drinking Water Act
SEQRA New York's State Environmental Quality Review Act
SGIG Smart Grid Investment Grant
SHPO Historic Preservation Office
SIP State Implementation Plan
SIR Standardized Interconnection Requirements
SOx sulfur dioxide
SPDES New York State Pollutant Discharge Elimination System
T&D transmission and distribution
T&MD Technology and Market Development
The Board State Energy Planning Board
TOs transmission owners
TOTS Transmission Owner Transmission Solutions
TOU Time of Use
U.C. University of California at Irvine
U.S. United States
USACE U.S. Army Corps of Engineers
USEPA U.S. Environmental Protection Agency
USFWS U.S. Fish and Wildlife Service
USGS U.S. Geological Survey
V2G Vehicle-to-grid
VOCs Volatile Organic Chemicals
WHO World Health Organization
WTE Waste-to-Energy
ZEV Zero-emission vehicle

Executive Summary
| ES-1
EXECUTIVE SUMMARY
In February 2015, the New York State Public Service Commission finalized and published a
Generic Environmental Impact Statement (GEIS) that explored the potential environmental
impacts associated with the Commission’s pursuit of two major policy reviews. The initiatives
underlying the GEIS include the Commission’s “Reforming the Energy Vision” (REV)
proceedings and the Commission’s then-pending proposal to consolidate existing clean energy
programs in a comprehensive “Clean Energy Fund” (CEF).1 The GEIS describes the objectives
and possible outcomes and impacts of the REV and CEF proceedings.2
Since the publication of the GEIS, Governor Andrew M. Cuomo tasked the Commission with two
additional policy directives:
1. Design and implement a new Clean Energy Standard (CES) mandating that 50 percent of
all electricity consumed in New York by 2030 be supplied by renewable resources (the
“50 by 30” goal); and
2. Establish a support mechanism under the CES to sustain the operations of eligible nuclear
facilities, as major sources of emissions-free power, separate from the renewable energy
goal.
On January 21, 2016, the Commission issued an order expanding the scope of its ongoing review
of the options for large scale renewable (LSR) energy development to include consideration of a
CES.3 The January 21 order envisions the CES as a mechanism to ensure that both the 50 by 30
goal and the maintenance of qualifying upstate nuclear resources are achieved. On January 25,
Commission staff issued a white paper (Staff White Paper) describing potential approaches to the
design and implementation of the proposed CES.4 The Staff White paper relied, in part, on the
analysis developed in the LSR options report that evaluated a range of LSR procurement
structures, including a cost analysis of development and financing options.5
1 The Commission’s proceedings covering REV and CEF include Case 14-M-0101 and Case 14-M-0094.The Commission
issued an order moving forward on the CEF on January 21, 2016.
2 NYS Department of Public Service. Final Generic Environmental Impact Statement In CASE 14-M-0101- Reforming the
Energy Vision and CASE 14-M-0094- Clean Energy Fund. Prepared by Industrial Economics, Incorporated and Optimal
Energy, Incorporated. 6 February 2015. Accessed 14 January 2016:
file:///G:/Share/NYSERDA%20Flexible%20Energy%20Contract/06%20TWO%204%20-
%20Clean%20Energy%20EIS/Supplemental%20EIS/%7B9E35CB6F-9B7D-4220-9CD4-B254C0FB4551%7D.pdf.
3 Case 15-E-0302, Order Expanding Scope of Proceeding and Seeking Comments (January 21, 2016) at 5-6.
4 NYS DPS. 2016. Staff White Paper on Clean Energy Standard. CASE 15-E-0302. January 25.
5 Case 15-E-0302 – Large-Scale Renewable Energy Development in New York: Options and Assessment (June 2015) (LSR
Options Report)

Executive Summary
| ES-2
The possible impacts of the decision to enforce the 50 by 30 goal and to provide financial support
to qualifying nuclear facilities through a CES were not identified and assessed in the 2015 GEIS.
As required by the New York State Environmental Quality Review Act (SEQRA), this
Supplemental Environmental Impact Statement (SEIS) builds upon and expands the analyses
presented in that document. The SEIS identifies the potential environmental impacts of the CES
and examines the interplay between the goals and impacts of the CES and the anticipated
outcomes of the REV and CEF proceedings that were previously evaluated in the GEIS.6
ES.1 SEQRA AND PROPOSED ACTION
As discussed in Chapter 1, the basic purpose of SEQRA is to incorporate the consideration of
environmental factors into the planning and decision-making processes of state, regional, and
local government agencies at the earliest possible time. SEQRA requires agencies to identify the
adverse impacts that could result from their actions and to consider how those impacts might be
avoided or minimized. If an agency determines that an action may have a significant adverse
impact, then the agency must prepare an Environmental Impact Statement (EIS).
As described in the Staff White Paper, as proposed the CES would establish several renewable
resource tiers eligible for renewable energy credits to meet the Governor’s mandate:
Tier 1 New Renewable Resources;
Tier 2 Existing Renewable Resources;
o Tier 2A Competitive Sub-Tier; and
o Tier 2B Non-competitive Sub-Tier.7
Tier 1 would be dedicated to new renewable energy facilities with no limitations on facility size.
Therefore, both smaller customer-sited (behind-the- meter) resources and LSR resources are
eligible for Tier 1. Tier 2 aims to support continued contribution of currently operating
renewable resources. Tier 2A aims to provide sufficient revenue to attract supply for which New
York competes in neighboring markets. Tier 2B would provide sufficient revenue to maintain the
renewable baseline electricity generation from facilities that do not compete with markets outside
of the New York control area.8
The Staff White Paper also proposes a separate nuclear tier (Tier 3) to ensure that emissions-free
power from qualifying nuclear generating plants is adequately valued. The nuclear tier under the
CES would provide financial support to eligible licensed nuclear facilities to continue operations
“as a short-term bridge while the State’s energy economy transitions to the scale of renewable
energy promised by the 50 by 30 goal.”9
ES.2 ANALYTIC APPROACH
6 To identify and analyze the impacts of the proposed CES in the context of REV and the CEF, this Supplemental EIS
incorporates by reference the 2015 GEIS.
7 NYS DPS. 2016. Staff White Paper on Clean Energy Standard. CASE 15-E-0302. January 25.
8 NYS DPS. 2016. Staff White Paper on Clean Energy Standard. CASE 15-E-0302. January 25.
9 Case 15-E-0302, Order Expanding Scope of Proceeding and Seeking Comments (January 21, 2016) at 3.
Executive Summary
| ES-3
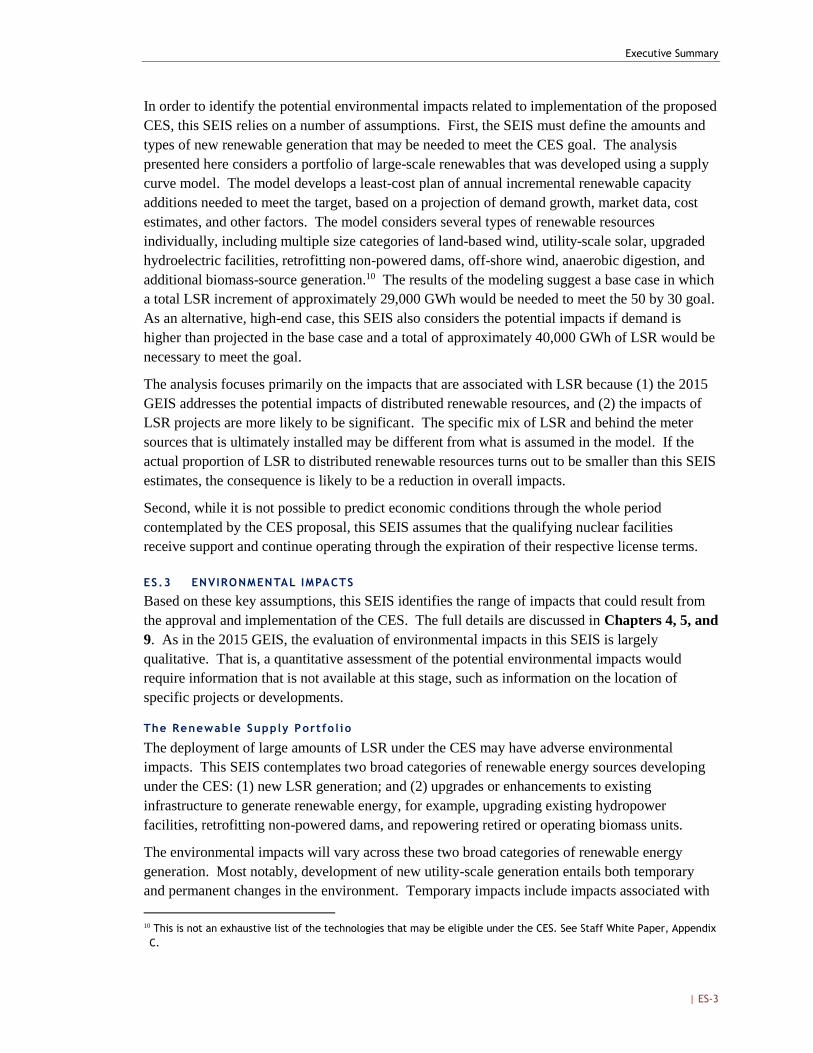
In order to identify the potential environmental impacts related to implementation of the proposed
CES, this SEIS relies on a number of assumptions. First, the SEIS must define the amounts and
types of new renewable generation that may be needed to meet the CES goal. The analysis
presented here considers a portfolio of large-scale renewables that was developed using a supply
curve model. The model develops a least-cost plan of annual incremental renewable capacity
additions needed to meet the target, based on a projection of demand growth, market data, cost
estimates, and other factors. The model considers several types of renewable resources
individually, including multiple size categories of land-based wind, utility-scale solar, upgraded
hydroelectric facilities, retrofitting non-powered dams, off-shore wind, anaerobic digestion, and
additional biomass-source generation.10 The results of the modeling suggest a base case in which
a total LSR increment of approximately 29,000 GWh would be needed to meet the 50 by 30 goal.
As an alternative, high-end case, this SEIS also considers the potential impacts if demand is
higher than projected in the base case and a total of approximately 40,000 GWh of LSR would be
necessary to meet the goal.
The analysis focuses primarily on the impacts that are associated with LSR because (1) the 2015
GEIS addresses the potential impacts of distributed renewable resources, and (2) the impacts of
LSR projects are more likely to be significant. The specific mix of LSR and behind the meter
sources that is ultimately installed may be different from what is assumed in the model. If the
actual proportion of LSR to distributed renewable resources turns out to be smaller than this SEIS
estimates, the consequence is likely to be a reduction in overall impacts.
Second, while it is not possible to predict economic conditions through the whole period
contemplated by the CES proposal, this SEIS assumes that the qualifying nuclear facilities
receive support and continue operating through the expiration of their respective license terms.
ES.3 ENVIRONMENTAL IMPACTS
Based on these key assumptions, this SEIS identifies the range of impacts that could result from
the approval and implementation of the CES. The full details are discussed in Chapters 4, 5, and
9. As in the 2015 GEIS, the evaluation of environmental impacts in this SEIS is largely
qualitative. That is, a quantitative assessment of the potential environmental impacts would
require information that is not available at this stage, such as information on the location of
specific projects or developments.
The Renewable Supply Port fo l io
The deployment of large amounts of LSR under the CES may have adverse environmental
impacts. This SEIS contemplates two broad categories of renewable energy sources developing
under the CES: (1) new LSR generation; and (2) upgrades or enhancements to existing
infrastructure to generate renewable energy, for example, upgrading existing hydropower
facilities, retrofitting non-powered dams, and repowering retired or operating biomass units.
The environmental impacts will vary across these two broad categories of renewable energy
generation. Most notably, development of new utility-scale generation entails both temporary
and permanent changes in the environment. Temporary impacts include impacts associated with
10 This is not an exhaustive list of the technologies that may be eligible under the CES. See Staff White Paper, Appendix
C.

Executive Summary
| ES-4
construction, which are less significant for projects that leverage existing infrastructure. In
addition, these short-term disturbances can be mitigated through use of appropriate construction
practices and safeguards. Large scale solar and wind installations may have significant land
requirements and may permanently affect existing land uses, wildlife, and other resources in a
given project area. Development of new utility-scale solar and wind generation may alter the
visual and cultural landscape of rural areas in upstate New York, where large scale solar and wind
is likely to be developed. When such operations are sited in traditionally rural communities, the
industrial nature of solar and wind facilities can offer strong contrasts to the surrounding
landscape. To the extent that a specific community becomes host to multiple large scale
renewable projects, adverse impacts on the community’s aesthetic, visual, and cultural resources
are possible.
Clean Energy Standard: Nuclear Tier
In contrast to the renewable supply mandate, which will introduce changes to the environment,
the proposal to support qualifying nuclear facilities will not have significant adverse impacts.
The impacts as are likely to occur are those associated with normal operations of the facilities and
would simply continue through the expiration of their U.S. Nuclear Regulatory Commission
(NRC) licenses. The environmental and other impacts have been most recently described and
evaluated by the NRC in the course of its recent relicensing proceedings, discussed in Chapter 5.
Sustaining operations of economically distressed nuclear facilities would require the facilities to
continue using uranium fuel. The NRC has also evaluated this issue and identified the maximum
environmental effects per annual fuel requirement. These include impacts to land, water, fossil
fuel use, and gas, liquid, and solid effluents, radiological effluents, thermal effluents, and
exposure of workers and the public to radiation sources. The NRC concluded that the impacts
from the uranium fuel cycle including impacts of transporting materials would be small.
Additional mitigation measures are not anticipated beyond the already established measures in
place, under the NRC’s regulatory authority.
Socioeconomic Categor ies
One of the primary beneficial changes expected from implementation of the CES is a reduction in
total emissions of air pollutants resulting from fuel combustion. According to the supply curve
model used for this analysis, increasing the contribution of renewable generation to meet the “50
by 30” mandate could reduce nitrogen oxides (NOx), sulfur dioxide (SO2), and carbon dioxide
(CO2) emissions by thousands of tons per year. Net program costs were developed for all three
tiers, which are defined as the gross program costs reduced by the societal value of the avoided
CO2 emissions. For the total of Tier 1, 2 and 3 resources, the near-term Net Present Value (NPV)
yields a net benefit of approximately $1.8 billion in the 2023 time frame. Projections of long-
term costs and revenues are subject to increased uncertainty due to changes in the broader
economy, changes in wholesale electricity prices, the mix of renewable energy resources
developed, technology costs, available tax credits, and project-specific circumstances. Noting
these underlying uncertainties, when looking at the 2030 horizon, the NPV results in a net benefit
of approximately $4.4 billion.
Implementation of the CES may also bring regional economic impacts and other public benefits.
The continued operation of nuclear facilities made possible by the CES Tier 3 will preserve jobs

Executive Summary
| ES-5
and tax revenues, resulting in regional economic benefits. New development of utility scale
renewable energy such as wind and solar is also expected to provide economic benefits including
increased jobs and economic output due to construction and operations, and increased tax
revenues. These direct jobs and spending in the local economy will also produce secondary
impacts, as spending by employees and affected industries flows through the regional economy.
Rural landowners may also benefit directly from lease payments for development of renewable
resources on their property. However, the actual net impact of the proposed action on regional
economies will depend upon many dynamic, unknown factors as technology continues to change
and the economy grows and shifts over time. These costs and benefits are addressed in Chapter
9.
ES.4 MITIGATION OF POTENTIAL ADVERSE IMPACTS
A variety of measures are available to mitigate (i.e., minimize or avoid) the potentially adverse
environmental impacts that may result from implementation of the CES. One key mitigation
measure is compliance with existing Federal and state regulations, which are specifically
designed to protect human health and the environment from significant and/or adverse impacts.
For continued operations of eligible upstate nuclear facilities, the NRC maintains regulatory
oversight of commercial nuclear power plants. Through its licensing, inspection, and
enforcement authorities, the NRC ensures that civilian use of radioactive materials is protective of
public health and safety, promotes the common defense and security, and protects the
environment. In addition to the NRC, the Occupational Safety and Health Administration
(OSHA) and numerous New York State agencies (e.g., New York Department of Labor, New
York State Department of Health, New York State Department of Environmental Conservation,
and New York City Department of Health and Mental Hygiene Regulations) play additional roles
in ensuring the safe use of radioactive materials.
Site-specific permitting regimes, such as the State Environmental Quality Review (SEQR)
process, and Article 10 and Article VII of the New York Public Service Law, require agencies
and project developers to identify and mitigate potentially adverse environmental impacts that
may result from the construction and operation of specific projects. State agencies and many
localities have acquired significant experience with the siting of renewable energy facilities since
the adoption of the State’s Renewable Portfolio Standard in 2004. As interest in, and
development of renewable sources of energy have increased, local and State permitting processes
and capabilities have also developed. For example, a number of new studies and guidance were
recently released to provide greater guidance on the impacts of renewable energy facilities and
options for mitigation of such impacts. Examples of such policies and guidance potentially
applicable to types of impacts that are described in this SEIS are further discussed in Chapter 6.
As a result of this experience and the availability of these regulatory tools, the adverse impacts
identified in this SEIS can be avoided or minimized in future project reviews.

1 | SEQRA and Description of the Proposed Action
| 1-1
CHAPTER 1 | SEQRA AND DESCRIPTION OF THE PROPOSED ACTION
In February 2015, the Commission finalized and published a Generic Environmental Impact
Statement (GEIS) that explored the potential environmental impacts associated with the
Commission’s pursuit of two major policy reviews. The initiatives underlying the GEIS include
the Commission’s “Reforming the Energy Vision” (REV) proceedings and the Commission’s
proposal to consolidate existing clean energy programs in a comprehensive “Clean Energy Fund”
(CEF).11 The GEIS describes the objectives and possible outcomes and impacts of the REV and
CEF proceedings.12
Since the publication of the GEIS, Governor Andrew M. Cuomo tasked the Commission with two
additional policy directives:
1. Design and implement a new Clean Energy Standard (CES) mandating that 50 percent of
all electricity consumed in New York by 2030 be supplied by renewable resources (the
“50 by 30” goal); and
2. Establish a support mechanism under the CES to sustain the operations of eligible nuclear
facilities, as major sources of emissions-free power, separate from the renewable energy
goal.
On January 21, 2016 the Commission issued an order expanding the scope of its ongoing review
of the options for large scale renewable energy (LSR) development to include consideration of a
CES.13 The Commission directed the Department of Public Service staff to prepare and issue a
white paper (Staff White Paper) addressing proposals for the design of the CES consistent with
the aforementioned policy directives. The Commission required the Staff White Paper to include:
How the CES aligns with and contributes to the achievement of REV objective and
principles;
Best practices in the region and nationally;
Methods to determine the nature of the obligation of the mandate;
Methods to achieve and enforce compliance with the mandate;
11 The Commission’s proceedings covering REV and CEF include Case 14-M-0101 and Case 14-M-0094.
12 NYS Department of Public Service. Final Generic Environmental Impact Statement In CASE 14-M-0101- Reforming the
Energy Vision and CASE 14-M-0094- Clean Energy Fund. Prepared by Industrial Economics, Incorporated and Optimal
Energy, Incorporated. 6 February 2015. Accessed 14 January 2016:
file:///G:/Share/NYSERDA%20Flexible%20Energy%20Contract/06%20TWO%204%20-
%20Clean%20Energy%20EIS/Supplemental%20EIS/%7B9E35CB6F-9B7D-4220-9CD4-B254C0FB4551%7D.pdf.
13 Case 15-E-0302, Order Expanding Scope of Proceeding and Seeking Comments (January 21, 2016) at 5-6.

1 | SEQRA and Description of the Proposed Action
| 1-2
The role of energy efficiency;
Assuring adequacy of supply of clean energy including methods to incent the
development of in-state resources;
The cost to consumers and the role of complementary state programs to drive down the
cost of compliance that is ultimately bore by consumers;
Equitable allocation of the obligations and costs of the CES mandate on all classes of
consumers, particularly low income customers; and
Structure and operation of the retail energy market.
The January 21 order envisions the CES as a mechanism to ensure that both the 50 by 30 goal and
the maintenance of qualifying upstate nuclear resources are achieved. The Commission describes
the CES as a program that will complement the Commission’s other clean energy efforts.14
On January 25, the Staff White Paper was issued describing potential approaches to the design
and implementation of the proposed CES for Commission consideration. An overview of the
proposed framework is captured in Exhibit 1-1.
The possible impacts of the decision to enforce the 50 by 30 goal and to provide financial support
to qualifying nuclear facilities through a CES were not identified and assessed in the 2015 GEIS.
As required by the New York State Environmental Quality Act (SEQRA), this supplemental EIS
builds on and expands the analyses presented in the 2015 GEIS. It identifies the potential
environmental impacts of the proposed CES and examines the interplay between the goals and
impacts of the CES and the anticipated outcomes of the REV and CEF proceedings previously
described in the 2015 GEIS.
While the REV and CEF initiatives have many components and objectives, their primary goal is
the transformation of the State’s energy demand profile through the introduction of innovative
technologies, distribution-level markets and resources, energy efficiency, and the expansion of
clean energy resources on both the distribution and the bulk electric systems. In contrast, the
proposed CES seeks to modify the supply that will be available to meet that demand. The
proposed CES will also ensure that existing emissions-free supply sources are maintained even as
the renewable supply portfolio evolves to meet the 50 by 30 goal. Thus, the objectives of the
proposed CES will complement the outcomes anticipated for both the REV and CEF proceedings.
To identify and analyze the impacts of the proposed CES in the context of REV and the CEF, this
supplemental EIS incorporates the 2015 GEIS. The following chapters reference the 2015 GEIS
where applicable and focus on the differential impacts that may result from the Commission’s
development and implementation of the CES. This chapter is organized into six parts.
Section 1.1 describes the purpose of New York's SEQRA and the requirement to prepare
a Supplemental Environmental Impact Statement (EIS) for an action or plan which
changes the scope of the previously assessed action.
14 Ibid at 6.
1 | SEQRA and Description of the Proposed Action
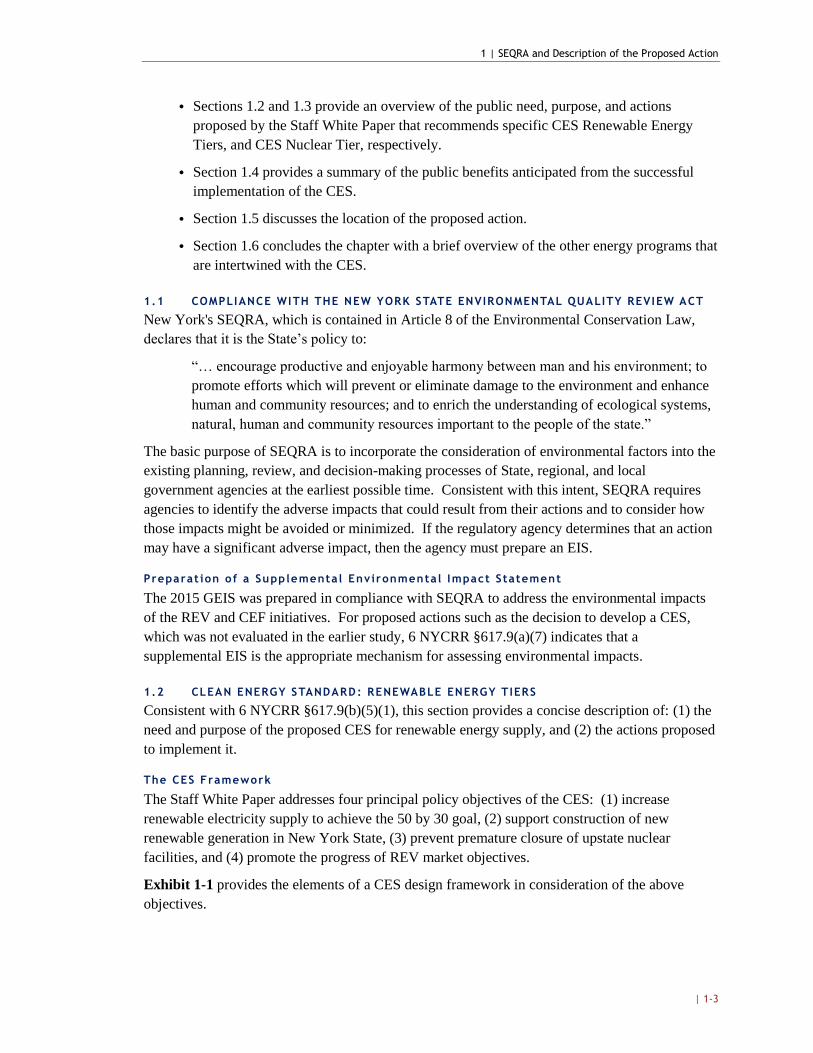
| 1-3
Sections 1.2 and 1.3 provide an overview of the public need, purpose, and actions
proposed by the Staff White Paper that recommends specific CES Renewable Energy
Tiers, and CES Nuclear Tier, respectively.
Section 1.4 provides a summary of the public benefits anticipated from the successful
implementation of the CES.
Section 1.5 discusses the location of the proposed action.
Section 1.6 concludes the chapter with a brief overview of the other energy programs that
are intertwined with the CES.
1.1 COMPLIANCE WITH THE NEW YORK STATE ENVIRONMENTAL QUALITY REVIEW ACT
New York's SEQRA, which is contained in Article 8 of the Environmental Conservation Law,
declares that it is the State’s policy to:
“… encourage productive and enjoyable harmony between man and his environment; to
promote efforts which will prevent or eliminate damage to the environment and enhance
human and community resources; and to enrich the understanding of ecological systems,
natural, human and community resources important to the people of the state.”
The basic purpose of SEQRA is to incorporate the consideration of environmental factors into the
existing planning, review, and decision-making processes of State, regional, and local
government agencies at the earliest possible time. Consistent with this intent, SEQRA requires
agencies to identify the adverse impacts that could result from their actions and to consider how
those impacts might be avoided or minimized. If the regulatory agency determines that an action
may have a significant adverse impact, then the agency must prepare an EIS.
Preparat ion of a Supplemental Environmental Impact Statement
The 2015 GEIS was prepared in compliance with SEQRA to address the environmental impacts
of the REV and CEF initiatives. For proposed actions such as the decision to develop a CES,
which was not evaluated in the earlier study, 6 NYCRR §617.9(a)(7) indicates that a
supplemental EIS is the appropriate mechanism for assessing environmental impacts.
1.2 CLEAN ENERGY STANDARD: RENEWABLE ENERGY TIERS
Consistent with 6 NYCRR §617.9(b)(5)(1), this section provides a concise description of: (1) the
need and purpose of the proposed CES for renewable energy supply, and (2) the actions proposed
to implement it.
The CES Framework
The Staff White Paper addresses four principal policy objectives of the CES: (1) increase
renewable electricity supply to achieve the 50 by 30 goal, (2) support construction of new
renewable generation in New York State, (3) prevent premature closure of upstate nuclear
facilities, and (4) promote the progress of REV market objectives.
Exhibit 1-1 provides the elements of a CES design framework in consideration of the above
objectives.

1 | SEQRA and Description of the Proposed Action
| 1-4
EXHIBIT 1-1. PROPOSED CES FRAMEWORK 15
(i) All electric retail load serving entities (LSEs) share the obligation of the CES mandate in
proportion to their annual retail electricity sales. This includes 'jurisdictional' LSEs, subject
to the Commission's authority and all 'non-jurisdictional' LSEs (the New York Power Authority,
or NYPA, and the Long Island Power Authority, or LIPA);
(ii) Establishment of CES tiers to support a growing quantity of new renewable generation, as
well as continued contribution of existing renewables and zero emission resources;
(iii) Specification of eligibility requirements for resources within each tier (Resource type,
Vintage, Geographic, Other);
(iv) For each tier, a firm set of requirements through 2020, with targets through 2030 to be
developed in an implementation plan;
(v) Demonstration of compliance through the use of tradable renewable energy credits (RECs)
for renewable energy purchases, and zero emission credits (ZECs) for qualified nuclear
generation purchases, both as created and tracked within a newly designed New York
Generation Attribute Tracking System (NYGATS);
(vi) Use of an alternative compliance payment mechanism for each CES tier to cap REC and ZEC
prices and provide for a flexible alternative means of compliance;
(vii) Competitive long-term procurements by NYSERDA and utilities, as needed, for specific tiers
to support project financing, reduce compliance costs, and provide both generators and
customers with price stability;
(viii) A method for disposition of procured RECs and ZECs;
(ix) Triennial program assessments by the Commission; and
(x) Development of an Implementation Plan.
CES: Renewable Supply
To provide a basis for discussion of the potential impacts of the CES, the SEIS must define the
amounts and types of new renewable generation that may be needed to meet the CES goal. The
analysis presented here evaluates a portfolio of large-scale renewables needed to meet the 50 by
30 target that was developed using a large-scale renewable supply curve model. The model
addresses several types of renewable resources individually, including multiple size categories of
land-based wind, utility-scale solar, upgraded hydroelectric facilities, retrofitting non-powered
dams, off-shore wind, anaerobic digestion, and additional biomass-source generation.16 The
results of the modeling, as a base case, suggest that a total LSR increment of approximately
29,000 GWh will be needed to meet the 50 by 30 goal. As an alternative, high-end case, this
15 NYS DPS. 2016. Staff White Paper on Clean Energy Standard. CASE 15-E-0302. January 25.
16 See Appendix C of this SEIS for a detailed discussion from the white paper concerning the renewable energy
resources that will be eligible to meet the program requirements.
1 | SEQRA and Description of the Proposed Action
| 1-5
SEIS also considers the potential impacts if approximately 40,000 GWh of LSR are necessary to
meet the goal.
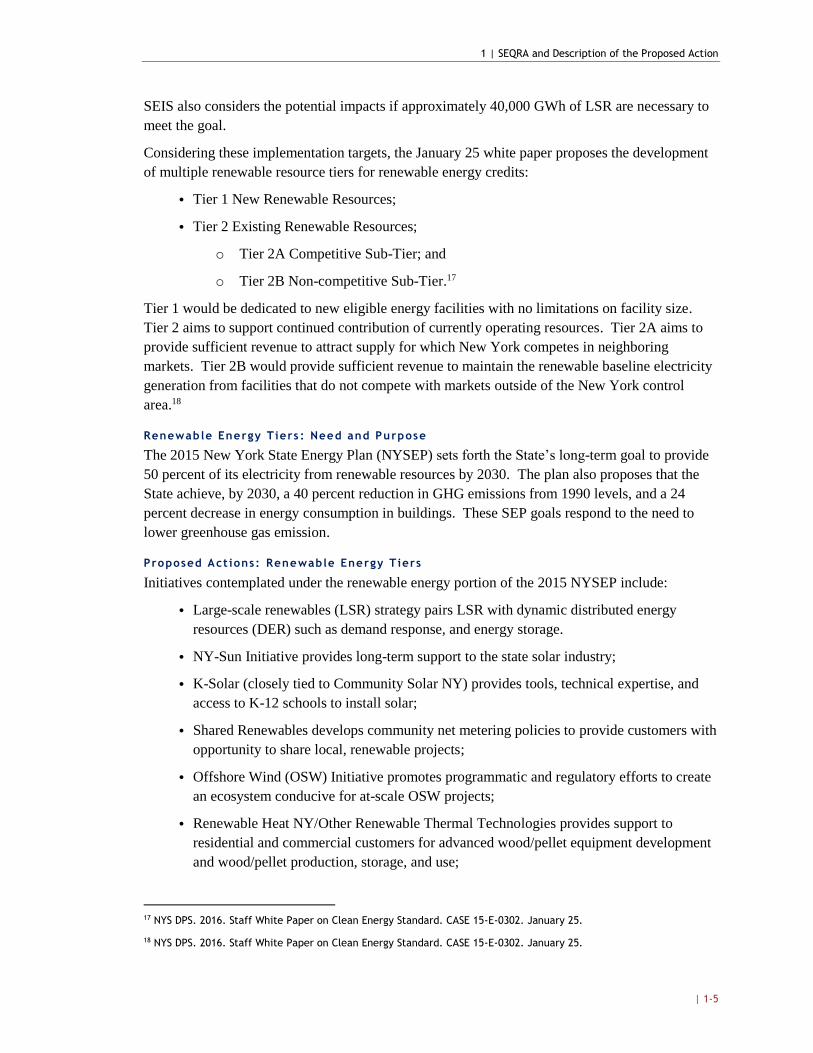
Considering these implementation targets, the January 25 white paper proposes the development
of multiple renewable resource tiers for renewable energy credits:
Tier 1 New Renewable Resources;
Tier 2 Existing Renewable Resources;
o Tier 2A Competitive Sub-Tier; and
o Tier 2B Non-competitive Sub-Tier.17
Tier 1 would be dedicated to new eligible energy facilities with no limitations on facility size.
Tier 2 aims to support continued contribution of currently operating resources. Tier 2A aims to
provide sufficient revenue to attract supply for which New York competes in neighboring
markets. Tier 2B would provide sufficient revenue to maintain the renewable baseline electricity
generation from facilities that do not compete with markets outside of the New York control
area.18
Renewable Energy Tiers : Need and Purpose
The 2015 New York State Energy Plan (NYSEP) sets forth the State’s long-term goal to provide
50 percent of its electricity from renewable resources by 2030. The plan also proposes that the
State achieve, by 2030, a 40 percent reduction in GHG emissions from 1990 levels, and a 24
percent decrease in energy consumption in buildings. These SEP goals respond to the need to
lower greenhouse gas emission.
Proposed Act ions: Renewable Energy Tiers
Initiatives contemplated under the renewable energy portion of the 2015 NYSEP include:
Large-scale renewables (LSR) strategy pairs LSR with dynamic distributed energy
resources (DER) such as demand response, and energy storage.
NY-Sun Initiative provides long-term support to the state solar industry;
K-Solar (closely tied to Community Solar NY) provides tools, technical expertise, and
access to K-12 schools to install solar;
Shared Renewables develops community net metering policies to provide customers with
opportunity to share local, renewable projects;
Offshore Wind (OSW) Initiative promotes programmatic and regulatory efforts to create
an ecosystem conducive for at-scale OSW projects;
Renewable Heat NY/Other Renewable Thermal Technologies provides support to
residential and commercial customers for advanced wood/pellet equipment development
and wood/pellet production, storage, and use;
17 NYS DPS. 2016. Staff White Paper on Clean Energy Standard. CASE 15-E-0302. January 25.
18 NYS DPS. 2016. Staff White Paper on Clean Energy Standard. CASE 15-E-0302. January 25.

1 | SEQRA and Description of the Proposed Action
| 1-6
Clean Organic Waste Management supports development of water resource recovery
facilities that deliver operational and energy productivity gains, and additional revenue
streams; and
Sustainable Fuel Production aims to develop, comprehensive, sustainable, low-carbon
fuel production using in-state agricultural and organic waste feedstock.
The CES will establish a mandate that the 50 by 30 goal be met using these and other renewable
technologies, thereby providing additional incentives to develop both distributed energy
renewable resources and grid-connected renewable energy supply.
1.3 CLEAN ENERGY STANDARD: NUCLEAR TIER
Consistent with 6 NYCRR §617.9(b)(5)(1), this section provides a concise description of: (1) the
need and purpose of the proposed CES nuclear tier (i.e., Tier 3), and (2) the actions proposed to
achieve this CES objective.
Nuclear Tier Need and Purpose
Historically, northeast energy markets have relied on nuclear electricity generation to meet the
region’s minimum electricity needs. However, the growth in natural gas availability has
increased competition in the wholesale electricity market, pricing out some nuclear operators that
face increasing costs. This problem is especially relevant to upstate nuclear plants which rely on
energy revenue margins to maintain their financial viability. These current market conditions
have resulted in the closure, or announced closure, of upstate New York and New England
nuclear facilities. The Vermont Yankee Nuclear Power Station closed in 2014 and two upstate
NY facilities have announced their intent to retire. The R.E. Ginna and James A. FitzPatrick
nuclear plants announced plans to close in 2017 based, in part, on the inability of the wholesale
electric market to value zero emission energy generation.19,20 The Nine Mile Point nuclear facility
also faces these same economic pressures. Combined, these three upstate nuclear facilities
provide approximately 16 percent of the State’s energy.21 If the upstate power plants follow-
through with their intent to close in the near term, New York would need to procure more of its
electricity from fossil fuel generating plants, likely natural gas plants, which would result in
increases in carbon dioxide, nitrogen oxide, and other pollutants.22
Overall, the loss of upstate nuclear facilities would threaten emissions reductions achieved
through the State’s renewable energy programs, diminish fuel diversity, increase price volatility,
19 ISO New England. 2015 Regional Electricity Outlook. 15 January 2015. Accessed January 15, 2016: http://www.iso-
ne.com/static-assets/documents/2015/02/2015_reo.pdf.
20 Case 14-E-0270, Petition Requesting Initiation of a Proceeding to Examine a Proposal for Continued Operation of the
R.E. Ginna Nuclear Power Plant, LLC., Petition Requesting Initiation of a Proceeding to Examine a Proposal for
Continued Operation (filed July 11, 2014). On November 2, 2015, Entergy announced plans to close the FitzPatrick
Nuclear Power Plant. http://www.prnewswire.com/news-releases/entergy-to-closejames-a-fitzpatrick-nuclear-
power-plant-in-central-new-york-300170100.html
21 NYS DPS. 2016. Staff White Paper on Clean Energy Standard. CASE 15-E-0302. January 25.
22 NYS DPS. 2016. Staff White Paper on Clean Energy Standard. CASE 15-E-0302. January 25.
1 | SEQRA and Description of the Proposed Action
| 1-7
and harm host communities. Support for these facilities through a CES mechanism reduces these
threats.
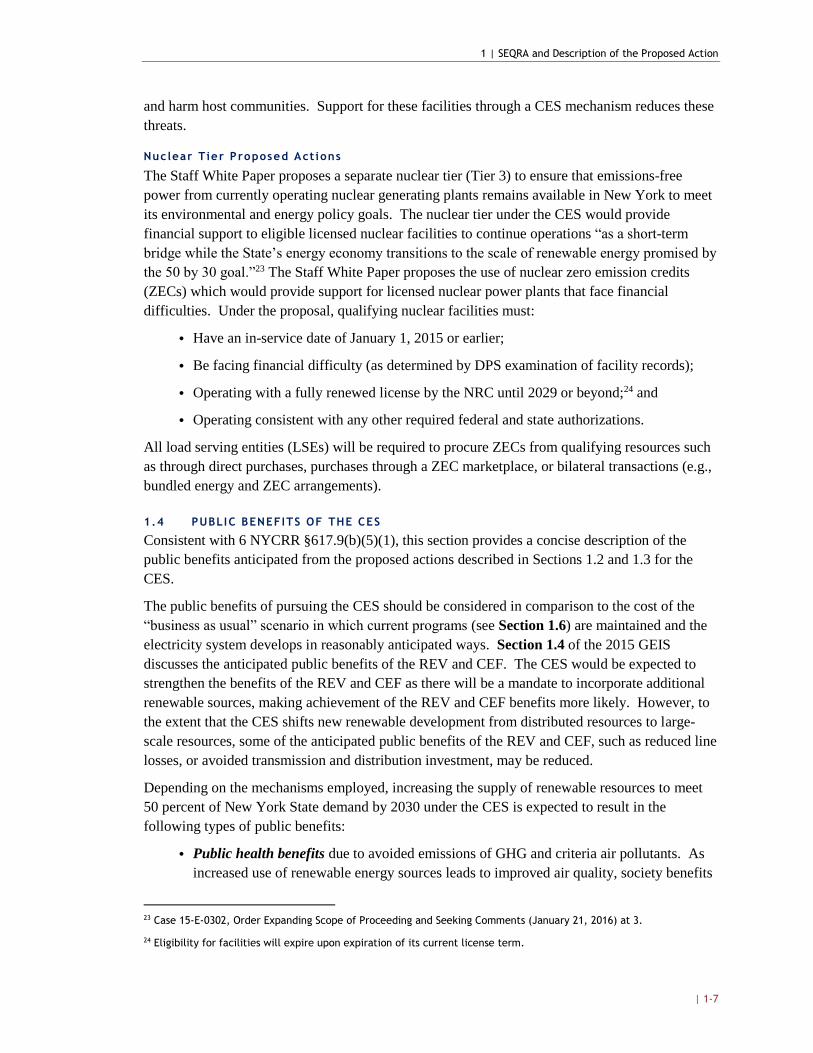
Nuclear Tier Proposed Actions
The Staff White Paper proposes a separate nuclear tier (Tier 3) to ensure that emissions-free
power from currently operating nuclear generating plants remains available in New York to meet
its environmental and energy policy goals. The nuclear tier under the CES would provide
financial support to eligible licensed nuclear facilities to continue operations “as a short-term
bridge while the State’s energy economy transitions to the scale of renewable energy promised by
the 50 by 30 goal.”23 The Staff White Paper proposes the use of nuclear zero emission credits
(ZECs) which would provide support for licensed nuclear power plants that face financial
difficulties. Under the proposal, qualifying nuclear facilities must:
Have an in-service date of January 1, 2015 or earlier;
Be facing financial difficulty (as determined by DPS examination of facility records);
Operating with a fully renewed license by the NRC until 2029 or beyond;24 and
Operating consistent with any other required federal and state authorizations.
All load serving entities (LSEs) will be required to procure ZECs from qualifying resources such
as through direct purchases, purchases through a ZEC marketplace, or bilateral transactions (e.g.,
bundled energy and ZEC arrangements).
1.4 PUBLIC BENEFITS OF THE CES
Consistent with 6 NYCRR §617.9(b)(5)(1), this section provides a concise description of the
public benefits anticipated from the proposed actions described in Sections 1.2 and 1.3 for the
CES.
The public benefits of pursuing the CES should be considered in comparison to the cost of the
“business as usual” scenario in which current programs (see Section 1.6) are maintained and the
electricity system develops in reasonably anticipated ways. Section 1.4 of the 2015 GEIS
discusses the anticipated public benefits of the REV and CEF. The CES would be expected to
strengthen the benefits of the REV and CEF as there will be a mandate to incorporate additional
renewable sources, making achievement of the REV and CEF benefits more likely. However, to
the extent that the CES shifts new renewable development from distributed resources to large-
scale resources, some of the anticipated public benefits of the REV and CEF, such as reduced line
losses, or avoided transmission and distribution investment, may be reduced.
Depending on the mechanisms employed, increasing the supply of renewable resources to meet
50 percent of New York State demand by 2030 under the CES is expected to result in the
following types of public benefits:
Public health benefits due to avoided emissions of GHG and criteria air pollutants. As
increased use of renewable energy sources leads to improved air quality, society benefits
23 Case 15-E-0302, Order Expanding Scope of Proceeding and Seeking Comments (January 21, 2016) at 3.
24 Eligibility for facilities will expire upon expiration of its current license term.

1 | SEQRA and Description of the Proposed Action
| 1-8
from reduced health impacts and increased employee productivity. For example, as air
quality improves, state health care expenditures for treatment of asthma, acute bronchitis,
and respiratory conditions may be reduced.
Climate change benefits related to the reduction in the State’s reliance on fossil fuel
energy. As discussed in Chapter 3 of the 2015 GEIS, climate change is expected to
increase air temperatures which will in turn intensify water cycles through increased
evaporation and precipitation. In New York, more intense water cycles are expected to
lead to increases in local flash and coastal flooding, increases in the frequency and
intensity of extreme precipitation and extreme heat events, longer summer dry periods,
lower summer flows in large rivers, lower groundwater tables, and higher river and in-
stream water temperatures.25
Ecosystem services benefits due to reduced impacts on land and water uses, as renewable
sources are incorporated into New York’s energy supply portfolio in lieu of investment
in fossil fuel sources. For example, “wind and solar energy require essentially no water
to operate, and thus do not pollute water resources or strain supply by competing with
agriculture, drinking water systems, or other important water needs.” 26
Fuel diversity benefits. Measures proposed under the CES 50 by 30 goal and CES
nuclear maintenance program will likely serve to maintain fuel diversity. The addition of
new renewable electricity supplies will also limit the State’s reliance on natural gas,
thereby contributing to this objective.
Economic development benefits. CES is expected to create regional economic benefits
through New York State. These benefits can take the form of increased manufacturing of
renewable energy equipment; jobs and revenue creation, and the effects of spending
throughout local economies. Construction of additional LSR energy resources to meet
the CES 50 by 30 goal may provide such regional economic benefits. A recent analysis
found that for every incentive dollar spent by New York to support the construction of
new LSR facilities, the state realizes approximately $3 of direct investment associated
with project spending over the project’s lifetime. 27 To the extent the CES nuclear
maintenance program enables continued operation of facilities that would otherwise
retire, the action would result in benefits to the regional economy in the form of stable
wages, jobs, and tax revenues.
1.5 LOCATION OF ACTION
25 Rosenzweig, C., W. Solecki, A. DeGaetano, M. O’Grady, S. Hassol, P. Grahborn (Eds). 2011. Responding to Climate
Change in New York State. Synthesis Report prepared for NYSERDA. Accessed on September 10, 2014 at:
http://www.nyserda.ny.gov/-/media/Files/Publications/Research/Environmental/EMEP/climaid/ClimAID-
synthesisreport.pdf.
26 Union of Concerned Scientists. Benefits of Renewable Energy Use. Accessed on January 26, 2015 at:
http://www.ucsusa.org/clean_energy/our-energy-choices/renewable-energy/public-benefits-of-
renewable.html#.VqfE4fkrL0M.
27 NYSERDA. 2013. “NYSERDA Renewable Portfolio Standard Main Tier 2013 Program Review, Final Report,” September
5. http://www.nyserda.ny.gov/-/ media/Files/EDPPP/Energy-and-Environmental-Markets/RPS/RPS-
Documents/2013/2013-RPS-investments-NYS.pdf

1 | SEQRA and Description of the Proposed Action
| 1-9
The CES in conjunction with the REV and CEF is intended to transform the ways in which
energy is valued, generated, distributed, managed, and used in meeting New York’s energy
demand. As such, the location of the action is the entire State of New York. Subsequent chapters
use the State of New York as the analytic study area.
1.6 RELATIONSHIPS TO OTHER PLANS AND PROGRAMS
The CES, which will be the successor program to the Renewable Portfolio Standard Program
(RPS), will interact with a number of additional energy-related programs and plans. Many of
these programs are described in the 2015 State Energy Plan and include, for example, the many
initiatives contemplated under the REV regulatory docket and NYSERDA’s CEF, such as the
New York Green Bank and New York Sun.

2 | The Electric Industry in New York State
| 2-1
CHAPTER 2 | THE ELECTRIC INDUSTRY IN NEW YORK STATE
Consistent with 6 NYCRR §617.9(b)(5)(ii) of the SEQRA, this chapter provides baseline
information on the State’s current energy industry, which the CES, in conjunction with the
activities contemplated under the REV and CEF proceedings, is intended to transform. The
background information presented in this chapter is provided to assist with understanding the
impacts of the proposed CES actions and, together with Chapter 3, describes the baseline against
which Chapters 5 through 10 evaluate and compare the impacts of the proposed CES on the
energy industry in New York.
This chapter incorporates by reference the information presented in Chapter 2 of the 2015 GEIS.
Specifically, this chapter is organized into two parts, reflecting select updates on the information
provided on New York’s electric industry since the 2015 GEIS was published:
Section 2.1: Trends in Electricity Demand;
Section 2.2: The Present Electric System.
Updates presented in the aforementioned sections are limited to and focused on relevant factors
that may assist in understanding the likely impacts of the Commission’s development and
implementation of the CES.
2.1 TRENDS IN ELECTRICITY DEMAND
In looking at national trends in energy consumption, overall U.S. electricity remained relatively
flat from 2013 to 2014, as compared to consecutive decreases in electricity demand during the
prior three years.28 In New York annual electric use dropped 2.1 percent between 2013 and
2014.29 Exhibit 2-1 below presents historical trends in electric energy demand in New York
State. Over the past fifteen years, New York’s electric energy demand grew by an average annual
rate of 0.21 percent.30 As noted in the 2015 GEIS, while average demand has been growing over
the past ten years, total energy use across all sectors fell by an average of 0.8 percent per year
between 2000 and 2012 in New York.31
28 When looking at national trends in energy consumption, the 2015 GEIS noted that U.S. electricity demand fell for the
third consecutive year, dropping by 0.1 percent between 2012 and 2013.
29 NYISO. 2015. Power Trends 2015: Rightsizing the Grid. Accessed January 14, 2016 at:
http://www.nyiso.com/public/webdocs/media_room/press_releases/2015/Child_PowerTrends_2015/ptrends2015_FI
NAL.pdf.
30 Ibid.
31 New York State Energy Planning Board. 2014. New York State Energy Plan. Volume 2: End-Use Energy. Accessed
September 14, 2014 at: http://energyplan.ny.gov/-/media/nysenergyplan/2014stateenergyplan-documents/2014-
draft-nysep-vol2-enduse.pdf.

2 | The Electric Industry in New York State
| 2-2
In 2013, New York State continues to rank eighth in terms of total energy consumption.32 The
State also continues to remain among the lowest in the nation in terms of energy consumption per
capita; in 2013, New York Stated was tied with Rhode Island in terms of energy consumption per
capita.33 The state’s low per capita energy consumption is due in part to its widely-used mass
transportation systems in the New York metropolitan area; according to the EIA, more than half
of New York residents (and more than half of New York City workers) use public transit, a rate
five times the U.S. average.34
EXHIBIT 2-1. NEW YORK STATE ELECTRIC ENERGY USAGE TRENDS, ACTUAL AND
FORECAST
Source: NYISO. 2015. Power Trends 2015: Rightsizing the Grid. Page 11.
In addition to annual electric energy demand, which provides a measure of overall electricity
consumption, it is important to consider annual peak demand, which measures the maximum
amount of electricity a system is required to deliver, as discussed above. While peak demand
represents only a small fraction of a year’s overall power consumption, it is a significant system
factor because reliability standards are based on projected peak demand. The 2014 Peak Demand
was 12 percent below the 2013 peak demand due to a milder than typical summer. Despite the
lower than expected 2014 peak demand, peak demand is expected to continue to grow over time;
the most recent forecast estimates an annual 0.48 percent each year between 2015 and 2025.35 As
32 EIA. Rankings: Total Energy Consumed per Capita, 2013 (million Btu). Accessed January 18, 2016 at:
https://www.eia.gov/state/seds/data.cfm?incfile=/state/seds/sep_sum/html/rank_use_gdp.html.
33 EIA. Rankings: Total Energy Consumed per Capita, 2013 (million Btu). Accessed January 18, 2016 at:
https://www.eia.gov/state/rankings/.
34 EIA. State Energy Data System. Last Updated: July 167, 2015. Accessed January 18, 2016 at:
http://www.eia.gov/state/print.cfm?sid=NY.
35 Ibid.
2 | The Electric Industry in New York State
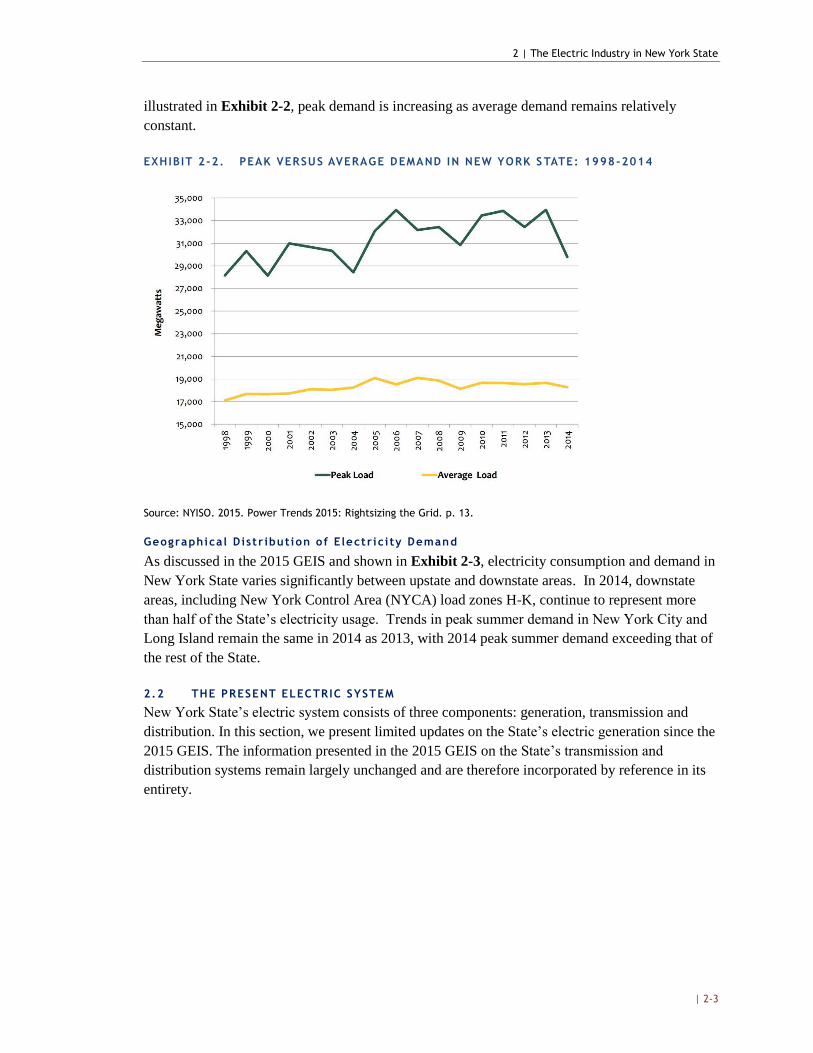
| 2-3
illustrated in Exhibit 2-2, peak demand is increasing as average demand remains relatively
constant.
EXHIBIT 2-2. PEAK VERSUS AVERAGE DEMAND IN NEW YORK STATE: 1998-2014
Source: NYISO. 2015. Power Trends 2015: Rightsizing the Grid. p. 13.
Geographical Distr ibution of Electrici ty Demand
As discussed in the 2015 GEIS and shown in Exhibit 2-3, electricity consumption and demand in
New York State varies significantly between upstate and downstate areas. In 2014, downstate
areas, including New York Control Area (NYCA) load zones H-K, continue to represent more
than half of the State’s electricity usage. Trends in peak summer demand in New York City and
Long Island remain the same in 2014 as 2013, with 2014 peak summer demand exceeding that of
the rest of the State.
2.2 THE PRESENT ELECTRIC SYSTEM
New York State’s electric system consists of three components: generation, transmission and
distribution. In this section, we present limited updates on the State’s electric generation since the
2015 GEIS. The information presented in the 2015 GEIS on the State’s transmission and
distribution systems remain largely unchanged and are therefore incorporated by reference in its
entirety.

2 | The Electric Industry in New York State
| 2-4
EXHIBIT 2-3. 2014 ELECTRICITY DEMAND, BY NEW YORK CONTROL AREA LOAD ZONE
STATE SUB-AREA NYCA LOAD ZONE
2014 ANNUAL ENERGY
USAGE (GWh)
PEAK DEMAND (MW)
SUMMER WINTER
Upstate A (West) 15,890 2,227 2,419
B (Genesee) 9,902 1,617 1,617
C (Central) 16,347 2,574 2,689
D (North) 4,835 527 725
E (Mohawk Valley) 8,158 1,267 1,339
F (Capital) 12,010 2,033 1,925
G (Hudson Valley) 9,834 2,036 1,556
Downstate H (Millwood) 2,886 584 537
I (Dunwoodie) 6,088 1,333 954
J (New York City) 52,541 10,567 7,481
K (Long Island) 21,568 5,017 3,406
Upstate Subtotal 67,142 12,281 12,270
Downstate Subtotal 83,083 17,501 12,378
TOTAL 160,059 29,782 24,648
Source: NYISO, 2015 Load & Capacity Data “Gold Book.” Page 22.
Exist ing Power Plants and Capacity
According to NYISO, for the summer of 2015, power resources available to serve New York
State totaled 41,610 MW. 36, 37 While the 2015 total is 312 MW higher than the previous year
(41,298 MW), the summer 2015 total resource capability remained above the projected peak
demand of 33,567 MW.38 As of September 2015, New York State ranked seventh in the country
for total net electricity generation with a total of 12,005 MWh, up from one year prior when New
York State ranked ninth in the nation with a total net electricity generation of 9,685 MWh.39
Exhibit 2-4 details New York State’s power generation and capacity by fuel type. The mix of
fuel types remains relatively steady since 2013, with the majority of the state’s total capacity
(based on 2015 summer capability) and electric generation coming from three fuel types: dual-
fuel (gas and oil) facilities, nuclear (producing just under 1/3), and hydropower.40
36 NYISO. 2015 Load & Capacity Data “Gold Book.” April 2015.
37 NYISO. 2015. Power Trends 2015: Rightsizing the Grid. Accessed January 14, 2016 at:
http://www.nyiso.com/public/webdocs/media_room/press_releases/2015/Child_PowerTrends_2015/ptrends2015_FI
NAL.pdf. Includes installed generating capacity of 39,039 MW from in-state power projects, projected levels of
demand response participation totaling 1,124 MW, and power available for imports from neighboring electric systems
of 1,446 MW.
38 Ibid.
39 EIA. New York State Profile and Energy Estimates: Rankings: Total Net Electricity Generation September 2015.
Accessed January 15, 2016 at: http://www.eia.gov/state/rankings/?sid=NY#series/51.
40 NYISO. 2015. Power Trends 2015: Rightsizing the Grid. Accessed January 14, 2016 at:
http://www.nyiso.com/public/webdocs/media_room/press_releases/2015/Child_PowerTrends_2015/ptrends2015_FI
NAL.pdf.
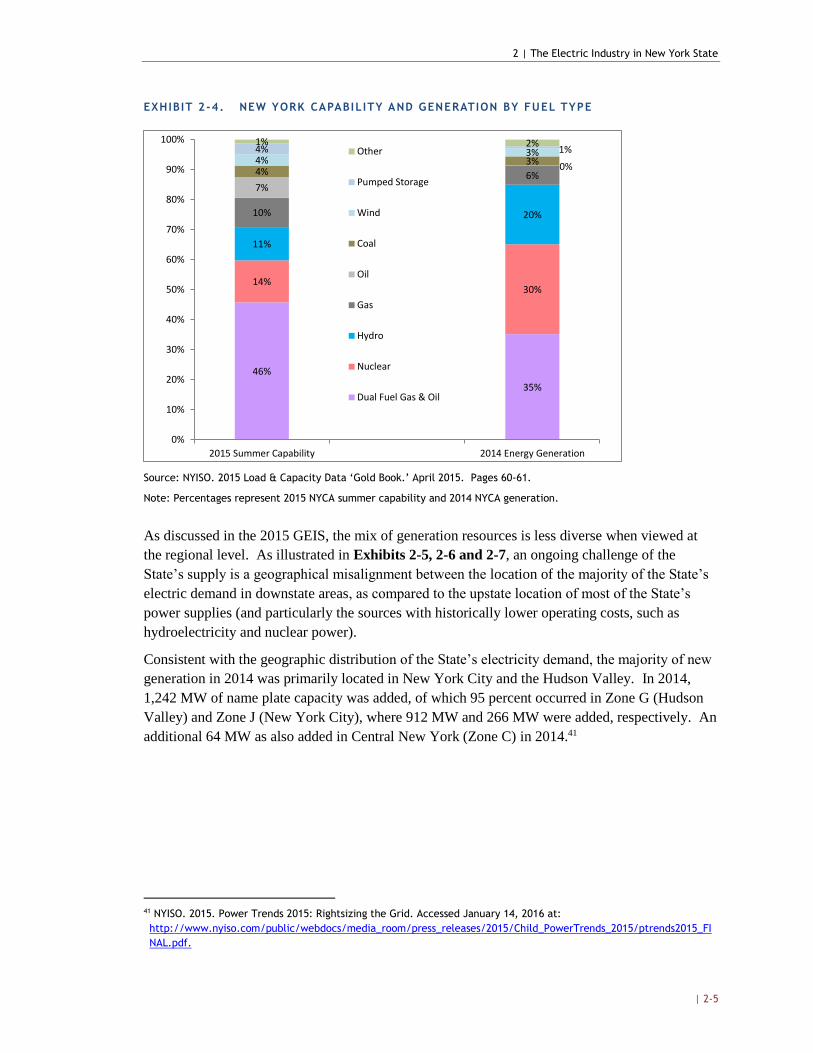
2 | The Electric Industry in New York State
| 2-5
EXHIBIT 2-4. NEW YORK CAPABILITY AND GENERATION BY FUEL TYPE
Source: NYISO. 2015 Load & Capacity Data ‘Gold Book.’ April 2015. Pages 60-61.
Note: Percentages represent 2015 NYCA summer capability and 2014 NYCA generation.
As discussed in the 2015 GEIS, the mix of generation resources is less diverse when viewed at
the regional level. As illustrated in Exhibits 2-5, 2-6 and 2-7, an ongoing challenge of the
State’s supply is a geographical misalignment between the location of the majority of the State’s
electric demand in downstate areas, as compared to the upstate location of most of the State’s
power supplies (and particularly the sources with historically lower operating costs, such as
hydroelectricity and nuclear power).
Consistent with the geographic distribution of the State’s electricity demand, the majority of new
generation in 2014 was primarily located in New York City and the Hudson Valley. In 2014,
1,242 MW of name plate capacity was added, of which 95 percent occurred in Zone G (Hudson
Valley) and Zone J (New York City), where 912 MW and 266 MW were added, respectively. An
additional 64 MW as also added in Central New York (Zone C) in 2014.41
41 NYISO. 2015. Power Trends 2015: Rightsizing the Grid. Accessed January 14, 2016 at:
http://www.nyiso.com/public/webdocs/media_room/press_releases/2015/Child_PowerTrends_2015/ptrends2015_FI
NAL.pdf.
46%
35%
14%30%
11%
20%10%
6%7%
0%4%3%4%3%4% 1%
1% 2%
0%
10%
20%
30%
40%
50%
60%
70%
80%
90%
100%
2015 Summer Capability 2014 Energy Generation
Other
Pumped Storage
Wind
Coal
Oil
Gas
Hydro
Nuclear
Dual Fuel Gas & Oil

2 | The Electric Industry in New York State
| 2-6
EXHIBIT 2-5. LOCATION OF GENERATION BY FUEL TYPE, 2012-2013

2 | The Electric Industry in New York State
| 2-7
EXHIBIT 2-6. 2015 INSTALLED GENERATION CAPACITY BY NYCA LOAD ZONE
STATE SUB-AREA
NYCA
LOAD ZONE
INSTALLED CAPACITY (MW)
SUMMER WINTER
Upstate A (West) 4,493 4,530
B (Genesee) 767 782
C (Central) 6,651 6,933
D (North) 1,620 1,636
E (Mohawk Valley) 1,087 1,118
F (Capital) 4,413 4,972
G (Hudson Valley) 2,649 2,618
Downstate H (Millwood) 2,107 2,132
I (Dunwoodie) - -
J (New York City) 9,597 10,560
K (Long Island) 5,281 5,732
Upstate Subtotal 21,680 22,648
Downstate Subtotal 16,985 18,114
TOTAL 38,665 41,013
Source: NYISO. 2015 Load & Capacity Data “Gold Book.” April. p. 58, 59. Accessed January 18, 2016 at: http://www.nyiso.com/public/webdocs/markets_operations/services/planning/Documents_and_Resources/Planning_Data_and_Refer
ence_Docs/Data_and_Reference_Docs/2015%20Load%20and%20Capacity%20Data%20Report.pdf
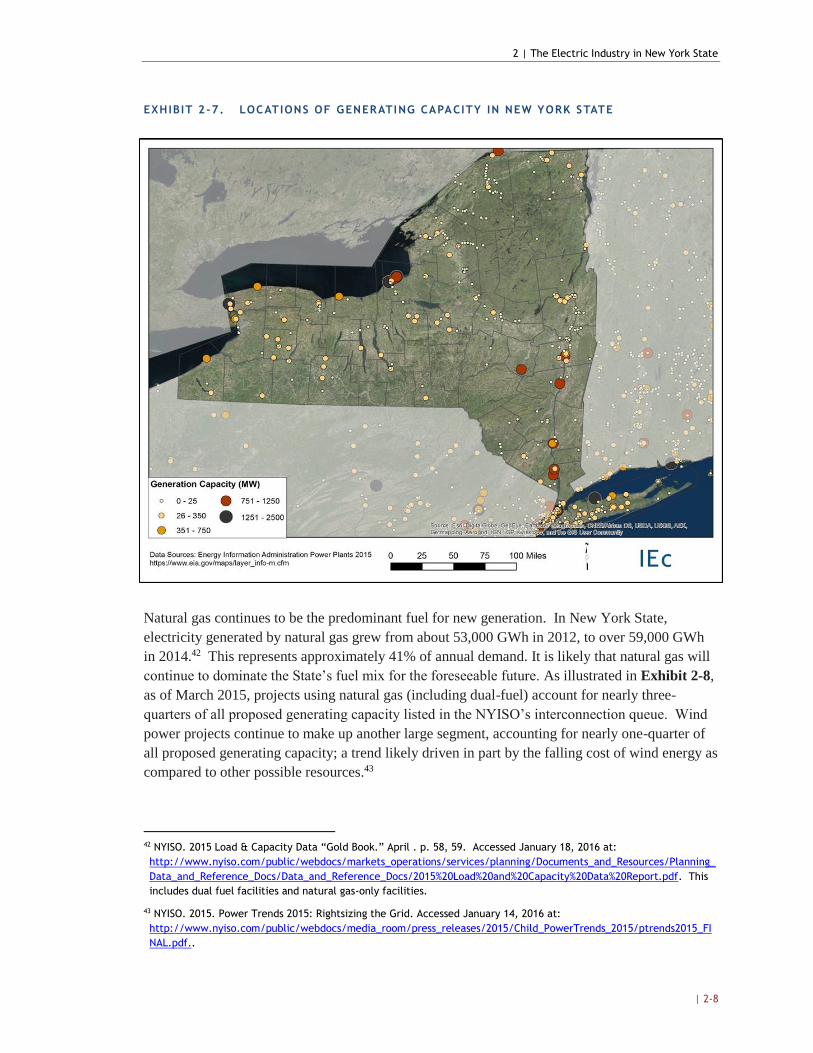
2 | The Electric Industry in New York State
| 2-8
EXHIBIT 2-7. LOCATIONS OF GENERATING CAPACITY IN NEW YORK STATE
Natural gas continues to be the predominant fuel for new generation. In New York State,
electricity generated by natural gas grew from about 53,000 GWh in 2012, to over 59,000 GWh
in 2014.42 This represents approximately 41% of annual demand. It is likely that natural gas will
continue to dominate the State’s fuel mix for the foreseeable future. As illustrated in Exhibit 2-8,
as of March 2015, projects using natural gas (including dual-fuel) account for nearly three-
quarters of all proposed generating capacity listed in the NYISO’s interconnection queue. Wind
power projects continue to make up another large segment, accounting for nearly one-quarter of
all proposed generating capacity; a trend likely driven in part by the falling cost of wind energy as
compared to other possible resources.43
42 NYISO. 2015 Load & Capacity Data “Gold Book.” April . p. 58, 59. Accessed January 18, 2016 at:
http://www.nyiso.com/public/webdocs/markets_operations/services/planning/Documents_and_Resources/Planning_
Data_and_Reference_Docs/Data_and_Reference_Docs/2015%20Load%20and%20Capacity%20Data%20Report.pdf. This
includes dual fuel facilities and natural gas-only facilities.
43 NYISO. 2015. Power Trends 2015: Rightsizing the Grid. Accessed January 14, 2016 at:
http://www.nyiso.com/public/webdocs/media_room/press_releases/2015/Child_PowerTrends_2015/ptrends2015_FI
NAL.pdf..

2 | The Electric Industry in New York State
| 2-9
EXHIBIT 2-8. PROPOSED GENERATION BY FUEL TYPE (2015)
Source: NYISO. 2015. Power Trends 2015: Rightsizing the Grid.
Imports and Exports
To meet its electricity load demand, New York State imports a portion of its electricity from
neighboring control areas. In 2013, New York imported an average 3,000 MW during peak
hours, in 2014 State imports fell to just under 2,500 MW.44
New York State’s main sources of imports are: Hydro-Québec, Ontario Hydro, New England, and
the PJM system. In addition to these four primary interfaces, Long Island and New York City
connect directly to PJM and New England across five controllable lines: the Cross Sound Cable,
the 1385 Line, the Linden VFT Line, the HTP Line, and the Neptune Cable. Exhibit 2-9
summarizes the average net scheduled imports from neighboring domestic and international
control areas during peak hours (i.e., Monday through Friday, 6am to 10pm) in 2013 and 2014.45
The vast majority of the State’s imports continue to come from Canada, with almost 50 percent
(as compared to 60 percent in 2013) of New York’s net imports during peak hours provided
solely by Hydro-Québec.
44 Potomac Economics. 2014 State of the Market Report for the New York ISO Markets. May 2015. Developed by
Accessed: January 17, 2016.
http://www.nyiso.com/public/webdocs/markets_operations/documents/Studies_and_Reports/Reports/Market_Monit
oring_Unit_Reports/2014/NYISO2014SOMReport__5-13-2015_Final.pdf
45 Potomac Economics. 2014 State of the Market Report for the New York ISO Markets. May 2015. Developed by
Accessed: January 17, 2016.
http://www.nyiso.com/public/webdocs/markets_operations/documents/Studies_and_Reports/Reports/Market_Monit
oring_Unit_Reports/2014/NYISO2014SOMReport__5-13-2015_Final.pdf

2 | The Electric Industry in New York State
| 2-10
EXHIBIT 2-9. AVERAGE NET IMPORTS (MW) FROM NEIGHBORING AREAS DURING PEAK
HOURS
YEAR
HYDRO
QUEBE
C
ONTARI
O PJM
NEW
ENGLAN
D CSC
NEPTUN
E
138
5 VFT HTP TOTAL
2013 1,296 808 489 -463 245 371 99 124 46 3,016
2014 1,152 768 352 -702 173 528 56 43 68 2,438
Source: Potomac Economics. 2014 State of the Market Report for the New York ISO Markets. May 2015.
Developed by Accessed: January 17, 2016.
http://www.nyiso.com/public/webdocs/markets_operations/documents/Studies_and_Reports/Reports/Market
_Monitoring_Unit_Reports/2014/NYISO2014SOMReport__5-13-2015_Final.pdf

3 | Environmental Setting
| 3-1
CHAPTER 3 | ENVIRONMENTAL SETTING
Consistent with 6 NYCRR §617.9(b)(5)(ii) of SEQRA, this chapter provides an overview of New
York State’s current environmental setting, defined under 6 NYCRR §617.2(l) as “the physical
conditions that will be affected by [the] proposed action, including land, air, water, minerals,
flora, fauna, noise, resources of agricultural, archeological, historic or aesthetic significance,
existing patterns of population concentration, distribution or growth, existing community or
neighborhood character, and human health.” The environmental setting described in this chapter
serves as a baseline for the existing environmental conditions against which Chapters 5 through
10 evaluate and compare the potential impacts of the CES.
This chapter incorporates by reference the information presented in Chapter 3 of the 2015 2015
GEIS. Specifically this chapter is organized into six parts, reflecting select updates on the
information provided on New York’s environmental setting since the 2015 GEIS was published:
Section 3.1: Population;
Section 3.2: Land Use;
Section 3.3 Species Biodiversity;
Section 3.4 Open Space;
Section 3.5 Socioeconomics; and
Section 3.6 Community Character.
Updates presented here are limited to and focused on relevant factors that may assist in
understanding the likely impacts of the Commission’s development and implementation of the
CES.46
3.1 POPULATION 47
New York remains the third most populous state, behind California and Texas.48 In 2014, the
U.S. Census estimated the population of New York at 19,746,227, an increase of approximately
46 The full list of environmental resource areas addressed in 2015 2015 GEIS includes: physical geography, land use,
water resources, climate and air quality, forest resources, critical environmental areas, species biodiversity, scenic
and visual resources, open space, cultural and historic resources, waste management, noise and odor pollution, public
health, growth and community character, transportation, socioeconomics and environmental justice.
47 U.S. Census Bureau. State & County Quick Facts – New York. Accessed August 14, 2014 at:
http://quickfacts.census.gov/qfd/states/36000.html.
48 U.S. Census Bureau. 2013. American Fact Finder. Annual Estimates of the Resident Population: April 1, 2010 to July
1, 2013. 2013 Population Estimates. Accessed August 20, 2014 at:
http://factfinder2.census.gov/faces/nav/jsf/pages/index.xhtml.

3 | Environmental Setting
| 3-2
two percent as compared to 2010 population levels. Population levels and density vary
substantially across the State. The five counties within New York City – Bronx, Kings, New
York, Queens, and Richmond – are home to approximately 8.4 million residents and feature a
population density of 27,546 per square mile. By comparison, the remainder of the State contains
11.2 million residents at a density of 240 persons per square mile.49
Population growth follows similar patterns as population levels and density. While the State saw
an overall increase in population, much of that population growth is occurring in New York’s
downstate counties. Of the State’s 62 counties, 22 counties experienced population growth
between 2010 and 2014 (Exhibit 3-1). Population in all ten counties in the downstate area
increased in 2014 compared to 2010, whereas only 12 counties in the remaining upstate areas
experienced growth. The largest population losses (measured as a percentage of total population)
occurred in three counties: Schoharie, Delaware, and Allegany.
EXHIBIT 3-1. CHANGE IN ESTIMATED POPULATION BY NEW YORK COUNTY (2010-2014)
Changes in county level populations are largely driven by differences in domestic and foreign
migration rates, where the former is a measure of the movement of residents outside of a county
and the latter a measure of the movement of foreign immigrants into a county. Notably, all
counties in New York State lost population due to domestic migration but such losses in
downstate areas were offset by increases in foreign migration rates. Exhibit 3-2 below illustrates
changes in the domestic migration rate from 2010 to 2014.
49 New York State Department of Health. 2013. Vital Statistics of New York State 2013: Table 2: Population, Land Area,
and Population Density by County, New York State - 2013. Accessed January 20, 2014 at:
http://www.health.ny.gov/statistics/vital_statistics/2013/table02.htm

3 | Environmental Setting
| 3-3
EXHIBIT 3-2. DOMESTIC MIGRATION RATES FOR NY COUNTIES (2010-2014)
3.2 LAND USE
Land use is generally defined as the management and/or modification of the natural environment
(or land) to support human uses. Existing land uses are largely a function of local topography but
are also influenced by such factors as proximity to developed areas and transportation networks,
past uses of the land, and general societal and economic trends. Exhibits 3-3 and 3-4 provide an
overview of major land uses across the State. As shown, more than half of New York State is
forest and woodland (56 percent), while approximately 13 percent is active farmland and another
11 percent pasture. Developed areas, which consist primarily of residential, commercial, and
industrial land uses, comprise approximately nine percent of the State.
EXHIBIT 3-3. NEW YORK STATE LAND USE SUMMARY (2014)
LAND TYPE ACRES PERCENT OF TOTAL
Cropland 3,912,575 13%
Pasture 3,276,078 11%
Forest & Woodland 17,785,685 57%
Developed Land 2,916,265 9%
Open Water 1,061,497 3%
Wetlands 1,602,363 5%
Barren 51,398 0%
Shrubland 508,760 2%
TOTAL 31,114,621 100%
Source: USDA. 2015. 2014 Cropland Data Layer. National Agricultural Statistics Service. Accessed January 21, 2016 at https://nassgeodata.gmu.edu/CropScape/. USDA-NASS, Washington, DC.

3 | Environmental Setting
| 3-4
EXHIBIT 3-4. LAND USE ACROSS NEW YORK STATE (2014)
Agricul ture 50
Agriculture remains an important industry to the state’s overall economy. While the state ranks
26 in the nation for total value of agricultural sales, New York is one of the top five producers for
a number of agricultural commodities, including milk, horses, ponies, mules and donkeys. The
State also ranks one of the top ten producers nationwide for a number of fruits, tree nuts, certain
berries and floriculture and nursery products. Agricultural sales in recent years have outpaced the
national average. In 2014, New York set a new record for sales with $6.36 billion in cash
receipts, up from $4.7 billion in 2010. Commodities experiencing the greatest growth since 2010
include poultry and eggs, peaches, honey, cattle and hay.51
The characteristics of the State’s farms remain as described in the 2015 GEIS. Farmland
accounts for nearly one-quarter of the State’s total land area (approximately 7.2 million acres), of
which 59 percent is dedicated to crops, 22 percent is woodland, ten percent is pastureland and the
remaining nine percent committed to conservation and other uses. Each year, the U.S.
50 New York State Comptroller. 2015. The Importance of Agriculture to the New York State Economy. March. Accessed
January 20, 2016 at: http://www.osc.state.ny.us/reports/importance_agriculture_ny.pdf.
51 Governor Cuomo Announces Growth of New York Agricultural Sales Outpaces National Average. December 14, 2015.
[Press Release]. Accessed August 14, 2014 at: http://www.governor.ny.gov/news/governor-cuomo-announces-growth-
new-york-agricultural-sales-outpaces-national-average.

3 | Environmental Setting
| 3-5
Department of Agriculture issues an annual bulletin for each state. According to the New York
Annual Bulletin for 2014-2015, the total number of farms has remained steady at 35,500 farms
since 2012. The average farm size is 202 acres, as compared to a national average of 438 acres;
more than half of New York’s farms are smaller than 100 acres. The majority (80 percent) of the
State’s farms report sales less than $100,000 per year based on data from 2010 to 2014. The
average age of farmers in the State is approximately 55 years old, with more than three-quarters
of farmers over the age of 45.
While agricultural activity occurs all across the State, the Southern Tier has the largest number of
farms with more than 6,600 farms, while the Finger Lakes region supports the largest amount of
farmland with over 1.47 million acres. As shown in Exhibits 3-5 and 3-6, the top five counties
for sales in 2012 were Wyoming, Cayuga, Suffolk, Genesee and St. Lawrence.
EXHIBIT 3-5. AGRICULTURAL SALES BY COUNTY (2012)
Source: New York State Comptroller. 2015. The Importance of Agriculture to the New York State Economy. March.
Accessed January 20, 2016 at: http://www.osc.state.ny.us/reports/importance_agriculture_ny.pdf.
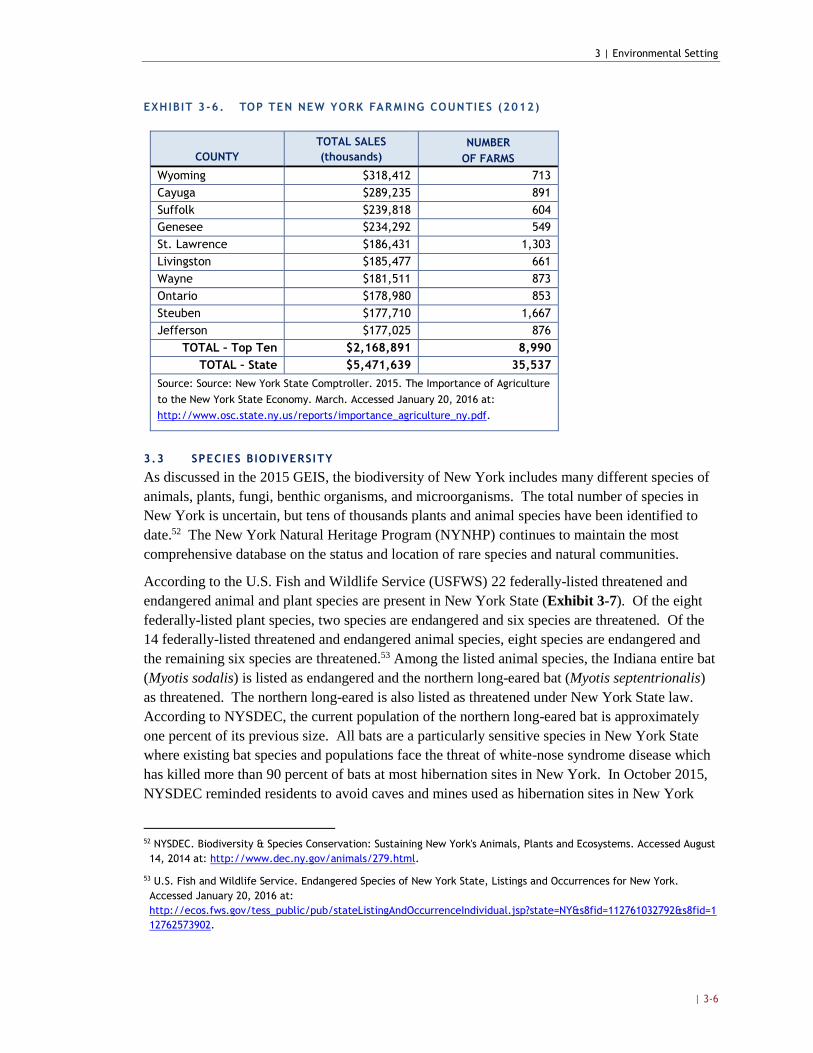
3 | Environmental Setting
| 3-6
EXHIBIT 3-6. TOP TEN NEW YORK FARMING COUNTIES (2012)
COUNTY
TOTAL SALES
(thousands)
NUMBER
OF FARMS
Wyoming $318,412 713
Cayuga $289,235 891
Suffolk $239,818 604
Genesee $234,292 549
St. Lawrence $186,431 1,303
Livingston $185,477 661
Wayne $181,511 873
Ontario $178,980 853
Steuben $177,710 1,667
Jefferson $177,025 876
TOTAL – Top Ten $2,168,891 8,990
TOTAL – State $5,471,639 35,537
Source: Source: New York State Comptroller. 2015. The Importance of Agriculture
to the New York State Economy. March. Accessed January 20, 2016 at:
http://www.osc.state.ny.us/reports/importance_agriculture_ny.pdf.
3.3 SPECIES BIODIVERSITY
As discussed in the 2015 GEIS, the biodiversity of New York includes many different species of
animals, plants, fungi, benthic organisms, and microorganisms. The total number of species in
New York is uncertain, but tens of thousands plants and animal species have been identified to
date.52 The New York Natural Heritage Program (NYNHP) continues to maintain the most
comprehensive database on the status and location of rare species and natural communities.
According to the U.S. Fish and Wildlife Service (USFWS) 22 federally-listed threatened and
endangered animal and plant species are present in New York State (Exhibit 3-7). Of the eight
federally-listed plant species, two species are endangered and six species are threatened. Of the
14 federally-listed threatened and endangered animal species, eight species are endangered and
the remaining six species are threatened.53 Among the listed animal species, the Indiana entire bat
(Myotis sodalis) is listed as endangered and the northern long-eared bat (Myotis septentrionalis)
as threatened. The northern long-eared is also listed as threatened under New York State law.
According to NYSDEC, the current population of the northern long-eared bat is approximately
one percent of its previous size. All bats are a particularly sensitive species in New York State
where existing bat species and populations face the threat of white-nose syndrome disease which
has killed more than 90 percent of bats at most hibernation sites in New York. In October 2015,
NYSDEC reminded residents to avoid caves and mines used as hibernation sites in New York
52 NYSDEC. Biodiversity & Species Conservation: Sustaining New York's Animals, Plants and Ecosystems. Accessed August
14, 2014 at: http://www.dec.ny.gov/animals/279.html.
53 U.S. Fish and Wildlife Service. Endangered Species of New York State, Listings and Occurrences for New York.
Accessed January 20, 2016 at:
http://ecos.fws.gov/tess_public/pub/stateListingAndOccurrenceIndividual.jsp?state=NY&s8fid=112761032792&s8fid=1
12762573902.

3 | Environmental Setting
| 3-7
between October 1 and April 30. There is no known treatment for white-nose syndrome on bats
but research is ongoing.54
EXHIBIT 3-7. ENDANGERED AND THREATENED ANIMAL SPECIES BELIEVED OR KNOWN TO
OCCUR IN NEW YORK
SPECIES/LISTING NAME
U.S. FWS
LISTED STATUS
NYS LISTED
SPECIES
CLIMATE CHANGE
VULNERABILITY* TYPE
Bat, Indiana Entire (Myotis sodalis) Endangered Endangered Moderately Mammals
Bat, Northern long-eared (Myotis
septentrionalis) Threatened Threatened - Mammals
Bean, rayed (Villosa fabalis) Endangered Endangered Moderately Molluscs
Beetle, American Burying
(Nicrophorus americanus) - Endangered - Insects
Beetle, Northeastern Beach Tiger
(Cicindela dorsalis dorsalis) - Threatened - Insects
Bittern, Least (Ixobrychus exilis) - Threatened - Birds
Bluet, Pine Barrens (Enallagma
recurvatum) - Threatened Presumed Stable Insects
Bluet, Scarlet (Enallagma pictum) - Threatened - Insects
Bluet, Little (Enallagma minisculum) - Threatened - Insects
Buckmoth, Bog (Hemileuca species 1) - Endangered Extremely Insects
Butterfly, Karner blue Entire
(Lycaeides melissa samuelis) Endangered Endangered Extremely Insects
Chub, Gravel (Erimystax x-punctata) - Threatened - Fish
Chub, Silver (Macrhybopsis
storeriana) - Endangered - Fish
Chubsucker, Lake (Erimyzon sucetta) - Threatened - Fish
Clubshell Wherever found; Except
where listed as Experimental
Populations (Pleurobema clava)
Endangered Endangered - Molluscs
Cougar (Felis concolor) - Endangered - Mammal
Curlew, Eskimo (Numenius borealis) - Endangered - Birds
Darter, Bluebreast (Etheostoma
camurum) - Endangered - Fish
Darter, Gilt (Percina evides) - Endangered - Fish
Darter, Longhead (Percina
macrocephala) - Threatened Presumed Stable Fish
Darter, Eastern Sand (Ammocrypta
pellucida) - Threatened Moderately Fish
Darter, Swamp (Etheostoma
fusiforme) - Threatened - Fish
Darter, Spotted (Etheostoma
maculatum) - Threatened - Fish
54 NYSDEC. 2015. DEC Reminds the Public to Avoid Seasonal Caves and Mines to Protect Bat Populations. [Press Release]
http://www.dec.ny.gov/press/103720.html.
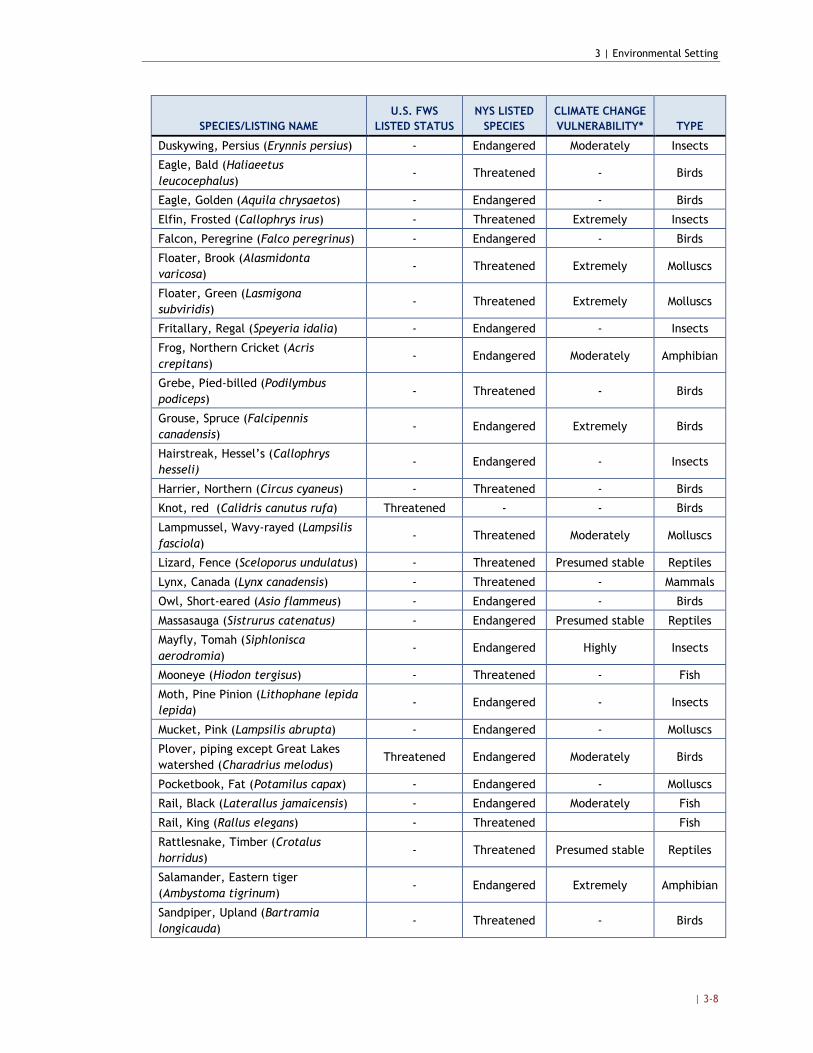
3 | Environmental Setting
| 3-8
SPECIES/LISTING NAME
U.S. FWS
LISTED STATUS
NYS LISTED
SPECIES
CLIMATE CHANGE
VULNERABILITY* TYPE
Duskywing, Persius (Erynnis persius) - Endangered Moderately Insects
Eagle, Bald (Haliaeetus
leucocephalus) - Threatened - Birds
Eagle, Golden (Aquila chrysaetos) - Endangered - Birds
Elfin, Frosted (Callophrys irus) - Threatened Extremely Insects
Falcon, Peregrine (Falco peregrinus) - Endangered - Birds
Floater, Brook (Alasmidonta
varicosa) - Threatened Extremely Molluscs
Floater, Green (Lasmigona
subviridis) - Threatened Extremely Molluscs
Fritallary, Regal (Speyeria idalia) - Endangered - Insects
Frog, Northern Cricket (Acris
crepitans) - Endangered Moderately Amphibian
Grebe, Pied-billed (Podilymbus
podiceps) - Threatened - Birds
Grouse, Spruce (Falcipennis
canadensis) - Endangered Extremely Birds
Hairstreak, Hessel’s (Callophrys
hesseli) - Endangered - Insects
Harrier, Northern (Circus cyaneus) - Threatened - Birds
Knot, red (Calidris canutus rufa) Threatened - - Birds
Lampmussel, Wavy-rayed (Lampsilis
fasciola) - Threatened Moderately Molluscs
Lizard, Fence (Sceloporus undulatus) - Threatened Presumed stable Reptiles
Lynx, Canada (Lynx canadensis) - Threatened - Mammals
Owl, Short-eared (Asio flammeus) - Endangered - Birds
Massasauga (Sistrurus catenatus) - Endangered Presumed stable Reptiles
Mayfly, Tomah (Siphlonisca
aerodromia) - Endangered Highly Insects
Mooneye (Hiodon tergisus) - Threatened - Fish
Moth, Pine Pinion (Lithophane lepida
lepida) - Endangered - Insects
Mucket, Pink (Lampsilis abrupta) - Endangered - Molluscs
Plover, piping except Great Lakes
watershed (Charadrius melodus) Threatened Endangered Moderately Birds
Pocketbook, Fat ( Potamilus capax) - Endangered - Molluscs
Rail, Black (Laterallus jamaicensis) - Endangered Moderately Fish
Rail, King (Rallus elegans) - Threatened Fish
Rattlesnake, Timber (Crotalus
horridus) - Threatened Presumed stable Reptiles
Salamander, Eastern tiger
(Ambystoma tigrinum) - Endangered Extremely Amphibian
Sandpiper, Upland (Bartramia
longicauda) - Threatened - Birds

3 | Environmental Setting
| 3-9
SPECIES/LISTING NAME
U.S. FWS
LISTED STATUS
NYS LISTED
SPECIES
CLIMATE CHANGE
VULNERABILITY* TYPE
Sculpin, Deepwater (Myoxocephalus
thompsoni) - Endangered - Fish
Sculpin, Spoonhead (Cottus ricei) - Endangered - Fish
Sea turtle, green Except where
endangered (Chelonia mydas) Threatened - - Reptiles
Sea turtle, hawksbill Entire
(Eretmochelys imbricata) Endangered Endangered - Reptiles
Sea turtle, leatherback Entire
(Dermochelys coriacea) Endangered Endangered - Reptiles
Sea turtle, loggerhead (Caretta
caretta) - Threatened - Reptiles
Sea turtle, Ridley (Lepidochelys
kempii) - Endangered - Reptiles
Shiner, Pugnose (Notropis anogenus) - Endangered Moderately Fish
Shrike, Loggerhead (Lanius
ludovicianus) - Endangered - Birds
Skipper, Grizzeled (Pyrgus
centaureae wyandot) - Endangered - Insects
Skipper, Arogos (Atrytone arogos
arogos) - Endangered - Insects
Snail, Chittenango ovate amber
Entire (Succinea chittenangoensis) Threatened Endangered Extremely Molluscs
Snake, Queen (Regina
septemvittata) - Endangered Presumed stable Reptiles
Sparrow, Henslow’s (Ammodramus
henslowii) - Threatened Presumed stable Birds
Sturgeon, Lake (Acipenser
fulvescens) - Threatened Extremely Fish
Sturgeon, Shortnose (Acipenser
brevirostrum) - Endangered Extremely Fish
Sunfish, Mud (Acantharchus pomotis) - Threatened - Fish
Sunfish, Banded (Enneacanthus
obesus) - Threatened Moderately Fish
Sunfish, Longear (Lepomis megalotis) - Threatened Presumed Stable Fish
Tern, Black (Chlidonias niger) - Endangered Presumed Stable Birds
Tern, Common (Sterna hirundo) - Threatened - Birds
Tern, Least (Sterna antillarum) - Threatened - Birds
Tern, roseate northeast U.S. nesting
pop. (Sterna dougallii dougallii) Endangered Endangered Moderately Birds
Turtle, bog (=Muhlenberg) northern
(Clemmys muhlenbergii) Threatened Endangered Extremely Reptiles
Turtle, Blandings (Emydoidea
blandingii) - Threatened Moderately Reptiles
Turtle, Mud (Kinosternon subrubrum) - Endangered Highly Reptiles

3 | Environmental Setting
| 3-10
SPECIES/LISTING NAME
U.S. FWS
LISTED STATUS
NYS LISTED
SPECIES
CLIMATE CHANGE
VULNERABILITY* TYPE
Wedgemussel, dwarf Entire
(Alasmidonta heterodon) Endangered Endangered Extremely Molluscs
Whale, Sperm (Physeter catodon) - Endangered - Mammals
Whale, Sei (Balaenoptera borealis) - Endangered - Mammals
Whale, Blue (Balaenoptera
musculus) - Endangered - Mammals
Whale, Finback (Balaenoptera
physalus) - Endangered - Mammals
Whale, Humpback (Megaptera
novaeangliae) - Endangered - Mammals
Whale, Right (Eubalaena glacialis) - Endangered - Mammals
Whitefish, Round (Prosopium
cylindraceum) - Endangered Extremely Fish
Wolf, Gray (Canis lupis) - Endangered - Mammals
Woodrat, Allegheny (Neotoma
magister) - Endangered - Mammals
Wren, Sedge (Cistothorus platensis) - Threatened - Birds
U.S. Fish and Wildlife Listed Plant Species**
SPECIES/LISTING NAME LISTED STATUS
Amaranth, seabeach (Amaranthus pumilus) Threatened
Bulrush, Northeastern (Scirpus ancistrochaetus) Endangered
Fern, American hart's-tongue (Asplenium
scolopendrium var. americanum) Threatened
Gerardia, sandplain (Agalinis acuta) Endangered
Goldenrod, Houghton's (Solidago houghtonii) Threatened
Monkshood, northern wild (Aconitum noveboracense) Threatened
Pogonia, small whorled (Isotria medeoloides) Threatened
roseroot, Leedy's (Rhodiola integrifolia ssp. leedyi) Threatened
Sources: U.S. Fish and Wildlife Service. Endangered Species of New York State, Listings and Occurrences for New
York. Accessed January 20, 2016 at:
http://ecos.fws.gov/tess_public/pub/stateListingAndOccurrenceIndividual.jsp?state=NY&s8fid=112761032792&s8fid
=112762573902.
List of Endangered, Threatened, and Special Concern Fish & Wildlife Species of New York State. Accessed April 20,
2016 at: http://www.dec.ny.gov/animals/7494.html.
*Schlesinger et al (2011) Vulnerability of at-risk species to climate change in New York. New York Natural Heritage
Program, Albany, NY.
**For the full list of New York Rare Plant Status List please consult the New York Natural Heritage Program Active
Inventory List. Accessed: April 21, 2016 at: http://www.dec.ny.gov/animals/66348.html.
3.4 OPEN SPACE
Open space may be defined as an area of land or water that either remains in its natural state, free
from intensive development for residential, commercial, industrial, or institutional use. Such
spaces provide a variety of benefits to a State’s economy, culture, environment and well-being of
its residents.
3 | Environmental Setting
| 3-11
As noted in the 2015 GEIS, New York State has one of the largest and oldest public land bases in
the country. The statewide park system administered by the New York State Office of Parks,
Recreation and Historical Preservation (NYSOPRHP) currently contains close to 215 State parks
and historic sites covering approximately 338,000 acres.55 New York State ranks first in the
nation in the number of operating facilities and total number of campsites.56 In 2014, the State
park system attracted more than 62 million visitors, up two million from visitation levels in
2012.57 Additionally, NYSDEC manages lands inside the Adirondack and Catskill Parks –
considered Forest Preserve and NYS Constitution protected Forest Preserve, and other lands
outside of those parks – including State Forests and Wildlife Management Areas. NYSDEC also
holds about 900,000 acres of conservation easements. Most are working forest easements in the
Adirondack and Tug Hill regions. Exhibit 3-8 displays the approximately six million acres of
protected lands in New York State.58
Open space can be publicly or privately-owned. Created in 1892, the Adirondack Park (the
“Park”) accounts for one-fifth of the State’s total land area making the Park one of the largest
state parks in the U.S., greater in size than Yellowstone, Everglades, Glacier, and Grand Canyon
National Parks combined, and comparable to the size of the entire state of Vermont. The
boundary of the Park encompasses a unique combination of public and private lands. Of the
approximately six million acres within the Park’s boundaries, 48 percent is constitutionally
protected to remain “forever wild” forest preserve while the remaining 52 percent consist of
private land, including a mix of settlements, farms, timber lands, businesses, homes and camps.59
To ensure responsible stewardship of Park areas, the New York State Legislature created the
Adirondack Park Agency (the “Agency”) in 1971 and charged the Agency with developing a
master land use plan for both public and private lands to assure that development occurs in
balance with the Park’s unique natural resources. In addition to the Plan, Park lands are subject
to a number of land use and natural resource regulations, for example the New York State
Freshwater Wetlands Act and the New York State Wild, Scenic and Recreational Rivers System
Act. Additional regulations provide further guidance to potential project proponents to ensure
development is undertaken in a manner that minimizes adverse impacts to sensitive natural
resources, including but not necessarily limited to Critical Environmental Areas (CEAs),60
wetlands, shorelines, rivers and trees.61
55 New York State Council of Parks, Recreation, and Historic Preservation. 2015. 2014 Annual Report. January. Accessed
January 20, 2016 at: http://nysparks.com/state-council/documents/2014StateCouncilAnnualReport.pdf/.
56 Ibid.
57 New York State Council of Parks, Recreation and Historic Preservation. 2013. 2012 Annual Report. Accessed August
20, 2014 at: http://nysparks.com/state-council/documents/2012StateCouncilAnnualReport.pdf.
58 New York Protected Areas Database (NYPAD). Accessed April 22, 2016 at: http://www.nypad.org/.
59 Adirondack Park Agency. Citizen’s Guide to Adirondack Park Agency Land Use Regulations. Accessed January 22,
2016 at: http://apa.ny.gov/Documents/Guidelines/CitizensGuide.pdf.
60 For more discussion on CEAs, see Section 3.6 of the 2015 GEIS.
61 Adirondack Park Agency. Citizen’s Guide to Adirondack Park Agency Land Use Regulations. Accessed January 22,
2016 at: http://apa.ny.gov/Documents/Guidelines/CitizensGuide.pdf.

3 | Environmental Setting
| 3-12
EXHIBIT 3-8. PROTECTED AREAS IN NEW YORK STATE
3.5 SOCIOECONOMICS
The socioeconomic setting that may be affected by the proposed action comprises several factors,
such as: patterns and trends in income and wages, employment levels, and housing requirements.
The following section updates information on the socioeconomic setting presented in the 2015
GEIS.
Income and Wage Character ist ics 62
Statewide trends in employment, income and wage remain largely as described in the 2015 GEIS.
As of December 2015, the New York State Department of Labor (NYSDOL) estimates
approximately 9.4 million employed in non-farm positions, up from 9.2 million one year prior.63
In December 2015, unemployment remained steady at 4.8 percent, the lowest level since
November 2007 and consistent with the U.S. unemployment rate at 5.0 percent. Exhibit 3-6, on
the following pages, shows unemployment rates by county from the NYSDOL for November
2015.
The annual mean wage for all occupations in New York State was $55,630 in 2014, an increase
of 1.9 percent from 2013. Counties with the highest median household income in 2013 include
62 U.S. Bureau of Labor Statistics. Occupational Employment Statistics. Last updated March 25, 2015. Accessed January
21, 2016 at: http://www.bls.gov/oes/tables.htm.
63 New York State Department of Labor. Current Employment Statistics. Preliminary. Accessed August 22, 2014 at:
http://labor.ny.gov/stats/cesemp.asp.
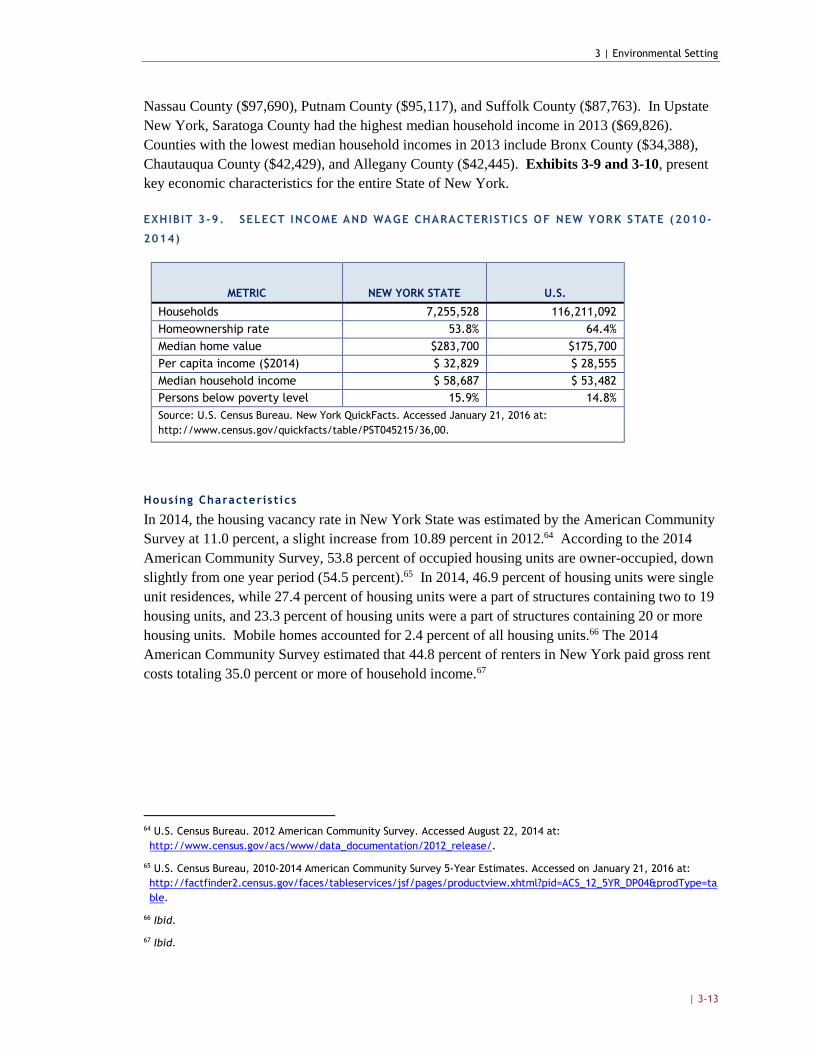
3 | Environmental Setting
| 3-13
Nassau County ($97,690), Putnam County ($95,117), and Suffolk County ($87,763). In Upstate
New York, Saratoga County had the highest median household income in 2013 ($69,826).
Counties with the lowest median household incomes in 2013 include Bronx County ($34,388),
Chautauqua County ($42,429), and Allegany County ($42,445). Exhibits 3-9 and 3-10, present
key economic characteristics for the entire State of New York.
EXHIBIT 3-9. SELECT INCOME AND WAGE CHARACTERISTICS OF NEW YORK STATE (2010-
2014)
METRIC NEW YORK STATE U.S.
Households 7,255,528 116,211,092
Homeownership rate 53.8% 64.4%
Median home value $283,700 $175,700
Per capita income ($2014) $ 32,829 $ 28,555
Median household income $ 58,687 $ 53,482
Persons below poverty level 15.9% 14.8%
Source: U.S. Census Bureau. New York QuickFacts. Accessed January 21, 2016 at:
http://www.census.gov/quickfacts/table/PST045215/36,00.
Housing Characteris t ics
In 2014, the housing vacancy rate in New York State was estimated by the American Community
Survey at 11.0 percent, a slight increase from 10.89 percent in 2012.64 According to the 2014
American Community Survey, 53.8 percent of occupied housing units are owner-occupied, down
slightly from one year period (54.5 percent).65 In 2014, 46.9 percent of housing units were single
unit residences, while 27.4 percent of housing units were a part of structures containing two to 19
housing units, and 23.3 percent of housing units were a part of structures containing 20 or more
housing units. Mobile homes accounted for 2.4 percent of all housing units.66 The 2014
American Community Survey estimated that 44.8 percent of renters in New York paid gross rent
costs totaling 35.0 percent or more of household income.67
64 U.S. Census Bureau. 2012 American Community Survey. Accessed August 22, 2014 at:
http://www.census.gov/acs/www/data_documentation/2012_release/.
65 U.S. Census Bureau, 2010-2014 American Community Survey 5-Year Estimates. Accessed on January 21, 2016 at:
http://factfinder2.census.gov/faces/tableservices/jsf/pages/productview.xhtml?pid=ACS_12_5YR_DP04&prodType=ta
ble.
66 Ibid.
67 Ibid.
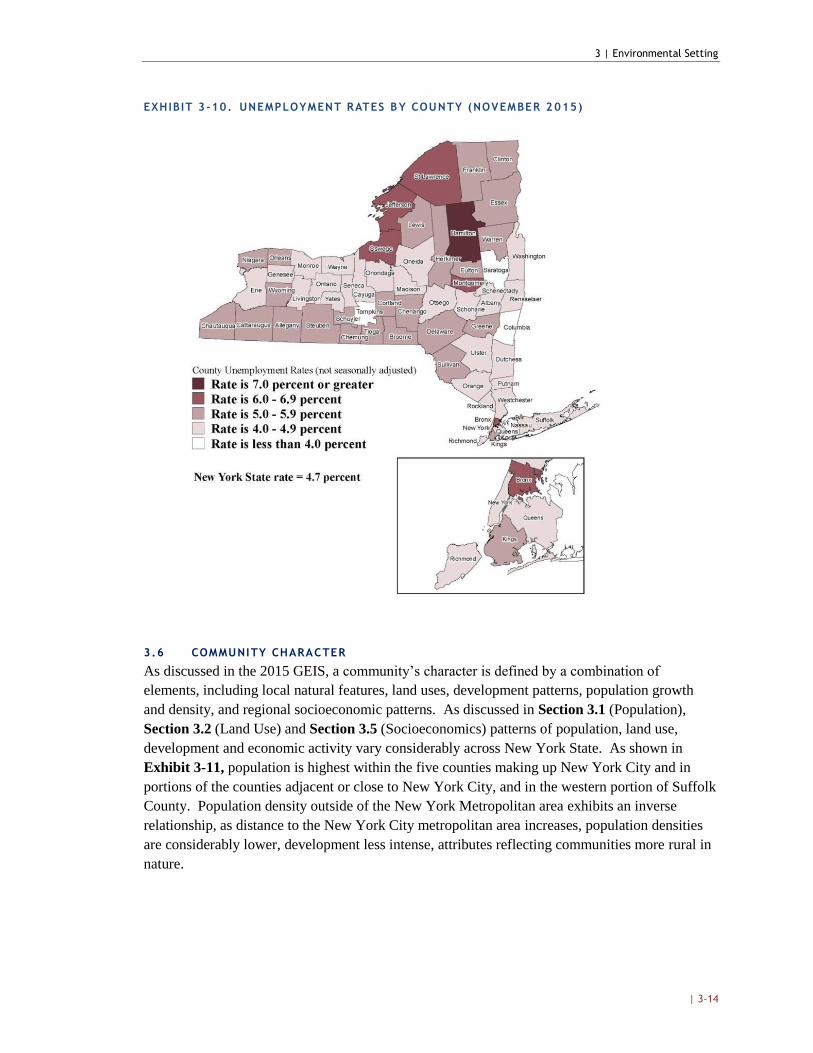
3 | Environmental Setting
| 3-14
EXHIBIT 3-10. UNEMPLOYMENT RATES BY COUNTY (NOVEMBER 2 015)
3.6 COMMUNITY CHARACTER
As discussed in the 2015 GEIS, a community’s character is defined by a combination of
elements, including local natural features, land uses, development patterns, population growth
and density, and regional socioeconomic patterns. As discussed in Section 3.1 (Population),
Section 3.2 (Land Use) and Section 3.5 (Socioeconomics) patterns of population, land use,
development and economic activity vary considerably across New York State. As shown in
Exhibit 3-11, population is highest within the five counties making up New York City and in
portions of the counties adjacent or close to New York City, and in the western portion of Suffolk
County. Population density outside of the New York Metropolitan area exhibits an inverse
relationship, as distance to the New York City metropolitan area increases, population densities
are considerably lower, development less intense, attributes reflecting communities more rural in
nature.

3 | Environmental Setting
| 3-15
EXHIBIT 3-11. NEW YORK STATE POPULATION DENSITY BY COUNTY (2010)
Community character, however, is not defined only by patterns in population and development.
Residents often describe community character in terms associated with more intangible
community quality such as visual landscape, demographics, open space, noise, air quality, or
traffic patterns. The 2015 GEIS provides a greater discussion on such intangible community
characteristics and how such characteristics, along with patterns in population and development,
shape a community’s character over time, often times working in both positive and negative
ways, concurrently attracting and deterring residents, businesses, or visitors.

4 | Alternatives Considered
| 4-1
CHAPTER 4 | ALTERNATIVES CONSIDERED
A full understanding of the potential environmental impacts of the CES requires consideration of
reasonable alternatives to the proposed action. This chapter characterizes two relevant alternative
scenarios that contribute to the SEIS analysis:
Section 4.1 describes the baseline or “no action” scenario and alternative scenarios for
renewable supply, along with related modeling results; and
Section 4.2 describes the “no action” scenario for nuclear power, along with related
analytic results.
These results frame the discussion of broader environmental and socioeconomic impacts in
subsequent chapters.
4.1 BASELINE AND ALTERNATIVES DEFINITION: RENEWABLE SUPPLY
Defining a baseline or “no action” condition is necessary to provide a common point of reference
for understanding the impacts of the action and any alternatives. This baseline should represent
the most likely state of resources, activities, markets, and behaviors that would exist absent any
efforts to achieve or accomplish the goals of the CES.
In the case of renewable supply, the proposed CES converts the 2015 SEP targets to mandated
requirements that will ensure their achievement. It is uncertain the extent to which the SEP
targets would be achieved absent this mandate. It is likely that State agencies, including the
Commission, would take other actions aimed at reaching the 50 by 30 goal and that the State
would make progress in that direction over time. However, it is also likely that in the “no action”
scenario, progress would be slower than the CES would allow, and that the State would not
achieve the carbon and greenhouse gas reductions targeted in the SEP. With slower growth in the
renewable generation portfolio, some impacts to the environment may be delayed or avoided. At
the same time, fossil fueled generation would continue to dominate the State’s supply, and
emissions of carbon and other pollutants would not decline as much or as fast as they would with
implementation of the proposed CES.
With the proposed CES, alternative outcomes are also possible. Because the CES complements
other State energy policies and programs, such as REV and the CEF, its impacts on the
environment will depend to some extent on how well the objectives of those programs are
achieved. In particular, efforts under REV to reduce demand could directly affect the targets set
for the CES. A stand-alone analysis of the impacts of the CES would not show the interplay of
these programs and might over or understate the quantity of new renewable generation that may
be needed.
To frame the analysis, the SEIS utilizes a large-scale renewable (LSR) supply curve model. The
supply curve model develops a least-cost plan of annual incremental renewable capacity additions
4 | Alternatives Considered
| 4-2
needed to meet the target, based on a projection of demand growth, market data, cost estimates,
and other factors. The model considers several types of renewable resources individually,
including multiple size categories of land-based wind; utility-scale solar; upgraded hydroelectric
facilities; retrofitting non-powered dams; off-shore wind; anaerobic digestion and additional
biomass-source generation.
Outputs of the model are in shown in Exhibit 4-1 by comparing three “base case” scenarios, as
follows:
PPA: Reflecting 100 percent adoption through long-term fixed-price power purchase
agreement (PPA) procurement arrangements;
Fixed REC: 100 percent long-term fixed-REC procurements; and
Blend: a mix of 50 percent PPA projects and 50 percent fixed REC projects.
The PPA approach assumes that renewable energy project developers will be able to sign up to
long-term contracts offering a fixed level of total compensation per MWh generated, thus
shielding generators in particular from commodity price risk. The fixed REC base case reflects
the approach whereby generators receive a fixed top-up premium payment above energy and
capacity revenue, in which case they would be exposed to commodity price fluctuations. These
approaches are presented as “book end” benchmarks. The “Blend” scenario illustrates an
outcome where resource procurement applies a mix of these contracting approaches.
The base case uses the demand forecast developed in connection with the Staff White Paper.68
That forecast includes adjustments for both increased loads related to new electrification (e.g.,
electric vehicles, heat pumps) and other adjustments reflecting expected energy efficiency gains
and peak load reductions.69 Using the adjusted forecast, the base case model shows a need for
approximately 34,000 GWh of new renewable energy supply in 2030. The model further
suggests that approximately 5,000 GWh of that new supply will be met with “behind-the-meter”
generation (such as customer-sited solar PV). With this assumption, and subtracting forecast
installations in 2015 and 2016, the base case yields a total LSR increment of approximately
29,000 GWh needed to meet the 50 by 30 goal.
The alternative, or high renewable, case illustrates the possibility that a larger amount of LSR
may be needed if future demand grows more than the Staff White Paper load forecast anticipates.
The demand projection used for the high renewable case uses the energy efficiency forecast in the
NYISO 2015 Gold book (extrapolated to 2030) in place of the energy efficiency forecast in the
Staff White Paper. A higher load forecast means a higher renewable energy supply goal. Using
this alternative demand projection, the high renewable case suggests that meeting the 50 by 30
target will require approximately 40,000 GWh of incremental LSR.
For purposes of evaluating potentially adverse environmental impacts, this SEIS assumes that the
incremental need in both the base cases and the high renewable cases is met with LSR resources.
This approach is recommended because, (1) the 2015 GEIS already addresses the potential
impacts of distributed renewable resources, and (2) the environmental impacts of LSR projects
68 NYS DPS. 2016. Staff White Paper on Clean Energy Standard. CASE 15-E-0302. January 25.
69 NYS DPS. 2016. Staff White Paper on Clean Energy Standard. Appendix B. CASE 15-E-0302. January 25.

4 | Alternatives Considered
| 4-3
are more likely to be significant. Thus, if the actual proportion of LSR to distributed renewable
resources turns out to be smaller than this SEIS estimates, the consequence is likely to be a
reduction in overall impacts.
Results
Exhibit 4-1 summarizes the some relevant outcomes of the base case and high load case
modeling. As shown in the exhibit, the results indicate that land-based wind could be largest
contributor to the incremental renewable generation, accounting for approximately 50 percent of
the incremental supply. Utility-scale solar is the next largest contributor, at approximately 15 to
20 percent of total generation. Different procurement methods are expected to influence the mix
of LSR and behind-the-meter renewable generation that is ultimately installed; this impact
assessment considers the conservative scenario where the incremental need is met primarily by
LSR.
The 2015 GEIS also presents estimates of the emissions impacts likely to result from the
implementation of certain initiatives related to the REV. Exhibit 4-2 below presents estimated
emissions reductions for the renewable supply alternatives identified in Exhibit 4-1.70 To
facilitate comparisons, these estimates use the same emission factors that were used to develop
the emissions estimates in the 2015 GEIS.
70 It is important to note that Exhibit 4-2 makes the simplifying assumption that Biomass/ADG generation do not
contribute to NOx and SOx emissions reductions due to the uncertainty in the type of biomass energy that may be
installed. As such, to the extent that biomass implemented under CES results in NOx or SOx emission reductions, the
impacts in Exhibit 4-2 may be understated. In addition, the CO2 emission reductions may be overstated due to the
assumption that biomass energy implemented as a result of CES will be carbon neutral.
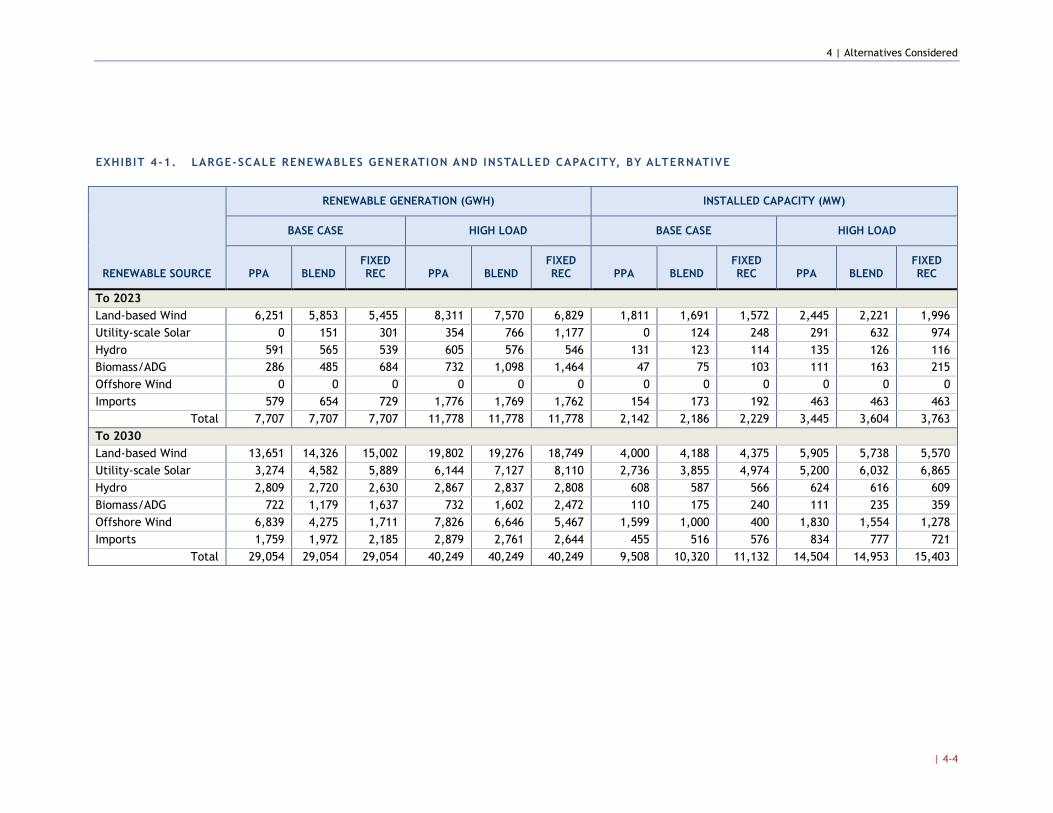
4 | Alternatives Considered
| 4-4
EXHIBIT 4-1. LARGE-SCALE RENEWABLES GENERATION AND INSTALLED CAPACITY, BY ALTERNATIVE
RENEWABLE SOURCE
RENEWABLE GENERATION (GWH) INSTALLED CAPACITY (MW)
BASE CASE HIGH LOAD BASE CASE HIGH LOAD
PPA BLEND FIXED REC PPA BLEND
FIXED REC PPA BLEND
FIXED REC PPA BLEND
FIXED REC
To 2023
Land-based Wind 6,251 5,853 5,455 8,311 7,570 6,829 1,811 1,691 1,572 2,445 2,221 1,996
Utility-scale Solar 0 151 301 354 766 1,177 0 124 248 291 632 974
Hydro 591 565 539 605 576 546 131 123 114 135 126 116
Biomass/ADG 286 485 684 732 1,098 1,464 47 75 103 111 163 215
Offshore Wind 0 0 0 0 0 0 0 0 0 0 0 0
Imports 579 654 729 1,776 1,769 1,762 154 173 192 463 463 463
Total 7,707 7,707 7,707 11,778 11,778 11,778 2,142 2,186 2,229 3,445 3,604 3,763
To 2030
Land-based Wind 13,651 14,326 15,002 19,802 19,276 18,749 4,000 4,188 4,375 5,905 5,738 5,570
Utility-scale Solar 3,274 4,582 5,889 6,144 7,127 8,110 2,736 3,855 4,974 5,200 6,032 6,865
Hydro 2,809 2,720 2,630 2,867 2,837 2,808 608 587 566 624 616 609
Biomass/ADG 722 1,179 1,637 732 1,602 2,472 110 175 240 111 235 359
Offshore Wind 6,839 4,275 1,711 7,826 6,646 5,467 1,599 1,000 400 1,830 1,554 1,278
Imports 1,759 1,972 2,185 2,879 2,761 2,644 455 516 576 834 777 721
Total 29,054 29,054 29,054 40,249 40,249 40,249 9,508 10,320 11,132 14,504 14,953 15,403

4 | Alternatives Considered
| 4-5
EXHIBIT 4-2. EMISSIONS REDUCTIONS, BY ALTERNATIVE
ALTERNATIVE NITROGEN OXIDES(A)
(1,000 TONS)
SULFUR DIOXIDE(A)
(1,000 TONS)
CARBON DIOXIDE(B)
(1,000 TONS)
Base Case (PPA & Fixed REC) 9.8 11.6 8,239
High Case (PPA & Fixed REC) 13.5 16.1 11,414
Notes: (A) Biomass/ADG generation (representing less than 10% of total renewable generation) is excluded from NOx and SOx
emissions reductions estimates, due to large variability in these emissions depending on fuel-type, combustion
technology, emissions controls, and operating characteristics. (B) Biomass/ADG generation is assumed to be carbon neutral, for purposes of this calculation. However, actual carbon
emissions or sequestration from biomass under CES will depend on a variety of factors such as feedstock type,
management and procurement of the feedstock, and the timeframe to replenish the feedstock.
4.2 NUCLEAR POWER NO ACTION ALTERNATIVE
Combined, the James A. Fitzpatrick and R.E. Ginna nuclear facilities provide approximately
10,500 GWh of annual energy generation, and 1,400 MW of generating capacity. The plants
have announced plans to close in approximately April 2017, after providing only a quarter of their
annual electrical generation for that year. Under a “no action” scenario, where these
economically stressed facilities retired, discontinuing operations would require that an
approximate annual 10,500 GWh of electricity generation be met through alternative sources,
possibly including fossil fuels. Exhibit 4-3 provides an illustration of anticipated GWh energy
loss from James A. FitzPatrick and R.E. Ginna nuclear facilities in the no action alternative
scenario.71
EXHIBIT 4-3. ESTIMATED GWH ELECTRICITY GENERATION LOSS IN THE NO ACTIO N
SCENARIO
Under the CES initiative, this lost generation may be recovered. Chapter 5 describes the general
impacts that arise during normal operations and fueling of nuclear facilities and that would
continue under the proposed maintenance program.
71 Similarly, the closure of other nuclear facilities prior to their license expiration would impact the State’s overall
energy supply portfolio.
SITE NAME
SUMMER
CAPACITY
2014 NET
GENERATION
(GWH)
POTENTIAL
CLOSURE
DATE
LICENSE
EXPIRATION
GWH TOTAL
GENERATION
LOSS*
AVOIDED CO2
EMISSIONS (MILLION
SHORT TONS)**
James A.
FitzPatrick 855 5,829 April 2017 October 2034 80,149
36
R. E.
Ginna 581 4,662 April 2017 September 2029 58,275
26
Total 1,436 10,491 – – 138,424 62
* Calculated based on CES timeframe to end of 2030.
** Calculated assuming typical gas plant replacement of energy at 450 short tons of CO2 per GWh.
5 | Environmental Impacts of Proposed Action
| 5-1
CHAPTER 5 | ENVIRONMENTAL IMPACTS OF PROPOSED ACTION
SEQRA requires State and local agencies to assess the potential of their actions to affect the use,
appearance, or condition of the environment. This chapter evaluates the impacts that could arise
from the implementation of the proposed CES. All energy generation has impacts to the
environment; however renewable energy tends to involve lower risks and impacts. 72
As previously discussed, the REV and CEF are intended to transform the ways in which the State
generates, distributes and manages energy and, in so doing, increase system resiliency, reduce
harmful environmental pollution, and lower the overall costs of power across all sectors of the
economy. In the modern electric system envisioned under the REV, clean energy at the bulk
level will be integrated with distributed generation and dynamic load management at the
customer level. By establishing a mandate and interim targets for renewable generation, the CES
will further support and promote the REV’s basic principle of a customer-oriented market that
encourages innovative, market-based solutions that reduce costs while meeting critical
environmental needs.
To identify and analyze the impacts of the proposed CES in the context of REV and the CEF, this
chapter incorporates by reference the analysis of environmental impacts presented in Chapter 5 of
the 2015 GEIS and then updates and expands the information provided therein by more fully
describing the potential environmental impacts associated with LSR generation and with the
proposed nuclear maintenance tier.
5.1 FRAMEWORK FOR EVALUATING THE ENVIRONMENTAL IMPACTS OF THE CES
As presented in Chapter 4, this SEIS considers two scenarios for LSR generation designed to
meet the overarching target of the CES of 50 percent renewable energy generation by 2030: (1) a
base case, assuming approximately 29,000 GWh of incremental LSR; and (2) an alternative, or
high, case, assuming installation of approximately 40,000 GWh of incremental LSR. In addition,
this chapter considers the potential environmental impacts of the proposed CES nuclear tier.
Appendix C to the Staff White Paper identifies a list of the technology and fuel stocks that will
likely be eligible under the CES, a list that largely mirrors the current RPS Main Tier program.
While the proposed CES establishes an overall target for meeting the mandate, the CES, like the
REV and CEF initiatives, does not prescribe one pathway; that is, the CES does not contemplate
establishing technology-specific carve-outs or targets other than the overall 50 percent mandate.
Finally, the exact location of potential new LSR projects is uncertain. For this reason, the
evaluation of environmental impacts in this chapter is largely qualitative. That is, a quantitative
assessment of the potential environmental impacts would require site-specific information
72 NYSERDA 2009. Comparison of Reported Effect on and Risks to Vertebrate Wildlife from Six Electricity Generation
Types in the New York/New England Region. NYSERDA Report 09-02.

5 | Environmental Impacts of Proposed Action
| 5-2
concerning those clean energy resources and technologies that will be implemented in response to
the CES.
The qualitative assessment presented in this chapter utilizes a broad definition of environmental
impacts (impacts and effects are synonymous in this context), including the full array of resource
areas described in Chapter 3. The SEIS describes two types of effects: direct and near term
impacts and possible longer-term impacts.
Chapter Organization
The remainder of this chapter is organized in five parts:
Section 5.2 summarizes our analysis of the potential direct and near term environmental
impacts of the seven large-scale clean energy resources likely to be affected by the CES;
Section 5.3 summarizes our analysis of the potential longer-term environmental impacts;
Section 5.4 considers the potential for the CES programs to spur development of new
technologies, yet unknown; and
Section 5.5 considers the potential cumulative impacts of the CES when added to other
past, present, and reasonably foreseeable future actions.
Measures to mitigate the environmental impacts identified in this chapter are presented in
Chapters 6 through 8. The economic and social impacts of the proposed CES are discussed in
Chapter 9.
5.2 DIRECT AND NEAR TERM EFFECTS
This section identifies the direct environmental effects of the CES. Specifically, this section
focuses on the environmental effects of seven resource categories described in Chapter 4,
including: (1) nuclear energy, (2) solar energy, (3) land-based wind energy, (4) offshore wind
energy, (5) hydropower, (6) anaerobic digestion and (7) biomass energy.73 For each resource
considered in this section, direct environmental impacts are considered on an individual basis.
Examination of the potential long-term impacts of the CES – impacts which occur later in time or
further away, such as displacement of fossil fuel generation – are considered in the subsequent
Section 5.3.
5.2.1 NUCLEAR ENERGY
Across the United States, 62 nuclear power plants are currently operating (Exhibit 5-1). Thirty-
five of these plants have two or more reactors. 74 Five facilities in Illinois provide just over 11.5
GW of capacity, the most of any state followed by Pennsylvania, South Carolina, and New York
(Exhibit 5-2).
EXHIBIT 5-1. ACTIVE NUCLEAR SITES IN THE UNITED STATES AND NUCLEAR CAPACITY
73 As discussed in Chapter 4, a longer list of LSR resources was considered as possible generating options under the CES,
including several forms of biomass, co-firing, IGCC, and several size categories of CHP.
74 U.S. EIA. 2015. Despite recent closures, U.S. nuclear capacity is scheduled to increase by 2020. Accessed January 22,
2016 at: http://www.eia.gov/todayinenergy/detail.cfm?id=23592#.

5 | Environmental Impacts of Proposed Action
| 5-3
EXHIBIT 5-2. NUCLEAR CAPACITY FOR TOP TEN U.S. STATES, 2015, GIGAWATTS 75
75 U.S. EIA. 2015. Despite recent closures, U.S. nuclear capacity is scheduled to increase by 2020. Accessed January 22,
2016 at: http://www.eia.gov/todayinenergy/detail.cfm?id=23592#.
5 | Environmental Impacts of Proposed Action
| 5-4
As discussed in Chapter 2, nuclear facilities contributed approximately 14 percent of New
York’s capacity and produced 30 percent of the State’s electricity energy generation in 2014.76
Three nuclear plants in Upstate New York, James A. Fitzpatrick, Nine Mile Point Nuclear
Station, and R. E. Ginna Nuclear Power Plant, account for over 3,300 MW of capacity and nearly
26,000 GWh of annual electricity generation (see Exhibits 5-3 and 5-4).77 The James A.
Fitzpatrick and the Nine Mile Point Nuclear power plants are both boiling water reactors (BWR),
and the Indian Point and R.E. Ginna power plants are pressurized light water reactors (PWR).
BWRs contain only two heat transfer loops because the system generates steam directly in the
reactor vessel. A primary loop moves the reactor vessel steam to drive the turbines which
generate electricity. For PWRs, water is first heated to high temperatures under pressure inside
the reactor before being pumped through a primary circulation loop to the steam generator.
Water in a secondary circulation loop is converted to steam in the generator to drive the turbines
and produce electricity. In either system, steam leaving the turbines is cooled through a
condenser or cooling water system, and cooling water is pumped to cooling towers or discharged
directly to a water body.
The growth in natural gas availability has led to lower prices in the wholesale electricity market,
pricing out some nuclear operators that face increasing costs.78 The proposed CES Tier 3 would
establish a support mechanism to sustain the operations of economically distressed upstate
nuclear facilities for a significant time, potentially up to their license expiration date. Two New
York nuclear units face NRC license expiration before 2030: Nine Mile Point Unit 1 and R.E.
Ginna Unit 1, in August and September of 2029, respectively. The James A. Fitzpatrick nuclear
Unit 1 license expires October of 2034, and the license for Unit 2 of the Nine Mile Point Nuclear
Station expires in October of 2046.
76 NYISO. 2015. Power Trends 2015: Rightsizing the Grid. Accessed January 14, 2016 at:
http://www.nyiso.com/public/webdocs/media_room/press_releases/2015/Child_PowerTrends_2015/ptrends2015_FI
NAL.pdf.
77 NYSIO. 2015. 2015 NYCA Generating Facilities. Accessed January 16, 2016 at:
http://www.nyiso.com/public/index.jsp
78 Office of Nuclear Reactor Regulation. 2013. Generic Environmental Impact Statement for License Renewal of Nuclear
Plants: Main Report, Final Report, NUREG-1437, Volume 1, Revision 1.

5 | Environmental Impacts of Proposed Action
| 5-5
EXHIBIT 5 -3. ACTIVE NUCLEAR SITES IN NEW YORK STATE
79 PRNewswire. 2015. Entergy to Close James A. FitzPatrick Nuclear Power Plant in Central New York. Accessed January 22, 2016 at: http://www.prnewswire.com/news-
releases/entergy-to-close-james-a-fitzpatrick-nuclear-power-plant-in-central-new-york-300170100.html
80 Case 14-E-0270, Petition Requesting Initiation of a Proceeding to Examine a Proposal for Continued Operation of the R.E. Ginna Nuclear Power Plant, LLC., Petition Requesting
Initiation of a Proceeding to Examine a Proposal for Continued Operation (filed July 11, 2014).
SITE NAME
ACTIVE
REACTORS
SUMMER
CAPACITY
(MW)
2014 NET
ENERGY
(GWH)
SHARE OF
STATE
NUCLEAR
ENERGY
GENERATION OWNER LOCATION
DATE OF NRC LICENSE
EXPIRING POTENTIAL CLOSURE
Indian Point Unit 2, Unit 3
2,063 17,310 40.2%
Entergy Nuclear Indian Point
Westchester County
9/28/2013 (Unit 2)
12/12/2015 (Unit 3)
License renewal process ongoing.
James A. Fitzpatrick
Unit 1 855 5,829 13.5%
Entergy Nuclear Fitzpatrick LLC
Oswego County
10/17/2034 (Unit 1) Announced intent to retire in 2017 due to power price declines79
Nine Mile Point
Unit 1, Unit 2
1,773 15,239 35.5%
Nine Mile Point Nuclear Station LLC
Oswego County
08/22/2029 (Unit 1)
10/31/2046 (Unit 2)
R. E. Ginna Unit 1 581 4,662 10.8%
R.E. Ginna Nuclear Power Plant, LLC
Wayne County
09/18/2029 (Unit 1) Announced intent to retire in 2017 due to power price declines80
Total 5,272 43.040 100.0%
Sources: U.S. Nuclear Regulatory Commission. List of Power Reactor Units Accessed January 12, 2016 at http://www.nrc.gov/reactors/operating/list-power-reactor-units.html.
Accessed January 12, 2016; NYSIO. 2015. 2015 NYCA Generating Facilities. Accessed January 16, 2016 at: http://www.nyiso.com/public/index.jsp; U.S. EIA. State Nuclear
Profiles. Accessed December 24, 2015 at: http://www.eia.gov/nuclear/state/newyork/

5 | Environmental Impacts of Proposed Action
| 5-6
EXHIBIT 5-4. ACTIVE NUCLEAR SITES IN NEW YORK STATE
Environmental Impact Overview
The proposed CES Tier 3 would establish a support mechanism to sustain the operations of
economically distressed nuclear facilities; thus, if the action is implemented, the upstate nuclear
plants that have announced closure would continue to operate. This section describes the general
impacts that arise during normal operations of nuclear facilities and that would likely continue
under the proposed maintenance program.
Impacts arise due to a number of facility components including: once-through cooling systems,
cooling towers, cooling ponds, and transmission lines.81 These impacts have been most recently
described and evaluated by the NRC in the course of its relicensing proceedings. They are
discussed in the Generic Environmental Impact Statement for License Renewal of Nuclear Plants:
Main Report, Final Report (which covers all nuclear facilities in New York, as well as the entire
U.S.) and the supplemental EIS’ specific to individual nuclear facilities that would continue
81 Office of Nuclear Reactor Regulation. 2013. Generic Environmental Impact Statement for License Renewal of Nuclear
Plants: Main Report, Final Report, NUREG-1437, Volume 1, Revision 1.

5 | Environmental Impacts of Proposed Action
| 5-7
operations through the re-licensing expiration date. The results from the GEIS for License
Renewal of Nuclear Plants are summarized in Exhibit 5-5.82
EXHIBIT 5-5. SUMMARY OF IMPACTS O F NUCLEAR FACILITY OPERATION 83, 84
AFFECTED
ENVIRONMENT CONCLUSIONS
Threatened and
Endangered
Species
Requires site- and project-specific information.
Surface Water
Quality,
Hydrology, and
Use
Regardless of cooling system type effects on water intake and discharge structures,
salinity gradients, temperature effects on sediment transport, altered thermal
stratification of lakes, scouring from discharged cooling water, eutrophication,
discharge of biocides, discharge of chemical contaminants (e.g., metals), and
discharge of sanitary waste were found to be small. No mitigation measures are
warranted to due to small environmental benefits and high cost.
Small potential for water use conflicts or riparian plan and animal community
impacts for plants with open-cycle cooling systems. No mitigation measures are
warranted due to small potential environmental benefits and high cost.
Moderate potential water use conflicts and effects of consumptive water on in-
stream aquatic and riparian terrestrial communities that employ cooling-tower or
cooling-pond systems because they are often located near smaller water bodies.
Aquatic Ecology
Small impacts at all types of plants to:
o entrainment of phytoplankton and zooplankton;
o cold shock;
o thermal plume barriers to migrating fish;
o premature emergence of aquatic insects;
o stimulation of nuisance organisms;
o losses from predation, parasitism, and disease among organisms exposed to
sublethal stresses;
o gas supersaturation;
o low dissolved oxygen in the discharge; and
o accumulation of contaminants in sediments or biota
No mitigation measures are warranted due to small environmental benefits and
high cost.
Small impacts at cooling-tower cooling system plants to:
82 For a full assessment of operational impacts of nuclear facilities relevant to this EIS please see: Generic Environmental
Impacts Statement for License Renewal of Nuclear Plants: Main Report (NUREG-1437, Volume 1), and the relevant
supplemental EIS for the New York facilities: Supplement 31 Regarding James A. FitzPatrick Nuclear Power Plant,
Supplement 24 Regarding Nine Mile Point Nuclear Station, Units 1 and 2, Supplement 14 Regarding R.E. Ginna Nuclear
Power Plant, and Supplement 38 Regarding Indian Point Nuclear Generating Unit Nos. 2 and 3.
83 Office of Nuclear Reactor Regulation. 2013. Generic Environmental Impact Statement for License Renewal of Nuclear
Plants: Main Report, Final Report, NUREG-1437, Volume 1, Revision 1.
84 The GEIS for License Renewal of Nuclear Plants the NRC established three levels of significance for potential impacts:
small, moderate, and large. “Small impact: Environmental effects are not detectable or are so minor that they will
neither destabilize nor noticeably alter any important attribute of the resource. For the purposes of assessing
radiological impacts, the Commission has concluded that those impacts that do not exceed permissible levels in the
Commission’s regulations are considered small. Moderate impact: Environmental effects are sufficient to alter
noticeably, but not to destabilize, important attributes of the resource. Large impact: Environmental effects are
clearly noticeable and are sufficient to destabilize important attributes of the resource” (p S-6).

5 | Environmental Impacts of Proposed Action
| 5-8
AFFECTED
ENVIRONMENT CONCLUSIONS
o entrainment of fish and shellfish;
o impingement of fish and shellfish; and
o thermal discharge effects).
Potential greater significance at plans employing open-cycle or cooling-pond
systems.
Groundwater Use
and Quality
Small impacts on ground water use from plants with groundwater use of less than
100 gal/min. Moderate or large impacts on groundwater with plants that extract
more than 100 gal/min.
Cooling system makeup water consumption may cause groundwater use conflicts,
but the significance of such impacts is site specific.
Small potential impacts to groundwater quality due to ground water withdrawals.
No mitigation measures are warranted
Potential small, moderate, or large impacts to groundwater quality due to cooling
ponds in areas not located in salt marshes. Small potential groundwater quality
impacts of ponds located in salt marshes.
Air Quality
Air quality impacts associated with operational transmission lines are small. No
mitigation measures are warranted due to small environmental benefits and high
cost.
Terrestrial
Ecology
Small potential impact of cooling tower drift on crops and ornamental vegetation.
No mitigation measures are warranted because there have been no measurable
effects on crops or ornamental vegetation.
Impacts of cooling tower drift on native plants are expected to be small. No
mitigation measures are warranted due to small environmental benefits and high
cost.
Small impact on bird mortality from collision with power lines and cooling towers
and will remain a small fraction of total collision mortality with all man-made
objects. No additional mitigation measures are warranted.
Small potential impacts to wildlife due since there is no threat to the stability of
local wildlife populations or vegetation communities for any cooling pond.
Potential mitigation measures would include excluding wildlife from
contaminated ponds, converting to a dry cooling system, or reducing plant output
during fogging or icing conditions. No additional mitigation measures are
warranted. Effects of cooling ponds are small and localized; cumulative impacts
are not a concern.
Long-term effects of painting power-line ROWs are small but cause fluctuations in
wildlife populations. Small impacts to floodplains and wetlands due to
transmission line maintenance and repair. No additional mitigation measures are
warranted due to small environmental benefits and high cost.
Potential impacts of EMF on terrestrial resources during the license renewal term
is small for all plants. No additional mitigation measures are warranted due to the
potential to create additional environmental impacts and high cost.
Land Use
Small impacts to land use due to necessary land use restrictions within
transmission-line ROWs. No additional mitigation measures are warranted due to
the small environmental benefits and high cost.
Human Health
Small risk at all plans associated with occupational radiation exposures. The
radiation dose commitment to the total worker population is projected to
increase less than 5 percent at nuclear power plants under the typical scenario
and less than 8 percent at any plant under the conservative scenario. No
additional mitigation measures are warranted because existing mitigation
measures (ALARA process) are effective in reducing radiation doses.

5 | Environmental Impacts of Proposed Action
| 5-9
AFFECTED
ENVIRONMENT CONCLUSIONS
Public exposure to radiation is small at all sites, estimated annual cancer risk to
the individual is less than 1 x 10⁻⁶. No additional mitigation measures are
warranted because current mitigation practices are effective at reducing public
radiation doses.
Potential for electric shock from transmission line charges must be evaluated at a
site-specific level.
Inconclusive scientific evidence on the impact of 60-Hz electromagnetic field on
human health, impacts cannot be categorized and are addressed in license
renewal applicants if conclusive scientific evidence emerges.
Small adverse occupation health effects associated with microorganisms at all
sites. No additional mitigation measures are warranted due to effectiveness of
current industrial hygiene procedures.
Magnitude of public health impacts associated with thermal enhancement of N.
fowleri are site specific.
Noise
Principal noise sources at power plants do not considerably change during
continued operations. Noise impacts have been found to be small and generally
not noticed by the public therefore they are small at all sites. No additional
mitigation measures are warranted due to small impacts and high cost.
Socioeconomics
Small impacts to education, public safety, social services, recreation and tourism,
housing, transportation, public utilities (especially water supply), and aesthetics.
No additional mitigation measures are warranted due to small benefit, and high
cost.
Impacts to threatened and endangered species from continued operations are possible, but these
impacts would not be more than the impacts already presented in an individual site’s supplemental
EIS. For example, the SEIS for the James A. Fitzpatrick nuclear facility identified five federally or
State-listed species in the vicinity of plant operations: the Indiana bat, bog turtle, Eastern
massasauga (Sistrurus catenatus catenatus), bald eagle (Haliaeetus leucocephalus), and piping
plover (Charadrius melodus).85 Required consultations with U.S. FWS concluded that no further
coordination pursuant to the ESA was required for the bald eagle, Eastern massasauga, or piping
plover and that activities associated with plant operations were not likely to adversely affect the
Indiana bat or bog turtle. However additional consultations with FWS were required to determine
if maintenance activities would adversely affect the presence of bog turtle suitable habitat along
transmission lines.86 A 2008 correspondence between Entergy and FWS indicates that the New
York Power Authority (NYPA) regularly schedules vegetation surveys to identify wetland areas as
part of its System Right-of-Way Management Plan, and these surveys should fulfill the needs of
the FWS to evaluate potential effects to bog turtle.87 The SEIS for the R.E. Ginna nuclear facility
85 These four species were listed at the time of re-licensing in 2008.
86 U.S. NRC. 2008 Generic Environmental Impact Statement for License Renewal of Nuclear Plants: Supplement 31
Regarding James A. FitzPatrick Nuclear Power Plant, Final Report. NUREG-1437 Supplement 31. January.
87 U.S. NRC. 2008. Biological Assessment for James A. FitzPatrick Nuclear Power Plant License Renewal Application
Review. Letter Dated April 28, 2008 to U.S. Fish and Wildlife Service, New York Field Office. Accessed January 26, 2016
at: http://pbadupws.nrc.gov/docs/ML0807/ML080780070.pdf.
5 | Environmental Impacts of Proposed Action
| 5-10
concludes that continued operation of the plant and maintenance of the transmission lines and
right-of-way are not likely to have an effect on any federal or State-listed species, since no species
on these lists are likely to occur in the site vicinity.88
Impacts to surface water quality, hydrology, and use would be small for a continued operations
scenario. As concluded in the GEIS and site-specific SEIS’s for the New York nuclear facilities,
continued operations would have small effects on water intake and discharge structures, salinity
gradients, temperature effects on sediment transport, altered thermal stratification of lakes,
scouring from discharged cooling water, eutrophication, discharge of biocides, discharge of
chemical contaminants (e.g., metals), and discharge of sanitary waste.
Continued operations would also have small potential impacts to aquatic ecology. For example,
entrainment sampling was conducted for the Ginna nuclear facility intake waters as part of the
NYSDEC State Pollutant Discharge Elimination System (SPDES) Permit. Over a six-year study,
an estimated annual average of 89 million fish eggs (predominantly alewives, (Alosa
pseudoharengus), smelt (Osmerus mordax), and darters (Etheostoma spp.)), and 17 million fish
larvae were entrained (predominantly alewives). These species are typical of the nearshore fish
community in the southern shoreline of Lake Ontario. As part of the SPDES permit, NYSDEC
determined that further mitigation efforts are not warranted. Evaluation of entrainment of the
ichthyoplankton community also occurs regularly through the SPDES permitting process (permits
are renewed every five years). Impingement of fish and shellfish is annually monitored at the
Ginna facility since 1973 (also as part of the SPDES permit). Based on these annual data
collections, Ginna operations have impinged an estimated 0.001 percent of the alewife population
and 0.0009 percent of the smelt population in Lake Ontario between 1983 and 2001. These losses
are considered negligible. Heat shock to fish and shellfish from thermal discharges of once-
through cooling systems into Lake Ontario has also been investigated and is required as part of the
SPDES permit. The Ginna facility currently employs mitigation efforts which serve to limit
impacts.89 Additional detail relevant to each of the New York State nuclear facilities can be found
in the respective SEIS’s.
Groundwater use and quality impacts would be negligible since all NYS nuclear plants rely on
either large lakes or rivers for the cooling intake waters.90 NRC regulations require nuclear power
plants to monitor and identify unintended releases of radioactive substances, (e.g., tritium, a mildly
radioactive type of hydrogen) into the environment and groundwater. Based on a review of these
incidents, NRC ensures nuclear plant operators take appropriate action. To-date no cases of
groundwater contamination have exceeded the NRC’s dose limits.91 Adverse air quality impacts
associated with operational transmission lines would also be small. Continued operations would
have small impacts to terrestrial ecology, land use, and human health. Principal noise sources at
88 U.S. NRC. 2004 Generic Environmental Impact Statement for License Renewal of Nuclear Plants: Supplement 14
Regarding R.E. Ginna Nuclear Power Plant, Final Report. January.
89 U.S. NRC. 2004 Generic Environmental Impact Statement for License Renewal of Nuclear Plants: Supplement 14
Regarding R.E. Ginna Nuclear Power Plant, Final Report. January.
90 U.S. EIA. New York Nuclear Profile. 2010. Accessed January 22, 2016 at http://www.eia.gov/nuclear/state/newyork/
91 U.S. NRC. 2015. Plant Sites with Licensed Radioactive Material in Groundwater. Accessed April 28, 2016 at:
http://www.nrc.gov/reactors/operating/ops-experience/tritium/sites-grndwtr-contam.html

5 | Environmental Impacts of Proposed Action
| 5-11
power plants do not considerably change due to continued operations; therefore, the impacts of
continued operations on noise would also be small. Socioeconomic impacts to education, public
safety, social services, recreation and tourism, housing, transportation, public utilities, and
aesthetics from continued operations would also be small. Additional, in-depth discussion of the
socioeconomic impacts of the proposed action is in Chapter 9.
Sustaining operations of nuclear facilities would require the facilities to continue using uranium
fuel. The NRC has also evaluated this issue. Exhibit 5-6 below, recreated from the Generic
Environmental Impact Statement for License Renewal of Nuclear Plants: Main Report, Final
Report identifies the maximum environmental effects per annual fuel requirement. These include
impacts to land, water, fossil fuel use, and gas, liquid, and solid effluents, radiological effluents,
thermal effluents, and exposure of workers and the public to radiation sources. Exhibit 5-7 from
the same report bounds the environmental impact of transporting fuel and waste to and from a
light-water-cooled nuclear power reactor. The impacts from transportation were found to be small
and stated as,
“The impacts of transporting spent fuel enriched up to 5 percent uranium-235 with average burnup
for the peak rod to current levels approved by NRC up to 62,000 MWd/MTU and the cumulative
impacts of transporting high-level waste to a single repository, such as Yucca Mountain, Nevada
are found to be consistent with the impact values contained in 10 CFR 51.52(c), Summary Table
S-4, “Environmental Impact of Transportation of Fuel and Waste to and from One Light-Water-
Cooled Nuclear Power Reactor.” If fuel enrichment or burnup conditions are not met, the applicant
must submit an assessment of the implications for the environmental impact values reported in 10
CFR 51.52.”92
The sustained operations of any nuclear facilities under the CES proposal would continue the use
of nuclear fuel, production of nuclear waste, and the transport of fuel and waste to and from the
facilities. However, the level of these impacts is not likely to exceed the ranges analyzed by the
NRC in the Generic Environmental Impact Statement for License Renewal of Nuclear Plants:
Main Report, Final Report, and the individual facility supplemental EIS’s. Additionally, the
Generic Environmental Impact Statement for Continued Storage of Spent Nuclear Fuel, Final
Report analyzes the impacts of continued storage of spent nuclear fuel at reactor and away-from-
reactor sites over three possible timeframes (60 years, 160 years, and indefinitely).93 Because New
York State nuclear facilities are currently in operation and have already produced spent nuclear
fuel, the impacts determined through the Continued Storage of Spent Nuclear Fuel GEIS are
applicable under the action and no-action alternative. The Continued Storage of Spent Nuclear
Fuel GEIS considers impacts under normal operating conditions as well as environmental impacts
of postulated accidents including severe accidents and potential acts of sabotage or terrorism. The
environmental impacts of sustained operations of New York State nuclear facilities would not
exceed those anticipated in the Continued Storage of Spent Nuclear Fuel GEIS. Thus, continued
92 Office of Nuclear Reactor Regulation. 2013. Generic Environmental Impact Statement for License Renewal of Nuclear
Plants: Main Report, Final Report, NUREG-1437, Volume 1, Revision 1. p. 4-196.
93 Office of Nuclear Material Safety and Safeguards. 2014. Generic Environmental Impact Statement for Continued
Storage of Spent Nuclear Fuel, Final Report, NUREG-2157, Volume 1.

5 | Environmental Impacts of Proposed Action
| 5-12
operations would result in no additional significant impact to the environment than those
previously considered in other EIS’s. Continued operations would not entail any change in storage
location or practices or change in the ultimate disposition of the spent fuel.
EXHIBIT 5-6. TAKEN FROM 10 CFR 51 .51 ON URANIUM FUEL-CYCLE ENVIRONMENTAL
DATA ( A ) , 94, 95
ENVIRONMENTAL
CONSIDERATIONS TOTAL
MAXIMUM EFFECT PER ANNUAL FUEL REQUIREMENT OR
REFERENCE REACTOR YEAR OF MODEL 1,000 MWE LIGHT
WATER REACTOR
Natural resource use
Land (acres)
Temporarily committed,
acres(b) 100
Undisturbed area 79
Disturbed area 22 Equivalent to a 110-MWe coal-fired power plant.
Permanently committed,
acres 13
Overburden moved, millions
of MT 2.8 Equivalent to a 95-MWe coal-fired power plant.
Water (millions of gallons)
Discharged to air 160 Equal to 2 percent of model 1,000 MWe light water
reactor with cooling tower.
Discharged to water bodies 11,090
Discharged to ground 127
Total 11,377
Less than 4 percent of model 1,000 MWe light water
reactor with once-through cooling.
Fossil fuel
Electrical energy, thousands
of MWh 323 Less than 5 percent of model 1,000-MWe LWR output.
Equivalent coal, thousands of
MT 118
Equivalent to the consumption of a 45-MWe coal-fired
power plant.
Natural gas, millions of scf 135 Less than 0.4 percent of model 1,000 MWe energy
output.
Effluents-chemical (MT)
Gases (including entrainment)(c)
SOx 4,400
NOx4 1,190 Equivalent to emissions from 45-MWe coal-fired plant for
a year.
Hydrocarbons 14
CO 29.6
Particulates 1,154
Other gases
94 Normalized to model light-water reactor annual fuel requirement (WASH-1248) or reference reactor year (NUREG-
0116).
95 U.S. NRC. Generic Environmental Impacts Statement for License Renewal of Nuclear Plants: Main Report (NUREG-1437,
Volume 1) Table S.3 Uranium fuel-cycle environmental data.

5 | Environmental Impacts of Proposed Action
| 5-13
ENVIRONMENTAL
CONSIDERATIONS TOTAL
MAXIMUM EFFECT PER ANNUAL FUEL REQUIREMENT OR
REFERENCE REACTOR YEAR OF MODEL 1,000 MWE LIGHT
WATER REACTOR
F 0.67
Principally from UF6 production, enrichment, and
reprocessing. Concentration within range of state
standards--below level that has effects on human health.
HCl 0.014
Liquids
SO-4 9.9 From enrichment, fuel fabrication, and reprocessing
steps. Components that constitute a potential for
adverse environmental effect are present in dilute
concentrations and receive additional dilution by
receiving bodies of water to levels below permissible
standards. The constituents that require dilution and the
flow of dilution water are NH2—600 ft3/sec, NOx—20
ft3/sec, Fluoride—70 ft3/sec.
NO 25.8
Fluoride 12.9
Ca 5.4
C1 8.5
Na 12.1
NH 10
Fe 0.4
Tailings solutions (thousands of
MT) 240 From mills only—no significant effluents to environment.
Solids 91,000 Principally from mills—no significant effluents to
environment.
Effluents Radiological (curies)
Gases (including entrainment)
Rn-222 — Presently under reconsideration by the NRC
Ra-226 0.02
Th-230 0.02
Uranium 0.034
Tritium (thousands) 18.1
C-14 24
Kr-85 (thousands) 400
Ru-106 0.14
I-129 1.3 Principally from fuel reprocessing plants.
I-131 0.83
Tc-99 — Presently under consideration by the Commission.
Fission products and
transuranics 0.203
Liquids
Uranium and daughters 2.1
Principally from milling—included tailings liquor and
returned to ground—no effluents; therefore, no effect on
environment.
Ra-226 0.0034 From UF6 production.
Th-230 0.0015
Th-234 0.01
From fuel fabrication plants—concentration 10% of 10
CFR 20 for total processing 26 annual fuel requirements
for model LWR.
Fission and activation
products
5.9 x 10-
a
Solids (buried on site)
Other than high level
(shallow) 11,300
9100 Ci comes from low-level reactor wastes and 1500 Ci
comes from reactor decontamination and
decommissioning— buried at land burial facilities. 600 Ci

5 | Environmental Impacts of Proposed Action
| 5-14
ENVIRONMENTAL
CONSIDERATIONS TOTAL
MAXIMUM EFFECT PER ANNUAL FUEL REQUIREMENT OR
REFERENCE REACTOR YEAR OF MODEL 1,000 MWE LIGHT
WATER REACTOR
comes from mills—included in tailings returned to
ground. Approximately 60 Ci comes from conversion and
spent-fuel storage. No significant effluent to the
environment.
TRU and HLW (deep) 1.1 x 10⁶ Buried at federal repository.
Effluents—Thermal, (billions
of Btu) 4,063 Less than 5 percent of model 1000-MWe LWR.
Transportation, (person-rem)
Exposure of workers and
general public 2.5
Occupational exposure 22.6 From reprocessing and waste management. (a)In some cases where no entry appears, it is clear from the background documents that the matter was addressed
and that, in effect, the table should be read as if a specific zero entry had been made. However, there are other
areas that are not addressed in the table. Table S-3 does not include health effects from the effluents described in
the table, estimates of releases of radon-222 from the uranium fuel cycle, or estimates of technetium-99 released
from waste management or reprocessing activities. These issues may be the subject of litigation in the individual
licensing proceedings. Data supporting this table are given in the Environmental Survey of the Uranium Fuel Cycle,
WASH-1248, April 1974; the Environmental Survey of the Reprocessing and Waste Management Portion of the LWR
Fuel Cycle,’ NUREG-0116 (Supp. 1 to WASH–1248); the Public Comments and Task Force Responses Regarding the
Environmental Survey of the Reprocessing and Waste Management Portions of the LWR Fuel Cycle, NUREG-0216
(Supp. 2 to WASH-1248); and in the record of the final rulemaking pertaining to Uranium Fuel Cycle Impacts from
Spent Fuel Reprocessing and Radioactive Waste Management, Docket RM-50-3. The contributions from
reprocessing, waste management, and transportation of wastes are maximized for either of the two fuel cycles
(uranium only and no recycle). The contribution from transportation excludes transportation of cold fuel to a
reactor and of irradiated fuel and radioactive wastes from a reactor, which are considered in Table S-4 of Section
51.20(g). The contributions from the other steps of the fuel cycle are given in columns A E of Table S-3A of WASH-
1248.
(b)The contributions to temporarily committed land from reprocessing are not prorated over 30 years, because the
complete temporary impact accrues regardless of whether the plant services 1 reactor for 1 year or 57 reactors
for 30 years.
(c)Estimated effluents based upon combustion of equivalent coal for power generation.
4 1.2% from natural gas use and process.

5 | Environmental Impacts of Proposed Action
| 5-15
EXHIBIT 5-7. TAKEN FROM 10 CFR 51 .52 ON THE ENVIRONMENTAL IMPACT OF
TRANSPORTING OF FUEL AND WASTE TO AND FROM ONE LIGHT-WATER-COOLED NUCLEAR
POWER REACTOR 96, NORMAL CONDITIONS OF TRANSPORT
CONSIDERATIONS ENVIRONMENTAL IMPACT
Heat (per irradiated fuel cask in transit) 250,000 Btu/hr
Weight (governed by Federal or State
restrictions) 73,000 lb per truck; 100 tons per cask per rail car
Traffic density –Truck Less than 1 per day
Traffic density – Rail Less than 3 per month
EXPOSED POPULATION
ESTIMATED NUMBER OF
PERSONS EXPOSED
RANGE OF DOSES TO
EXPOSED INDIVIDUALS97
(PER REACTOR YEAR)
CUMULATIVE DOSE TO
EXPOSED POPULATION
(PER REACTOR YEAR)98
Transportation
workers 200 0.01 to 300 millirem 4 person-rem
General public-
Onlookers 1,100 0.003 to 1.3 millirem 3 person-rem
General public- along
route 600,000 0.0001 to 0.06 millirem
ACCIDENTS IN TRANSPORT CONSIDERATIONS ACCIDENTS IN TRANSPORT ENVIRONMENTAL RISK
Radiological effects Small99
Common (nonradiological) causes
1 fatal injury in 100 reactor years, 1 nonfatal
injury in 10 reactor years, $475 property damage
per reactor year
96 Data supporting this table are given in the Commission's Environmental Survey of Transportation of Radioactive
Materials to and from Nuclear Power Plants, WASH-1238, December 1972, and Supp. 1 NUREG-75/038, April 1975. Both
documents are available for inspection and copying at the Commission's Public Document Room, 2120 L Street N.W.,
Washington, D.C., and may be obtained from National Technical Information Service, Springfield, VA 22161. WASH-1238
is available from NTIS at a cost of $5.45 (microfiche, $2.25) and NUREG-75/038 is available at a cost of $3.25
(microfiche, $2.25).
97 The Federal Radiation Council has recommended that the radiation doses from all sources of radiation other than
natural background and medical exposures should be limited to 5000 mrem per year for individuals as a result of
occupational exposure and should be limited to 500 mrem per year for individuals in the general population. The dose
to individuals due to average natural background radiation is about 130 mrem per year.
98 Man-rem is an expression for the summation of whole body doses to individuals in a group. Thus, if each member of a
population group of 1000 people were to receive a dose of 0.0001 rem (1 mrem), or if 2 people were to receive a dose
of 0.5 rem (500 mrem) each, the total man-rem dose in each case would be 1 man-rem.
99 Although the environmental risk of radiological effects stemming from transportation accidents is currently incapable
of being numerically quantified, the risk remains small regardless of whether it is being applied to a single reactor or a
multireactor site.

5 | Environmental Impacts of Proposed Action
| 5-16
No Action Alternative Impacts
Discontinuing operations nuclear facilities would have nearly the same impacts as those discussed
in the Generic Environmental Impact Statement for License Renewal of Nuclear Plants: Main
Report, Final Report related to not renewing a nuclear license and ceasing operations.100 These
impacts include affects arising from:
Nuclear reactor decommissioning;
Termination of plant operations and cessation of electrical power production; and
Failure to meet the need of delivering baseload power to meet future electric system
needs.
Discontinuing operations at eligible nuclear facilities would create a need for replacement power
that may be met by installation of alternative energy sources (i.e., fossil fuel electricity generation,
renewable energy alternatives, hydroelectric, geothermal, wind, biomass, solar, energy storage
technologies, PV technologies, or ocean wave and current energy), adoption or expansion of
energy efficiency programs, imported out-of-state power, or a combination of these. The GEIS for
License Renewal indicates that fossil fuels will be the primary source of commercial electric
power generation through 2050 and would likely be the primary source of replacement power.101
Increased use of fossil fuels for electricity generation would adversely impact air emissions
through increased production of nitrogen dioxide, sulfur dioxide, and carbon dioxide.102
5.2.2 SOLAR ENERGY
According to National Renewable Energy Laboratory (NREL) 2014 renewable energy data book,
the cumulative installed solar PV capacity in New York State was approximately 397 MW in
2014. Among the State’s installed capacity is the Long Island Solar Farm, one of the largest utility
scale solar energy (USSE) installations at a federal facility. Installed on Brookhaven National
Laboratory, the Long Island Solar Farm is currently under contract to provide 32 MW of solar-PV
energy to the Long Island Power Authority (LIPA). Another noteworthy LIPA USSE contract is
the Eastern Long Island Solar Project, which provides for up to 17 MW of solar carport facilities
on various sites owned by Suffolk County.
The supply curve model discussed in Chapter 4 estimates the contribution of USSE under the CES
to range between 3, 2741 and 8,110 MW, depending on the scenario, beginning in the later years
of the program. In the blended base case, the majority (76 percent) of capacity comes online in the
last five years of the program (2026-2030). Under the base case scenarios, the majority (70 to 84
100 U.S. NRC. Generic Environmental Impacts Statement for License Renewal of Nuclear Plants: Main Report (NUREG-
1437, Volume 1)
101 U.S. NRC. Generic Environmental Impacts Statement for License Renewal of Nuclear Plants: Main Report (NUREG-
1437, Volume 1)
102 For example, electricity generation by typical gas plants would be expected to create 450 short tons of CO2 per GWh
of electricity generated.
5 | Environmental Impacts of Proposed Action
| 5-17
percent) of the projected USSE capacity is expected to occur in three upstate zones, including
West, Central, and Capital. In the high renewable scenario, three zones also account for the
majority (80 percent) of the estimated USSE capacity, including West, Central, and Capital.
Exhibit 5-8 shows the estimated USSE projected to develop under the CES by NYISO Zone under
the base case and high renewable case scenarios, respectively.
The estimates of USSE development under the CES are in line with a 2014 statewide study
published by NYSERDA, which examined the technical and economic potential for energy
efficiency and renewable energy, including solar.103 This study estimates that the New York State
technical and economic potential for utility scale solar is 8,493 MW and 2,254 MW, respectively.
However, the potential for utility scale solar is only a small portion of the total solar resources
identified in the study; including residential and commercial scale solar, NYSERDA estimates the
technical and achievable potential at 42,643 MW and 10,137 MW, respectively.104
103 NYSERDA. 2014. Energy Efficiency and Renewable Energy Potential Study of New York State. Prepared by Optimal
Energy, Inc. April. Accessed February 1, 2016 at: http://www.nyserda.ny.gov/About/Publications/EA-Reports-and-
Studies/EERE-Potential-Studies.
104 Ibid.

5 | Environmental Impacts of Proposed Action
| 5-18
EXHIBIT 5 -8. ESTIMATED USSE PROJECTED TO DEVELOP UNDER THE CES (2019-2030)
NYISO ZONE
ESTIMATED NEW CAPACITY (MW) ESTIMATED NEW GENERATION (GWH)
BASE CASE HIGH LOAD BASE CASE HIGH LOAD
PPA BLEND FIXED REC PPA BLEND
FIXED REC PPA BLEND
FIXED REC PPA BLEND
FIXED REC
Utility Scale Solar Energy
Zone A, West 212 841 1,471 1,464 1,454 1,444 244 966 1,688 1,681 1,670 1,658
Zone B, Genesee 0 0 0 0 97 194 0 0 0 0 112 224
Zone C, Central 0 391 782 782 1,441 2,099 0 465 930 929 1,712 2,495
Zone D, North 0 0 0 0 40 80 0 0 0 0 49 98
Zone E, Mohawk Valley
0 0 0 0 42 85 0 0 0 0 45 90
Zone F, Capital 1,711 1,812 1,912 1,936 1,942 1,949 2,083 2,206 2,328 2,356 2,364 2,372
Zone G, Hudson Valley 431 431 431 630 629 627 480 480 480 701 700 698
Zone H, Millwood 7 7 7 7 7 7 8 8 8 8 8 8
Zone I, Dunwoodie 0 0 0 0 0 0 0 0 0 0 0 0
Zone J, NYC 0 0 0 0 0 0 0 0 0 0 0 0
Zone K, Long Island 374 373 371 381 380 379 459 457 455 467 467 466
Total 2,736 3,855 4,974 5,200 6,032 6,865 3,274 4,582 5,889 6,144 7,127 8,110
Note: Estimates may not sum to the totals reported due to rounding.

5 | Environmental Impacts of Proposed Action
| 5-19
Environmental Impact Overview
As discussed in the 2015 GEIS, key environmental impacts due to USSE stem primarily from the
relatively large land use requirements of such systems and the potential for such systems to
destroy and fragment habitat, disrupt ecosystem processes, harm animals, interrupt natural animal
behaviors (e.g., foraging, hunting, migration patterns, etc.) and introduce barriers to the movement
of species.
USSE environmental impacts are typically greatest at the beginning of a project during
construction of the facility and associated infrastructure (e.g., transmission corridors, substations,
and roads). Environmental impacts during construction will vary depending on the land cover and
topography of the selected site and its proximity to habitat relied upon by sensitive plant and/or
animal species. To the extent that USSE are sited outside of, and at distances sufficient to reduce
interaction with sensitive species, the environmental impacts of such systems can be minimized.
Another promising trend is the development of ‘brightfields:’ USSE developed on degraded lands,
such as brownfields, landfills, mine sites and other types of contaminated or previously-disturbed
lands. For example, Hernandez et al. describe plans for conversion of a 30,000 acre salt-
contaminated agricultural area in San Joaquin Valley into a 2.4 GW solar power plant.105
Construction and operation may also impact local air quality for plant employees and the
surrounding community. For example, increased vehicle use associated with site construction and
operation can elevate local levels of CO, NOx emissions and airborne dust (PM2.5 and PM10
emissions). While solar PV cells emit no criteria pollutants and require little maintenance during
operations, chemicals such as dust suppressants, rust inhibitors, antifreeze and herbicides will be
used to some extent throughout a plant’s lifespan to ensure proper operation and maintenance of
USSE infrastructure. Soil disturbance during site preparation (e.g., vegetation clearing and surface
grading) can also further interfere with natural ecosystems by introducing exotic species, which
can compete with, and in some cases extirpate, native species.
As discussed in the 2015 GEIS, solar PV systems have low rates of water consumption, required
only for panel washing and dust suppression, estimated at a rate of 0.02 m3/MWh. The Long
Island Solar Farm estimated annual water usage for panel washing of approximately 500,000
gallons, equivalent to a per MWh rate of approximately 0.04 m3/MWh.106 Past studies of USSE in
arid lands of the southwestern U.S. have identified dust suppression as a significant source of
water use, although the New York humid continental climate is far less susceptible to generating
the type of dust issues faced by USSE constructed in the much drier climate in southwestern US.
To minimize fugitive dust emissions at the Long Island Solar Farm, native short-growing shade-
tolerant grass was planted below the PV arrays.107
Connecting USSE to the existing electricity system can also result in both short- and long-term
adverse environmental impacts. Similar to site construction, development of transmission lines
105 Hernandez, R.R., et al. 2014. "Environmental Impacts of Utility-Scale Solar Energy." Renewable and Sustainable
Energy Reviews. 29(1): 766-779.
106 DOE. 2009. Environmental Assessment for BP Solar Array Project. DOE/EA-1663. December. 68 pp. Accessed January
20, 2016 at: http://www.lipower.org/pdfs/company/projects/solar/bpsolar-ea.pdf.
107 DOE. 2009. Environmental Assessment for BP Solar Array Project. DOE/EA-1663. December. 68 pp. Accessed January
20, 2016 at: http://www.lipower.org/pdfs/company/projects/solar/bpsolar-ea.pdf.

5 | Environmental Impacts of Proposed Action
| 5-20
can destroy and fragment habitat, displace and disrupt local wildlife, introduce invasive species
and serve as barriers to the movement of species and their genes. And similar to site construction,
the scope and magnitude of such impacts is substantially dependent on such factors as corridor
location, distance to existing electricity infrastructure and corridor placement. In the case of the
Long Island Solar Farm, approximately 900 feet of transmission cables were required to connect
the PV solar arrays to the LIPA substation. To minimize adverse environmental impacts, the
project relied on below ground horizontal directional drilling, which avoided the need for
vegetation removal.108
During the decommissioning phase, PV cells can be recycled to minimize the potentially adverse
environmental impacts of the PV cell materials. Proper dismantling, handling, and disposal of PV
cells and associated plant materials will minimize the potential environmental impacts that can
result from exposure to toxic materials such as cadmium, selenium and arsenic dust, which are
contained within PV cells.
Land Use Requirements
NYSERDA’s 2014 resource potential study also considered the land use requirement for the
installation of solar energy. Exhibit 5-9 shows the global solar radiation throughout New York
State. As shown, the level of solar radiation is relatively consistent across the state, with slightly
lower solar intensity in some parts of upstate, and a slightly higher solar intensity in Long Island.
Overall, the 2014 study concluded that more than 187 million GWh of solar energy fall on New
York each year, more than 1,200 times larger than New York’s electric use.109
108 Ibid.
109 NYSEDA. 2014. Energy Efficiency and Renewable Energy Potential Study of New York State. Volume 3. Prepared by
Optimal Energy, Inc. April. Accessed February 1, 2016 at: http://www.nyserda.ny.gov/About/Publications/EA-Reports-
and-Studies/EERE-Potential-Studies.

5 | Environmental Impacts of Proposed Action
| 5-21
EXHIBIT 5-9. NEW YORK STATE GLOBA L SOLAR RADIATION
NYSERDA’s 2014 potential study estimates that solar energy in New York requires
approximately one square kilometer of land for every 155 GWh of electricity production,
equivalent to approximately two acres per MW capacity, and 1.6 per GWh of annual production.110
Assuming installation of between 2,736 and 6,865 MW of USSE and a land use requirement ratio
of two acres per MW capacity from NYSERDA’s 2014 potential study, between 5,472 and 13,730
acres would be dedicated to USSE, a land area equal to approximately 0.02 percent to 0.04 percent
of the State’s total land area of approximately 35 million acres. As of 2016, New York had 224
state-certified agricultural districts containing 8.79 million acres and including approximately
24,130 farms, equating to approximately 26 percent of the State’s total land area.111 If 100 percent
of USSE projects were to be installed on New York agricultural lands, approximately 0.06 percent
to 0.16 percent of agriculture lands would be converted to USSE.
Visual Resources
As discussed in the 2015 GEIS, USSE may raise community concerns regarding visual impacts.
As most USSE are located in relatively flat areas and/or valleys, USSE operations can often be
seen from long distances. PV panels can further increase visibility by creating glare that can cause
visual discomfort and temporary after images even at long distances. Argonne National
Laboratory's Environmental Science Division, with support from the U.S. Department of the
Interior's National Park Service and Bureau of Land Management, examined the visual
110 Ibid.
111 New York State Department of Agriculture and Markets. 2016. Agricultural District Profile Data – 2016. Accessed April
4, 2016 at: http://www.agriculture.ny.gov/ap/agservices/Agricultural_District_Profile_Data.pdf.
5 | Environmental Impacts of Proposed Action
| 5-22
characteristics of various PV, power tower, and parabolic trough facilities located in Nevada,
California, and Spain. Based on field observations, PV and parabolic trough facilities were easily
visible at long distances during both daytime and nighttime observations. Other visual effects
observed included dramatic and rapid changes in color and/or reflectively of the solar PV cells.
The study authors concluded that the industrial nature of USSE sites can offer strong contrasts to
the relatively rural landscapes that USSE often inhabit.112 However, site-specific conditions such
as density and proximity of trees and surface elevation changes surrounding USSE operations may
affect visibility of the solar arrays. Applying the New York State DEC Guidance for Assessing and
Mitigating Visual Impacts, an Environmental Assessment of a solar array project at the
Brookhaven National Laboratory in Upton, New York found no expected adverse visual impact to
visual resources due to their low vertical profile, extensive wooded buffer, and anti-reflective
coating.113, 114
Additional visual impacts can accrue from the infrastructure surrounding a developed solar array,
including buildings, parking and other work areas. To the extent that periodic maintenance
activities such as panel washing occur at night, such activities can increase light pollution such as
skyglow, light trespass, and glare.115
Best practices during installation can minimize visual impacts, including proper siting and site
operations, screening with fencing, berms, or vegetation, using non-reflective support structures,
avoiding removal of vegetation near modules when possible, prohibiting commercial messages
and symbols on modules, and identifying ways to preserve the historic character of potential sites,
particularly for historic buildings.116
5.2.3 LAND BASED WIND ENERGY
According to the American Wind Energy Association (AWEA), installed wind capacity in the U.S.
is estimated at 67,870 MW, associated with over 49,000 wind turbines. Texas leads the nation in
terms of installed wind capacity with over 15,000 MW followed by California with over 6,000
MW of installed wind capacity.
While wind currently accounts for a relatively small proportion of the New York State’s overall
energy portfolio, development of wind is a renewable energy resource rapidly expanding. AWEA
112 Argonne National Laboratory's Environmental Science Division. Visual Impacts of Utility-Scale Solar Energy Facilities
on Southwestern Desert Landscapes. Accessed on January 21, 2016 at: http://visualimpact.anl.gov/solarvis/.
113 New York State Department of Environmental Conservation. Assessing and Mitigating Visual Impacts. Program Policy
Department ID: DEP-00-2. Accessed April 25, 2016 at:
http://www.dec.ny.gov/docs/permits_ej_operations_pdf/visual2000.pdf.
114 U.S. Department of Energy. Office of Science. Environmental Assessment for BP Solar Array Project. Brookhaven
National Laboratory, Upton, New York. 2009. DOE/EA-1663.
115 BLM. 2013. Best Management Practices for Reducing Visual Impacts of Renewable Energy Facilities on BLM-
Administered Lands. Accessed on January 21, 2016 at:
http://www.blm.gov/style/medialib/blm/wy/programs/energy/reco.Par.61853.File.dat/BLMvisual-BMP.pdf.
116 Ibid.

5 | Environmental Impacts of Proposed Action
| 5-23
currently ranks New York 12th in the nation for installed wind power capacity.117 According to
the 2015 SEP, “as of the end of 2011, 860 wind turbines had been installed in the State with a total
capacity of 1,403 MW; and an additional 37 turbines were under construction with 74 MW of
expected capacity."118
As shown in NYISO’s 2015 Gold Book, between 2007 and 2015 installed nameplate capacity of
wind plants in New York nearly tripled, from 425 MW in 2007 to 1,746 MW in 2015. 119 Exhibit
5-10 summarizes the state’s operating and planned wind capacity across five size classes. Summer
2015 generating capacity in from wind plants totaled 1,461 MW across 21 projects. In addition, as
of December 31, 2015, there were 28 projects totaling 3,459 MW of wind generation capacity
proposed in NYISO’s interconnection queue.
EXHIBIT 5-10. OPERATING AND PROPOSED WIND CAPACITY IN NEW YORK STATE (MW)
CAPACITY 2015 CAPACITY(1) PROPOSED CAPACITY(2)
>10 MW 0 MW (5 projects) (3) 0 MW (0 projects)
10-29 MW 32 MW (2 projects) 60 MW (4 projects)
30- 99 MW 527 MW (7 projects) 639 MW (9 projects)
100-199 MW 671 MW (6 projects) 969 MW (8 projects)
200 MW and over 231 MW (1 project) 1,790 MW (7 projects)
Total 1,461 MW (21 projects) 3,459 MW (28 projects)
Sources:
(1) Summer capacity data, reflecting dependable maximum net generating capacity values that are
applicable to the Summer 2015 ICAP Market. NYISO. 2015 Load & Capacity Data “Gold Book.” April
2015; and NYISO’s “2015 NYCA Generating Facilities.xlxs” accessed on February 1, 2016 at:
http://www.nyiso.com/public/markets_operations/services/planning/documents/index.jsp.
(2) Summer capacity data from: NYISO Interconnection Queue. December 31, 2015.
(3) The NYISO Interconnection Queue, December 31, 2015 includes five projects for which summer
capacity values were shown as zero.
Exhibit 5-11 shows the current distribution of operating and proposed wind capacity by county.
Wind projects have been constructed in eight counties, with the majority of wind capacity coming
from just four counties (Clinton, Wyoming, Lewis and Steuben). New capacity proposed for
development (i.e., projects in the NYISO interconnection queue) represents a much more
geographically diverse distribution, with projects proposed for the first time in 13 new counties.
117 American Wind Energy Association. 2015. U.S. Wind Industry Second Quarter 2015 Market Report. July 22. Accessed
January 25, 2016 at: http://www.ourenergypolicy.org/wp-content/uploads/2015/07/2Q2015-AWEA-Market-Report-
Public-Version.pdf.
118 NY State Energy Planning Board. 2015 New York State Energy Plan. Volume 2. Accessed February 1, 2016 at:
http://energyplan.ny.gov/Plans/2015.
119 NYISO. 2015 Load & Capacity Data “Gold Book.” April 2015.
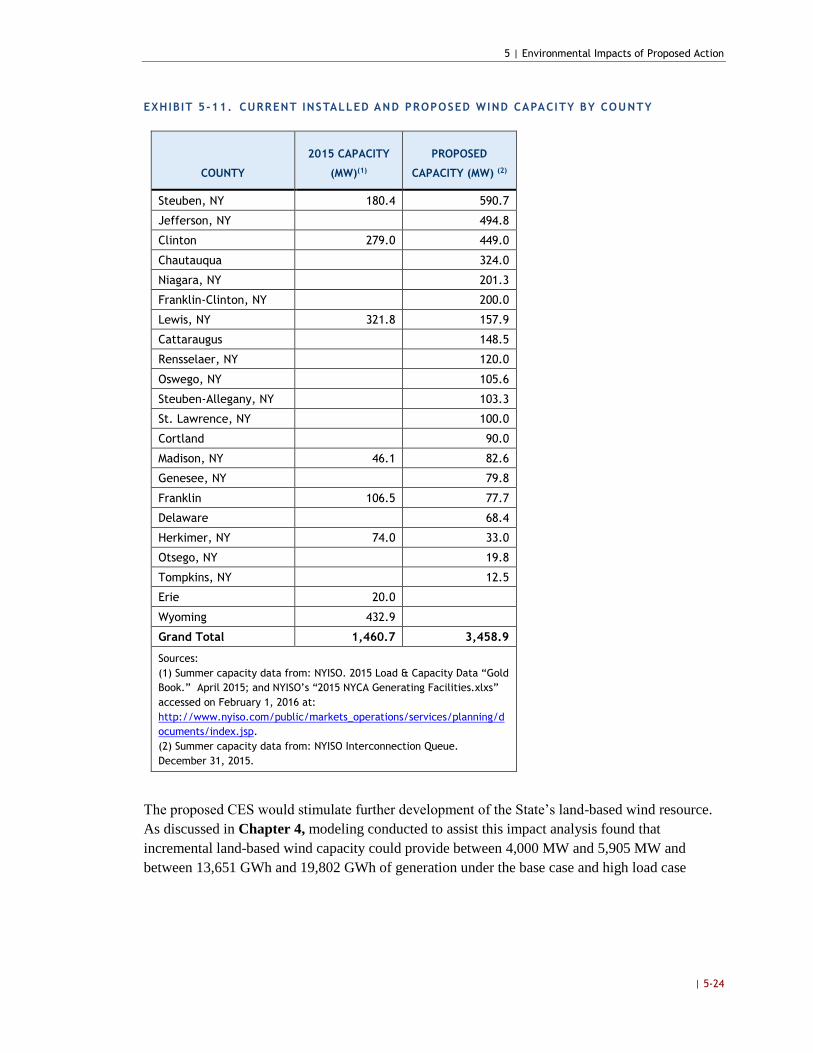
5 | Environmental Impacts of Proposed Action
| 5-24
EXHIBIT 5-11. CURRENT INSTALLED AND PROPOSED WIND CAPACITY BY COUNTY
COUNTY
2015 CAPACITY
(MW)(1)
PROPOSED
CAPACITY (MW) (2)
Steuben, NY 180.4 590.7
Jefferson, NY 494.8
Clinton 279.0 449.0
Chautauqua 324.0
Niagara, NY 201.3
Franklin-Clinton, NY 200.0
Lewis, NY 321.8 157.9
Cattaraugus 148.5
Rensselaer, NY 120.0
Oswego, NY 105.6
Steuben-Allegany, NY 103.3
St. Lawrence, NY 100.0
Cortland 90.0
Madison, NY 46.1 82.6
Genesee, NY 79.8
Franklin 106.5 77.7
Delaware 68.4
Herkimer, NY 74.0 33.0
Otsego, NY 19.8
Tompkins, NY 12.5
Erie 20.0
Wyoming 432.9
Grand Total 1,460.7 3,458.9
Sources:
(1) Summer capacity data from: NYISO. 2015 Load & Capacity Data “Gold
Book.” April 2015; and NYISO’s “2015 NYCA Generating Facilities.xlxs”
accessed on February 1, 2016 at:
http://www.nyiso.com/public/markets_operations/services/planning/d
ocuments/index.jsp.
(2) Summer capacity data from: NYISO Interconnection Queue.
December 31, 2015.
The proposed CES would stimulate further development of the State’s land-based wind resource.
As discussed in Chapter 4, modeling conducted to assist this impact analysis found that
incremental land-based wind capacity could provide between 4,000 MW and 5,905 MW and
between 13,651 GWh and 19,802 GWh of generation under the base case and high load case

5 | Environmental Impacts of Proposed Action
| 5-25
scenarios, respectively. As shown in Exhibit 5-12, the majority of this capacity is anticipated to
be developed through wind projects between 30 and 99 MW in size.120
The 2014 NYSERDA potential study also looked at the technical and economic potential for wind
capacity through 2030. The study estimated a total technical potential of 12,651 MW and an
economic potential of 4,074 MW.121 These estimates are consistent with the supply curve model
results used for this SEIS.
120 In response to the increasing pace of wind energy development in the State, NYISO conducted an extensive study on
the integration of wind energy across the State in 2010. While the study does not represent a full cost-benefit analysis
of wind generation, the study provides an in-depth focus on the technical impacts of increasing the penetration of wind
resources statewide. Among the technical issues considered, NYISO evaluated the State’s existing transmission
infrastructure to determine what constraints, if any, may impede higher levels of wind generation. Based on this
evaluation, NYISO estimated that as much as nine percent of potential wind energy production may not be able to be
delivered due to a need for transmission upgrades. NYISO’s analysis identified three areas in upstate New York facing
transmission constraints: the Central Zone, in Northern New York, where wind resources are limited by the Willis Exit,
and in the Watertown area. (NYISO. 2012. Growing Wind: Final Report of the NYISO 2010 Wind Generation Study.
September.) If such constraints are not alleviated, wind projects are likely to be concentrated geographically in the
unconstrained areas of the State.
121 NYSEDA. 2014. Energy Efficiency and Renewable Energy Potential Study of New York State. Volume 3. Prepared by
Optimal Energy, Inc. April. Accessed February 1, 2016 at: http://www.nyserda.ny.gov/About/Publications/EA-Reports-
and-Studies/EERE-Potential-Studies.

5 | Environmental Impacts of Proposed Action
| 5-26
EXHIBIT 5 -12. ESTIMATED UTILITY SCALE LAND-BASED WIND ENERGY PROJECTED TO DEVELOP UNDER THE CES (2019-2030)
CAPACITY
ESTIMATED NEW CAPACITY (MW) ESTIMATED NEW GENERATION (GWH)
BASE CASE HIGH LOAD Base Case High Load
PPA BLEND FIXED REC PPA BLEND
FIXED REC PPA BLEND
FIXED REC PPA BLEND
FIXED REC
Land-Based Wind
10-29 MW 730 661 592 970 848 726 2,665 2,442 2,219 3,470 3,073 2,676
30-99 MW 1,950 2,212 2,475 3,323 3,285 3,248 6,638 7,564 8,489 11,138 11,038 10,938
100-199 MW 1,014 1,008 1,001 1,311 1,303 1,294 3,336 3,306 3,276 4,217 4,188 4,159
200 MW or over
306 307 307 302 302 302 1,012 1,014 1,017 977 977 977
Total 4,000 4,188 4,375 5,905 5,738 5,570 13,651 14,326 15,002 19,802 19,276 18,749
Note: Estimates may not sum to the totals reported due to rounding.

5 | Environmental Impacts of Proposed Action
| 5-27
Environmental Impact Overview
This section expands on the 2015 GEIS by more fully describing impacts that occur during the
construction and operation of utility-scale, land-based wind energy generation facilities.
Environmental impacts arise due to the land disturbance during the construction and operation of
wind turbines and associated equipment, and due to the structure and movement of turbines
themselves. The primary impacts of wind turbines relate to the high land use requirement,
possible collisions of wildlife with turbines, and habitat fragmentation due to construction of
arrays. However, the impacts on wildlife across all life stages of a wind turbine are still likely to
be significantly less than impacts of traditional fossil fuel energy.122
Land Use Impacts
Utility-scale land-based wind projects are relatively land-intensive, consisting of an array of
turbines that require a minimum amount of spacing between turbines to maximize effectiveness.
As discussed in the final 2015 GEIS, the NREL conducted a nationwide survey in 2009 of the land
use associated with large (defined as facilities with a nameplate capacity of greater than 20 MW)
land-based wind facilities. Based on data collected for over 172 existing or proposed wind
projects between 2000 and 2008, representing over 26 GW of capacity, the NREL estimated an
average land use between 30 and 141 acres per MW of wind capacity, although only a small
portion of that land is permanently disturbed (roughly 0.5 to 2 percent). Approximately 80 percent
of this permanent disturbance on average is associated with roads, with the remaining attributable
to turbine area and associated equipment.123 These estimates are in line with a 2009 wind energy
toolkit published by NYSERDA which cites land requirements between 30 to 80 acres per MW for
utility-scale projects in open, flat terrain and 20 to 40 acres per MW for utility-scale wind projects
located on ridgelines in more hilly terrain.124
The 2009 NREL study also examined the extent to which land use intensities for large wind
projects varied with land cover (Exhibit 5-13). While temporary direct impacts were the highest
among wind facilities located in forested areas, likely due to the need to clear forest to create
access roads, turbine pads and setback areas, wind facilities in forested areas also reported the
lowest total area impacted. Notably, wind projects sited on row crops had the greatest total area
requirement followed by grasslands.
122 Alliance for Clean Energy New York, Inc. 2011. Wind and Wildlife.
123 Denholm et al. 2009. Land-use requirements of modern wind power plants in the United States. Bolder CO: National
Renewable Energy Laboratory.
124 NYSERDA. 2009. Wind Energy Toolkit. Accessed January 24, 2016 at: http://www.nyserda.ny.gov/-
/media/Files/EERP/Renewables/wind-energy-toolkit.pdf

5 | Environmental Impacts of Proposed Action
| 5-28
EXHIBIT 5-13. AVERAGE LAND USE REQUIREMENTS BY COVER TYPE
PRIMARY
LAND COVER TYPE
AVERAGE AREA (ACRES /MW)
DIRECT IMPACT
AREA
(PERMANENT)
DIRECT IMPACT
AREA
(TEMPORARY) TOTAL AREA
PERCENT OF
TOTAL AREA
PERMANENTLY
IMPACTED
Shrubland 0.54 ± 0.30 1.56 ± 1.24 64.99 ± 31.63 0.8%
Forest 0.89 ± 0.54 2.74 ± 2.82 45.22 ± 31.13 2.0%
Grasslands/Herbaceous 1.01 ± 0.54 0.91 ± 0.27 88.21 ± 41.27 1.1%
Pasture/Hay 0.59 ± 0.37 1.46 ± 1.63 67.71 ± 38.05 0.9%
Row Crops 0.59 ± 0.69 2.15 ± 1.61 117.62 ± 62.02 0.5%
Small Grains 0.77 ± 1.28 1.24 ± 0.42 60.54 ± 19.03 1.3%
Source: Denholm et al. 2009. Land-use requirements of modern wind power plants in the United States. Bolder CO:
National Renewable Energy Laboratory.
To date, there are two efforts that have mapped out areas in the State that may be suitable for
development of land-based wind energy. In 2010, the U.S. DOE NREL WIND Exchange project
mapped out wind speeds and capacity factors125 relevant to different turbine heights across the
U.S. In New York, as shown in Exhibit 5-14, NREL’s analysis shows the areas with the highest
wind speeds and capacity factors occur generally in Long Island, the Eerie-Ontario Lowlands, the
Western Adirondack Mountains, and the northern side of the Allegheny Plateau.
125 A capacity factor is equal to the ratio of energy generated by an energy generating unit divided by the total amount
of energy that could have been generated under full capacity. (see: EIA. Glossary. Accessed January 20, 2016 at:
http://www.eia.gov/tools/glossary/index.cfm?id=C.)
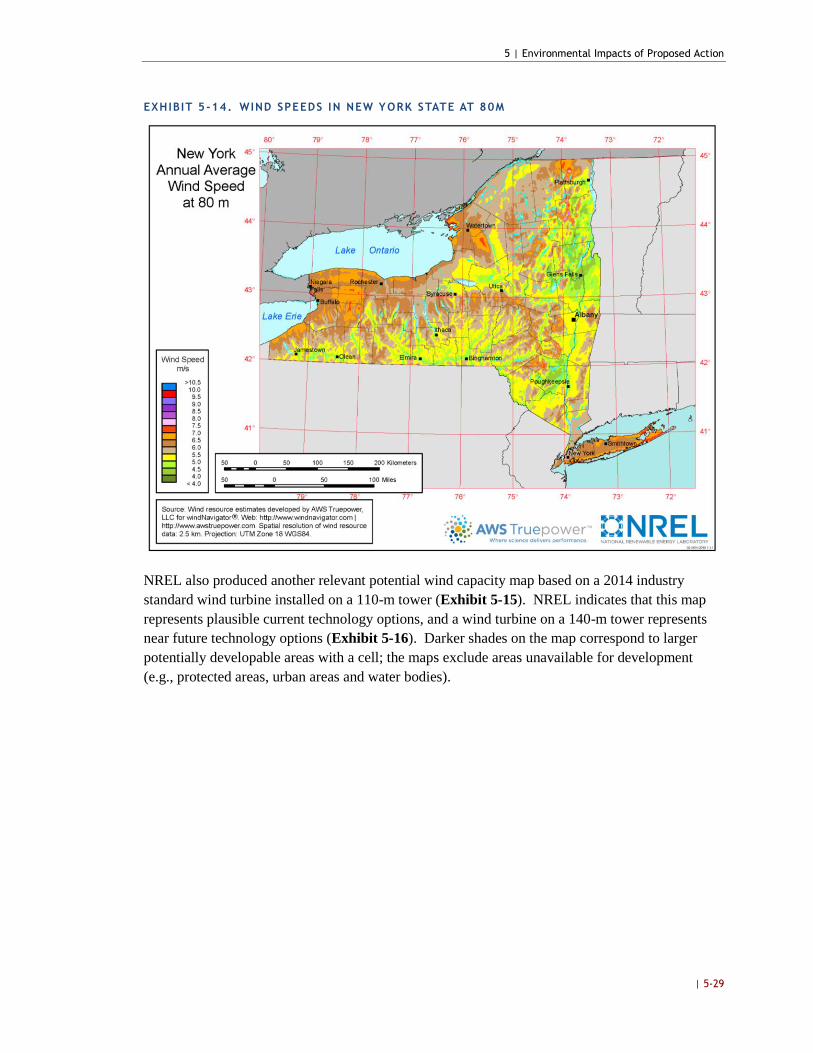
5 | Environmental Impacts of Proposed Action
| 5-29
EXHIBIT 5-14. WIND SPEEDS IN NEW YORK STATE AT 80M
NREL also produced another relevant potential wind capacity map based on a 2014 industry
standard wind turbine installed on a 110-m tower (Exhibit 5-15). NREL indicates that this map
represents plausible current technology options, and a wind turbine on a 140-m tower represents
near future technology options (Exhibit 5-16). Darker shades on the map correspond to larger
potentially developable areas with a cell; the maps exclude areas unavailable for development
(e.g., protected areas, urban areas and water bodies).

5 | Environmental Impacts of Proposed Action
| 5-30
EXHIBIT 5-15. POTENTIAL WIND CAPACITY AT 110-METERS HUB HEIGHT

5 | Environmental Impacts of Proposed Action
| 5-31
EXHIBIT 5-16. POTENTIAL WIND CAPACITY AT 140-METERS HUB HEIGHT
In a November 2014 study, the New York Natural Heritage program (NYNHP) also undertook an
analysis of suitable lands in New York State for wind projects. Unlike the NREL study, the
NYNHP study took a more comprehensive approach to wind suitability taking into consideration a
range of factors in addition to wind production capacity, including elevation, slope, aspect, surface
relief ratio, terrain wetness, distance to transmission, and land cover (e.g., developed, open, forest,
etc.).126 Accounting for a wider range of factors, NYNHP identified the northern Alleghany
Plateau and Eerie-Ontario Lowlands as the most suitable areas for siting new wind projects.
As a recognized partner working with NYSDEC, NYNHP’s mission is to facilitate conservation of
the State’s biodiversity. NYNHP expanded its analysis to identify the subset of lands suitable for
wind development which present conflicts with areas of significant biodiversity, including the
presence of birds and bats, species particularly vulnerable to adverse impacts from the rotating
turbine blades. Exhibit 5-17 depicts the results of NYNHP’s analysis with economically suitable
lands (left) as compared to areas identified as both economically and ecologically suitable (right).
126 Howard and Schlesinger. 2014. Wind Power and Biodiversity in New York: A Tool for Siting Assessment and Scenario
Planning at the Landscape Scale. New York Natural Heritage Program.

5 | Environmental Impacts of Proposed Action
| 5-32
EXHIBIT 5-17. RESULTS OF THE NEW YORK NATURAL HERITAGE PROGRAM STUDY OF WIND ENERGY’S IMPACTS O N WILDLIFE
Source: Howard and Schlesinger. 2014. Wind Power and Biodiversity in New York: A Tool for Siting Assessment and Scenario Planning at the Landscape Scale. New York Natural
Heritage Program.

5 | Environmental Impacts of Proposed Action
| 5-33
Overall, the NYNHP project identifies approximately 1.3 million acres of land in New York as
potentially suitable for wind development, considering contributing factors from both technical
and biodiversity perspectives. Assuming a conservative range of land use requirements from
NREL’s 2009 study of 30 to 141 acres per MW, total land use requirements for 4,000 MW of
land-based wind under the base case PPA scenario (the scenario which projects the lowest amount
of land-based wind development) may require between 120,000 and 564,000 acres of land; this
range increases to approximately 177,000 to 833,000 acres for 5,905 MW under the high load
PPA scenario (the scenario which projects the highest amount of land-based wind development).
These potential land use requirements appear to fall within the approximately 1.3 million acres
that the NYNHP estimates as economically and biologically suitable for land-based wind energy
development. Based on a recent estimate of 8.79 million acres of agricultural lands in NYS, if
agriculture lands hosted 100 percent of wind energy development projects, between approximately
1.4 percent and 9.5 percent of agriculture lands would be converted to wind energy.127 In addition,
several of the counties with areas of very high suitability for wind development, including
Jefferson, Wyoming, and Chautauqua Counties (Exhibit 5-17), are also among the top ten
counties in the State with the highest amount of lands in agricultural use.128 Jefferson and
Wyoming Counties are also in the top ten farming counties by total sales (see Exhibit 3-6).
Species B iodivers ity : Bi rd s and Bats
As discussed in the 2015 GEIS, birds and bats are particularly vulnerable to injury and mortality
from collision with land-based wind energy projects. Wind turbines used in commercial
operations typically consist of an array (or multiple arrays) of turbines with rated capacities
ranging from 660 kW to 3.6 MW for each unit. Turbines blades range in size depending on the
turbine capacity; the most common size is 150 feet, roughly equal to half the length of a football
field. In contrast, wind turbines for residential or small-scale projects are much smaller, with
blade lengths a third of the size of commercial-sized turbine (approximately 50 feet).
In 2014, the National Wind Coordinating Committee (NWCC) examined 18 post-construction bird
and bat surveys at 11 different projects in New York and found a range of bird mortality from 0.66
to 9.59 birds per turbine during a survey period that extended from mid-April to mid-November.
These estimates are consistent with a 2010 NYSERDA survey which estimated bird mortality
between 0.63 to 7.70 birds per turbine per year.129 While mortality rates varied by plant, no plant
reported a rate greater than 14 birds per MW per year.130
127 New York State Department of Agriculture and Markets. 2016. Agricultural District Profile Data – 2016. Accessed April
4, 2016 at: http://www.agriculture.ny.gov/ap/agservices/Agricultural_District_Profile_Data.pdf.
128 USDA, National Agricultural Statistics Service. 2012. 2012 Census of Agriculture – County Data, New York. Accessed
May 2, 2016 at:
https://www.agcensus.usda.gov/Publications/2012/Full_Report/Volume_1,_Chapter_2_County_Level/New_York/st36_
2_001_001.pdf.
129 NYSERDA. 2010. Pre-Development Assessment of Avian Species for the Proposed Long Island – New York City Offshore
Wind Project Area. October.
130 US DOE. 2015. Wind Vision: A New Era for Wind Power in the United States.

5 | Environmental Impacts of Proposed Action
| 5-34
More recently, in 2015, DOE published a report which reviewed recent literature on bird and bat
mortality from wind projects. The report found that songbirds accounted for the majority of bird
mortality, although the total turbine-related mortality was still relatively small, under 0.02 percent
of the total songbird populations. 131 Compared to other sources of bird mortality, turbine-related
bird mortality is likely a very small fraction of the total bird mortality each year from collisions
with human-made obstacles. For example, studies from 2013 and 2014 suggest that current bird
mortality rates due to collisions with wind turbines are only 0.2 percent of those for power lines,
and only 0.06 percent of those for buildings.132 However, impacts on certain birds may be higher.
For example, DOE found higher than expected rates of mortality of eagles due to turbine
collisions.133 While raptors (including the bald and golden eagles) exist in New York, data on
their migration patterns are limited.134 For example, the November 2014 NYNHP analysis was
unable to find statewide data on the movement patterns of the State’s raptor populations.135
Turbine-related mortality of bats appears higher than for birds. For example, bat mortality was
more than 200 percent of bird mortality at six New York State wind farms monitoring over a seven
month period.136 The same 2009 NREL study estimated a bat mortality rate from wind turbine of
0.5 to 40.5 bats per turbine per year. As discussed in Chapter 3, New York has two federally
listed bat species: the Indiana entire bat (Myotis sodalis) is listed as endangered and the northern
long-eared bat (Myotis septentrionalis) as threatened. Given recent stressors including habitat loss
and white nose syndrome, there is greater concern over the population of bats and their
vulnerability to any additional stressors that may adverse impact survival rates.137 As part of its
2014 wind and biodiversity mapping project, NYNHP project created a map which overlaid
distribution and migration patterns for six bat species, including hibernacula and data on
movements for Indiana bats and brown bats. Exhibit 5-18 identifies a discrete number of areas in
the State where conflicts could arise between bats and wind projects if such projects are sited
overlapping or in close proximity to mapped areas.
To minimize the potential impacts on birds and bats, NYSDEC guidelines suggests wind
developers site land-based wind projects at least five miles away from major rivers, a great lake, or
the Atlantic Coast, at least 2 miles away from any area where special status birds are known to
concentrate and/or 40 miles away from an identified bat hibernaculum.138 In a review of 21 post-
construction facilities studies at 19 facilities across five US regions and one Canadian province,
bats were more often killed on nights with lower wind speed (generally under six meters per
131 US DOE. 2015. Wind Vision: A New Era for Wind Power in the United States.
132 US DOE. 2015. Wind Vision: A New Era for Wind Power in the United States.
133 US DOE. 2015. Wind Vision: A New Era for Wind Power in the United States.
134 NYNHP. Animal Guides. Accessed January 25, 2016 at: http://www.acris.nynhp.org/animals.php.
135 Howard and Schlesinger. 2014. Wind Power and Biodiversity in New York: A Tool for Siting Assessment and Scenario
Planning at the Landscape Scale. New York Natural Heritage Program.
136 Alliance for Clean Energy New York, Inc. 2011. Wind and Wildlife.
137 US DOE. 2015. Wind Vision: A New Era for Wind Power in the United States.
138 NYSDEC. 2009. Guidelines for Conducting Bird and Bat Studies at Commercial Wind Energy Projects

5 | Environmental Impacts of Proposed Action
| 5-35
second). The review also found that bats often fly more directly after storm events, which can also
lead to higher turbine-related bat fatalities. Curtailing during these times could help to reduce
fatalities.139 For example, several studies have shown that increasing the "cut-in" speed of turbines
during the summer and fall has reduced bat mortalities by 44 to 93 percent, while only reducing
the amount of energy generated by one percent or less.140 In addition, avoiding siting turbines near
areas frequented by bats such as water sources or known cove roosts can help further mitigate the
potential for collisions.141
EXHIBIT 5-18. NEW YORK STATE BAT LOCATIONS AND TRAVEL ZONES IDENTIFIED 142
Habitat Destruct ion and Fragmentation
In addition to the direct impacts of injury and mortality from collisions with wind turbine
infrastructure, wind development can also fragment habitat for a range of animals though the
placement of the turbines, access roads, and new transmission lines. In general, populations of
139 Arnett et al. 2008. Patterns of Bat Fatalities at Wind Energy Facilities in North America. Journal of Wildlife
Management 72(1):61–78
140 Alliance for Clean Energy New York. 2011. Wind and Wildlife.
141 Arnett et al. 2008. Patterns of Bat Fatalities at Wind Energy Facilities in North America. Journal of Wildlife
Management 72(1):61–78
142 Howard and Schlesinger. 2014. Wind Power and Biodiversity in New York: A Tool for Siting Assessment and Scenario
Planning at the Landscape Scale. New York Natural Heritage Program.

5 | Environmental Impacts of Proposed Action
| 5-36
animals confined to smaller areas are less likely to persist, due to reduced gene flow and ability to
respond to area specific events such as changes in weather and climate.
To assess the potential for habitat fragmentation in New York State, the NYNHP study compiled
geographic data on wide range of indicators in New York State, including endangered species
distribution and migration, large forested areas, connectivity zones, migrating bird stopover sites,
information on streams, and terrestrial landscape resilience. Exhibit 5-19 displays the results of
this work, specifically a map of areas likely to have the highest regulatory burden due to
biodiversity issues, and the areas with the most at-risk species. Overall, the project identified a
range of areas likely to have important biodiversity considerations (Exhibit 5-19). These included
some of the high wind potential areas identified, especially in some parts in the western
Adirondacks and Eerie-Ontario lowlands.

5 | Environmental Impacts of Proposed Action
| 5-37
EXHIBIT 5 -19. AREAS WITH HIGHER REGULATORY BURDEN DUE TO BIODIVERSITY (LEFT) AND NUMBER OF RARE ANIMALS BY AREA

5 | Environmental Impacts
| 5-38
Noise Pol lut ion
As discussed in the 2015 GEIS, while operating wind projects do not generate air emissions, the
operation of wind turbines can create sound that can become a source of noise pollution. Wind
turbines emit two types of sound: (1) aerodynamic sounds (such as “whooshing”) created by the
rotating turbine blades moving through the air and (2) mechanical sounds created from the internal
gears of an operating wind turbine.143 In 2013, NYSERDA conducted an extensive review of
existing literature on sound and noise associated with wind energy. The highest sound levels
reported across the wind energy studies reviewed ranged from 20 to 50 dBA, sound levels
associated with a whisper (< 30 dBA) up to the sound levels found inside a house or office (30 to
50 dBA).144
Wind energy-related sound, however, is affected by a number of site-specific variables including
turbine design, wind direction and speed, atmospheric conditions, vegetation cover, topography,
local background noise conditions, as well as the person or place impacted by the noise. Another
2013 NYSERDA report measured sound levels associated with wind turbines at the 126 MW wind
farm, located in Wethersfield, New York and found that the winter campaign had the highest wind speeds
and monitored sound levels.145 Several studies have also focused on identifying the environmental
conditions that collectively produce the ‘worst case scenario.’ Such conditions include wind
turbines operating at night, at low wind speeds and under stable or calm atmospheric conditions.
Under such conditions, sound from wind turbines can become trapped (much like fog or smoke) at
lower elevations, close to ground.146 Other factors that can influence sound levels include the
number and size of turbines. Researchers have found that more turbines often sound louder due to
the synergistic effects across turbines, and larger turbines emit higher amounts of low-frequency
noise than smaller turbines.
Visual Aesthet ics 147
NYSERDA’s 2009 wind energy toolkit identifies visual aesthetics as one of the most significant
issues that local communities face when considering new wind energy projects. Such impacts can
be especially acute for utility-scale wind projects which consist of larger turbines, higher turbine
heights and multiple turbines configured in arrays; however, project location (e.g., exposed hilltop
areas), project footprint, turbine spacing, local topography, existing vegetation and land cover, and
existing land uses can all influence the visual impacts of a wind project. Importantly, as discussed
in the 2015 GEIS, visual impacts vary based on the subjective preferences of affected individuals
and an individual’s personal viewshed; for example, the number of points from which a resident
can see the turbines, the number of turbines the resident routinely sees, the time of day during
which turbines are most visible, and/or the location and length of time that a project is visible (e.g.,
while traveling in the car). Under certain lighting conditions, the moving blades of a turbine can
143 NYSERDA. 2013. Wind Turbine-Related Noise: Current Knowledge and Research Needs. NYSERDA Report 13-14. June.
144 Ibid.
145 NYSERDA. 2013. Wind Turbine-Related Noise in Western New York. NYSERDA Report 13-03. January.
146 Ibid.
147 NYSERDA. 2009. Wind Energy Toolkit. Accessed January 24, 2016 at: http://www.nyserda.ny.gov/-
/media/Files/EERP/Renewables/wind-energy-toolkit.pdf.

5 | Environmental Impacts
| 5-39
generate “shadow flicker,” which may be disruptive to nearby residents and drivers. Seasonality
can also change the visual impact of a wind project with visibility increasing during winter seasons
when many surrounding areas trees are bare.
While some may consider wind turbines “graceful sculptures,” others believe wind turbines mar
the beauty of the existing natural scenery. Residents of rural communities often value such areas
for their openness, remoteness and tranquility. NYSERDA’s 2009 wind energy toolkit notes that
utility scale wind projects in rural areas can be particularly disruptive “by introducing large-scale
structures and machinery into previously undeveloped areas. This includes the wind turbines
themselves, as well as electrical transmission equipment and construction vehicles such as cranes
and service trucks.”
While the research on the impact of noise and sound from wind energy is still evolving, literature
to date suggests that most direct impact of wind turbines is annoyance, an effect which naturally
differs by person and can be further compounded by multiple sensory effects (e.g., residents
annoyed both visually and acoustically by wind turbines). A survey of local residents living in
Cape Vincent, New York in close proximity to a wind farm across the St. Lawrence River on
Wolf’s Island, Ontario, supports this concept; for example, while 38 percent of Cape Vincent
residents noted periodic annoyance with the sound of wind turbines, 88 percent indicated
annoyance from the seeing the new wind turbines, whereas 92 percent indicated annoyance at the
shadow flare effects and flickering lights.148 These survey results, however, are inconsistent with a
more recent 2013 NYSERDA survey of wind turbine related noise in western New York, which
found no correlation between an individual’s satisfaction with their living environment, their
annoyance with wind turbine noise and the number of turbines visible from their house.149
NYSERDA’s 2013 literature review also highlighted examples of surveys provided to residents
living in close proximity to wind energy projects about changes in resident’s quality of life. As
expected, residents living closer to wind projects more often reported lower overall quality of life
as compared to residents living farther away. Reported levels of annoyance were also proportional
to sound levels; as sound levels approach 40 dBA, the frequency of complaints and instances of
annoyance increases significantly. The World Health Organization (WHO) also conducted a
literature review on the health effects of noise. Similar to NYSERDA’s 2013 literature review, the
WHO’s literature review also concluded that annoyance rises with increasing sound pressure
levels, but that only three percent of the population experiences annoyance from exposures to
sound pressure levels less than 55 dBA.150
A recent 2013 NYSERDA study surveyed residents in Wethersfield, New York, and found levels
of noise annoyance were statistically correlated with an individual’s general opinion on wind
turbines, their opinion on whether the turbines altered the landscape, their concern over health
effects associated with the turbines, and their sensitivity to noise in general. This suggests that
148 NYSERDA. 2013. Wind Turbine-Related Noise: Current Knowledge and Research Needs. NYSERDA Report 13-14. June.
Page 13.
149 NYSERDA. 2013. Wind Turbine-Related Noise in Western New York. NYSERDA Report 13-03. January.
150 Ibid.

5 | Environmental Impacts
| 5-40
people who felt negatively about the wind turbines and were worried about their aesthetic and
health impacts were also more likely to be annoyed by turbine noise. Those who felt more
positively toward the turbines and were not as concerned by the aesthetic and health impacts were
less likely to be annoyed by the noise.151
In addition to annoyance, some residents have reported problems with sleep. While the exact level
of sound that disrupts sleep varies by person, the WHO’s 2011 literature review suggested that
sleep disturbance is more often associated with sounds levels beginning at 40 to 50 dBA.
Problems with sleep can also differ based on resident’s baseline environmental setting; one study
found that six percent of residents in rural communities reported sleep disturbance from wind
turbines as compared to four percent of residents in urban communities.
Concerns have also been raised about the potential for more direct health effects created by sound
from wind turbine operations, including cardiovascular effects such as blood pressure; heart rate
variability; and symptoms such as hypertension, myocardial infarction, angina and cardiovascular
disease. The same 2013 NYSERDA report also included a survey of the current state of
knowledge and research needs on wind turbine noise, including cardiovascular effects. While the
research on the potential cardiovascular effects from noise is relatively extensive, the NYSERDA
report notes that existing research to date has focused only in the areas of occupational exposure,
road traffic and airports – all activities which typically generate higher sound levels than wind
turbines. As example, the literature on road traffic noise suggests a possible link between an
increased risk of myocardial infarction and cardiovascular disease rate in people exposed to sound
pressure levels greater than 60 dBA. Continuous occupational noise at more than 80 dBA (very
loud) suggests moderate levels of increased risk for coronary heart disease.
Existing studies on hypertension suggest increasing risk for every 5 dBA increase in sound decibel
levels starting at a moderate sound level of 55 dBA and a significant increase in the relative risk of
hypertension for sound levels exceeding a very loud 85 dBA. The 2013 NYSERDA survey also
identified an older 1989 study that linked changes in the performance of school age children with
outdoor exposure sound levels of 70 dBA. However, as previously noted, the highest sound levels
identified by NYSERDA from across wind energy studies is 50 dBA; as such, the 2013
NYSERDA study noted that the applicability of the existing literature on noise and potential
cardiovascular and performance effects, may therefore, not be applicable to wind turbines.
In 2011, the Massachusetts Department of Environmental Protection and the Massachusetts
Department of Public Health established an independent panel charged with analyzing both peer-
reviewed and non-peer reviewed literature on “the biological plausibility or basis for health effects
of turbines (noise, vibration, and flicker).” The panel concluded that there was insufficient
evidence to suggest any correlation between wind turbine noise and health problems or disease.
The panel did, however, offer some recommendations to minimize the impact of turbine-related
noise, including setback distances that cap receptor sound levels from a wind project at 37 dBA.
151 Ibid

5 | Environmental Impacts
| 5-41
5.2.4 OFFSHORE WIND ENERGY
The first offshore wind project was developed off the coast of Denmark in 1991. Since then,
AWEA reports the use of offshore wind in ten countries around the world, including Belgium,
Sweden, Finland, Germany, the United Kingdom, the Netherlands, Ireland, China, and Japan with
new projects under development in France, Italy, Norway, and Spain. Current estimates put
worldwide installed capacity from offshore wind at approximately 8.99 GW as of mid-year 2015,
with another 4.45 GW under construction and an additional 40 GW either under contract or
approved for development.152
As discussed in the 2015 GEIS, while no offshore wind projects have yet been constructed in the
U.S., there are several offshore wind projects planned and/or under construction, including several
along the East Coast.153 For example, in Rhode Island, an offshore wind project is currently under
consideration off the coast of Block Island, substructure installation was completed in November
2015 and are turbines scheduled to be installed and in-service by the fourth quarter of 2016.154 In
a July 2012 Technical Report, NREL estimates a gross offshore wind technical generating
potential of 4,223 GW; an amount roughly four times the generating capacity of the current U.S.
electric grid. While wind speeds are higher off the Pacific Coast, NREL identifies the shallower
waters in the Atlantic as a more attractive option from a financial perspective. The report further
states that 146 GW of the U.S. offshore wind potential is in New York (Exhibit 5-21).
Exhibit 5-20 presents the incremental offshore wind capacity and generation projected to develop
under the CES. While offshore wind development is possible along the Atlantic Ocean and in the
Great Lakes regions, as shown in Exhibit 5-20, all of the incremental capacity projected to
develop under the CES is anticipated to occur downstate, along the Atlantic Ocean, in Zones J
(NYC) and K (Long Island). Capacity growth of between 400MW and 1,830 MW is projected
under the four scenarios, with the lowest capacity expected under the base case Fixed REC
scenario and the highest capacity expected to develop under the high load PPA scenario.
152 National Renewable Energy Laboratory. 2014-2015 Offshore Wind Technologies Report, NREL/TP-5000-64283.
http://www.nrel.gov/docs/fy15osti/64283.pdf.
153 For more information, see BOEM’s page on Renewable Energy State Activities. Accessed January 25, 2016 at:
http://www.boem.gov/Renewable-Energy-State-Activities/
154 Deepwater Wind. Accessed February 1, 2016 at: http://dwwind.com/project/block-island-wind-farm/.

5 | Environmental Impacts
| 5-42
EXHIBIT 5 -20. ESTIMATED OFFSHORE WIND ENERGY PROJECTED TO DEVELOP UNDER THE CES (2019 –2030)
NYISO ZONE
ESTIMATED NEW CAPACITY (MW) ESTIMATED NEW GENERATION (GWH)
BASE CASE HIGH LOAD Base Case High Load
PPA BLEND FIXED REC PPA BLEND
FIXED REC PPA BLEND
FIXED REC PPA BLEND
FIXED REC
Offshore Wind
Zone J, NYC 816 408 0 1,054 772 489 3,492 1,746 0 4,510 3,301 2,092
Zone K, Long Island 783 591 400 776 783 789 3,347 2,529 1,711 3,316 3,345 3,375
Total 1,599 1,000 400 1,830 1,554 1,278 6,839 4,275 1,711 7,826 6,646 5,467
Notes: Estimates may not sum to the totals reported due to rounding. No offshore wind is projected for Zones A – I; thus, these zones are not shown in the exhibit.

5 | Environmental Impacts
| 5-43
Relative to other sources of renewable energy, offshore wind is expensive to develop due to
complex technological conditions and the present lack of necessary operational infrastructure. The
costs, however, are projected to decline over time as technological innovation continues,
competition increases in the offshore wind supply chain, and further development is driven by the
demand from more active European markets.155 Offshore wind has other attributes that may
encourage development, including de minimis land needs and over-land transmission requirements
for dense coastal population areas with high electricity demand; and higher capacity factors and
better peak load co-incidence than other renewable energy sources.
EXHIBIT 5-21. NEW YORK STATE OFFSH ORE WIND POTENTIAL
While offshore wind is similar to land-based wind, offshore wind turbines are considerably larger
than land-based wind turbines and are constructed to withstand the harsher conditions associated
with a marine environment (e.g., salt-water corrosion, storm waves, hurricane-force winds, ice
flows, lightning, etc.). The average wind turbine installed offshore in 2015 had a nameplate
capacity of approximately 4 MW with a hub height of approximately 90 meters (295 feet) and a
rotor diameter of nearly 120 meters (394 feet).156 Turbine OEMS are producing new turbines rated
from 6 to 8 MW with rotor diameters from 152 to 164 meters (499 to 538 ft). For example, the
current BOEM New York call area for offshore wind is located in the Atlantic Ocean,
approximately 14 nautical miles due south of Nassau County at water depths between 25 and 40
meters (82 and 131 feet). Current BOEM project feasibility studies envision the use of wind
155 McClellan et al. 2015. New York Offshore Wind Cost Reduction Study. NYSERDA
156 Renewable Energy Laboratory. 2014-2015 Offshore Wind Technologies Report, NREL/TP-5000-64283.
http://www.nrel.gov/docs/fy15osti/64283.pdf.
5 | Environmental Impacts
| 5-44
turbines with a rated capacity of 6 to 8 MW, hub heights of 100 to 110 meters (328 to 361 feet)
with a rotor diameters of 152 to 164 meters (499 to 538 ft); a rotor diameter more than 50%
greater than the 100 meter (328 foot) rotor diameter of typical land-based wind turbines currently
being installed.
Environmental Impact Overview
Transporting, constructing and operating offshore wind infrastructure will create impacts, the
magnitude of which will depend substantially on the setting, local species, and local communities.
Offshore wind can cause impacts that affect human communities as well as terrestrial and marine
species. Though most impacts that occur from the construction and siting process are relatively
minor or temporary, long term operational impacts, such as impacts on the fishing industry, may
have greater effects. The installation of offshore wind farms can take between 1 and 2 years. Once
construction is complete maintenance to these facilities is completed daily, and the wind turbines
would be fully inspected and serviced around twice a year. Additional repair would be acquired as
needed.157 The design life of an offshore project is within the range of 20 to 25 years.158 Impacts
associated with decommissioning tend to be similar to the impacts associated with the construction
process.
Habitat Destruct ion and Fragmentation
Siting of offshore turbines may permanently displace habitat for a range of animals, including but
not necessarily limited to, finfish, reptiles, amphibians, crustaceans, insects, invertebrates, snails,
clams and plants. A 2010 report on offshore wind potential in Long Island concludes that project
siting should take into account the cumulative loss of plants and animals due to a wind project
when assessing environmental impacts, including losses from other nearby human-built structures
on the shoreline.159 Turbine foundations may harm benthic fauna, which could impact fish
availability. Changes in the distribution of fish could have cascading effects that could potentially
change the ecological makeup of an area. For example, an increased concentration of fish could
lead to a displacement in seabird population. Alternatively, there is some evidence that suggests
construction of wind turbines may also encourage habitat formation for fish. The turbines, for
example, may help to create artificial reefs, or serve as hard substrate for epibenthic colonizers,
which could attract fish, and in turn birds. As example, epibenthic organisms were found to
colonize two European offshore wind projects, although full colonies have not yet been observed,
potentially due to disruption from storms. 160
Habitat disruption may also impact the sea floor. For example, cable trenching can temporarily
result in increased turbidity. Seafloor impacts are variable depending on the construction period
length, the affected area, and the types of ecological communities concentrated in the area. For
example, increases in turbidity could decrease photosynthesis by primary producers such as
phytoplankton, which could in turn generate ecological effects for benthic organisms.
157 Bureau of Ocean Energy Management 2007. Alternative Energy Programmatic EIS. Pages 5-7, Page 5-69.
158 Bureau of Ocean Energy Management 2007. Alternative Energy Programmatic EIS. Page 5-7.
159 Ibid.
160 NYSERDA. 2010. Pre-Development Assessment of Resources for the Proposed Long Island – New York City Offshore
Wind Project Area.

5 | Environmental Impacts
| 5-45
Displacement can also occur for marine and coastal birds. The long term operation of offshore
wind turbines may also obstruct the flyway of major bird species. For example, on Long Island,
seabirds may also reduce their use of certain shoreline roosting, nesting and feeding sites due to
the barrier created by an array of wind turbines. This avoided area can require more energy
expenditure for birds and reduce their chance of survival. Similar to land-based wind, risk of
collision is also a concern associated with both construction and operation of offshore wind
turbines. However, the impacts of such impacts are not well characterized, and avoidance impacts
may vary significantly by site and by bird species. Habitat loss is likely to be the greatest for
species that are less able to move to different areas. While land birds often fly below the height of
the turbines, migrating birds flying above water may be closer to the height of the turbines,
creating the risk of collisions and a barrier for migration. Studies of offshore wind projects in
Europe have indicated that impacts on birds are minimal and that birds tend to avoid turbines,
although this may vary by species.
Finally, the construction of an offshore facility could potentially require the construction of new
onshore facilities. These could have impacts on coastal habitats and could potentially alter
hydrology or water quality. Reduced infiltration and increased runoff could change the hydrologic
characteristics of coastal habitats. Erosion could potentially occur, having long term impacts on
coastal vegetation. .161
Exhibit 5-22 summarizes the major taxonomic groups NYSERDA has identified as potentially
vulnerable to offshore wind development.
EXHIBIT 5-22. SUMMARY OF MAJOR TAX ONOMOIC GROUPS AND P OTENTIAL ADVERSE
EFFECTS FROM OFFSHORE WIND DEVELOPMENT
TAXA POTENTIAL ADVERSE EFFECTS
Benthic community (e.g., corals)
Direct mortality within turbine footprint and along transmission line during construction; disturbance and lethal or sublethal effects via silting/sedimentation.
Fish Disturbance during construction; displacement and attraction during operations.
Sea Turtles Mortality or injury from boat collisions; mortality, injury or disturbance from pile driving noise; behavioral changes.
Marine mammals Mortality or injury from boat collisions; injury or displacement from pile driving noise; displacement during operations; behavioral changes.
Birds Mortality or injury from collision with turbines; displacement during construction and operations
Bats Mortality or injury from collision with or effects from turbines during operations. Source: NYSERDA. 2015. Advancing the Environmentally Responsible Development of Offshore Wind Energy in New York State: A Regulatory Review and Stakeholder Perceptions. NYSERDA Report 15-16. Prepared by Wing Goodale and Kate Williams (Biodiversity Research Institute, Portland, ME). June.
161 Bureau of Ocean Energy Management 2007. Alternative Energy Programmatic EIS. Page 5-85

5 | Environmental Impacts
| 5-46
Noise Pol lut ion
Noise resulting from the construction process as well as long term operation can also be
potentially disruptive. For example, in the construction process, the noise associated with pile
driving may impact local and migratory fish, sea turtles, and marine mammals.162 Pile driving is
considered to be the most impactful noise resulting from construction; potentially perceptible to
seals and porpoises for “tens to hundreds of kilometers from construction sites.”163 Noise resulting
from construction activities may cause avoidance behaviors for a variety of nearby species;
however, it is not expected to have significant population impacts, due to its temporary nature.164
In addition to pile driving, other sources of noise that can occur from the construction process
include ship and barge operation, as well as additional traffic from helicopter and boat operation.
These can be temporarily disruptive for affected species. Noise resulting from these construction
activities can also cause temporary annoyance for nearby local communities, though the impacts
are not expected to be high.165
Following construction, normal operations could generate noise between 90 to 115 dB at
frequencies that are detectable by marine mammals. An acoustic monitoring study by the Cornell
Bioacoustics Research Program showed that several endangered whale species occur frequently in
the State of New York’s offshore planning area.166 Sound within these areas have the potential to
lead to the loss of traditional feeding or mating grounds, which ultimately can lead to long term
detrimental population effects.167 Larger organisms that have greater mobility would likely
temporarily avoid areas of significant construction activity.168
Bird and bat populations may also be affected by above water noise from wind turbines. Little is
known about how operational noise affects these species since these effects are not easily
distinguishable from other aspects of a structure’s presence. Avoidance or attraction behaviors
may occur, depending on the affected species. For local communities located near wind projects,
previous studies have found that the effects are relatively minimal. A study conducted by
Pedersen and Halmstad (2003) found very low levels of annoyance from noise for seven percent of
respondents, a relatively low percentage. Overall, operational noise resulting from offshore wind
technologies is expected to be relatively low.169
162 NYSERDA. 2010. Pre-Development Assessment of Avian Species for the Proposed Long Island – New York City Offshore
Wind Project Area.
163 Bureau of Ocean Energy Management 2007. Alternative Energy Programmatic EIS. Page 5-23.
164 Bureau of Ocean Energy Management 2007. Alternative Energy Programmatic EIS. Page 5-23.
165 Bureau of Ocean Energy Management 2007. Alternative Energy Programmatic EIS. Page 5-25.
166 New York Department of State. 2013. Offshore Atlantic Ocean Study. July. p. 35.
167 Bureau of Ocean Energy Management 2007. Alternative Energy Programmatic EIS. Page 5-47.
168 Bureau of Ocean Energy Management 2007. Alternative Energy Programmatic EIS. Page 5-91.
169 Bureau of Ocean Energy Management 2007. Alternative Energy Programmatic EIS. Page 5-26

5 | Environmental Impacts
| 5-47
Visual and Aesthet ic Resources
The construction process and the siting of wind turbines and transmission lines could also impact
visual resources, although this will depend on the viewshed being effected and the human use of
and response to changes in that viewshed.170 The development process often involves the
construction of one or more meteorological towers, which can be disruptive to a natural, coastal
landscape. Coastal areas are especially visually sensitive, because land use tends to include parks,
recreation areas, and high value property.171 Once offshore facilities are operational, the presence
of the structures could have visual impacts, which would manifest differently for offshore and
onshore viewers. Visibility from the shore would depend on the nature of the site. A 2005 study
conducted in Ireland found that 66 percent of individuals were initially opposed to a wind facility,
though following its construction, 62 percent of individuals noted the visual impact as positive. A
Danish study conducted in 2006 noted that most individuals had a neutral to positive perception of
visual impacts. However, cultural differences should be regarded in applying results derived from
European studies to sites in the U.S.172 In addition to on-land viewers, offshore viewers may be
affected as well. For example, recreational boating is common in Lake Ontario during summer
months, particularly in shipping corridors in the St. Lawrence River inlet region. These activities
are popular due to the natural viewshed, which could be impacted if there was development of a
large offshore wind installation.173
Cul tura l and Histor ical Resources
Impacts to fisheries are another concern across New York coastal waters. In particular, the
presence of offshore wind turbines may restrict the ability of commercial fishermen to fish in the
project area of an offshore wind installation, and such disruption may be particularly adverse for
fishermen that use mobile types of gear, such as dredges and trawls.174 On the Atlantic, New York
and New Jersey are host to seven and five major commercial fishing ports, respectively.175 In
2000, New York’s commercial fishing population included roughly 84,000 people. Six of New
York and New Jersey’s ports were within the top 90 ports in the United States in terms of pounds
landed and value of fish sold. 176 Project siting should also avoid other human-built infrastructure,
such as artificial reefs, dump sites, liquefied natural gas terminals, borrow areas, and important
170 NYSERDA.2010. Pre-Development Assessment of Natural Resources for the Proposed Long Island – New York City
Offshore Wind Project Area.
171 Bureau of Ocean Energy Management 2007. Alternative Energy Programmatic EIS. Page 5-116.
172 Bureau of Ocean Energy Management 2007. Alternative Energy Programmatic EIS. Page 5-123-5-129.
173 NYSERDA. 2010. New York’s Offshore Wind Energy Development Potential in the great lakes: Feasibility Study.”
174 For a more in-depth description of each fishing practice in the Atlantic surrounding New York, see: NYSERDA. 2010.
Pre-Development Assessment of Natural Resources for the Proposed Long Island – New York City Offshore Wind Project
Area.
175 NYSERDA. 2010. Pre-Development Assessment of Natural Resources for the Proposed Long Island – New York City
Offshore Wind Project Area.
176 For a more in-depth description of each port, see: NYSERDA.2010.Pre-Development Assessment of Resources for the
Proposed Long Island – New York City Offshore Wind Project Area.

5 | Environmental Impacts
| 5-48
areas for navigation.177 Avoiding areas used extensively for commercial shipping would help to
reduce the risk of collisions and interference with commercial shipping activities.178
Impacts on recreational fishing are not expected to be significant. In many cases, the area between
turbines is expected to be wide enough for recreational fishermen to use gear in the project area.
Furthermore, many common recreationally caught fish species may increase in abundance should
turbines facilitate the creation of artificial reefs.179
5.2.5 HYDROPOWER
Hydropower is one of the oldest forms of energy development, but conventional store-and-release
hydropower projects have prominent environmental impacts on river systems and the plants and
animals that are connected to and rely on river systems. According to the NYISO 2015 Gold
Book, hydropower accounts for 11 percent of New York’s summer generation capability, or a total
of 4,949 MW.180 Hydropower today is more focused on opportunities to develop new sources of
energy that do not require the construction of new dams or projects that result in significant
alteration of rivers and streams. Future hydropower development in New York is expected to
come in one of two forms:
Increased capacity from optimizing and/or upgrading infrastructure at existing
hydroelectric projects; and
Converting non-powered dams (NPDs) into energy producing dams.181
New investments are underway across the country to optimize, upgrade and/or augment operations
and infrastructure at existing hydroelectric projects to increase electricity generation. Most of the
country’s existing dams were built in the more than 60 years ago. By installing new technologies,
the lifespan and capacity of many of these older hydroelectric dams can be extended and/or
increased.
In 2012, DOE completed a nationwide assessment of the electric power generation potential at
existing dams that are not currently equipped to produce power (non-powered dams, or
177 NYSERDA. 2010. Pre-Development Assessment of Natural Resources for the Proposed Long Island – New York City
Offshore Wind Project Area.
178 NYSERDA. 2010. New York’s Offshore Wind Energy Development Potential in the great lakes: Feasibility Study.
179 NYSERDA. 2010. Pre-Development Assessment of Natural Resources for the Proposed Long Island – New York City
Offshore Wind Project Area.
180 NYISO. 2015 Load & Capacity Data “Gold Book.” April 2015.
181 In recent years, several firms have developed (or are developing) NPDs to generate electricity. Hydro Green Energy
has completed 28 projects in 13 states. American Municipal Power recently converted six NPDs on the Ohio River for a
total installed nameplate capacity of 350 MW. (Dean, Megan. Converting non-powered dams to create a varied
hydroelectric mix. August 17, 2012. Accessed January 24, 2016 at:
http://www.pennenergy.com/articles/pennenergy/2012/08/converting-non-powered.html.)

5 | Environmental Impacts
| 5-49
NPDs).182,183 DOE focused on approximately 54,000 existing dams, originally constructed for
non-power purposes, such as flood control, water supply, navigation, or recreation, with monthly
average flows of at least 1 cubic feet per second (cfs) that could be developed to produce
electricity.184,185
As shown in Exhibit 5-23, DOE’s study identified 33 sites in New York State with potential
energy capacity greater than one MW, estimating a cumulative energy potential of approximately
240 MW.
EXHIBIT 5-23. HYDROPOWER POTENTIAL AT EXISTING NPDS IN NEW YORK STATE (2012)
182 According to the DOE study, only three percent (or approximately 2,500 dams) of the nation’s approximately 80,000
existing dams generate electricity.
183 DOE. 2012. An Assessment of Energy Potential at Non-Powered Dams in the United States. Wind and Water Power
Program. Prepared by Oak Ridge National Laboratory. April.
184 The definition of NPD excludes auxiliary dams because the water they store already is associated with existing
hydropower production.
185 DOE’s analysis focused on the only on the energy production potential of NPDs, potential constraints that may arise
from dam/integrity issues, site feasibility, economic feasibility, multiple use conflicts socioeconomic consideration or
environmental costs and benefits were not addressed by DOE’s analysis.

5 | Environmental Impacts
| 5-50
As discussed in Chapter 4, incremental capacity from upgrades to existing hydroelectric projects
and retrofitting NPDs is expected to develop under the CES. Exhibits 5-23 and 5-24 summarize
the incremental capacity and generation gains under the various scenarios, for hydropower
upgrades and hydropower NPD, respectively. As shown in Exhibit 5-24, NPD retrofits are
expected to account for the majority (over 90 percent) of new hydropower energy development.
Hydropower upgrades are expected to occur from 2017-2026, while NPD retrofits are expected to
begin in 2019 and continue at varying levels through 2030. In terms of geographic distribution,
hydropower development is projected to occur primarily in upstate NYISO Zones, with the highest
amounts of development occurring in Mohawk Valley (Zone E) and Capital (Zone F); no
hydropower development is expected to occur in Zones D (North), I (Dunwoodie), J (New York
City) or K (Long Island). NPD retrofits are expected to occur in nearly all NYISO zones, while
hydropower upgrades are only expected in three NYISO zones: Zone B (Genesee), Zone E
(Mohawk Valley) and Zone F (Capital).
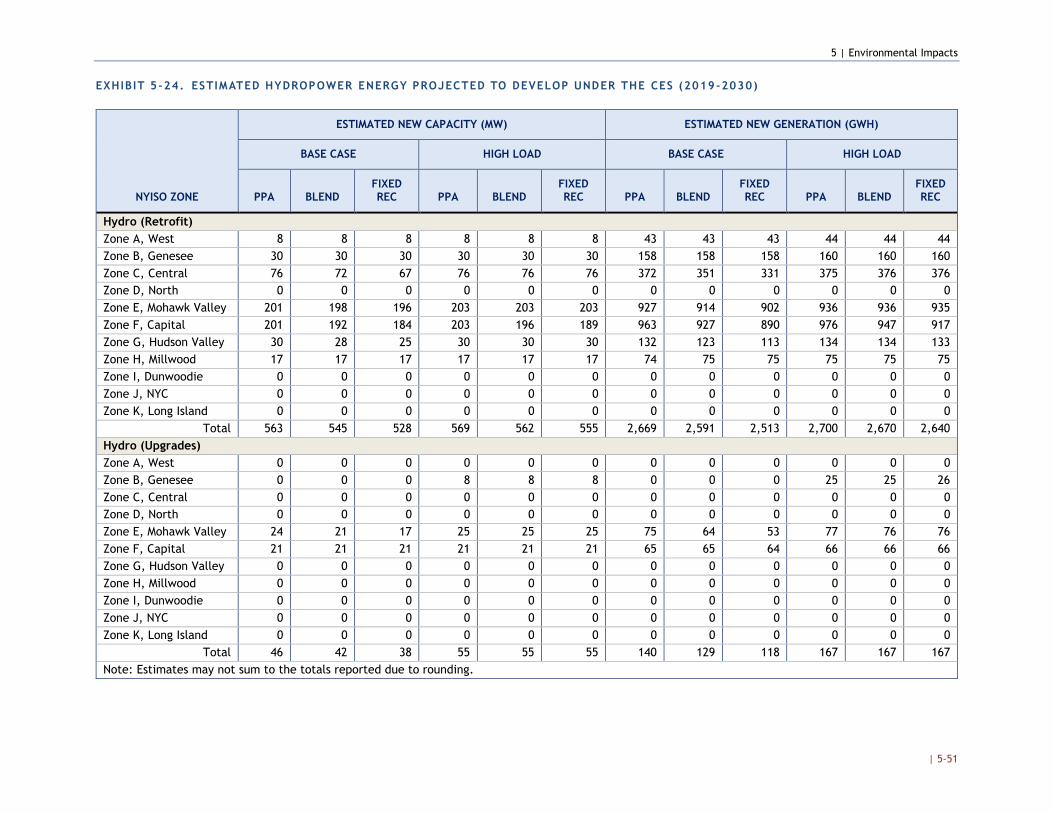
5 | Environmental Impacts
| 5-51
EXHIBIT 5 -24. ESTIMATED HYDROPOWER ENERGY PROJECTED TO DEVELOP UNDER THE CES (2019-2030)
NYISO ZONE
ESTIMATED NEW CAPACITY (MW) ESTIMATED NEW GENERATION (GWH)
BASE CASE HIGH LOAD BASE CASE HIGH LOAD
PPA BLEND FIXED REC PPA BLEND
FIXED REC PPA BLEND
FIXED REC PPA BLEND
FIXED REC
Hydro (Retrofit)
Zone A, West 8 8 8 8 8 8 43 43 43 44 44 44
Zone B, Genesee 30 30 30 30 30 30 158 158 158 160 160 160
Zone C, Central 76 72 67 76 76 76 372 351 331 375 376 376
Zone D, North 0 0 0 0 0 0 0 0 0 0 0 0
Zone E, Mohawk Valley 201 198 196 203 203 203 927 914 902 936 936 935
Zone F, Capital 201 192 184 203 196 189 963 927 890 976 947 917
Zone G, Hudson Valley 30 28 25 30 30 30 132 123 113 134 134 133
Zone H, Millwood 17 17 17 17 17 17 74 75 75 75 75 75
Zone I, Dunwoodie 0 0 0 0 0 0 0 0 0 0 0 0
Zone J, NYC 0 0 0 0 0 0 0 0 0 0 0 0
Zone K, Long Island 0 0 0 0 0 0 0 0 0 0 0 0
Total 563 545 528 569 562 555 2,669 2,591 2,513 2,700 2,670 2,640
Hydro (Upgrades)
Zone A, West 0 0 0 0 0 0 0 0 0 0 0 0
Zone B, Genesee 0 0 0 8 8 8 0 0 0 25 25 26
Zone C, Central 0 0 0 0 0 0 0 0 0 0 0 0
Zone D, North 0 0 0 0 0 0 0 0 0 0 0 0
Zone E, Mohawk Valley 24 21 17 25 25 25 75 64 53 77 76 76
Zone F, Capital 21 21 21 21 21 21 65 65 64 66 66 66
Zone G, Hudson Valley 0 0 0 0 0 0 0 0 0 0 0 0
Zone H, Millwood 0 0 0 0 0 0 0 0 0 0 0 0
Zone I, Dunwoodie 0 0 0 0 0 0 0 0 0 0 0 0
Zone J, NYC 0 0 0 0 0 0 0 0 0 0 0 0
Zone K, Long Island 0 0 0 0 0 0 0 0 0 0 0 0
Total 46 42 38 55 55 55 140 129 118 167 167 167
Note: Estimates may not sum to the totals reported due to rounding.

5 | Environmental Impacts
| 5-52
Environmental Impact Overview
Most of the environmental impacts of dam construction have already been incurred at both
existing hydroelectric projects and NPDs. The environmental impact of upgrading existing
hydroelectric projects or adding energy production facilities and equipment to existing NPDs is
anticipated to be relatively small in comparison to the impacts already incurred and as compared to
the benefits of more renewable energy generation.186
Adding energy production at existing NPDs requires installation of equipment designed to harness
energy from the existing water flow properties at a given site. As an example, the upgrade of an
existing hydroelectric facility was included under the Tenth Main Tier RPS solicitation. Owned
and operated by the Northbrook Lyons Falls, LLC (“Northbrook”), the Lyon Falls Mill
Development is an existing 5.6 MW hydroelectric facility located in Lewis County, NY on the
Black River just downstream from the confluence of the Moose and Black Rivers. Northbrook
plans to invest $40 million to double the generating capacity of the existing facility to a total
capacity of 11.2 MW.187 As part of this redevelopment, Northbrook will demolish the existing
main powerhouse and mothball the single-unit powerhouse. Northbrook will then replace the
decommissioned powerhouses with a single powerhouse containing two generating units.188 In
addition to the new powerhouse, the proposed project will also include a new 23 kV transmission
line to connect the new powerhouse to the existing National Grid transformer in the Franklin
Street Substation.189 The upgrades will not result in any changes to the existing dam and
associated ponds, and the facility will continue to operate in a run-of river mode, where the
amount of water that comes into the pond equals the amount of water that flows out of the pond
and down the Black River.190
The principal environmental impacts of upgrading existing hydroelectric plants and retrofitting
NPDs for energy generation occur primarily during the construction phase; these are the types of
impacts that are common to the construction of any type of energy project. As discussed in more
detail in Chapter 5 of the 2015 GEIS, construction site activities such as vegetation clearing,
grading, excavating, steel and building erection, equipment installation, and final restoration will
potentially result in short-term increases in air emissions, dust, noise, traffic, visual intrusion, soil
erosion, sediment disturbance and water pollution, and disturbance of local ecological and cultural
186 DOE. 2012. An Assessment of Energy Potential at Non-Powered Dams in the United States. Wind and Water Power
Program. Prepared by Oak Ridge National Laboratory. April; American Rivers. Making Hydropower Safer For Rivers.
Accessed on January 24, 2016 at: http://www.americanrivers.org/initiatives/dams/hydropower/.
187 Lyon Falls Hydro. Project Description. Accessed on February 1, 2016 at: http://www.lyonsfallshydro.com/project-
description/.
188 Lyon Falls Hydro. Public Meeting Presentation. Accessed on February 1, 2016 at:
http://www.lyonsfallshydro.com/wp-content/uploads/2015/03/Lyons-Falls-Joint-Agency-Public-Meeting-
Presentation_20150305.pdf.
189 Lyon Falls Hydro. Public Meeting Presentation. Accessed on February 1, 2016 at:
http://www.lyonsfallshydro.com/wp-content/uploads/2015/03/Lyons-Falls-Joint-Agency-Public-Meeting-
Presentation_20150305.pdf.
190 Lyon Falls Hydro. Project Description. Accessed on February 1, 2016 at: http://www.lyonsfallshydro.com/project-
description/.

5 | Environmental Impacts
| 5-53
resources. The magnitude of such impacts will vary according to the project location and other
site-specific characteristics.
In addition to the common environmental impacts of construction, hydroelectric project upgrades
and NPD retrofit projects may have impacts on water quality, for example, dissolved oxygen
levels, water temperature, pH, conductivity and total gas pressure. In most cases, these potential
impacts can be mitigated through development and implementation of appropriate operating,
management, and monitoring plans. For example, in response to concerns regarding dissolved
oxygen levels, many projects are required to develop and implement a water quality protection and
monitoring plan.
Another unique consideration for all hydropower projects is fish passage and protection; the
addition, upgrade or expansion of intake facilities and other infrastructure such as turbines can
increase the risk of fish entrainment and fish mortality. Advancements in the understanding of
hydropower operations and management of fishery resources, however, are often able to mitigate
such potential risks. At the aforementioned Lyon Falls Mill Development, Northbrook conducted
an extensive fish entrainment and impingement study. To minimize potential adverse effects to
fish, Northbrook proposed to provide a seasonal minimum fish movement flow of 45 cfs to be
released annually from March 15 through November 30 and install a seasonal trashrack overlays
with 1-inch clear-bar spacing.191 At the RRHP, the environmental assessment concluded that
survival of fish through the project’s powerhouse would be about 95 percent for small and
moderate-sized fish and 88 percent for larger fish; translating to a relatively low fish mortality rate
of between five and 12 percent, a level not expected to have significant effects on the project area
fishery.
5.2.6 ANAEROBIC DIGESTION
As discussed in the 2015 GEIS, anaerobic digestion is a series of biological processes in which
bacteria break down biodegradable material in an oxygen-free environment. The product of this
process is a biogas mixture and a digestate (liquids and solids). The biogas mixture consists of
primarily methane (approximately 50 to 70 percent)192, carbon dioxide (approximately 30 to 50
percent) and trace amounts of other gases, such as hydrogen sulfide (H2) and ammonia (NH3).
This biogas mixture can serve as a fuel to generate heat, hot water, or electricity. Digestate is the
remaining solid and/or liquid residuals from the anaerobic digestion process. Exhibit 5-25
presents a simplified graphic of the anaerobic digestion process.
191 Lyon Falls Hydro. Public Meeting Presentation. Accessed on February 1, 2016 at:
http://www.lyonsfallshydro.com/wp-content/uploads/2015/03/Lyons-Falls-Joint-Agency-Public-Meeting-
Presentation_20150305.pdf.
192 Research is ongoing to develop improvements in anaerobic digestion processes designed to increase the proportion of
methane in generated biogas. EPA recently highlighted a DOE project at Argonne National Laboratory (ANL) that
succeeded in developing an enhanced anaerobic digestion process, which produces biogas with more than 90 percent
methane from sludge generated by municipal wastewater treatment plants. (USDA, EPA and DOE. 2015. Biogas
Opportunities Roadmap Progress Report. December. 20 pp. Accessed January 23, 2016 at:
http://www.epa.gov/agstar/biogas-opportunities-roadmap-report.)
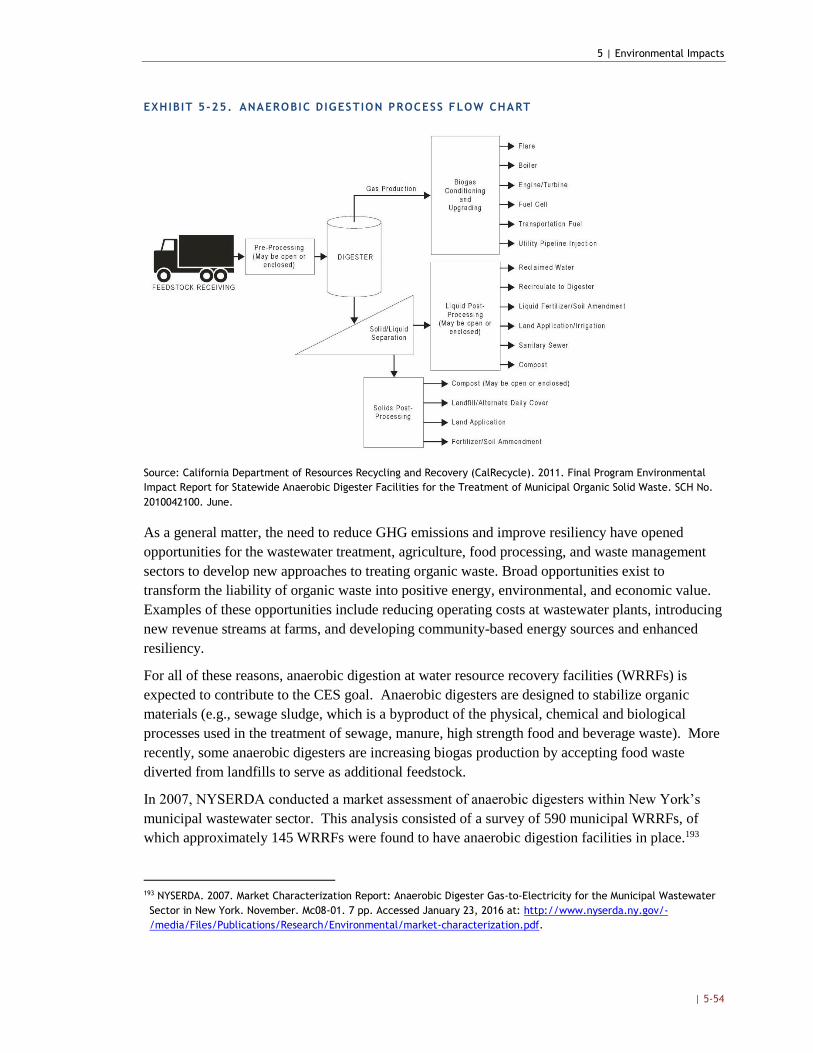
5 | Environmental Impacts
| 5-54
EXHIBIT 5-25. ANAEROBIC DIGESTION PROCESS FLOW CHART
Source: California Department of Resources Recycling and Recovery (CalRecycle). 2011. Final Program Environmental
Impact Report for Statewide Anaerobic Digester Facilities for the Treatment of Municipal Organic Solid Waste. SCH No.
2010042100. June.
As a general matter, the need to reduce GHG emissions and improve resiliency have opened
opportunities for the wastewater treatment, agriculture, food processing, and waste management
sectors to develop new approaches to treating organic waste. Broad opportunities exist to
transform the liability of organic waste into positive energy, environmental, and economic value.
Examples of these opportunities include reducing operating costs at wastewater plants, introducing
new revenue streams at farms, and developing community-based energy sources and enhanced
resiliency.
For all of these reasons, anaerobic digestion at water resource recovery facilities (WRRFs) is
expected to contribute to the CES goal. Anaerobic digesters are designed to stabilize organic
materials (e.g., sewage sludge, which is a byproduct of the physical, chemical and biological
processes used in the treatment of sewage, manure, high strength food and beverage waste). More
recently, some anaerobic digesters are increasing biogas production by accepting food waste
diverted from landfills to serve as additional feedstock.
In 2007, NYSERDA conducted a market assessment of anaerobic digesters within New York’s
municipal wastewater sector. This analysis consisted of a survey of 590 municipal WRRFs, of
which approximately 145 WRRFs were found to have anaerobic digestion facilities in place.193
193 NYSERDA. 2007. Market Characterization Report: Anaerobic Digester Gas-to-Electricity for the Municipal Wastewater
Sector in New York. November. Mc08-01. 7 pp. Accessed January 23, 2016 at: http://www.nyserda.ny.gov/-
/media/Files/Publications/Research/Environmental/market-characterization.pdf.

5 | Environmental Impacts
| 5-55
Exhibit 5-26 depicts the distribution of WRRFs in New York State and the highlights those with
anaerobic digestion facilities in place.194
EXHIBIT 5-26. DISTRIBUTION OF NEW YORK STATE WASTEWATER TREATMENT PLANTS
(2007)
While the 145 WRRFs identified with anaerobic digestion facilities in place were estimated to
represent 75 percent of the State’s overall wastewater treatment capacity, NYSERDA’s market
characterization also found a significant level of untapped potential across these same WRRFs.
Specifically, NYSERDA found that a number of the 145 WRRFs with anaerobic digestion
facilities in place did not (at the time of the survey) operate their digesters, operated their digesters
at a reduced rate, or relied on undersized anaerobic digestion facilities. To the extent that existing
WWTPs with anaerobic digestion facilities in place have access to food waste and other organic
materials, further increases in electricity generation may also be possible.195
The prime potential for farm-based digester system is at New York State’s large dairy farms with
750 or more mature dairy cattle equivalents (MDCEs) in their herds. About 190 of these farms
have already installed a digester system or applied for incentives for one. These herds on these
farms total over 300,000 MDCE which can provide enough manure feedstock to produce about 80
MW of renewable power. If the increased focus on food waste management results in significant
quantities added to these farm digesters, the total power output could double. If it is projected that
194 The American Biogas Council estimates 1,241 WWTPs across the U.S. currently using anaerobic digesters. They
estimate an additional 2,440 WWTPs which could support an anaerobic digester. (American Biogas Council. Frequent
Questions. Accessed January 23, 2016 at: https://www.americanbiogascouncil.org/biogas_questions.asp.)
195 Ibid.

5 | Environmental Impacts
| 5-56
the CEF and CES initiatives are sufficient to bring enough farms to adopt anaerobic digestion so
that half of the potential is reached by 2030, then the output range would be between 40 and 80
MW depending on the quantities of food waste treated.
As shown in Exhibit 5-27, the CES is expected to result in the development of a total of 53-54
MW of new generation at existing WWTPs with anaerobic digesters. Of this amount, the majority
(34 MW, or 64 percent) is expected to be developed at WWTPs in Zone J, New York City.
Exhibit 5-27 displays the projections for the Base Case PPA scenario, although the amount of
anaerobic digestion capacity and generation were approximately equal between scenarios.
EXHIBIT 5-27. ESTIMATED ANAEROBIC DIGESTION ENERGY TO DEVELOP UNDER CES
(2019-2030)
NYISO ZONE
ESTIMATED NEW CAPACITY (MW) ESTIMATED NEW GENERATION (GWH)
BASE CASE(1) HIGH LOAD (2) BASE CASE(1) HIGH LOAD (2)
Zone A, West 5 5 28 28
Zone B, Genesee 4 4 25 26
Zone C, Central 2 2 15 15
Zone D, North 0 0 0 0
Zone E, Mohawk Valley 0 0 0 0
Zone F, Capital 2 2 12 12
Zone G, Hudson Valley 0 0 0 0
Zone H, Millwood 0 0 0 0
Zone I, Dunwoodie 3 3 19 19
Zone J, NYC 34 34 208 210
Zone K, Long Island 3 3 20 20
TOTAL 53 54 325 330
NOTE: Estimates may not sum to the totals reported due to rounding.
(1) Figures are the same across all Base Case scenarios.
(2) Figures are the same across all High Load scenarios.
Environmental Impact Overview
Anaerobic digestion is generally considered a mechanism by which existing operations at
WWRFs, agricultural facilities, and food and beverage manufacturing facilities can be improved.
Implementation of the CES in this case will have minimal adverse environmental impacts given
the expectation that it will result in more optimal use of the anaerobic digesters that are already
installed. Anaerobic digestion at WRRFs will reduce the volume of sewage sludge that ultimately
is transported off-site for disposal. In the agricultural context, anaerobic digestion reduces the
odors associated with manure storage, such that the manure can be applied to fields close to the
time the crops will need the nutrients inherent in the manure. Moreover, in cases where anaerobic

5 | Environmental Impacts
| 5-57
digestion facilities are adapted to accept food waste, such operations can further reduce waste that
would otherwise end up in landfills.196
Anaerobic digestion can also reduce fugitive greenhouse gas emissions that would otherwise be
released at landfill sites during natural organic decomposition processes, as they are typically
equipped with flares that convert fugitive methane emissions into CO2 and water.197 When
captured methane is converted into electricity on-site, such operations may contribute to
greenhouse gas reductions, the magnitude of any such contributions, however, will depend on
facility-specific factors such as the nature of the feedstock.
Digestate, the effluent from the anaerobic digestion process, typically consists of liquids,
remaining biomass, and inorganic solids. The liquid is typically separated from the solids.
Depending on the chemical composition of the liquids, some can be re-used as irrigation water for
agricultural crops, recycled for use in composting processes, or converted into fertilizer.
Similarly, some solids can be used for a variety of value added products, including fertilizer,
compost, and soil amendments for agricultural crops.198 In some cases, however, residual
digestate may require additional treatment and/or disposal in landfills; however, the overall net
impact of anaerobic digestion on waste production is generally positive. Specifically, compared to
operations without anaerobic digestion, the waste generated may be reduced in volume, is
chemically stable and therefore nearly odorless, and contains fewer levels of harmful pathogens.199
196 Further discussion of the impacts of anaerobic digester systems on farms is provided in the 2015 GEIS at Chapter
5.2.2.
197 While carbon dioxide is a byproduct of anaerobic digestion, using the Intergovernmental Panel on Climate Change’s
Fifth Assessment Report, EPA’s Inventory of Greenhouse Gas Emissions and Sinks estimates that the 100-year global
warming potential of methane is 28-36 times more effective at trapping heat in the atmosphere than carbon dioxide.
Accessed: 4/11/2016 at https://www3.epa.gov/climatechange/ghgemissions/gwps.html.
198Use of digestate as soil amendments for agricultural crops can create further benefits by reducing the need for
synthetic fertilizers and pesticides and/or increase water retention properties when applied to farmlands; EPA. 2015.
Anaerobic Digestion and its Applications. EPA/600/R-15/304. October. 17 pp.
199California Department of Resources Recycling and Recovery (CalRecycle). 2011. Final Program Environmental Impact
Report for Statewide Anaerobic Digester Facilities for the Treatment of Municipal Organic Solid Waste. SCH No.
2010042100. June.
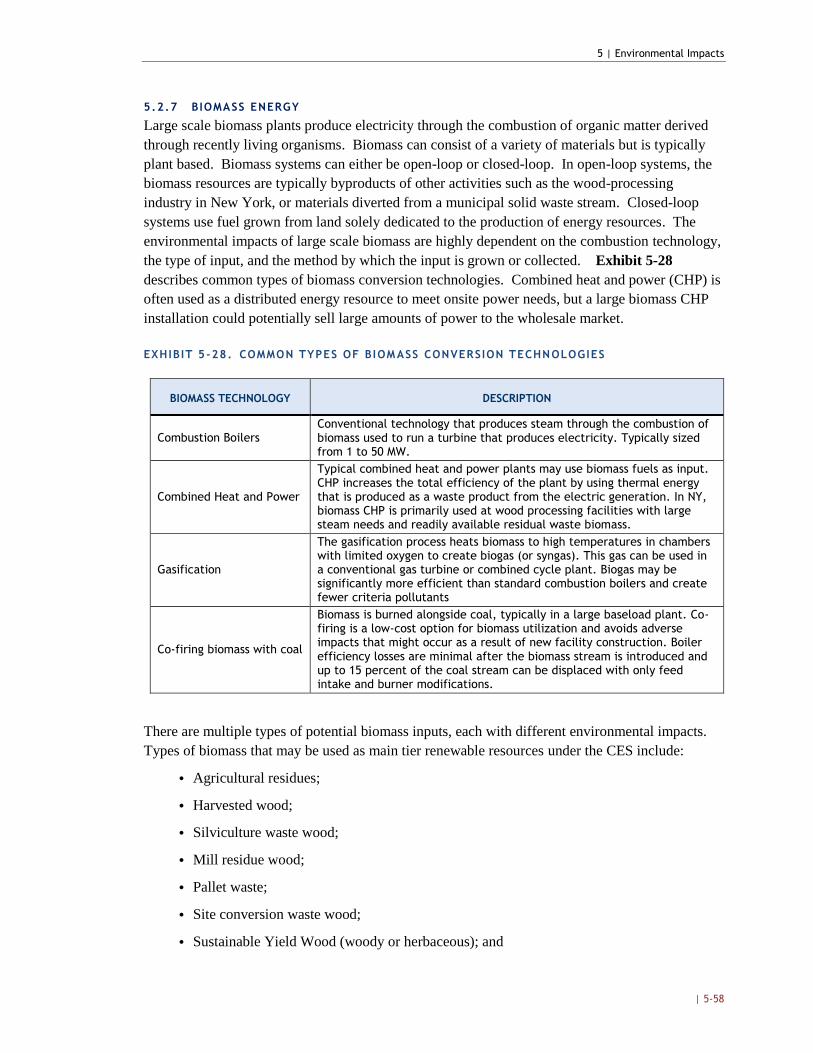
5 | Environmental Impacts
| 5-58
5.2.7 BIOMASS ENERGY
Large scale biomass plants produce electricity through the combustion of organic matter derived
through recently living organisms. Biomass can consist of a variety of materials but is typically
plant based. Biomass systems can either be open-loop or closed-loop. In open-loop systems, the
biomass resources are typically byproducts of other activities such as the wood-processing
industry in New York, or materials diverted from a municipal solid waste stream. Closed-loop
systems use fuel grown from land solely dedicated to the production of energy resources. The
environmental impacts of large scale biomass are highly dependent on the combustion technology,
the type of input, and the method by which the input is grown or collected. Exhibit 5-28
describes common types of biomass conversion technologies. Combined heat and power (CHP) is
often used as a distributed energy resource to meet onsite power needs, but a large biomass CHP
installation could potentially sell large amounts of power to the wholesale market.
EXHIBIT 5-28. COMMON TYPES OF BIOM ASS CONVERSION TECHNOLOGIES
BIOMASS TECHNOLOGY DESCRIPTION
Combustion Boilers Conventional technology that produces steam through the combustion of biomass used to run a turbine that produces electricity. Typically sized from 1 to 50 MW.
Combined Heat and Power
Typical combined heat and power plants may use biomass fuels as input. CHP increases the total efficiency of the plant by using thermal energy that is produced as a waste product from the electric generation. In NY, biomass CHP is primarily used at wood processing facilities with large steam needs and readily available residual waste biomass.
Gasification
The gasification process heats biomass to high temperatures in chambers with limited oxygen to create biogas (or syngas). This gas can be used in a conventional gas turbine or combined cycle plant. Biogas may be significantly more efficient than standard combustion boilers and create fewer criteria pollutants
Co-firing biomass with coal
Biomass is burned alongside coal, typically in a large baseload plant. Co-firing is a low-cost option for biomass utilization and avoids adverse impacts that might occur as a result of new facility construction. Boiler efficiency losses are minimal after the biomass stream is introduced and up to 15 percent of the coal stream can be displaced with only feed intake and burner modifications.
There are multiple types of potential biomass inputs, each with different environmental impacts.
Types of biomass that may be used as main tier renewable resources under the CES include:
Agricultural residues;
Harvested wood;
Silviculture waste wood;
Mill residue wood;
Pallet waste;
Site conversion waste wood;
Sustainable Yield Wood (woody or herbaceous); and

5 | Environmental Impacts
| 5-59
Urban Wood Waste and Refuse Derived Fuel.200
NYSDEC regulations define “eligible biomass” that is considered “sustainably harvested” for
purposes of the CO2 Budget Trading Program, 6 NYCRR Part 242. 201 NYSDEC policy provides
guidance for determining whether sources of woody biomass, and unadulterated wood and wood
residues are considered “sustainably harvested” so that NYSDEC can determine on a case-by case
whether emissions from that source would be sequestered in sustainable managed forests. In
addition, under the RPS program, biomass obtained from forest resources must meet state
guidelines for sustainable harvesting. 202
The biomass sources listed above can generally be divided into three categories – wood and
agricultural waste products, forest (silviculture) resources, and dedicated energy crops. Each
category of biomass will have different environmental impacts dependent on the site-specific
implementation. The remainder of this section discusses the general, potential environmental
impacts of large-scale biomass implementation.
Exhibit 5-29 presented the expected growth in capacity for biomass under the CES, confined to
three NYISO zones: Zone A (West), Zone B (Genesee), and Zone C (Central).
200 NYS DPS. 2016. Staff White Paper on Clean Energy Standard. CASE 15-E-0302. January 25.
201 NYSDEC. 2010. DEC Program Policy. DAR-12 / “Sustainably Harvested” Determination for Purposes of “Eligible
Biomass,” Part 242.
202 Antares Group, Inc. 2014. New York State Renewable Portfolio Standard Biopower Guide. Prepared for NYSERDA. July
22.
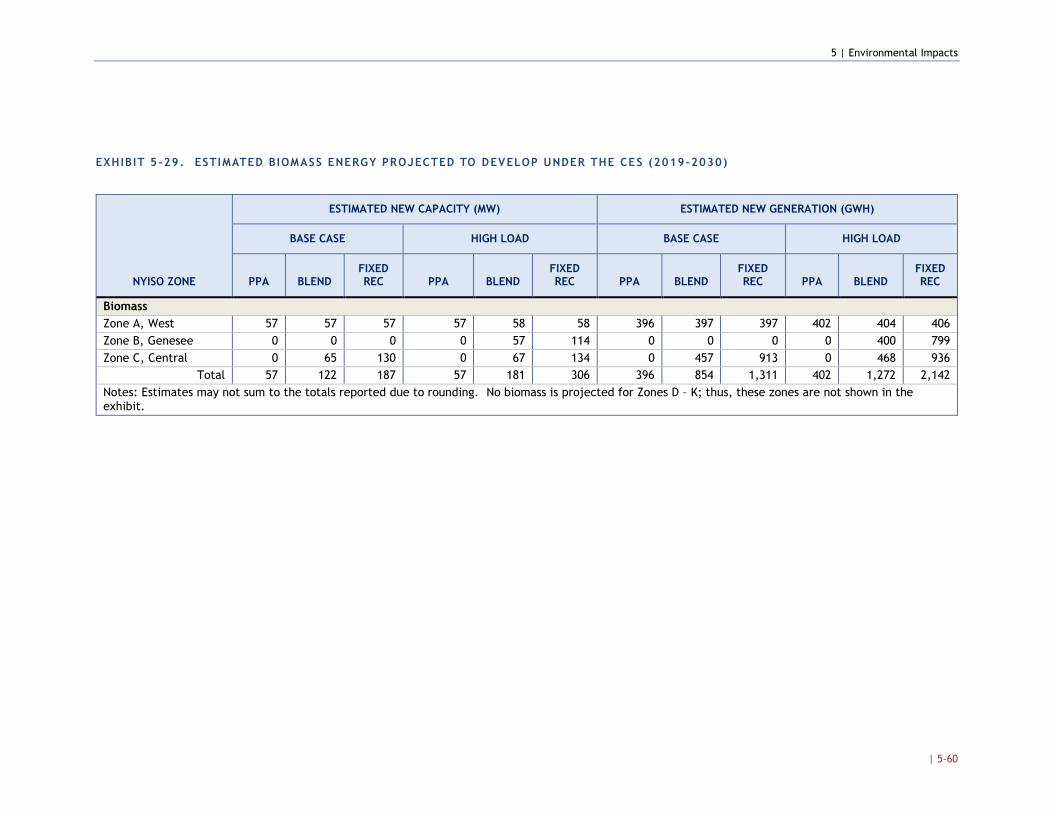
5 | Environmental Impacts
| 5-60
EXHIBIT 5 -29. ESTIMATED BIOMASS ENERGY PROJECTED TO DEVELOP UNDER THE CES (2019-2030)
NYISO ZONE
ESTIMATED NEW CAPACITY (MW) ESTIMATED NEW GENERATION (GWH)
BASE CASE HIGH LOAD BASE CASE HIGH LOAD
PPA BLEND FIXED REC PPA BLEND
FIXED REC PPA BLEND
FIXED REC PPA BLEND
FIXED REC
Biomass
Zone A, West 57 57 57 57 58 58 396 397 397 402 404 406
Zone B, Genesee 0 0 0 0 57 114 0 0 0 0 400 799
Zone C, Central 0 65 130 0 67 134 0 457 913 0 468 936
Total 57 122 187 57 181 306 396 854 1,311 402 1,272 2,142
Notes: Estimates may not sum to the totals reported due to rounding. No biomass is projected for Zones D – K; thus, these zones are not shown in the exhibit.
5 | Environmental Impacts
| 5-61
Land Use
Expanded use of biomass may have a variety of potential land use impacts depending on the type
of conversion technology and the type of input. Impacts associated with the construction of a
main-tier biomass facility will be similar to a comparably sized non-biomass electric generation
facility including: converted land area and short-term increases in dust, noise levels, traffic, visual
intrusion, and ecological disturbances. Note that these impacts do not apply to co-fired facilities,
which do not require significant new construction.
Increased closed-loop biomass under the CES may result in more significant land use changes as
existing agricultural, pastoral, or forest land is converted to bio-fuel crops.203 A large scale shift of
agricultural land from food crops to energy crops may impact food prices or drive the expansion of
agriculture to currently forested land. However, negative impacts may be mitigated by NYSDEC
regulations which require that biomass be sustainably harvested. For example, under the RPS
program, biomass obtained from forest resources must meet state guidelines for sustainable
harvesting. 204 To the extent that pastoral land, marginal land, or land currently cultivating food
crop is converted to energy crops, increased biofuels may positively impact native wildlife, as
many biofuels have a higher wildlife quality than traditional agricultural crops.205 For example,
the predominant energy crop in New York State consists of fast growing willow trees. There are
currently 1,200 acres of land in New York dedicated to willows for energy use. When properly
managed, these crops can increase wildlife diversity and protect riparian habitats compared to
traditional agricultural crops. DOE estimates that about 190 million acres of land in the United
States is available for energy crops such as switchgrass, poplar trees, and willow trees.206 One
hectare of land area dedicated to willow trees can produce enough fuel to generate approximately
16 MWh annually.207 The Northeast has an estimated two million hectares of marginal land no
longer used for agriculture that could be suitable for biomass production. Willow trees also take
up nutrients and heavy metals and may be used to effectively treat a number of waste sources
including municipal waste, sewage sludge, and distillery effluent.
New York State has large amounts of forest land which, if managed and harvested carefully and
sustainably, could provide biomass fuels without increasing GHG emissions or significantly
impacting wildlife or recreational activities. To the extent that currently un-forested lands (e.g.,
marginal and nutritionally depleted areas) are converted to grow biomass, the net increase in
vegetation may also reduce carbon levels. However, if conversion of lands to grow biomass results
203 USDA Farm Service Agency. 2010. Biomass Crop Assistance Program: Programmatic Environmental Impact Statement.
June. Accessed January 25, 2016 at: https://www.fsa.usda.gov/Internet/FSA_File/bcapfinalpeis062510.pdf.
204 Antares Group, Inc. 2014. New York State Renewable Portfolio Standard Biopower Guide. Prepared for NYSERDA. July
22.
205 USDA Farm Service Agency. 2010. Biomass Crop Assistance Program: Programmatic Environmental Impact Statement.
June. Accessed January 25, 2016 at: https://www.fsa.usda.gov/Internet/FSA_File/bcapfinalpeis062510.pdf.
206 U.S. EPA. 2008. State Bioenergy Primer, Chapter Two: What is Bioenergy? Accessed January 25, 2016 at:
http://www3.epa.gov/statelocalclimate/documents/pdf/bioenergy_chapter2.pdf
207 Assuming 35% generating capacity; Biomass Energy Centre. 2011. Potential Outputs of Biofuels Per Hectare, Per
Annum. Accessed January 25, 2016 at:
http://www.biomassenergycentre.org.uk/portal/page?_pageid=75,163231&_dad=portal&_schema=PORTAL

5 | Environmental Impacts
| 5-62
in habitat fragmentation, this may result in negative effects on wildlife species; the effects of
habitat fragmentation are described above in Section 5.2.2.
Water Use and Qual ity
Water use for large scale biomass projects may also vary depending on the type of conversion
technology and biomass input. Water quality may increase if food crops are converted to energy
crops. Energy crops typically require less potassium, agricultural lime, herbicides, insecticides,
and other agricultural chemicals but may increase use of nitrogen and phosphorus. Planting of
energy crops may decrease sedimentation and nutrient and chemical deposition into surface bodies
of water. If non-agricultural land is converted to energy crops, local water sedimentation may
increase. The water requirement for energy crops is not significantly different than food crops.
Water is also required during the biomass combustion process. In a typical biomass plant, most of
the water will be used as part of the cooling system to condense the steam for reuse. The water
requirements for biomass combustion are similar to a similarly-sized fossil fuel power plant.
Air Emiss ions
Air emissions associated with biomass vary depending on the conversion technology and biofuel
input. Emissions would typically decrease or remain the same for biomass that is co-fired with
natural gas compared to natural gas-only electricity. Sulfur emissions would be reduced in direct
proportion to the amount of biomass used in the plant because most biomass inputs have near zero
sulfur content. Low mercury content in biomass would lead to a similar reduction in mercury
emissions. Impacts on other criteria pollutants are less certain – NOx emissions may either increase
or decrease depending on site specific conditions (e.g., properties of the fuel, type of emissions
control technologies, or operating conditions at the plant). Total particulates do not typically
increase after introducing biomass, but emissions of particulate matter smaller than 10 microns
(PM10) and 2.5 microns (PM2.5) may increase. In some cases minor, increases in carbon
monoxide may occur.208 The impact of biomass on criteria pollutants in co-firing applications is a
subject of ongoing research, and is highly dependent on site specific factors.
Stand-alone combustion of biomass would likely have similar impacts to co-firing applications.
Specific impacts would be highly dependent on the emissions controls at any particular power
plant. Biomass plants tend to be smaller than typical fossil fuel-fired plants and are often less
efficient and less well equipped with emissions controls than existing natural gas plants. If not
carefully planned and implemented utility scale biomass may result in increased carbon monoxide
and PM10 particulates than an equivalent amount of fossil fuel-based generation. Particulate
emissions from biomass plants between 500 kW and 10 MW may vary significantly depending on
208 NYS DPS. 2004. Final Generic Environmental Impact Statement In CASE 03-E-0188—Proceeding on Motion Of the
Commission Regarding a Retail Renewable Portfolio Standard. August 26. Accessed January 25, 2016 at
http://www.dps.ny.gov/NY_RPS_FEIS_8-26-04.pdf.

5 | Environmental Impacts
| 5-63
technology and operation.209 Other air pollutants such as mercury and sulfur would be reduced.210
Levels of NOx emissions from biomass facilities may vary between 60 mg/MJ and 170 mg/MJ.
Emissions of all criteria pollutants may be reduced through biomass gasification. Criteria
pollutant emissions from biomass gasification plants are similar to emissions from conventional
natural gas plants and substantially lower than coal or oil plants.211
Direct CO2 emissions from biomass combustion are high compared to most fossil fuels but if
sustainably managed the CO2 emitted during combustion can be equivalent to the CO2 sequestered
during growth of the stock, depending on the timeframe being considered. Whether a biomass
system can be considered carbon neutral depends on a variety of factors, including, but not limited
to: 212
The feedstock type;
The management and procurement of the feedstock;
The feedstock transportation method;
The energy generation technology; and,
The timeframe to replenish the feedstock.
Overall lifecycle GHG emissions are highly dependent on site specific factors. Some biomass
fuels are more carbon intensive than others; thus a robust accounting is required before the lifetime
GHG emissions can be determined. Depending on the factors listed above, closed-loop cycles
may be carbon neutral if the carbon released during combustion is equivalent to the carbon
absorbed while the biomass is grown. Open-loop cycles may result in GHG emissions reductions
because the combustion process produces primarily CO2 while natural biomass decay produces
CO2 and methane. Methane has more global warming potential than CO2; decreases in methane
production result in a lifecycle reduction of greenhouse gases. Note that the net emissions of a
biomass system are dependent on the timeframe being considered, as both sequestration and
natural processes of decay occur over long periods of time.
Health Impacts
Increased biomass combustion could have adverse health impacts. Biomass is often associated
with high concentrations PM10. Humans may not filter these fine particulates through the nose,
and they may end up in the lungs or alveolar region. Long exposure to fine particulates may cause
209 Nussbaumer et al. 2008. Particulate Emissions from Biomass Combustion in IEA Countries: Survey on Measurements
and Emissions Factors. On behalf of International Energy Agency Bioenergy Task 32, Swiss Federal Office of Energy.
Accessed January 25, 2016 at: http://www.ieabcc.nl/publications/Nussbaumer_et_al_IEA_Report_PM10_Jan_2008.pdf.
210 Assuming 35% generating capacity; Biomass Energy Centre. 2011. Potential Outputs of Biofuels Per Hectare, Per
Annum. Accessed January 25, 2016 at:
http://www.biomassenergycentre.org.uk/portal/page?_pageid=75,163231&_dad=portal&_schema=PORTAL.
211 NYS DPS. 2004. Final Generic Environmental Impact Statement In CASE 03-E-0188—Proceeding on Motion Of the
Commission Regarding a Retail Renewable Portfolio Standard. August 26. Accessed January 25, 2016 at
http://www.dps.ny.gov/NY_RPS_FEIS_8-26-04.pdf.
212 Congressional Research Service (2011) Is Biopower Carbon Neutral? CRS Report for Congress 7-5700
http://biomassboard.gov/pdfs/crs_biopower_carbon_neutral.pdf.

5 | Environmental Impacts
| 5-64
health problems such as increased morbidity and exacerbation of respiratory and cardiovascular
ailments.213
Waste Impacts
Increased large scale biomass may result in decreased wood waste because clean residual wood
would be used in biomass burners instead of landfill disposal. Increased biomass combustion may
result in increased solid waste such as construction wastes, solid biomass boiler ash, stillage cake
and syrup, and lignin.214 Solid biomass ash and lignin are potentially useful consumer products.
Large scale biomass facilities may also produce significant amounts of bottom ash requiring
disposal either in landfills or spread over area lands. Biomass produces less hazardous waste
overall compared to coal combustion.215
5.3 LONGER-TERM EFFECTS
Longer-term effects are those occurring later in time and farther away, but which are still
reasonably foreseeable. In considering the longer-term effects of the REV and CEF, the 2015
GEIS describes the long-term policy outcomes anticipated from implementation of the REV and
CEF, designed to increase system reliability and resiliency, reduce energy-related carbon
emissions and lower the overall costs of power across all sectors of the economy. The 2015 GEIS
further recognizes that the changes envisioned by the REV and CEF within New York’s energy
industry will not result from completion of one or two large actions but rather will evolve over
long periods of time in response to numerous separate individual initiatives. These same
principles apply to the impacts of the CES.
As discussed in the 2015 GEIS, the greatest longer-term, indirect environmental impact of the
REV and CEF, and by extension the CES, is the reduction in the amount of the State’s energy
generated from fossil fuel-based sources of energy. Fossil fuel power plants are the second largest
(and most concentrated) source of emissions, accounting for approximately 16 percent of all
greenhouse gas emissions in New York State.216 Reductions in the State’s use of and reliance on
fossil fuel electric generation will in turn result in significant environmental and public health
benefits. Section 5.3 of the 2015 GEIS discusses the potential indirect effects of the REV and
CEF on criteria air pollutants; greenhouse gases; water, land and ecological resources; and
aesthetic, visual, cultural and historical resources; these discussions also apply to the CES and are
therefore incorporated by reference here.
213 Nussbaumer et al. 2008. Particulate Emissions from Biomass Combustion in IEA Countries: Survey on Measurements
and Emissions Factors. On behalf of International Energy Agency Bioenergy Task 32, Swiss Federal Office of Energy.
Accessed January 25, 2016 at: http://www.ieabcc.nl/publications/Nussbaumer_et_al_IEA_Report_PM10_Jan_2008.pdf.
214 U.S. DOE Golden Field Office, Office of Energy Efficiency and Renewable Energy. 2010. Final Environmental Impact
Statement for the Proposed Abengoa Biorefinery Project near Hugoton, Stevens County, Kansas. August. DOE/EIS-0407.
Accessed January 25, 2016 at: http://www.energy.gov/sites/prod/files/EIS-0407-FEIS-Summary-2010.pdf
215 NYS DPS. 2004. Final Generic Environmental Impact Statement In CASE 03-E-0188—Proceeding on Motion Of the
Commission Regarding a Retail Renewable Portfolio Standard. August 26. Accessed January 25, 2016 at
http://www.dps.ny.gov/NY_RPS_FEIS_8-26-04.pdf.
216 NYSERDA. 2014. New York State Greenhouse Gas Inventory and Forecast: Inventory 1990-2011 and Forecast 2012-
2030. Final Report. April. Accessed September 26, 2014 at: http://www.nyserda.ny.gov/-
/media/Files/EDPPP/Energy-Prices/Energy-Statistics/greenhouse-gas-inventory.pdf.

5 | Environmental Impacts
| 5-65
In the 2015 GEIS, Section 5.3 recognizes that reductions in NOx, SOx and particulate matter
associated with avoided fossil fuel will lead to improvements in visual and cultural resources in
New York by increasing visibility and reducing particle pollution that can damage and stain
historical buildings and monuments. While such improvements are expected to accrue from
implementation of the CES, the CES’ focus on development of LSR may alter the visual and
cultural landscape of the State’s more rural areas in upstate New York, where large scale solar and
wind facilities are more likely to be developed. As discussed in Section 5.2, large-scale solar and
wind operations have relatively large land use requirements. When such operations are sited in
flat areas in rural communities, the industrial nature of solar and wind facilities can offer strong
contrasts to the relatively rural landscape that they inhabit. To the extent that a specific rural or
agricultural community becomes host to multiple LSR projects, adverse impacts on the
community’s aesthetic, visual and cultural resources are possible. In addition, expanded use of
biomass could result in a shift of agricultural land from food crops to energy crops and may drive
the expansion of agriculture to currently forested land, which could result in habitat
fragmentation.217
5.4 OTHER UNANTICIPATED TECHNOLOGIES
The CES is expected to be implemented over a 13-year timeframe (2017 to 2030). It is possible
that increased levels of demand for large scale renewable energy will spur innovation and the
development of currently unanticipated technologies. As noted in the 2015 GEIS, New York State
ranks second nationally in cleantech patents and the number of cleantech patents registered each
year is on the rise.218 As technology changes and new technologies are developed, there is
potential for unforeseen environmental impacts. Depending on the type of technology, it is
possible that construction activities or operation and maintenance of the technology could create
environmental impacts. To the extent that any new technologies further displace or promote the
displacement of fossil fuel electricity generation, or lower electricity consumption, such
technologies could generate positive environmental impacts. The net impact of other
unanticipated technologies is, by its nature, unknown at this time.
5.5 CUMULATIVE IMPACTS
As previously discussed, the CES is a program complementary to the Commission’s other clean
energy efforts. In the Staff White Paper, DPS Staff describes the REV and the CES as programs
which “will promote each other’s achievement.” In addition to the REV, the CES will also work
in concert with other, ongoing, State energy initiatives, including, but not necessarily limited to:
(1) the Clean Energy Fund, (2) the draft 2014 New York State Energy Plan; (3) the New York
Green Bank (Case 13-M-0412); and (4) the NY-Sun Initiative. In addition to State-level clean
energy initiatives, a number of energy-related efforts at the federal level may interact with the
CES, these other non-State initiatives are described in the Section 5.5 of 2015 GEIS and
incorporated by reference herein.
217 USDA Farm Service Agency. 2010. Biomass Crop Assistance Program: Programmatic Environmental Impact Statement.
June. Accessed January 25, 2016 at: https://www.fsa.usda.gov/Internet/FSA_File/bcapfinalpeis062510.pdf.
218 SRI International. New York State Clean Energy Technologies Innovation Metrics 2012. Final Report. Prepared for
NYSERDA. May 2013. Accessed on September 23, 2014 at: https://www.nyserda.ny.gov/Energy-Innovation-and-
Business-Development/Innovation-and-Business-Development/Tracking-Clean-Tech-Innovation-for-New-York.aspx.

5 | Environmental Impacts
| 5-66
By considering cumulative impacts, the intent of SEQRA is to identify actions that may be
insignificant by themselves, but which can degrade environmental resources over time when
considered together. These considerations of potential cumulative effects include:
As indicated by the modeling of alternative scenarios in Chapter 4 and the assessment of
broader impacts in Chapters 4 and 5, the CES is anticipated to engender overall positive
environmental impacts, primarily by reducing the State’s use of, and dependence on,
fossil fuels.
As noted in Chapters 4 and 5, many of the locations that would be considered for new
large scale land-based wind and solar projects are in upstate New York. To the extent that
some communities become host to multiple installations of new LSR projects, certain
cumulative negative impacts (e.g., aesthetic effects of large scale wind and solar energy or
loss of agricultural lands) may constrain the overall positive impacts of the CES. As
discussed further in Chapter 6, a number of regulations, policies, and best practices serve
as measures that will mitigate adverse impacts that may arise from activities undertaken in
response to the CES.
In general, the State and Federal policies and initiatives identified in this section as likely
to interact with the CES are designed to reduce the adverse economic, social and
environmental impacts of fossil fuel energy resources by increasing the use of clean
energy resources and technologies.
Cumulative site-specific impacts of the CES are not known at this time and are beyond the
scope of this SEIS. This SEIS provides a generic description of the potential
environmental impacts of the CES on land and water resources, agriculture, cultural and
aesthetic resources, terrestrial and aquatic ecosystems and other individually relevant
impacts. Appropriate federal, state, and local permitting and environmental review
processes will identify, evaluate, and mitigate potential site-specific impacts.
6 | Regulatory Framework and Mitigation of Potential Adverse Impacts
| 6-1
CHAPTER 6 | REGULATORY FRAMEWORK AND MITIGATION OF POTENTIAL
ADVERSE IMPACTS
Consistent with 6 NYCRR §§617.9(b)(5)(iv) and 617.11(d)(5) of SEQRA, this chapter describes
the variety of measures available to minimize or avoid, to the maximum extent practicable
(incorporating all practicable mitigation measures), potentially adverse environmental impacts that
may result from clean energy activities that may be implemented under the REV and CEF
programs.
This chapter incorporates by reference the information presented in Chapter 6 of the 2015 2015
GEIS. This chapter provides key updates to Chapter 6 in two parts:
Section 6.1: Federal and State Regulations Relevant to Operations of Nuclear Facilities,
and
Section 6.2: Federal and State Regulations and Guidance Potentially Relevant to Utility
Scale Clean Energy Activities.
This chapter is not intended to provide an exhaustive list of potentially applicable regulations or
mitigation measures, but rather a general overview of the key regulations and means by which
adverse environmental impacts may be mitigated for a specific project or groups of similar
projects. The focus is on applicable key federal and State regulations not previously discussed in
the 2015 2015 GEIS.
6.1 FEDERAL AND STATE REGULATIONS RELEVANT TO OPERATIONS OF NUCLEAR
FACILITIES
One key mitigation measure is compliance with existing federal and State regulations, which are
designed specifically to protect human health and the environment from activities that could
otherwise result in significant and/or adverse impacts. The U.S. Nuclear Regulatory Commission
(NRC) regulates commercial nuclear power plant through licensing, inspection, and enforcement.
The NRC mission states, “The NRC licenses and regulates the Nation's civilian use of radioactive
materials to protect public health and safety, promote the common defense and security, and
protect the environment.”219 Exhibit 6-1 provides an overview of NRC’s regulatory process used
to accomplish their mission. The Occupational Safety and Health Administration coordinate with
the NRC to regulate radiological and industrial safety at operating facilities.220
219 U.S. NRC. 2015. About NRC. Accessed January 25, 2016 at http://www.nrc.gov/about-nrc.html.
220 Memorandum of Understanding between the U.S. Nuclear Regulatory Commission and the Occupational Safety and
Health Administration. September 6, 2013.

6 | Regulatory Framework and Mitigation of Potential Adverse Impacts
| 6-2
New York State also plays a role in ensuring the safe use of radioactive materials. Through
various laws, the New York Department of Labor, New York State Department of Health, New
York State Department of Environmental Conservation, and New York City Department of Health
and Mental Hygiene Regulations all play a role in nuclear facility regulations.221
EXHIBIT 6-1. U.S. NRC’S REGULATORY PROCESS
6.2 FEDERAL AND STATE REGULATIONS AND GUIDANCE POTENTIALLY RELEVANT TO
UTILITY SCALE CLEAN ENERGY ACTIVITIES
The section focuses on applicable federal and state regulations and guidance specific to utility
scale clean energy activities (e.g., solar and wind) not previously discussed in the 2015 GEIS. The
2015 2015 GEIS discusses key federal and State regulations that may apply to clean energy
activities during construction, operation, and closure of a specific project. Regulations that are
particularly applicable to utility-scale renewable energy projects include site-specific permitting
221 A complete list of the New York State regulations pertaining to nuclear facilities can be found at NRC: NMSS – State
Regulations and Legislation Accessed January 25, 2016 at https://scp.nrc.gov/rulemaking.html#NY.

6 | Regulatory Framework and Mitigation of Potential Adverse Impacts
| 6-3
processes, the State Environmental Quality Review (SEQR) process, and Article 10 of the Public
Service Law. Under Article 10, a state siting board is responsible for siting and permitting LSR
projects with a generating capacity greater than 25 MW. The board is required to enforce
environmental laws and standards except for local ordinances it specifically determines should not
be applied to a particular project.222
The environmental impacts of a proposed renewable energy project under 25 MW in size are
typically assessed in accordance with SEQRA by the host town board, regional planning
commission, county agency, or other local authority. The town or local agency may impose
mitigation measures that it finds are necessary to minimize any adverse environmental impacts.223
As a result of the RPS, state and many local agencies are familiar and experienced in applying the
array of regulations, guidance and tools available to review LSR projects (on a project-by-project
basis) and to identify appropriate mechanisms to avoid and/or minimize the potential adverse
impacts of LSR projects.224 For example, under the RPS program, biomass obtained from forest
resources must meet state guidelines for sustainable harvesting.225
In addition to the federal and state regulations identified in the 2015 2015 GEIS, Exhibit 6-2
provides a list of additional regulations, leases, permits, reviews, or guidelines that may be
applicable to utility scale wind facilities. Regulations and guidance applicable to utility scale solar
installations were discussed in the 2015 GEIS.
222 NYS Board on Electric Generation Siting and the Environment. Accessed January 25, 2016 at:
http://www.dps.ny.gov/SitingBoard/.
223 6 NYCRR Part 617.
224 As example, under the Main Tier component of the RPS, as of December 31, 2014, 56 projects representing
approximately 1,854 MW were operating with another nine projects, representing 181 MW, under development.
Collectively, these projects included two biomass facilities, 10 landfill biogas operations, two anaerobic digester biogas
facilities, 25 hydroelectric facilities, 23 wind farms, and three fuel cell facilities. (NYSERDA. 2015. New York State
Renewable Portfolio Standard. Annual Performance Report through December 31, 2015. March. Accessed February 1,
2016 at: http://www.nyserda.ny.gov/All-Programs/Programs/Main-Tier/Documents.)
225 Antares Group, Inc. 2014. New York State Renewable Portfolio Standard Biopower Guide. Prepared for NYSERDA. July
22.

6 | Regulatory Framework and Mitigation of Potential Adverse Impacts
| 6-4
EXHIBIT 6-2. REGULATIONS, PERMITS, AND REVIEW PROCESSES POTENTIALLY
APPLICABLE FOR UTILI TY SCALE WIND PROJECTS
LEVEL
REGULATION, LEASE, PERMIT,
REVIEW, OR GUIDELINE
RELEVANT LAWS AND STATUTORY
AUTHORITY
POTENTIALLY
APPLICABLE
TECHNOLOGIES
State
Guidelines for Conducting Bird
and Bat Studies at Commercial
Wind Energy Projects226
ECL Articles 1, 3, 11
Wind
State Tidal Wetland Permit
Tidal Wetlands Act ECL Article
25;
6 NYCRR Part 661
Offshore Wind
Federal
Bureau of Ocean Energy
Management, Regulation, and
Enforcement OCS Leasing
Process227
30 CFR Parts 250, 285, and 290
Offshore Wind
Federal Nuclear Regulatory Commission
—Energy Reorganization Act228 Pub.L. 93-438
Offshore Wind
Local Local Waterfront Revitalization
Program
Article 42 of the Executive Law
N.Y. GEN. CITY LAW §28-a; N.Y.
TOWN LAW §272-a; N.Y. VILLAGE
LAW §7-700 et seq.
Offshore Wind
State Coastal Erosion Hazard Areas229 ECL § 34-0102. ECL Article 34
and 6 N.Y.C.R.R. Part 505
Offshore Wind
Interstate Great Lakes Laws and
Agreements
Boundary Waters Treaty of 1909,
Convention on Great Lakes
Fisheries, Great Lakes Basin
Compact—Establishment of the
Great Lakes Commission, Great
Lakes Charter of 1985, Great
Lakes Fishery Act of 1956, Great
Lakes Fish and Wildlife
Restoration Act of 1990, and the
Joint Strategic Plan for the
Management of Great Lakes
Fisheries230
Offshore Wind in
the Great Lakes
226 NYS DEC Division of Fish, 2009. Wildlife and Marine Resources. Guidelines for Conducting Bird and Bat Studies at
Commercial Wind Energy Projects. August. Accessed January 25, 2016 at:
http://www.dec.ny.gov/docs/wildlife_pdf/finwindguide.pdf.
227 NYSERDA. 2010. Pre-Development Assessment of Natural Resources for the Proposed Long Island- New York City
Offshore Wind Project Area. Final Report 10-22 Task 3A. October. Accessed January 26, 2016 at:
http://www.linycoffshorewind.com/PDF/10-22_linyc-collaborative-resources.pdf.
228 NYSERDA. 2010. New York’s Offshore Wind Energy Development Potential in the Great Lakes: Feasibility Study. Final
Report 10-04. April. (p.142)
229 NYSERDA. 2010. New York’s Offshore Wind Energy Development Potential in the Great Lakes: Feasibility Study. Final
Report 10-04. April. (p.142)
230 NYSERDA. 2010. New York’s Offshore Wind Energy Development Potential in the Great Lakes: Feasibility Study. Final
Report 10-04. April. (p.142)

6 | Regulatory Framework and Mitigation of Potential Adverse Impacts
| 6-2
LEVEL
REGULATION, LEASE, PERMIT,
REVIEW, OR GUIDELINE
RELEVANT LAWS AND STATUTORY
AUTHORITY
POTENTIALLY
APPLICABLE
TECHNOLOGIES
State
Guidelines for Agricultural
Mitigation for Wind Power
Projects231
Department of Agriculture and
Markets
Wind
State Assessing and Mitigating Noise
Impacts232 DEP-00-1
Utility scale wind
and solar
State Assessing and Mitigating Visual
Impact233 DEP-00-2
Utility scale wind
and solar
231 NYS Department of Agriculture and Markets. 2013. Guidelines for Agricultural Mitigation for Wind Power Projects.
Revised July 10, 2013. Accessed January 26, 2016 at:
http://www.agriculture.ny.gov/ap/agservices/Wind_Farm_Guidelines.pdf
232 NYS DEC Division of Environmental Permits. Assessing and Mitigating Noise Impacts. Issuance Date: October 6, 2000.
Revised February 2, 2001. Accessed January 25, 2016 at:
http://www.dec.ny.gov/docs/permits_ej_operations_pdf/noise2000.pdf
233 NYS DEC Division of Environmental Permits. Assessing and Mitigating Visual Impacts. Issuance Date: July 31, 2000.
Accessed January 25, 2016 at: http://www.dec.ny.gov/docs/permits_ej_operations_pdf/visual2000.pdf.

7 | Unavoidable Adverse Impacts
| 7-1
CHAPTER 7 | UNAVOIDABLE ADVERSE IMPACTS
Chapter 5 discusses the potential generic impacts that may result from implementation of the
proposed CES. The purpose of the SEIS is not to evaluate specific energy projects and their site-
specific impacts. As previously discussed, adverse environmental impacts could result from
individual but as yet unidentified projects implemented in the future. However, the generic review
presented in Chapter 5 does not identify any unavoidable environmental impact of a type that
cannot be mitigated through one or more of the techniques discussed in Chapter 6 (Regulatory
Framework and Mitigation of Potential Adverse Impacts). Unavoidable impacts of the “no action”
alternative are discussed in Chapter 4.

8 | Irreversible and Irretrievable Commitment of Resources
| 8-1
CHAPTER 8 | IRREVERSIBLE AND IRRETRIEVABLE COMMITMENT OF
RESOURCES
The development of the proposed CES will not, in itself, result in irreversible or irretrievable
commitment of resources because no specific environmental resource or project site will be
affected by the action. The construction of new renewable energy projects in the future in
response to the CES may raise such concerns, but these will be identified in site-specific
environmental analyses and avoided or minimized in accordance with SEQRA and other
applicable law. Where the CES proposes to extend support to existing generation suppliers,
including upstate nuclear power plants, any irreversible or irretrievable commitment has already
been authorized under those facilities’ permits and licenses.

9 | Growth Inducing Aspects and Socioeconomic Impacts
| 9-1
CHAPTER 9 | GROWTH-INDUCING ASPECTS AND SOCIOECONOMIC IMPACTS
This chapter discusses the potential growth-inducing aspects and socioeconomic impacts of the
proposed CES, in the context of the expected outcomes of the REV and CEF proceedings. Thus,
this chapter incorporates by reference the information presented in Chapter 9 of the 2015 GEIS
and updates the information provided there, focusing on relevant factors that may assist in
understanding the likely impacts of the Commission’s development and implementation of the
CES.
As discussed in Chapter 9 of the 2015 GEIS, the exact mix of clean energy resources and
technologies that will be implemented under the REV and CEF programs is uncertain, although
the general direction of those policies is known. In contrast, the proposed CES will establish a
mandate directed at a more specific composition of the State’s energy supply portfolio. The
information provided in this chapter focuses on the potential impacts that may result from the
implementation of the CES 50 by 30 goal and the CES nuclear maintenance program.
Specifically, this chapter contains the following sections:
Section 9.1: Potential Benefits Categories;
Section 9.2: Potential Program Costs;
Section 9.3: Impacts on Growth and Community Character; and
Section 9.4: Environmental Justice Impacts.
9.1 POTENTIAL BENEFITS CATEGORIES
Successful implementation of the REV and CEF, the additional measures proposed to meet the
CES 50 by 30 goal, and the CES nuclear maintenance program (NMP) will generate several types
of public benefits. This section first provides a qualitative description of the growth-inducing
aspects of the programs that lead to potential public benefits. Next, this section presents a
summary of potential regional economic impacts of continued generation of energy by eligible
nuclear plants and the construction of additional LSR supply resources.
Categor ies of Potent ia l Publ ic Benefi ts
Depending on the mechanisms employed, increasing the supply of renewable resources to meet 50
percent of New York State’s demand by 2030 is expected to result the following types of public
benefits:
Public health benefits due to avoided emissions of GHG and criteria air pollutants. As
increased use of renewable energy sources leads to improved air quality, society benefits
from reduced health impacts and increased employee productivity. For example, as air
quality improves, state health care expenditures for treatment of asthma, acute bronchitis,
and respiratory conditions may be reduced.

9 | Growth Inducing Aspects and Socioeconomic Impacts
| 9-2
Ecosystem services benefits related to the reduction in emissions and due to reduced
impacts on land and water uses, as renewable sources are incorporated into New York’s
energy supply portfolio in lieu of investment in fossil fuel sources. For example, “wind
and solar energy require essentially no water to operate, and thus do not pollute water
resources or strain supply by competing with agriculture, drinking water systems, or other
important water needs.” 234
Climate change benefits related to the reduction in the State’s reliance on fossil fuel
energy. As discussed in Chapter 3 of the 2015 GEIS, climate change is expected to
increase air temperatures which will in turn intensity water cycles through increased
evaporation and precipitation. In New York, more intense water cycles are expected to
lead to increases in localized flash and coastal flooding, increases in the frequency and
intensity of extreme precipitation and extreme heat events, longer summer dry periods,
lower summer flows in large rivers, lower groundwater tables, and higher river and in-
stream water temperatures.235
Measures proposed under the CES 50 by 30 goal and CES nuclear maintenance program may also
serve to maintain fuel diversity. It is expected that the addition of new renewable electricity
supplies may reduce the State’s reliance on natural gas. Such changes may also reduce the
exposure to fossil fuel-related energy security challenges and supply interruptions, thereby
increasing the security of New York's electric energy supply.
Regional Economic Benefits
In addition to the regional economic benefits outlined in the 2015 GEIS, the CES programs are
likely to have regional economic benefits for New York State. This section describes regional
economic benefits of the CES NMP as well as from increased large scale renewable energy under
the CES 50 by 30 goal.
The proposed CES NMP would provide support to eligible licensed nuclear facilities to continue
operations for a significant period of time, estimated for these purposes to last until expiration of
their valid NRC operating licenses. The continued operation of nuclear facilities will preserve
jobs and tax revenues, which in turn have secondary regional economic impacts. The net impact
of the proposed action on regional development will depend upon many dynamic, unknown factors
as technology continues to change and the economy grows and shifts. However, employment
levels at the various nuclear power plants provide an indication of the importance of continued
operations to local and regional economies.
234 Union of Concerned Scientists. Benefits of Renewable Energy Use. Accessed on January 26, 2015 at:
http://www.ucsusa.org/clean_energy/our-energy-choices/renewable-energy/public-benefits-of-
renewable.html#.VqfE4fkrL0M.
235 Rosenzweig, C., W. Solecki, A. DeGaetano, M. O’Grady, S. Hassol, P. Grahborn (Eds). 2011. Responding to Climate
Change in New York State. Synthesis Report prepared for NYSERDA. Accessed on September 10, 2014 at:
http://www.nyserda.ny.gov/-/media/Files/Publications/Research/Environmental/EMEP/climaid/ClimAID-
synthesisreport.pdf.
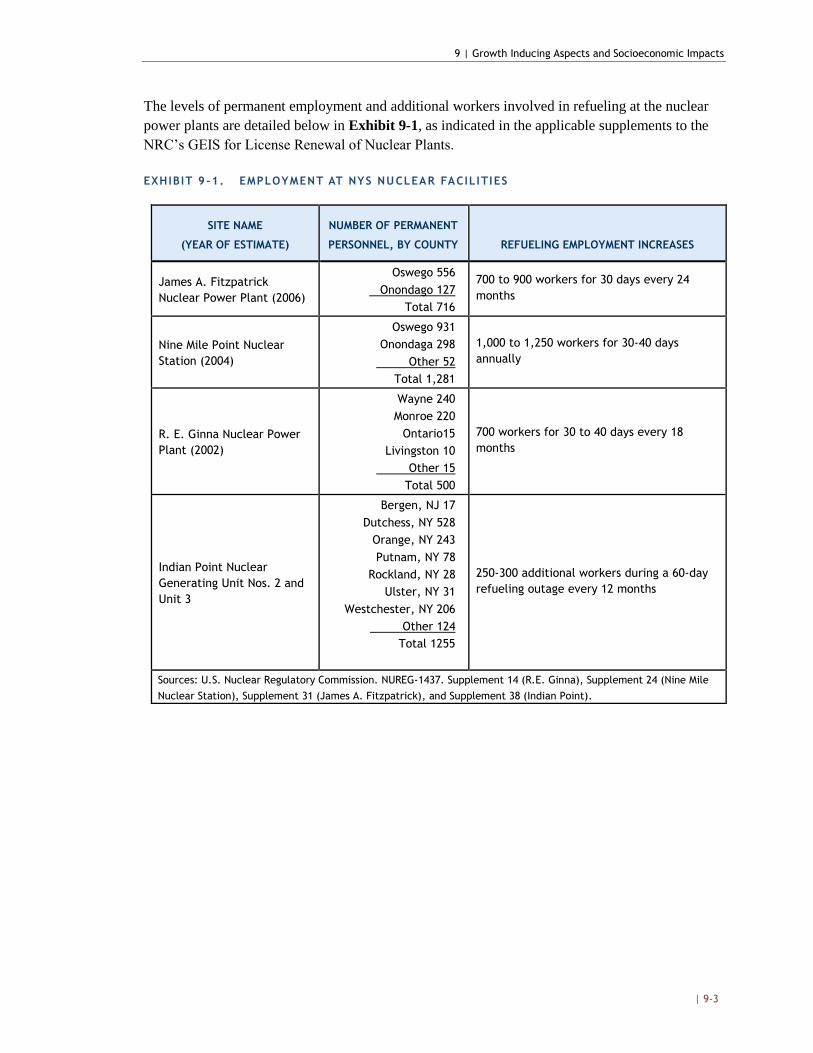
9 | Growth Inducing Aspects and Socioeconomic Impacts
| 9-3
The levels of permanent employment and additional workers involved in refueling at the nuclear
power plants are detailed below in Exhibit 9-1, as indicated in the applicable supplements to the
NRC’s GEIS for License Renewal of Nuclear Plants.
EXHIBIT 9-1. EMPLOYMENT AT NYS NUCLEAR FACILITIES
SITE NAME
(YEAR OF ESTIMATE)
NUMBER OF PERMANENT
PERSONNEL, BY COUNTY REFUELING EMPLOYMENT INCREASES
James A. Fitzpatrick
Nuclear Power Plant (2006)
Oswego 556
Onondago 127
Total 716
700 to 900 workers for 30 days every 24
months
Nine Mile Point Nuclear
Station (2004)
Oswego 931
Onondaga 298
Other 52
Total 1,281
1,000 to 1,250 workers for 30-40 days
annually
R. E. Ginna Nuclear Power
Plant (2002)
Wayne 240
Monroe 220
Ontario15
Livingston 10
Other 15
Total 500
700 workers for 30 to 40 days every 18
months
Indian Point Nuclear
Generating Unit Nos. 2 and
Unit 3
Bergen, NJ 17
Dutchess, NY 528
Orange, NY 243
Putnam, NY 78
Rockland, NY 28
Ulster, NY 31
Westchester, NY 206
Other 124
Total 1255
250-300 additional workers during a 60-day
refueling outage every 12 months
Sources: U.S. Nuclear Regulatory Commission. NUREG-1437. Supplement 14 (R.E. Ginna), Supplement 24 (Nine Mile
Nuclear Station), Supplement 31 (James A. Fitzpatrick), and Supplement 38 (Indian Point).

9 | Growth Inducing Aspects and Socioeconomic Impacts
| 9-4
To understand the regional economic impact of the continued operations of a nuclear power plant,
it is important to consider not only the direct impacts (i.e., employment at the plant, the value of
electricity produced at the plant), but also secondary impacts that result as the plant and employees
spending filters through the regional
economy.236 A fact sheet produced by the
Nuclear Energy Institute presents average
direct and indirect economic and
employment effects for an average nuclear
power plant, including:237
Each year, operation of a nuclear
plant generates 400 to 700
permanent jobs; and,
The average nuclear plant
generates approximately $470
million in economic output or
value annually (including both
direct and secondary effects); this
figure includes more than $40
million in total labor income.
Maintaining nuclear plant operations will
also preserve tax payments (or payments in lieu of taxes) to the various taxing entities in the rural
areas where the qualifying plants are located. For example, for the Fitzpatrick plant, Entergy has
an agreement with Oswego County, the Town of Scriba and the Mexico Central Schools to make
standardized annual payments in lieu of taxes. A recent article indicates that Entergy pays Oswego
County $17.3 million in yearly property tax payments.238 To the extent the NMP enables
continued operation of nuclear facilities that would otherwise retire, the action would result in
benefits to the regional economy in the form of stable wages, jobs and tax revenues.
Construction of additional large scale renewable energy resources to meet the CES 50 by 30 goal
may provide similar regional economic benefits. According to a recent study conducted by the
236 Two recent reports produced by the Brattle Group calculate the total contribution of New York’s nuclear power
plants and New York’s upstate nuclear power plant’s to the State economy (see
http://www.brattle.com/system/publications/pdfs/000/005/229/original/New_York's_Upstate_Nuclear_Power_Plants'
_Contribution_to_the_State_Economy.pdf?1449526735 and http://www.nuclearmatters.com/resources/reports-
studies/value-of-nuclear-new-york, accessed January 21, 2016). These reports represent a what-if analysis assuming
that the power currently produced by the plants would be generated by natural gas power plants, rather than assessing
the impacts that result from continued operation of the plant. To assess the operating impacts of a nuclear power
plant, it is more applicable to model the employment and output directly attributable to the plant.
237 NEI. 2015. Fact Sheets. Nuclear Power Plants Benefit State and Local Economies. February. Accessed on January 16,
2016 at: http://www.nei.org/Master-Document-Folder/Backgrounders/Fact-Sheets/Nuclear-Power-Plants-Contribute-
Significantly-to-S.
238 Knauss, T. 2015. Entergy to close FitzPatrick nuclear plant in Oswego County. November 2. Accessed on January 23,
2015 at:
http://www.syracuse.com/news/index.ssf/2015/11/entergy_fitzpatrick_nuclear_plant_in_oswego_county.html.
Case Study: R.E. Ginna Nuclear Power Plant
A recent study looked at the economic impacts of the
R.E. Ginna Nuclear Power Plant. Given the level of
employment supported by the plant, the analysis
found that Ginna’s operation generates $358 million of
economic output annually statewide. This study
indicates that for every dollar of output from Ginna,
the state economy produces $1.52. Nuclear power
plants also provide regional economic benefits in the
form of tax payment as well. The Ginna plant is the
largest taxpayer in the county where it is located,
Wayne County, contributing more that $10 million in
state and local property tax and sales tax in 2014.
Source: Nuclear Energy Institute. 2015. Economic Impacts of
the R.E. Ginna Nuclear Power Plant. February. Accessed on
January 21, 2016, at:
http://www.nei.org/CorporateSite/media/filefolder/Policy/Papers/G
innaEconomicBenefits.pdf?ext=.pdf.

9 | Growth Inducing Aspects and Socioeconomic Impacts
| 9-5
Brookings Institution, in 2010 New York had 5,147 jobs related to wind power (approximately
double the number of wind related jobs in 2003), and 556 jobs related to solar power. 239 The
direct macroeconomic benefits of renewable energy include the creation of jobs in construction
and operation of new facilities, payments to the State and localities, payments for fuel and land
leases, and in-state purchase of materials and services. While there is uncertainty regarding the
technologies that will be implemented and the locations, new resources will need to be built and
operated. This will result in increased jobs and regional output due to construction activity and
operations. Studies have generally found that renewable energy deployment increases gross jobs
in and related to the renewable energy sector; however, it is harder to understand the net impacts
given other energy generation sources that may be displaced. As noted in a recent retrospective
study of the impacts of meeting RPS throughout the U.S., labor-intensive solar PV installations
account for the majority of construction jobs, while established wind plants account for the
majority of O&M jobs created as a result of RPS in the U.S.240 Exhibit 9-2 illustrates the
projected magnitude of wind and solar capacity by NYISO zone, providing an indication of the
spatial distribution of potential new wind and solar energy. As illustrated, the highest potential for
new development of wind and solar resources occurs in NYISO Zone E (Mohawk Valley).
Large scale wind development may produce significant regional economic impacts. A 100
megawatt (MW) wind farm can require 120 job-years of labor and generate an estimated $4
million in wages during the three-year construction period.241 A 2005 study estimated the nominal
economic impacts of utility scale wind to range from $9.71 to $10.66 per MWh for projects
varying in size from 50 MW up to 350 MW.242 NYSERDA’s Frequently Asked Questions (FAQs)
on large scale wind projects indicates that approximately one O&M job is created for every 10 to
20 turbines.243
A recent report reviewed NYSERDA’s investments in 18 projects under RPS contracts, including
both wind and hydropower projects.244 This study indicated that for every $1 spent on the
acquisition of RPS Attributes for the Current Portfolio of RPS projects under contract with
NYSERDA, the State will capture on average approximately $3 in direct investments associated
239 Brookings Institute. 2011. The Clean Economy in the State of New York. Accessed February 1, 2016 at:
http://www.brookings.edu/about/programs/metro/clean-economy/~/media/Series/Clean Economy/36.pdf.
240 Wiser, R., G. Barbose, J. Heeter, T. Mai, L. Bird, M. Bolinger, A. Carpenter, G. Heath, D. Keyser, J. Macknick, A.
Mills, and D. Millstein. 2016. A Retrospective Analysis of the Benefits and Impacts of U.S. Renewable Portfolio
Standards. Lawrence Berkeley National Laboratory and National Renewable Energy Laboratory. NREL/TP-6A20-65005.
http://www.nrel.gov/docs/fy16osti/65005.pdf.
241 KEMA, Inc. and Regional Economic Development Research Group, Inc. NYSERDA Main Tier RPS Economic Benefits
Report, November 14, 2008.
242 NYSERDA. 2005. Major Economic Impacts of Utility Scale Wind Projects in New York. Accessed February 2, 2016 at:
https://www.nyserda.ny.gov/-/media/Files/EDPPP/Energy-and-Environmental-Markets/RPS/Economic-
Benefits/economic-impacts-nys-wind-projects.pdf.
243 NYSERDA. Frequently Asked Questions on Large Scale Wind Energy. Accessed January 25, 2016 at:
https://www.nyserda.ny.gov/-/media/Files/EERP/Renewables/Large-Scale-Wind-Projects.pdf.
244 NYSERDA. 2013. Renewable Portfolio Standard Main Tier 2013 Program Review. Direct Investments in New York State.
Final Report. Prepared by Sustainable Energy Advantage, LLC and Economic Development Research Group Inc. for
NYSERDA. September 5.

9 | Growth Inducing Aspects and Socioeconomic Impacts
| 9-6
with project spending over project lifetime. Further, approximately $27 in direct investment
results from project expenditures in New York State for every 1 megawatt hour (MWh) of
renewable energy that is generated under the RPS. 245 In addition to these direct investments,
secondary effects would result in additional jobs and spending throughout the region. These
findings support the conclusion that regional economic benefits would result from projects under
the renewable tier of the CES.
245 NYSERDA. 2013. Renewable Portfolio Standard Main Tier 2013 Program Review. Direct Investments in New York
State. Final Report. Prepared by Sustainable Energy Advantage, LLC and Economic Development Research Group Inc.
for NYSERDA. September 5.

9 | Growth Inducing Aspects and Socioeconomic Impacts
| 9-7
EXHIBIT 9-2. WIND AND SOLAR CAPACITY BY NYISO ZONE
Source: IEc Analysis.
Note: In each of the four scenarios, Zone H (Dunwoodie) had a projected 7 MW of solar capacity. However, due to the
small size of the dots, they are not visible in the map.

9 | Growth Inducing Aspects and Socioeconomic Impacts
| 9-8
In addition to solar and wind energy, the addition of hydroelectric power to New York State’s
supply can result in regional economic benefits. Construction activities associated with upgrading
existing hydroelectric plants and/or retrofitting NPDs often extend over two to five years. As an
example, development of 5 MW of hydroelectricity capacity at the existing Delta Dam in Albany
County was estimated to employ 50 to 60 workers over a period of approximately 18 months.246
9.2 POTENTIAL PROGRAM COSTS
A supply curve model was used to estimate the least-cost mix of LSR resources needed to meet the
50 by 30 goal, as discussed in Chapter 4. From the resulting resource portfolio, the model
developed an estimate of the costs of procuring the incremental new resources (Tier 1), net of
those resources’ anticipated energy market values, through 2030.247 Known costs (sunk costs) that
are already committed to Main Tier solicitations and the NY-Sun program are excluded from the
calculation, in order to highlight the incremental cost associated with CES implementation. A
separate estimate was made for the cost of maintaining existing resources (Tier 2) in New York,
based on estimates of the payments necessary for CES-obligated entities to retain such resources in
consideration of those projects’ alternative net revenue opportunities in neighboring markets for
which they are eligible. For the nuclear Tier 3, cost projections were based on the difference
between expected nuclear generation costs and future wholesale energy market prices. This
calculation was derived through examination of a series of high and low wholesale energy revenue
and high and low costs of plant operation projections. From there, net program benefits/costs
were developed, which reflect the incremental societal value of the avoided CO2 emissions in
excess of the market price forecast for carbon value embedded in the electricity price forecast as a
result of the RGGI.
Because of the increased uncertainty inherent in projecting long-term costs and revenues due to
changes in the broader economy, procurement structure, changes in wholesale electricity prices,
the mix of renewable energy resources developed, technology costs, and project-specific
circumstances, the cost study focuses on near-term net present value (NPV) cost projections
through 2023, and provides information on the sensitivity of these results to various uncertainty
factors, including procurement structure. Longer-term cost estimates associated with meeting CES
targets through 2030 are provided in an appendix to the Cost Study. A discount rate of 5.5% was
used for the net present value (NPV) calculations. For Tier 1, costs are estimated for the full
assumed 20-year lifetime of incremental renewable energy projects commencing operations
through 2030. This means that Tier 1 projections to 2023 assess costs of such installations through
2042; under the 2030 time horizon, costs are assessed through 2049. For Tiers 2 and 3 – which
support the existing supply of renewables and nuclear resources – no assumption of 20 years of
ongoing payments was made and program costs are therefore not assessed beyond the time horizon
(2023 or 2030).
For the total of Tier 1, 2 and 3 resources, the near-term NPV yields a net benefit of $1.8 billion in
the 2023 time frame under the base case blend scenario. Projections of long-term costs and
revenues through 2030 are subject to increased uncertainty due to changes in the broader
246 City of Watervliet New York. FERC Project No. 13135 Delta Dam Hydroelectric Project. Accessed February 1, 2016 at:
http://watervliet.com/files/delta.pdf.
247 DPS. Clean Energy Standard White Paper – Cost Study. April 8, 2016.

9 | Growth Inducing Aspects and Socioeconomic Impacts
| 9-9
economy, changes in wholesale electricity prices, the mix of renewable energy resources
developed, technology costs, available tax credits, and project-specific circumstances. Noting
these underlying uncertainties, when looking at the 2030 time horizon, the NPV results in a net
benefit of $4.4 billion under the base case blend scenario.
In addition to the value of the benefit of avoided carbon, this cost assessment can be considered in
conjunction with the other multiple benefits, both regional and State-wide, that the CES will
achieve. These include the ecosystem benefits and significant direct and indirect local economic
development benefits, discussed in Section 9.1. The deployment of new renewable energy
installations and the continued operation of nuclear facilities will bring about or maintain
significant short and long-term employment, local tax revenues to host municipalities and in-state
purchases of goods and services. While not quantified for the purpose of this assessment, recent
studies have shown that both renewable generation and nuclear generation facilities have
generated net economic development benefits, after accounting for these local/regional effects as
well as for macro-economic effects.248
9.3 IMPACTS ON GROWTH AND COMMUNITY CHARACTER
Chapter 9 of the 2015 GEIS discusses how the REV and CEF policies and investments may affect
growth and community character including potential changes in the visual and physical
environment of local communities. The proposed CES actions have the potential to affect
community character in both similar and different ways.
The preservation of eligible nuclear facilities should not entail significant changes in the character
of the host communities. The primary effect should be the preservation of jobs, local services,
population levels, tax revenues, and existing community structures, although the introduction of
REV and CEF programs may have the kinds of effects described in the 2015 GEIS. The same
communities may face major changes toward the end of the period under analysis, as the licenses
expire, but those changes are not attributable to the CES.
Meeting the 50 by 30 goal through the addition of renewable power sources will have significant
impacts on some communities. Many of the locations that would be considered for new large
scale land-based wind, solar, and hydropower projects are in upstate New York. In these areas, the
prevailing settlement pattern is low density towns and villages, with large rural areas. These
communities may see both positive and negative impacts associated with the construction and
operation of new renewable power plants. For example, while construction of a wind plant will
have impacts on a rural viewshed, the revenue earned by a farmer from wind leases may contribute
to the preservation of existing farmland and rural/agricultural landscapes. Although leasing
arrangements vary widely, a 2005 NYSERDA study estimated a typical lease payment of
248
http://www.brattle.com/system/publications/pdfs/000/005/229/original/New_York's_Upstate_Nuclear_Power_Plants'
_Contribution_to_the_State_Economy.pdf?1449526735 and http://www.nuclearmatters.com/resources/reports-
studies/value-of-nuclear-new-york; http://www.nyserda.ny.gov/-/media/Files/EDPPP/Energy-and-Environmental-
Markets/RPS/RPS-Documents/2013/2013-RPS-investments-NYS.pdf.

9 | Growth Inducing Aspects and Socioeconomic Impacts
| 9-10
approximately $4,000 per MW per year, with an annual inflationary adjustment.249,250 A more
recent study undertaken by Windustry in 2009 estimated an average fixed payment lease rate of
$2,820 per MW, with values ranging from $1,515 to $5,387 per MW, equivalent to a fixed
payment of approximately $4,230 for a 1.5 MW wind turbine per year.251 As these large scale
renewable resources are added, there may also be some changes to community character and
viewsheds resulting from addition of transmission lines. The specific nature of the potential
community impacts will be evaluated in site-specific proceedings following implementation of the
CES.
9.4 ENVIRONMENTAL JUSTICE IMPACTS
Actions taken under the CES programs may occur in environmental justice communities and may
have the potential to disproportionately affect low-income and minority populations within these
communities. Regulations at 6 NYCRR Part 487 establish a framework for evaluating the
potential environmental justice issues associated consistent with siting a major electric generating
facility pursuant to PSL Article 10.
Implementation of actions to meet the CES 50 by 30 goals could result in locating new renewable
energy facilities, such as wind, solar or biomass. Depending on siting decisions, facilities could be
located in a potential environmental justice area (PEJA). Such siting proposals could result in the
lead agency performing an EIS to assess, among other things, whether the action under
consideration would disproportionately affect PEJA populations, and whether alternative actions
would have less impact. Exhibits 9-3 and 9-4 identify where PEJAs overlap with areas with the
highest potential for solar PV and wind development, respectively, in New York State. As
illustrated by the red shaded areas in Exhibit 9-3, areas with a high potential for solar PV overlap
with existing PEJAs. As the areas with the highest wind resource potential are primarily offshore,
wind energy developments are not as likely to fall within currently defined PEJAs.
In addition and as discussed above, an increase in the penetration of renewable resources could
lead to an increase in electricity prices. Increased costs of electricity may affect low-income
people disproportionately. While the electricity price impact are uncertain at this time, programs
aimed to support low income energy consumers through the REV and CEF proceedings, and
continued maintenance of nuclear power plants, may help to offset any increase in prices resulting
from increased consumption of renewable energy.
249 NYSERDA. 2005. Major Economic Impacts of Utility Scale Wind Projects in New York. Accessed February 1, 2016 at:
https://www.nyserda.ny.gov/-/media/Files/EDPPP/Energy-and-Environmental-Markets/RPS/Economic-
Benefits/economic-impacts-nys-wind-projects.pdf.
250 As a point of comparison, DOE indicates that royalties are typically around $2,000 per year for a 750-kilowatt wind
turbine or 2 percent to 3 percent of the project’s gross revenues (U.S. Department of Energy, Energy Efficiency and
Renewable Energy. Wind Energy for Rural Economic Development. DOE/GO-102004-1826. Revised August 2004.
Accessed January 25, 2016 at: http://www.nrel.gov/docs/fy04osti/33590.pdf)
251 NYSERDA. 2009. Wind Energy Toolkit. Accessed January 24, 2016 at: http://www.nyserda.ny.gov/-
/media/Files/EERP/Renewables/wind-energy-toolkit.pdf.

9 | Growth Inducing Aspects and Socioeconomic Impacts
| 9-11
EXHIBIT 9-3. SOLAR PV RESOURCE POTENTIAL AND PEJA LOCATIONS
EXHIBIT 9-4. WIND RESOURCE POETENTIAL AND PEJA LOCATIONS

Chapter 10 | Effects on Energy Consumption
| 10-1
CHAPTER 10 | EFFECTS ON ENERGY CONSUMPTION
Consistent with 6 NYCRR §617.9(b)(5)(iii)(e) of the SEQRA regulations, this chapter considers
the potential impacts of the proposed CES, in the context of the expected outcomes of the REV
and CEF proceedings, on the use and conservation of energy in New York State. The impacts of
actions taken under the REV and CEF on energy consumption were discussed in Chapter 10 of the
2015 GEIS, and are incorporated here by reference. The information provided in this chapter
focuses on the potential impacts that may result from the implementation of the CES 50 by 30 goal
and the CES nuclear maintenance program.
The proposed CES will establish a mandate that 50 percent of the electricity consumed in New
York by 2030 be supplied by renewable resources. A key outcome of the mandate is expected to
be greater penetration and adoption of renewable energy at the grid scale and in behind the meter
installations. In addition, the CES NMP will enable continued generation of energy by eligible
nuclear plants.
While the implementation of the CES is intended to change the State’s electric generation
portfolio, it is not expected to directly affect the amount of electricity used or the amount of energy
conserved. Future actions under the State’s REV and CEF policies, energy efficiency programs,
as well as other factors, will directly impact demand; the effects of those initiatives are discussed
in the 2015 GEIS. The maintenance of qualified nuclear facilities and installation of new
renewable sources under the CES will affect the characteristics of the supply sources that will be
available to meet that level of demand. Thus, the impact of the proposed CES will be to ensure at
least 50 percent of the energy used in New York is sourced from renewables.
11 | References
| 11-1
CHAPTER 11 | REFERENCES
6 NYCRR Part 242.
Adirondack Park Agency. Citizen’s Guide to Adirondack Park Agency Land Use Regulations.
Accessed January 22, 2016 at:
http://apa.ny.gov/Documents/Guidelines/CitizensGuide.pdf.
Alliance for Clean Energy New York, Inc. 2011. Wind and Wildlife.
American Biogas Council. Frequent Questions. Accessed January 23, 2016 at:
https://www.americanbiogascouncil.org/biogas_questions.asp.
American Wind Energy Association. 2015. U.S. Wind Industry Second Quarter 2015 Market
Report. July 22. Accessed January 25, 2016 at: http://www.ourenergypolicy.org/wp-
content/uploads/2015/07/2Q2015-AWEA-Market-Report-Public-Version.pdf.
Andre, M. et al. 2011. Lowe-frequency sounds induce acoustic trauma in cephalopods. Frot.
Ecol. Environ. 9(9): 489-493, doi: 10.1890/100124.
Antares Group, Inc. 2014. New York State Renewable Portfolio Standard Biopower Guide.
Prepared for NYSERDA. July 22.
Argonne National Laboratory's Environmental Science Division. Visual Impacts of Utility-Scale
Solar Energy Facilities on Southwestern Desert Landscapes. Accessed on January 21,
2016 at: http://visualimpact.anl.gov/solarvis/.
Arnett et al. 2008. Patterns of Bat Fatalities at Wind Energy Facilities in North America. Journal
of Wildlife Management 72(1):61–78.
Biomass Energy Centre. 2011. Potential Outputs of Biofuels Per Hectare, Per Annum. Accessed
January 25, 2016 at:
http://www.biomassenergycentre.org.uk/portal/page?_pageid=75,163231&_dad=portal&
_schema=PORTAL.
BLM. 2013. Best Management Practices for Reducing Visual Impacts of Renewable Energy
Facilities on BLM-Administered Lands. Accessed on January 21, 2016 at:
http://www.blm.gov/style/medialib/blm/wy/programs/energy/reco.Par.61853.File.dat/BL
Mvisual-BMP.pdf.
Brattle Group calculate the total contribution of New York’s nuclear power plants and New
York’s upstate nuclear power plant’s to the State economy (see
http://www.brattle.com/system/publications/pdfs/000/005/229/original/New_York's_Upst
ate_Nuclear_Power_Plants'_Contribution_to_the_State_Economy.pdf?1449526735 and

11 | References
| 11-2
http://www.nuclearmatters.com/resources/reports-studies/value-of-nuclear-new-york
(accessed January 21, 2016).
Brookings Institute. 2011. The Clean Economy in the State of New York. Accessed February 1,
2016 at: http://www.brookings.edu/about/programs/metro/clean-
economy/~/media/Series/Clean Economy/36.pdf.
Bureau of Ocean Energy Management. 2007. Alternative Energy Final Programmatic EIS. MMS
2007-046. October. Accessed January 16, 2016 at: http://www.boem.gov/Renewable-
Energy-Program/Regulatory-Information/Guide-To-EIS.aspx.
Bureau of Ocean Energy Management. Offshore Wind Energy. Accessed January 25, 2016 at:
http://www.boem.gov/renewable-energy-program/renewable-energy-guide/offshore-
wind-energy.aspx.
Bureau of Ocean Energy Management. Renewable Energy State Activities. Accessed January 25,
2016 at: http://www.boem.gov/Renewable-Energy-State-Activities/.
California Department of Resources Recycling and Recovery (CalRecycle). 2011. Final Program
Environmental Impact Report for Statewide Anaerobic Digester Facilities for the
Treatment of Municipal Organic Solid Waste. SCH No. 2010042100. June.
Case 14-E-0270, Petition Requesting Initiation of a Proceeding to Examine a Proposal for
Continued Operation of the R.E. Ginna Nuclear Power Plant, LLC., Petition Requesting
Initiation of a Proceeding to Examine a Proposal for Continued Operation (filed July 11,
2014). On November 2, 2015, Entergy announced plans to close the FitzPatrick Nuclear
Power Plant. http://www.prnewswire.com/news-releases/entergy-to-closejames-a-
fitzpatrick-nuclear-power-plant-in-central-new-york-300170100.html.
Case 14-E-0270, Petition Requesting Initiation of a Proceeding to Examine a Proposal for
Continued Operation of the R.E. Ginna Nuclear Power Plant, LLC., Petition Requesting
Initiation of a Proceeding to Examine a Proposal for Continued Operation (filed July 11,
2014).
Case 15-E-0302, Order Expanding Scope of Proceeding and Seeking Comments (January 21,
2016) at 3 and 5-6.
City of Watervliet New York. FERC Project No. 13135 Delta Dam Hydroelectric Project.
Accessed February 1, 2016 at: http://watervliet.com/files/delta.pdf.
Commission's Environmental Survey of Transportation of Radioactive Materials to and from
Nuclear Power Plants, WASH-1238, December 1972, and Supp. 1 NUREG-75/038,
April 1975. Both documents are available for inspection and copying at the Commission's
Public Document Room, 2120 L Street N.W., Washington, D.C.
Congressional Research Service (2011) Is Biopower Carbon Neutral? CRS Report for Congress
7-5700 http://biomassboard.gov/pdfs/crs_biopower_carbon_neutral.pdf.
Dean, Megan. Converting non-powered dams to create a varied hydroelectric mix. August 17,
2012. Accessed January 24, 2016 at:
http://www.pennenergy.com/articles/pennenergy/2012/08/converting-non-powered.html.

11 | References
| 11-3
Denholm et al. 2009. Land-use requirements of modern wind power plants in the United States.
Bolder CO: National Renewable Energy Laboratory.
DOE. 2009. Environmental Assessment for BP Solar Array Project. DOE/EA-1663. December.
68 pp. Accessed January 20, 2016 at:
http://www.lipower.org/pdfs/company/projects/solar/bpsolar-ea.pdf.
DOE. 2012. An Assessment of Energy Potential at Non-Powered Dams in the United States.
Wind and Water Power Program. Prepared by Oak Ridge National Laboratory. April;
American Rivers. Making Hydropower Safer For Rivers. Accessed on January 24, 2016
at: http://www.americanrivers.org/initiatives/dams/hydropower/.
DOE. Database of State Incentives for Renewables & Efficiency. “New York Interconnection
Standards.” Accessed July 22, 2014 at:
http://dsireusa.org/incentives/incentive.cfm?Incentive_Code=NY02R&re=0&ee=0.
DPS. Case 14-M-0101, Proceeding on Motion of the Commission in Regard to Reforming the
Energy Vision. Matter Master: 14-00581/14-M-0101. Available at:
http://documents.dps.ny.gov/public/MatterManagement/CaseMaster.aspx?MatterCaseNo
=14-m-0101.
DPS. Case 14-M-0094, Proceeding on Motion of the Commission to Consider a Clean Energy
Fund. Matter Master: 14-00549/14-M-0094. Available at:
http://documents.dps.ny.gov/public/MatterManagement/CaseMaster.aspx?MatterCaseNo
=14-m-0094&submit=Search+by+Case+Number.
DPS. Case 14-M-0101, Proceeding on Motion of the Commission in Regard to Reforming the
Energy Vision. Matter Master: 14-00581/14-M-0101. Available at:
http://documents.dps.ny.gov/public/MatterManagement/CaseMaster.aspx?MatterCaseNo
=14-m-0101.
DPS. 2014. Case 14-M-0101 – Proceeding on the Motion of the Commission in Regard to
Reforming the Energy Vision. Developing the REV Market in New York: DPS Staff
Straw Proposal on Track One Issues. August 22, 2014. Page 46.
DPS. Case 03-E-0188: Proceeding on Motion of the Commission Regarding a Retail Renewable
Portfolio Standard, Order Authorizing Funding and Implementation of the Solar
Photovoltaic MW Block Programs. Issued April 24, 2014.
DPS. Case 12-E-0485 to Case 12-E-0490. In the Matter of Order Raising Net Metering
Limitations. Issued and Effective June 13, 2014. Accessed September 9, 2014 at:
http://documents.dps.ny.gov/public/Common/ViewDoc.aspx?DocRefId={000AA6DA-
F23B-4644-A2EA-D8AE6BC26559}.
DPS. Case 14-M-0094: Proceeding on Motion of the Commission to Consider a Clean Energy
Fund: Order Commencing Proceeding. Issued May 8, 2014.
DPS. Final Generic Environmental Impact Statement in Case 03-E-0188 Proceeding on Motion
of the Commission Regarding a Retail Renewable Portfolio Standard. Issued August 26,
2004. Accessed September 18, 2014 at: http://www.dps.ny.gov/NY_RPS_FEIS_8-26-
04.pdf.

11 | References
| 11-4
EIA. Electricity. Form EIA-923. 2015M: EIA-923 through October. Accessed January 15, 2016
at: https://www.eia.gov/electricity/data/eia923/.
EIA. Glossary. Accessed January 20, 2016 at: http://www.eia.gov/tools/glossary/index.cfm?id=C.
EIA. New York State Profile and Energy Estimates: Rankings: Average Retail Price of Electricity
to Residential Sector, September 2015. Accessed January 15, 2016 at:
http://www.eia.gov/state/rankings/?sid=NY#/series/31.
EIA. New York State Profile and Energy Estimates: Rankings: Total Net Electricity Generation
September 2015. Accessed January, 15 2016 at:
http://www.eia.gov/state/rankings/?sid=NY#series/51.
EIA. Rankings: Total Energy Consumed per Capita, 2013 (million Btu). Accessed January 18,
2016 at:
https://www.eia.gov/state/seds/data.cfm?incfile=/state/seds/sep_sum/html/rank_use_gdp.
html.
EIA. State Energy Data System. Last Updated: July 167, 2015. Accessed January 18, 2016 at:
http://www.eia.gov/state/print.cfm?sid=NY.
Energy Information Administration Power Plants 2015. https://www.eia.gov/maps/layer_info-
m.cfm.
EPA Office of Research and Development. 2014. Food Waste to Energy: How Six Water
Resource Recovery Facilities are Boosting Biogas Production and the Bottom Line. EPA
600/R-14/240. September. Accessed January 23, 2016 at:
http://www.americanbiogascouncil.org/pdf/FoodWastetoEnergy_EPADoc600R14_240.p
df.
EPA. 2015. Anaerobic Digestion and its Applications. EPA/600/R-15/304. October. 17 pp.
FERC. 2011. Order Issuing Original Major License. Project No. 12576-004. April 18. Accessed
January 24, 2016 at:
http://www2.mvr.usace.army.mil/projects/dsp_factsheet.cfm?ProjID=E790E18A-1143-
30FB-2640E3860B99E82E.
Generic Environmental Impacts Statement for License Renewal of Nuclear Plants: Main Report
(NUREG-1437, Volume 1), and the relevant supplemental EIS for Upstate facilities:
Supplement 31 Regarding James A. FitzPatrick Nuclear Power Plant, Supplement 24
Regarding Nine Mile Point Nuclear Station, Units 1 and 2, and Supplement 14 Regarding
R.E. Ginna Nuclear Power Plant.
Governor Andrew M. Cuomo. Executive Order 88: Directing State Agencies And Authorities to
Improve The Energy Efficiency of State Buildings. Accessed September 9, 2014 at:
http://www.governor.ny.gov/executiveorder/88; BUILD SMART NY. About BUILD
SMART NY State Building Initiative. Accessed September 9, 2014 at:
http://www.buildsmart.ny.gov/about/.
Governor Cuomo Announces Growth of New York Agricultural Sales Outpaces National
Average. December 14, 2015. [Press Release]. Accessed August 14, 2014 at:
http://www2.mvr.usace.army.mil/projects/dsp_factsheet.cfm?ProjID=E790E18A-1143-30FB-2640E3860B99E82E

11 | References
| 11-5
http://www.governor.ny.gov/news/governor-cuomo-announces-growth-new-york-
agricultural-sales-outpaces-national-average.
Green Purchasing State Profile: State of New York. Accessed September 9, 2014 at:
http://www.responsiblepurchasing.org/resources/state_profiles/new_york.pdf.
Hernandez, R.R., et al. 2014. "Environmental Impacts of Utility-Scale Solar Energy." Renewable
and Sustainable Energy Reviews. 29(1): 766-779.
Howard and Schlesinger. 2014. Wind Power and Biodiversity in New York: A Tool for Siting
Assessment and Scenario Planning at the Landscape Scale. New York Natural Heritage
Program.
IEc. 2014. Comprehensive Evaluation Plan: Technology and Market Development, Clean Air
Interstate Rule and Selected Regional Greenhouse Gas Initiative Programs. Final
Working Version. Prepared for NYSERDA under Contract 32883. March.
ISO New England. 2015 Regional Electricity Outlook. 15 January 2015. Accessed January 15,
2016: http://www.iso-ne.com/static-assets/documents/2015/02/2015_reo.pdf.
KEMA, Inc. and Regional Economic Development Research Group, Inc. NYSERDA Main Tier
RPS Economic Benefits Report, November 14, 2008.
Knauss, T. 2015. Entergy to close FitzPatrick nuclear plant in Oswego County. November 2.
Accessed on January 23, 2015 at:
http://www.syracuse.com/news/index.ssf/2015/11/entergy_fitzpatrick_nuclear_plant_in_
oswego_county.html.
Lyon Falls Hydro. Important Dates and Redevelopment Schedule. Accessed on February 1, 2016
at: http://www.lyonsfallshydro.com/important-date-expansion-schedule/.
Lyon Falls Hydro. Public Meeting Presentation. Accessed on February 1, 2016 at:
http://www.lyonsfallshydro.com/wp-content/uploads/2015/03/Lyons-Falls-Joint-Agency-
Public-Meeting-Presentation_20150305.pdf.
McClellan et al. 2015. New York Offshore Wind Cost Reduction Study. NYSERDA
Missouri River Energy Services. Project Overview. Accessed January 24, 2016 at:
http://redrockhydroproject.com/project-overview/.
MRES. RRHP Fact Sheet. Accessed January 24, 2016 at:
http://redrockhydroproject.com/images/uploads/RRHP_Infographic_2014-1001.pdf.
National Atmospheric Deposition Program. About NADP. Accessed September 29, 2014 at:
http://nadp.sws.uiuc.edu/NADP/.
NEI. 2015. Fact Sheets. Nuclear Power Plants Benefit State and Local Economies. February.
Accessed on January 16, 2016 at: http://www.nei.org/Master-Document-
Folder/Backgrounders/Fact-Sheets/Nuclear-Power-Plants-Contribute-Significantly-to-S.
New York Department of State. 2013. Offshore Atlantic Ocean Study. July p. 35. Available at:
http://docs.dos.ny.gov/communitieswaterfronts/ocean_docs/NYSDOS_Offshore_Atlantic
_Ocean_Study.pdf.

11 | References
| 11-6
New York Power Authority. LI-NYC Offshore Wind. Accessed January 25, 2016 at:
http://www.nypa.gov/nypawindpower/.
New York State Assembly Bill A6558B. Accessed September 11, 2014 at:
http://assembly.state.ny.us/leg/?default_fld=&bn=A06558&term=&Summary=Y&Memo
=Y&Text=Y; Hull, R.G. “Environmental Law: Risk & resiliency: NY’s plan to cope with
climate change.” August 17, 2014. Accessed September 11, 2014 at:
http://nydailyrecord.com/blog/2014/08/17/environmental-law-risk-resiliency-nys-plan-to-
cope-with-climate-change/; Governor’s Press Office. “Governor Cuomo Signs
Community Risk and Resiliency Act.” September 22, 2014. Accessed September 24,
2014 at: http://www.governor.ny.gov/press/09222014-resiliencyact.
New York State Comptroller. 2015. The Importance of Agriculture to the New York State
Economy. March. Accessed January 20, 2016 at:
http://www.osc.state.ny.us/reports/importance_agriculture_ny.pdf.
New York State Council of Parks, Recreation and Historic Preservation. 2013. 2012 Annual
Report. Accessed August 20, 2014 at: http://nysparks.com/state-
council/documents/2012StateCouncilAnnualReport.pdf.
New York State Council of Parks, Recreation, and Historic Preservation. 2015. 2014 Annual
Report. January. Accessed January 20, 2016 at: http://nysparks.com/state-
council/documents/2014StateCouncilAnnualReport.pdf/.
New York State Department of Agriculture and Markets. 2016. Agricultural District Profile Data
– 2016. Accessed April 4, 2016 at:
http://www.agriculture.ny.gov/ap/agservices/Agricultural_District_Profile_Data.pdf
New York State Department of Health. 2013. Vital Statistics of New York State 2013: Table 2:
Population, Land Area, and Population Density by County, New York State - 2013.
Accessed January 20, 2014 at:
http://www.health.ny.gov/statistics/vital_statistics/2013/table02.htm.
New York State Department of Labor. Current Employment Statistics. Preliminary. Accessed
August 22, 2014 at: http://labor.ny.gov/stats/cesemp.asp.
New York State Energy Planning Board. 2014. New York State Energy Plan. Volume 2: End-Use
Energy. Accessed September 14, 2014 at: http://energyplan.ny.gov/-
/media/nysenergyplan/2014stateenergyplan-documents/2014-draft-nysep-vol2-
enduse.pdf.
NRC: NMSS – State Regulations and Legislation Accessed January 25, 2016 at
https://scp.nrc.gov/rulemaking.html#NY.
NREL. 2013. Land-Use Requirements for Solar Power Plants in the United States. Technical
Report NREL/TP-6/A20-56290. June. 39 pp. Accessed on January 23, 2016 at:
http://www.nrel.gov/docs/fy13osti/56290.pdf.

11 | References
| 11-7
Nussbaumer et al. 2008. Particulate Emissions from Biomass Combustion in IEA Countries:
Survey on Measurements and Emissions Factors. On behalf of International Energy
Agency Bioenergy Task 32, Swiss Federal Office of Energy. Accessed January 25, 2016
at:
http://www.ieabcc.nl/publications/Nussbaumer_et_al_IEA_Report_PM10_Jan_2008.pdf.
NY State Energy Planning Board. 2015 New York State Energy Plan. Volume 2. Accessed
February 1, 2016 at: http://energyplan.ny.gov/Plans/2015.
NYISO. 2012. Growing Wind: Final Report of the NYISO 2010 Wind Generation Study.
September.
NYISO. 2015 Load & Capacity Data “Gold Book.” pp. 22, 58, 59. Accessed January 18, 2016 at:
http://www.nyiso.com/public/webdocs/markets_operations/services/planning/Documents
_and_Resources/Planning_Data_and_Reference_Docs/Data_and_Reference_Docs/2015
%20Load%20and%20Capacity%20Data%20Report.pdf.
NYISO. 2015. Power Trends 2015: Rightsizing the Grid. Accessed January 14, 2016 at:
http://www.nyiso.com/public/webdocs/media_room/press_releases/2015/Child_PowerTr
ends_2015/ptrends2015_FINAL.pdf.
NYISO. Planning Services and Requests: NYISO Planning Interconnection Queue. Accessed on
December 31, 2015 at:
http://www.nyiso.com/public/markets_operations/services/planning/planning_resources/i
ndex.jsp.
NYNHP. Animal Guides. Accessed January 25, 2016 at:
http://www.acris.nynhp.org/animals.php.
NYPSC. 2014. New York State Standardized Interconnection Requirements and Application
Process for New Distributed Generators 2 MW or Less Connected in Parallel with Utility
Distribution Systems. February 2014. Accessed September 1, 2014 at:
http://www3.dps.ny.gov/W/PSCWeb.nsf/96f0fec0b45a3c6485257688006a701a/dcf68efc
a391ad6085257687006f396b/$FILE/ATTP59JI.pdf/Final%20SIR%202-1-14.pdf.
NYS Board on Electric Generation Siting and the Environment. Accessed January 25, 2016 at:
http://www.dps.ny.gov/SitingBoard/.
NYS DEC Division of Environmental Permits. Assessing and Mitigating Noise Impacts.
Issuance Date: October 6, 2000. Revised February 2, 2001. Accessed January 25, 2016
at: http://www.dec.ny.gov/docs/permits_ej_operations_pdf/noise2000.pdf.
NYS DEC Division of Fish, 2009. Wildlife and Marine Resources. Guidelines for Conducting
Bird and Bat Studies at Commercial Wind Energy Projects. August. Accessed January
25, 2016 at: http://www.dec.ny.gov/docs/wildlife_pdf/finwindguide.pdf.
NYS Department of Agriculture and Markets. 2013. Guidelines for Agricultural Mitigation for
Wind Power Projects. Revised July 10, 2013. Accessed January 26, 2016 at:
http://www.agriculture.ny.gov/ap/agservices/Wind_Farm_Guidelines.pdf.
11 | References
| 11-8
NYS DPS. 2004. Final Generic Environmental Impact Statement In CASE 03-E-0188—
Proceeding on Motion Of the Commission Regarding a Retail Renewable Portfolio
Standard. August 26. Accessed January 25, 2016 at
http://www.dps.ny.gov/NY_RPS_FEIS_8-26-04.pdf.
NYS DPS. 2016. Final Generic Environmental Impact Statement In CASE 14-M-0101-
Reforming the Energy Vision and CASE 14-M-0094- Clean Energy Fund. Prepared by
Industrial Economics, Incorporated and Optimal Energy, Incorporated. 6 February 2015.
Accessed 14 January 2016:
file:///G:/Share/NYSERDA%20Flexible%20Energy%20Contract/06%20TWO%204%20-
%20Clean%20Energy%20EIS/Supplemental%20EIS/%7B9E35CB6F-9B7D-4220-
9CD4-B254C0FB4551%7D.pdf.
NYS DPS. 2016. Staff White Paper on Clean Energy Standard. CASE 15-E-0302. January 25.
NYSDEC. “New York’s Acid Deposition Monitoring Network”. Accessed July 22, 2014 at:
http://www.dec.ny.gov/chemical/8409.html.
NYSDEC. “The Regional Greenhouse Gas Initiative: Carbon Dioxide Budget Trading Program.”
Accessed July 24, 2014 at: http://www.dec.ny.gov/energy/rggi.html.
NYSDEC. 2009. Guidelines for Conducting Bird and Bat Studies at Commercial Wind Energy
Projects.
NYSDEC. 2010. DEC Program Policy. DAR-12 / “Sustainably Harvested” Determination for
Purposes of “Eligible Biomass,” Part 242.
NYSDEC. 2015. DEC Reminds the Public to Avoid Seasonal Caves and Mines to Protect Bat
Populations. [Press Release] http://www.dec.ny.gov/press/103720.html.
NYSDEC. Biodiversity & Species Conservation: Sustaining New York's Animals, Plants and
Ecosystems. Accessed August 14, 2014 at: http://www.dec.ny.gov/animals/279.html.
NYSDEC. Executive Order No. 24, Establishing a Goal to Reduce Greenhouse Gas Emissions
Eighty Percent by the Year 2050 and Preparing a Climate Action Plan. Accessed
September 9, 2014 at: http://www.dec.ny.gov/energy/71394.html.
NYSDEC. New York’s Acid Deposition Monitoring Network. Accessed September 1, 2014 at:
http://www.dec.ny.gov/chemical/8409.html.
NYSERDA. 2005. Major Economic Impacts of Utility Scale Wind Projects in New York.
Accessed February 2, 2016 at: https://www.nyserda.ny.gov/-
/media/Files/EDPPP/Energy-and-Environmental-Markets/RPS/Economic-
Benefits/economic-impacts-nys-wind-projects.pdf.
11 | References
| 11-9
NYSERDA. 2007. Market Characterization Report: Anaerobic Digester Gas-to-Electricity for the
Municipal Wastewater Sector in New York. November. Mc08-01. 7 pp. Accessed
January 23, 2016 at: http://www.nyserda.ny.gov/-
/media/Files/Publications/Research/Environmental/market-characterization.pdf.
NYSERDA. 2009. Wind Energy Toolkit. Accessed January 24, 2016 at:
http://www.nyserda.ny.gov/-/media/Files/EERP/Renewables/wind-energy-toolkit.pdf.
NYSERDA. 2010. New York’s Offshore Wind Energy Development Potential in the Great
Lakes: Feasibility Study. Final Report 10-04. April.
NYSERDA. 2010. Pre-Development Assessment of Avian Species for the Proposed Long Island
– New York City Offshore Wind Project Area. October.
NYSERDA. 2010. Pre-Development Assessment of Natural Resources for the Proposed Long
Island- New York City Offshore Wind Project Area. Final Report 10-22 Task 3A.
October. Accessed January 26, 2016 at: http://www.linycoffshorewind.com/PDF/10-
22_linyc-collaborative-resources.pdf.
NYSERDA. 2013. Renewable Portfolio Standard Main Tier 2013 Program Review. Direct
Investments in New York State. Final Report. Prepared by Sustainable Energy
Advantage, LLC and Economic Development Research Group Inc. for NYSERDA.
September 5.
NYSERDA. 2013. Wind Turbine-Related Noise: Current Knowledge and Research Needs.
NYSERDA Report 13-14. June.
NYSERDA. 2013. Wind Turbine-Related Noise in Western New York. NYSERDA Report 13-
03. January.
NYSERDA. 2014. New York State Greenhouse Gas Inventory and Forecast: Inventory 1990-
2011 and Forecast 2012-2030. Final Report. April. Accessed September 26, 2014 at:
http://www.nyserda.ny.gov/-/media/Files/EDPPP/Energy-Prices/Energy-
Statistics/greenhouse-gas-inventory.pdf.
NYSERDA. 2014. New York State Renewable Portfolio Standard. Annual Performance Reports.
Accessed September 18, 2014 at: https://www.nyserda.ny.gov/Publications/Program-
Planning-Status-and-Evaluation-Reports/Renewable-Portfolio-Standard-Reports.aspx.
NYSERDA. 2015. Advancing the Environmentally Responsible Development of Offshore Wind
Energy in New York State: A Regulatory Review and Stakeholder Perceptions.
NYSERDA Report 15-16. Prepared by Wing Goodale and Kate Williams (Biodiversity
Research Institute, Portland, ME). June.
NYSERDA. 2015. New York State Renewable Portfolio Standard. Annual Performance Report
through December 31, 2015. March. Accessed February 1, 2016 at:
http://www.nyserda.ny.gov/All-Programs/Programs/Main-Tier/Documents.
NYSERDA. 2014. NY Prize. Powering a New Generation of Community Energy. Accessed
December 30, 2014 at: http://www.nyserda.ny.gov/All-Programs/Programs/NY-Prize.

11 | References
| 11-10
NYSIO. 2015. 2015 NYCA Generating Facilities. Accessed January 16, 2016 at:
http://www.nyiso.com/public/index.jsp.
NYSERDA. Frequently Asked Questions on Large Scale Wind Energy. Accessed January 25,
2016 at: https://www.nyserda.ny.gov/-/media/Files/EERP/Renewables/Large-Scale-
Wind-Projects.pdf.
NYSPSC. System Benefits Charge. Accessed September 22, 2014 at:
http://www3.dps.ny.gov/W/PSCWeb.nsf/All/58290EDB9AE5A89085257687006F38D1?
OpenDocument.
NY-Sun initiative. NY-Sun Initiative Frequently asked Questions. Accessed October 3, 2014 at:
http://ny-sun.ny.gov/About/NY-Sun-FAQ.aspx.
Office of Nuclear Reactor Regulation. 2013. Generic Environmental Impact Statement for
License Renewal of Nuclear Plants: Main Report, Final Report, NUREG-1437, Volume
1, Revision 1. p. 4-196.
Office of Nuclear Material Safety and Safeguards. 2014. Generic Environmental Impact
Statement for Continued Storage of Spent Nuclear Fuel, Final Report, NUREG-2157,
Volume 1.
Pacca and Horvath. 2002. Greenhouse Gas Emissions from Building and Operating Electric
Power Plants in the Upper Colorado River Basin. Environmental Science & Technology,
Volume 36, No. 14, 3194-3200. Accessed on January 24, 2016 at:
http://nature.berkeley.edu/er100/readings/Pacca_2002.pdf.
Potomac Economics. 2013 State of the Market Report for the New York ISO Markets. May
2014. Page 5. Accessed September 18, 2014 at:
https://www.potomaceconomics.com/uploads/nyiso_reports/NYISO_2013_SOM_Report.
pdf.
Potomac Economics. 2014 State of the Market Report for the New York ISO Markets. May 2015.
Developed by Accessed: January 17, 2016.
http://www.nyiso.com/public/webdocs/markets_operations/documents/Studies_and_Repo
rts/Reports/Market_Monitoring_Unit_Reports/2014/NYISO2014SOMReport__5-13-
2015_Final.pdf.
PRNewswire. “PPL Montana Dedicates New Powerhouse at Century-Old Rainbow Hydroelectric
Facility.” Accessed on January 24, 2016 at: http://www.prnewswire.com/news-
releases/ppl-montana-dedicates-new-powerhouse-at-century-old-rainbow-hydroelectric-
facility-214951201.html.
PRNewswire. 2015. Entergy to Close James A. FitzPatrick Nuclear Power Plant in Central New
York. Accessed January 22, 2016 at: http://www.prnewswire.com/news-releases/entergy-
to-close-james-a-fitzpatrick-nuclear-power-plant-in-central-new-york-300170100.html.
Regional Greenhouse Gas Initiative. CO2 Auctions; Auction Results: Cumulative Allowances &
Proceeds (by State). Accessed September 22, 2014 at:
http://www.rggi.org/market/co2_auctions/results.

11 | References
| 11-11
Rosenzweig, C., W. Solecki, A. DeGaetano, M. O’Grady, S. Hassol, P. Grahborn (Eds). 2011.
Responding to Climate Change in New York State. Synthesis Report prepared for
NYSERDA. Accessed on September 10, 2014 at: http://www.nyserda.ny.gov/-
/media/Files/Publications/Research/Environmental/EMEP/climaid/ClimAID-
synthesisreport.pdf.
SRI International. New York State Clean Energy Technologies Innovation Metrics 2012. Final
Report. Prepared for NYSERDA. May 2013. Accessed on September 23, 2014 at:
https://www.nyserda.ny.gov/Energy-Innovation-and-Business-Development/Innovation-
and-Business-Development/Tracking-Clean-Tech-Innovation-for-New-York.aspx.
U.S. Bureau of Labor Statistics. Average Energy Prices, New York-Northern New Jersey-Long
Island – December 2015. Accessed January 15, 2016 at :
http://www.bls.gov/regions/new-york-new-jersey/news-
release/pdf/averageenergyprices_newyorkarea.pdf.
U.S. Bureau of Labor Statistics. Occupational Employment Statistics. Last updated March 25,
2015. Accessed January 21, 2016 at: http://www.bls.gov/oes/tables.htm.
U.S. Census Bureau, 2010-2014 American Community Survey 5-Year Estimates. Accessed on
January 21, 2016 at:
http://factfinder2.census.gov/faces/tableservices/jsf/pages/productview.xhtml?pid=ACS_
12_5YR_DP04&prodType=table.
U.S. Census Bureau. 2012 American Community Survey. Accessed August 22, 2014 at:
http://www.census.gov/acs/www/data_documentation/2012_release/.
U.S. Census Bureau. 2013. American Fact Finder. Annual Estimates of the Resident Population:
April 1, 2010 to July 1, 2013. 2013 Population Estimates. Accessed August 20, 2014 at:
http://factfinder2.census.gov/faces/nav/jsf/pages/index.xhtml.
U.S. Census Bureau. New York QuickFacts. Accessed January 21, 2016 at:
http://www.census.gov/quickfacts/table/PST045215/36,00.
U.S. Census Bureau. State & County Quick Facts – New York. Accessed August 14, 2014 at:
http://quickfacts.census.gov/qfd/states/36000.html.
USDA, National Agricultural Statistics Service. 2012. 2012 Census of Agriculture – County
Data, New York. Accessed May 2, 2016 at:
https://www.agcensus.usda.gov/Publications/2012/Full_Report/Volume_1,_Chapter_2_C
ounty_Level/New_York/st36_2_001_001.pdf.
U.S. Department of Energy, Energy Efficiency and Renewable Energy. Wind Energy for Rural
Economic Development. DOE/GO-102004-1826. Revised August 2004. Accessed
January 25, 2016 at: http://www.nrel.gov/docs/fy04osti/33590.pdf.
U.S. DOE Golden Field Office, Office of Energy Efficiency and Renewable Energy. 2010. Final
Environmental Impact Statement for the Proposed Abengoa Biorefinery Project near
Hugoton, Stevens County, Kansas. August. DOE/EIS-0407. Accessed January 25, 2016
at: http://www.energy.gov/sites/prod/files/EIS-0407-FEIS-Summary-2010.pdf.

11 | References
| 11-12
U.S. EIA. 2015. Despite recent closures, U.S. nuclear capacity is scheduled to increase by 2020.
Accessed January 22, 2016 at: http://www.eia.gov/todayinenergy/detail.cfm?id=23592#.
U.S. EIA. New York Nuclear Profile. 2010. Accessed January 22, 2016 at
http://www.eia.gov/nuclear/state/newyork/.
U.S. EIA, Electricity Data Browser. Average retail price of electricity (cents per kilowatt hour)
Accessed: January 15, 2016 http://www.eia.gov/electricity/data/browser/ and U.S.
Department of Labor, Bureau of Labor Statistics, Consumer Price Index - Average Price
Data, New York-Northern Jew Jersey-Long Island, Electricity per KWH, 2001-2015,
Series APUA10172610.
U.S. EPA. 2008. State Bioenergy Primer, Chapter Two: What is Bioenergy? Accessed January
25, 2016 at:
http://www3.epa.gov/statelocalclimate/documents/pdf/bioenergy_chapter2.pdf.
U.S. Fish and Wildlife Service. Endangered Species of New York State, Listings and
Occurrences for New York. Accessed January 20, 2016 at:
http://ecos.fws.gov/tess_public/pub/stateListingAndOccurrenceIndividual.jsp?state=NY
&s8fid=112761032792&s8fid=112762573902.
U.S. Fish and Wildlife Service. Endangered Species of New York State, Listings and
Occurrences for New York. Accessed January 20, 2016 at:
http://ecos.fws.gov/tess_public/pub/stateListingAndOccurrenceIndividual.jsp?state=NY
&s8fid=112761032792&s8fid=112762573902.
U.S. NRC. 2004 Generic Environmental Impact Statement for License Renewal of Nuclear
Plants: Supplement 14 Regarding R.E. Ginna Nuclear Power Plant, Final Report.
January.
U.S. NRC. 2008 Generic Environmental Impact Statement for License Renewal of Nuclear
Plants: Supplement 31 Regarding James A. FitzPatrick Nuclear Power Plant, Final
Report. NUREG-1437 Supplement 31. January.
U.S. NRC. 2008. Biological Assessment for James A. FitzPatrick Nuclear Power Plant License
Renewal Application Review. Letter Dated April 28, 2008 to U.S. Fish and Wildlife
Service, New York Field Office. Accessed January 26, 2016 at:
http://pbadupws.nrc.gov/docs/ML0807/ML080780070.pdf.
U.S. NRC. 2015. About NRC. Accessed January 25, 2016 at http://www.nrc.gov/about-nrc.html.
U.S. NRC. 2015. Plant Sites with Licensed Radioactive Material in Groundwater. Accessed April
28, 2016 at: http://www.nrc.gov/reactors/operating/ops-experience/tritium/sites-grndwtr-
contam.html
U.S. NRC. Generic Environmental Impacts Statement for License Renewal of Nuclear Plants:
Main Report (NUREG-1437, Volume 1) Table S.3 Uranium fuel-cycle environmental
data.
U.S. Nuclear Regulatory Commission and the Occupational Safety and Health Administration.
September 6, 2013.

11 | References
| 11-13
U.S. Nuclear Regulatory Commission. List of Power Reactor Units Accessed January 12, 2016 at
http://www.nrc.gov/reactors/operating/list-power-reactor-units.html. Accessed January
12, 2016; NYSIO. 2015. 2015 NYCA Generating Facilities. Accessed January 16, 2016
at: http://www.nyiso.com/public/index.jsp; U.S. EIA. State Nuclear Profiles. Accessed
December 24, 2015 at: http://www.eia.gov/nuclear/state/newyork/.
Union of Concerned Scientists. Benefits of Renewable Energy Use. Accessed on January 26,
2015 at: http://www.ucsusa.org/clean_energy/our-energy-choices/renewable-
energy/public-benefits-of-renewable.html#.VqfE4fkrL0M.
US DOE. 2015. Wind Vision: A New Era for Wind Power in the United States.
USDA Farm Service Agency. 2010. Biomass Crop Assistance Program: Programmatic
Environmental Impact Statement. June. Accessed January 25, 2016 at:
https://www.fsa.usda.gov/Internet/FSA_File/bcapfinalpeis062510.pdf.
USDA, EPA and DOE. 2015. Biogas Opportunities Roadmap Progress Report. December. 20 pp.
Accessed January 23, 2016 at: http://www.epa.gov/agstar/biogas-opportunities-roadmap-
report.
Wiser, R., G. Barbose, J. Heeter, T. Mai, L. Bird, M. Bolinger, A. Carpenter, G. Heath, D.
Keyser, J. Macknick, A. Mills, and D. Millstein. 2016. A Retrospective Analysis of the
Benefits and Impacts of U.S. Renewable Portfolio Standards. Lawrence Berkeley
National Laboratory and National Renewable Energy Laboratory. NREL/TP-6A20-
65005. http://www.nrel.gov/docs/fy16osti/65005.pdf.
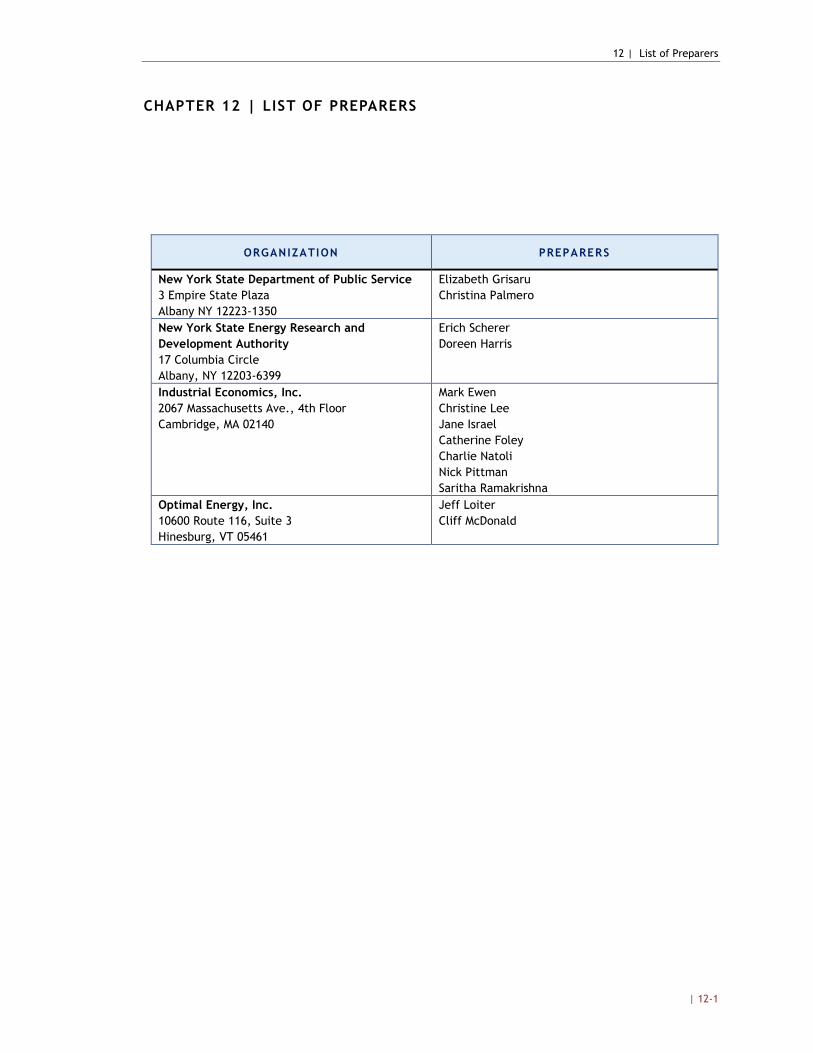
12 | List of Preparers
| 12-1
CHAPTER 12 | LIST OF PREPARERS
ORGANIZATION PREPARERS
New York State Department of Public Service
3 Empire State Plaza
Albany NY 12223-1350
Elizabeth Grisaru
Christina Palmero
New York State Energy Research and
Development Authority
17 Columbia Circle
Albany, NY 12203-6399
Erich Scherer
Doreen Harris
Industrial Economics, Inc.
2067 Massachusetts Ave., 4th Floor
Cambridge, MA 02140
Mark Ewen
Christine Lee
Jane Israel
Catherine Foley
Charlie Natoli
Nick Pittman
Saritha Ramakrishna
Optimal Energy, Inc.
10600 Route 116, Suite 3
Hinesburg, VT 05461
Jeff Loiter
Cliff McDonald

Appendix A | Final SEIS Response to Public Comments
| A-1
APPENDIX A | RESPONSE TO COMMENTS ON THE DRAFT SEIS
A.1 INTRODUCTION
This appendix summarizes comments submitted on the Draft Supplemental Environmental
Impact Statement (SEIS), issued February 23, 2016. A Notice of Completion of the Draft SEIS
was published in the Environmental Notice Bulletin on February 24, 2016, and comments were
requested to be provided through April 1, 2016. Written comments were received from seven
entities, including four parties to the proceeding.
Responses to each substantive comment raised are presented below presented in alphabetical
order by filer. Copies of individual comment letters are available through the Large Scale
Renewable Program and Clean Energy Standard Matter, Case 15-E-0302.
A.2 ALLIANCE FOR A GREEN ECONOMY AND NUCLEAR INFORMATION AND RESOURCE
SERVICE
Comment: The Draft SEIS inadequately discusses the adverse environmental impacts that would
result from a policy decision to support the continued operation of nuclear power plants in New
York, including impacts due to uranium mining and milling, nuclear fuel enrichment and
transportation, radioactive releases (both routine and accidental), thermal water pollution,
destruction of aquatic organisms, and the creation of many tons of high level radioactive waste.
The Draft SEIS’ treatment of the environmental impacts of nuclear energy conflicts with
positions taken by the State in the 2015 State Energy Plan, the Indian Point relicensing
proceedings, and in the Waste Confidence and Continued Storage cases pertaining to the long-
term storage of nuclear waste at nuclear power plant sites. The Draft SEIS highlights the
perceived environmental and economic benefits of avoiding the need to replace energy generated
by nuclear facilities with fossil fuel generation but does not provide a comparison of
environmental costs and benefits.
Response: The Draft SEIS summarizes the types of impacts associated with the
continued operation of nuclear plants in New York in Section 5.2.1. Specifically, Exhibit
5-6 identifies the impacts of the uranium fuel-cycle on land, water, fossil fuels, chemical
effluents (including gases, liquids, and solids), radiological effluents (including gases,
liquids, and solids), thermal effluents, transportation, exposure to the general public, and
occupational exposure. Exhibit 5-7 considers the environmental impact of transporting
fuel and waste to and from a nuclear power reactor. In addition, the Draft SEIS references
the NRC’s Generic Environmental Impact Statement for License Renewal of Nuclear
Plants: Main Report, Final Report and relevant supplemental EIS’s, which include
information specific to the operations of the New York nuclear facilities. Collectively,
Appendix A | Final SEIS Response to Public Comments
| A-2
these reports provide a full assessment of the impacts of continued operations at these
plants for the length of the current operating license period for each of these facilities.
The Final SEIS has been updated to include additional information specific to the
environmental impacts of ongoing operations of the Upstate nuclear facilities including
discussion on temperature effects of discharged water, impacts to aquatic organisms, and
on-site spent-fuel extended storage rules and impacts.
The comment that the CES proposal to support nuclear facilities is not consistent with
other State policy positions is not relevant to the SEQRA analysis. The focus of the Draft
SEIS is the identification of the impacts associated with the action under consideration.
Comment: The Draft SEIS does not address alternative scenarios. For instance, the Draft SEIS
does not contemplate alternative scenarios, such as mandating higher levels of renewable energy
generation and/or mandating certain increases in energy efficiency as a replacement for retiring
nuclear reactors. Thus, the Draft SEIS violates a key requirement of the New York State
Environmental Quality Review Act (SEQRA), which requires an evaluation of “all reasonable
alternatives.”
Response: SEQRA requires evaluation of all reasonable alternatives that could achieve
the objectives of the project sponsor; in this case, the DPS Staff White Paper defines the
objectives of the CES, and outlines the reasonable alternatives for implementation of
these objectives including the proposal to establish Tier 3 of the CES (the Nuclear Tier).
These alternatives are currently subject to public comment and Commission review. The
discussion in the Draft SEIS reasonably captures the range of potential impacts from
alternative implementation schemes included in the Staff White Paper.
The Draft SEIS includes a “no action” alternative that contemplates discontinued
operations at two nuclear power facilities in 2017. The document illustrates a “worst
case” scenario of potential environmental impacts under this alternative, by calculating
the increased carbon dioxide emissions likely to occur should this nuclear generation be
replaced by fossil fuel generation (see, for example, Exhibit 4-3). In addition, however,
the no action alternative implies that higher levels of renewable energy generation and/or
increases in energy efficiency would be required as a replacement for retiring nuclear
reactors to meet the “50 by 30” mandate. The discussion in Chapter 5 of the Draft SEIS
reasonably captures the environmental impacts of such a potential incremental increase in
renewable generation and/or energy efficiency. Further, Chapter 5 has been revised in the
Final SEIS to include additional information on potential environmental impacts.
A.3 COMMENTERS RELATED TO INDIAN POINT: ENTERGY NUCLEAR INDIAN POINT 2,
LLC, ENTERGY INDIAN POINT 3, LLC, ENTERGY NUCLEAR FITZPATRICK, LLC, AND
ENTERGY NUCLEAR OPERATIONS, INC. AND UTI LITY WORKERS UNION OF AMERICA, LOCAL
1-2 (LOCAL 1-2)
Comment: The Draft SEIS should consider the clean energy and socioeconomic benefits
produced by the Indian Point nuclear operations. There is no rational basis for the NYPSC to
exclude the Indian Point facility from participation in the CES program and, concomitantly, from

Appendix A | Final SEIS Response to Public Comments
| A-3
the scope of review undertaken in the Draft SEIS. The scope of the Draft SEIS must be revised to
analyze all six nuclear facilities operating in New York State.
Response: The Draft SEIS (Section 5.2.1) provides information regarding the generation
and capacity of all active nuclear power units in New York State, including the Indian
Point facilities. This section fully identifies the types of impacts associated with the
continued operation of any of the nuclear plants in New York as well as the impacts of
discontinuing operations. Later sections similarly discuss other types of impacts, such as
economic development impacts, from a generic standpoint.
A.4 NEW YORK STATE DEPARTMENT OF ENVIRONMENTAL CONSERVATION (DEC)
Comment: We recommend that the Final SEIS consider the emissions from bioenergy in a way
that is based on best available science and is consistent with previous State and federal policy.
We recommend that when the Final SEIS refers to carbon neutrality, it should apply a formal
definition of ‘carbon neutrality’ that is consistent with State or federal policy and is explicit about
the time frame when determining carbon neutrality. The Draft SEIS states that in closed-loop
bioenergy, or energy generation from dedicated feedstocks, “the carbon released in the
combustion of the biomass is equivalent to the carbon absorbed when the energy crops are
regrown” (page 5-51). This is a different definition of neutrality than in the RPS, which is based
on the uptake of carbon during the initial growth of plant material, not its regrowth. DEC
regulations limit eligible biomass so that emissions can be re-sequestered in sustainably managed
forests. This position is consistent with the U.S. Environmental Protection Agency’s (EPA)
Science Advisory Board in reference to the current draft EPA policy on biogenic CO2 emissions.
The SEIS also refers to open-loop bioenergy as a net negative source of greenhouse gas
emissions, but this depends on the time frame considered. Unlike fuel combustion, which
immediately releases carbon dioxide into the atmosphere, both carbon sequestration and natural
processes of decay occur over long periods of time and decay is a critical part of ecosystem
functioning. The Final SEIS should indicate some biomass fuels are more carbon intensive than
others, and that robust accounting is required before a biomass fuel can be called carbon neutral.
Response: Section 5.2.7 in the Draft SEIS notes that there are numerous types of biomass
fuel, each of which will have differing environmental impacts, including air emissions.
The Draft SEIS further notes that the impact of biomass is highly dependent on site
specific factors. DEC correctly notes that the SEIS should apply a definition of ‘carbon
neutrality’ that is consistent with State or federal policy and is explicit about the time
frame being applied. The Final SEIS has been revised to incorporate a more consistent
definition of carbon neutrality, to describe the State’s regulations limiting the eligible
biomass fuels, and to explain the importance of considering the time frame when
evaluating the carbon emissions related to a particular biomass fuel.
Comment: The discussion of land use impacts from the production of bioenergy fuels could
benefit from a fuller discussion of how negative impacts would be mitigated. We recommend that
the Final SEIS include considerations on all types of feedstocks allowed in the Biomass Power
Guide and the potential sources of feedstock in and outside of the State. Some fuels are likely to
Appendix A | Final SEIS Response to Public Comments
| A-4
be produced outside New York, causing impacts that cannot be mitigated by NYS policies and
potentially causing substantial greenhouse gas emissions from the transportation of the fuel to
instate power plants. The positive impacts to native species in New York from bioenergy that are
described in the Draft SEIS are not guaranteed, and the effects of habitat fragmentation that are
discussed for wind energy also apply. Furthermore, the negative impacts of bioenergy appear to
be focused on Upstate New York. We recommend that this also be clarified.
Response: As noted in Section 1.5 of the Draft SEIS, the area analyzed in the SEIS is
limited to New York State, thus potential impacts occurring outside of New York are not
considered. Chapter 6 of the SEIS describes policies and guidance available to mitigate
the potentially adverse environmental impacts that may result from the CES. The Final
SEIS has been updated to provide additional information about the effects of bioenergy
on native species and habitat fragmentation, as well as specific discussion of how
potential environmental impacts related to biomass may be mitigated.
Comment: Unlike the other sections of the Draft SEIS and REV GEIS, coal generation is used to
define a no action alternative for bioenergy. However, in the 2016 State of the State, Governor
Cuomo committed NYS to phase out existing coal generation by 2020. Given this commitment,
coal power plants no longer represent the standard by which to compare alternatives, particularly
when considering new sources of generation. This is also practical as coal already represents a
very small percentage of generation in New York State. Where possible, references could be
revised, e.g., with natural gas.
Response: We agree with this comment given recent policy developments and the status
of coal-based generation in New York. To understand the environmental impacts of
biomass energy, it makes better sense to compare incremental effects to natural gas
generation. The Final SEIS has been revised to replace references to coal with natural gas
where applicable.
Comment: NYS Open Space policy includes more than protected parks and could be referenced
when discussing the role of "marginal" land in the state. The Final REV GEIS, which provided a
more detailed description of open space in NYS, should be considered here. Although the
Adirondack Park Agency would play a key role in decisions regarding the siting of renewables
within the boundaries of the Park, other open space exists in NYS. The second paragraph of this
Draft SEIS should be revised to recognize that not all land owned by NYS is part of the state park
system. Only land managed by NYS Office of Parks, Recreation and Historic Preservation is part
of the state park system, or approximately 338,000 acres including historic sites (7,000 acres).
DEC managed land, including lands inside the Adirondack and Catskill Parks are not part of the
state park system. Lands inside the Adirondack and Catskill Parks are considered Forest Preserve
and NYS Constitution protected Forest Preserve. DEC managed lands outside of those parks fall
into a number of classifications including State Forests and Wildlife Management Areas. DEC
also holds about 900,000 acres of conservation easements. Most are working forest easements in
the Adirondack and Tug Hill regions, which have three main components: 1) prevent non-forestry
development, 2) require sustainable forestry practices, and 3) must include partial or full public
recreation rights.
Appendix A | Final SEIS Response to Public Comments
| A-5
Response: Section 3.4 of the Final SEIS was revised to reflect the suggested changes
regarding the diversity of state-managed and/or protected lands and New York State’s
2014 Draft Open Space Conservation Plan. Section 5.2.7 was also revised to include
discussion of New York State’s 2014 Draft Open Space Conservation Plan.
Comment: State-listed plant and animal species and those that are vulnerable to climate change
could be considered in addition to federally-listed species.
Response: The Draft SEIS incorporates – by reference to the 2015 GEIS – discussion of
State-listed endangered and threatened plant and animal species as well as State-listed
species of special concern. In the Final SEIS, Section 3.3 “Species Biodiversity” has been
revised to include additional information on New York State species vulnerable to
climate change.
Comment: When referring to the Global Warming Potential of greenhouse gases, it may be more
useful to be consistent with either the most up-to-date guidance from the U.S. EPA or
Intergovernmental Panel on Climate Change.
Response: The Final SEIS has been updated to refer to the Intergovernmental Panel on
Climate Change’s Fifth Assessment Report and EPA’s Inventory of Greenhouse Gas
Emissions and Sinks.
Comment: It may be more useful to define visual impacts from solar based on the Northeast
region, rather than the Desert Southwest.
Response: Section 5.2.2 of the Final SEIS has been revised to include additional
information on potential visual impacts of solar arrays which are more applicable to the
Northeast region.
A.5 AMERICAN PETROLEUM I NSTITUTE
Comment: The Draft SEIS indicates that a benefit of the CES is its potential to increase the fuel
diversity of the state’s electricity supply, by limiting the state’s reliance on natural gas. From an
electric system reliability standpoint, not all technologies are created equal, so considering “fuel
diversity” – in and of itself – a benefit, is misguided. In an organized wholesale market such as
New York, system operators look for operational diversity, rather than fuel diversity. The Draft
SEIS should acknowledge the importance of building and maintaining adequate natural gas
pipeline infrastructure to take advantage of this abundant, flexible and low-cost resource and to
support the operational diversity goals of the state, including the need to back up variable
renewable generation and maintaining system reliability.
Response: The comments misstate the purpose and content of the Draft SEIS. First, in
listing the benefits of the CES, the draft states that the program will likely serve to
maintain, not increase, fuel diversity. Second, the proposed action does not contemplate
expanding the role of natural gas-fueled power plants in the State’s supply portfolio and
therefore assessing the impacts of building and maintaining natural gas pipeline
infrastructure is beyond the scope of this SEIS.

Appendix A | Final SEIS Response to Public Comments
| A-6
A.6 COMMENTS FROM INDIVIDUALS
Comment: Additional detail is needed on the impact the CES will have in specific geographic
localities including information on: the number of large scale renewables, land mass required to
support large scale renewables, regions of the State that will host the projects, and visual, habitat,
noise, human health, and local economic impacts.
Response: Chapter 5 of the Draft SEIS discusses the estimated utility scale land-based
wind energy projected to be developed under the CES, both in terms of estimated new
capacity and new generation, through 2030 based on the supply curve analysis. Impacts
of large scale renewable solar energy and wind energy projects on land use, visual
resources, species biodiversity (including birds and bats), habitat, and noise pollution are
also included in Sections 5.2.2 and 5.2.3. Additional impacts on growth and community
character are discussed in Section 9.3. Site-specific and project-specific environmental
impact analyses fall outside the scope of this SEIS to the REV Generic Environmental
Impact Statement, as discussed in Section 5.1.
Comment: The CES mandate for large scale renewables coupled with a previously enacted law
(Article 10 of the Public Service Law) challenges community home rule and negatively impacts
local communities’ ability to control large scale renewable development within municipal
boundaries.
Response: The interplay of State and local authorities that may be involved in the siting
of future renewable energy projects is discussed in Chapter 6. The extent to which home
rule principles may or may not be recognized in a future case is beyond the scope of this
SEIS, which provides a generic analysis of the potential environmental impacts of the
proposed CES. The likely environmental impacts to local communities are identified at
Chapter 5 and Section 9.3.
Comment: The Draft SEIS does not adequately address the environmental and economic impacts
of potentially converting rural farmland to large scale renewable development.
Response: Chapter 5 of the SEIS discusses the anticipated land use requirements of
installing large scale renewable projects, including utility scale solar, land-based wind,
and biomass energy. Additional information on the potential amount of New York State
agricultural land that may be converted to energy generation and subsequent
environmental impacts has been added to this section.
Comment: There need to be additional legal protections and support for individual landowners
engaging with renewable energy companies looking to obtain land or roof leases for large scale
renewable projects. Current laws such as the Landlord-Tenant laws are insufficient.
Response: This comment falls outside the scope of this SEIS which is focused on
identifying the potential environmental impacts of the CES and examining the interplay
between the goals and impacts of the CES and the anticipated outcomes of the REV and
CEF proceedings that were previously evaluated in the GEIS.

Appendix A | Final SEIS Response to Public Comments
| A-7
Comment: New York State energy policy should prioritize energy efficiency and conservation
over energy generation.
Response: The SEIS focuses on the proposed action, which addresses mandatory targets
for renewable energy generation and does not establish any energy policy. However, to
the extent State policy prioritizes energy efficiency and reduces demand, the amount of
large-scale renewable resources (LSRs) that may be needed to meet CES targets could be
reduced. This impact of energy efficiency policies is discussed in Chapter 10, and is also
incorporated into the LSR supply curve model, as discussed Section 4.1.
Comment: The CES should require independent studies of large scale renewable projects and
make the data publically available. Measures might include the renewability, reliability and
efficiency of the system.
Response: As discussed in section ES.4 and Chapter 6 of the Draft EIS, site-specific
permitting regimes, such as the State Environmental Quality Review (SEQR) process,
and Article 10 and Article VII of the New York Public Service Law, require agencies and
project developers to identify and mitigate potentially adverse environmental impacts that
may result from the construction and operation of specific projects. As part of these
public processes, site-specific studies will be conducted for specific projects and made
available for public comment.
Comment: The Draft GEIS does not address potential impacts caused by the anticipated increase
in smaller infrastructure (i.e., transmission and electric lines) associated with large scale
renewable projects on bird and bat populations. The Draft GEIS also does not adequately address
impacts on bird and bat populations in areas of the state that have not been studied.
Response: Sections 5.2.2 and 5.2.3 of the SEIS discuss potential impacts of transmission
lines on habitat and local wildlife, including bird and bat populations. In addition,
potential impacts due to specific projects will be subject to review under site-specific
permitting regimes, such as SEQR, and Article 10 and Article VII of the New York
Public Service Law. These regulations require developers to identify and mitigate
potentially adverse environmental impacts that may result from the construction and
operation of specific projects. Also, as discussed in Section 5.2.3, NYSDEC provides
guidelines to site land-based wind projects to minimize impacts on birds and bats,
relevant to all areas in NYS.
Comment: A commenter questions whether the recently accepted Reliability Support Services
Agreement (RSSA) will be reevaluated since ZECs will compensate for the loss of profits.
Response: This comment falls outside the scope of this SEIS. However, as noted in the
Staff White Paper on the CES, the RSSA to which the commenter is likely referring (e.g.,
the RSSA with Rochester Gas & Electric) is designed to provide payments to the plant
owner through April of 2017. Any payments from the sale of ZECs would likely occur
upon expiration of the RSSA.

Appendix A | Final SEIS Response to Public Comments
| A-8
Comment: The Draft GEIS does not address the safety issues associated with tritium levels and
nuclear energy generation.
Response: Section 5.2.1 of the SEIS discusses human health risks associated with
occupational and public exposure to radiation. Additional discussion was added to this
section on the health risks posed by potential groundwater contamination of tritium at
nuclear facilities.
Comment: A commenter is concerned that certain ratepayers will be charged for the CES/CEF
while others will not. The burden on state utility ratepayers versus municipal ratepayers has been
and is unequal because municipal utilities such as the Long Island Power Authority (LIPA) and
New York Power Authority (NYPA) are excluded from the SBC and RPS surcharges. The GEIS
should explain in plain English who and how it meets the definition of a State Energy Policy.
Response: The Staff White Paper on the CES proposes that all electric retail load serving
entities (LSEs) share the obligation of the CES mandate. This includes the
“jurisdictional” LSEs, subject to the Commission’s authority and all “non-jurisdictional”
LSEs (e.g., LIPA and NYPA). As Staff notes, this approach promotes equity by requiring
all users of energy to bear costs and participate in solutions to make it a consistent State
Energy Policy.
Comment: The Draft GEIS does not explain who contributes to the Green Bank, who benefits
from the Green Bank, and how the funds can be used.
Response: The Green Bank was addressed in the Generic Environmental Impact
Statement on the REV and CEF proceedings; the Final GEIS was issued by the
Commission on February 6, 2015.
Comment: New York State energy policy should include an evaluation component to measure
outcomes and successes.
Response: This comment falls outside the scope of this SEIS. The Staff White Paper,
however, does recommend that the Commission include detailed monitoring and
reporting requirements and program evaluation for the CES.

Appendix B |Revisions to the Draft Supplemental Environmental Impact Statement
| B-1
APPENDIX B | REVISIONS TO THE DRAFT SUPPLEMENTAL
ENVIRONMENTAL IMPACT STATEMENT
Appendix B lists edits that have been made to Draft SEIS to incorporate new and revised
information
EXECUTIVE SUMMARY
Revised to reflect changes made to the Draft SEIS.
CHAPTER 1: SEQRA AND DESCRIPTIO N OF THE PROPOSED ACTION
Editorial changes.
CHAPTER 2: THE ELECTRIC INDUSTRY IN NEW YORK STATE
No changes.
CHAPTER 3: ENVIRONMENTAL SETTING
Revised Section 3.3 to include additional information on potentially affected NYS listed
species and species vulnerable to climate change in response to public comments.
Revised Section 3.4 to include broader discussion of public lands in NYS in response to
public comments.
CHAPTER 4: ALTERNATIVES CONSIDERED
4.1: Basel ine and Alternatives Defin it ion: Renewable Supply
Revised to incorporate updated LSR modeling results.
Added broader discussion with respect to assumption of carbon neutrality for biomass
energy in response to public comments.
4.2: Nuclear Power No Action Al ternative
Editorial changes.
Corrected Exhibit 4-3 calculations of avoided CO2 emissions.
CHAPTER 5: ENVIRONMENTAL IMPACTS OF PROPOSED ACTION
5.1: Framework for Evaluating the Environmenta l Impacts of the CES
Editorial changes.
5.2: Direct and Near Term Effects
Expanded discussion on environmental impacts of nuclear power in response to public
comments.
Revised to incorporate updated LSR modeling results.
Appendix B |Revisions to the Draft Supplemental Environmental Impact Statement
| B-2
Revised to include broader discussion of potential impacts to agricultural lands in
response to public comments.
Included additional discussion of potential visual impacts of solar based on New York
specific example in response to public comments.
Revised discussion of biomass energy, and specifically carbon neutrality of biomass
energy, in response to public comments.
Added information regarding NYSDEC regulations on eligible biomass in response to
public comments.
5.3: Longer-Term Effects
Revised to incorporate additional information on potential impacts to agricultural lands in
response to public comments.
5.4: Other Unant ic ipated Technologies
No changes.
5.5: Cumulative Impacts
Revised to incorporate additional information on potential impacts to agricultural lands in
response to public comments.
CHAPTER 6: REGULATORY FRAMEWORK AND MITIGATION OF POTENTIAL ADVERSE
IMPACTS
Added information regarding NYSDEC regulations on eligible biomass in response to
public comments.
CHAPTER 7: UNAVOIDABLE ADVERSE IMPACT
No changes.
CHAPTER 8: IRREVERSIBLE AND IRRETRIEVABLE COMMITMENT OF
RESOURCES
No changes.
CHAPTER 9: GROWTH-INDUCING ASPECTS AND SOCIOECONOMIC IMPACTS
Added information on employment at Indian Point nuclear facilities to Exhibit 9-1.
Revised Section 9.2 to incorporate updated CES Cost Study results.
CHAPTER 10: EFFECTS ON ENERGY CONSUMPTION
No changes.
CHAPTER 11: REFERENCES
Revised to include new changes added in the Final SEIS.