Final Complex Transformation Supplemental Programmatic Environmental Impact Statement

FINAL SUPPLEMENTAL ENVIRONMENTAL IMPACT STATEMENT FOR THE
CROTON WATER TREATMENT PLANT
2. PURPOSE AND NEED.......................................................................................................... 1 2.1. SUMMARY OF THE PROPOSED PROJECT.............................................................. 1 2.2. PURPOSE AND NEED.................................................................................................. 2 2.3. NON-FILTRATION AND WATERSHED MANAGEMENT...................................... 5
2.3.1. Under Present Conditions Croton Water Consumers are Often Receiving Lower Quality Water.......................................................................................................................... 5 2.3.2. Filtration Will Reduce Health Risks from Disinfection Byproducts ...................... 6
2.3.2.1. Interim Measures to Control Disinfection By-Products ................................. 7 2.3.2.2. Sources of Disinfection By-Products in the Croton System........................... 9
2.3.3. Filtration Will Reduce Risks from Microbial Contaminants................................ 12 2.3.4. The Croton Watershed Does Not Meet the Surface Water Treatment Rule’s Criteria for Filtration Avoidance .......................................................................................... 12
2.3.4.1. Systems that have Achieved Filtration Avoidance Designations ................. 12 2.3.4.2. Watershed Control in the Croton System ..................................................... 19
2.3.5. Compliance with Safe Drinking Water Act and Federal Court Order.................. 21 2.3.6. Non-Filtration Alternatives and/or Disinfectants Are Not Adequate ................... 21 2.3.7. NYCDEP’s Croton System Watershed Protection Efforts Are Continuing ......... 23 2.3.8. Regulatory Protection ........................................................................................... 28
2.4. NEED FOR THE CROTON SUPPLY......................................................................... 30 2.4.1. Historic and Projected Water Demand/Comparison to Safe Yield....................... 31
2.4.1.1. Croton Supply to City ................................................................................... 34 2.4.1.2. Importance of Croton System During Droughts........................................... 35 2.4.1.3. Importance of the Croton System During Extended System Maintenance .. 35 2.4.1.4. Simulation of System Operation without the Croton Supply ....................... 35
2.4.2. Conclusions........................................................................................................... 36 FIGURE 2-1. CROTON SYSTEM DAILY COLOR RESULTS FOR THE YEAR 2002........... 4 FIGURE 2-2. CROTON HALOACETIC ACIDS (HAA5) QUARTERLY RUNNING
AVERAGES ......................................................................................................................... 10 FIGURE 2-3. DIFFERENCES IN HALOACETIC ACIDS BETWEEN LAND USE TYPES
IN A CALIBRATED CATCHMENT IN THE NEW CROTON RESERVOIR WATERSHED...................................................................................................................... 11
FIGURE 2-4. CURRENT WATERSHED USE IN THE CROTON WATERSHED................. 13 FIGURE 2-5. TYPES OF HAZARDOUS SPILLS IN THE NEW CROTON WATERSHED
FOR THE YEAR 2002. ........................................................................................................ 20 FIGURE 2-6. MAP OF RECENT LAND ACQUISITIONS AROUND NEW CROTON
RESERVOIR ........................................................................................................................ 25 FIGURE 2-7. CITY-WIDE WATER DEMANDS AND PROJECTIONS.................................. 32 FIGURE 2-8. UPSTATE COMMUNITY WATER DEMANDS SUPPLIED BY NYC
SYSTEM............................................................................................................................... 33 TABLE 2-1. PARTIAL LIST: UNFILTERED WATER SYSTEMS IN THE UNITED STATES
............................................................................................................................................... 17 TABLE 2-2. COMPARISONS OF PROJECTED DEMANDS AND SAFE YIELD ESTIMATE
............................................................................................................................................... 34

2. PURPOSE AND NEED
2.1. SUMMARY OF THE PROPOSED PROJECT The New York City Department of Environmental Protection (NYCDEP) proposes to design, construct and place into operation a 290 million-gallon-per-day (mgd) water treatment plant to provide filtration and disinfection of the Croton System water supplied to New York City (City). As currently proposed by the NYCDEP, the proposed Croton Water Treatment Plant project (Croton project) would include a water treatment plant building that would contain the water treatment process elements, residuals processing and administrative functions, machinery, and equipment. In addition, a new raw water conveyance system would deliver raw water from the New Croton Aqueduct (NCA) to the proposed plant, and a treated water conveyance system would transport water back to the City’s distribution system. Alternatives to the treated water conveyances are described in Section 3.0, Proposed Project and Engineering Alternatives. In addition, construction of the proposed plant would require the construction, rehabilitation and stabilization of several off-site Croton System facilities. Construction on the NCA would be required as part of the Croton project if the treated water alternative that entails the continued use of the NCA under pressure for a proposed water treatment plant at the Eastview Site is selected. The major work sites for this NCA pressurization work include NCA Shaft No. 9 (Village of Sleepy Hollow, Westchester County, NY), NCA Shaft No. 14 (the Town of Ardsley, Westchester County, NY), NCA Shaft No. 18 (the City of Yonkers, Westchester County, NY), Gate House No. 1 (the Borough of the Bronx, NY), as well as modifications to the facilities in and around the Jerome Park Reservoir (Bronx, NY). Minor work at other locations along the NCA including the Croton Lake Gate House in the Town of Yorktown, NY and work required at the Jerome Park Reservoir and Gate House No. 1 in the Bronx for all site alternatives is described Section 8.0, Off-Site Facilities. The selected treatment process for the proposed plant would be a “stacked” dissolved air flotation/filtration (DAF/Filtration) system. This proposed 290 mgd plant would include coagulation/mixing, flocculation, dissolved air flotation (DAF), filtration, and Ultraviolet Light (UV) disinfection. This selection would achieve treated water quality goals including a 99.9 percent (3-log) removal/inactivation of Giardia cysts and 99.9-percent (3-log) removal of Cryptosporidium oocysts. Further details of the proposed project are in Section 3.0, Proposed Project and Engineering Alternatives. The Final SEIS has been prepared in accordance with the State Environmental Quality Review Act (SEQRA), established by Article 8 of the Environmental Conservation Law, as set forth in 6NYCRR Part 617 and the City Environmental Quality Review (CEQR) process, as set forth in Executive Order 91 of 1977 and its amendments, and by the State Revolving Loan Fund program. NYCDEP issued a Lead Agency Determination, Positive Declaration and Draft Scope of Work on August 22, 2003; held public hearings on the Draft Scope of Work on September 22, 2003, and September 29, 2003; and, issued a Final Scope of Work and Response to Comments on November 4, 2003.
Final SEIS Purpose and Need 1

2.2. PURPOSE AND NEED The Croton project is being proposed to meet the public water supply and public health needs of the City of New York, and to comply with State and Federal drinking water standards and regulations. This project is required to provide filtration and disinfection of the Croton Supply to: 1) allow NYCDEP to continue to provide drinking water of the highest quality; 2) prevent the periodic shutdown of the Croton System, particularly at times of the year when the City water demand is at its highest; 3) meet the requirements of existing and future regulations; 4) comply with the federal Consent Decree between the City, New York State and the United States of America; 5) augment the effective yield and operational flexibility of the City's overall water supply system, and 6) provide additional protection from contamination of the treated water in the water conveyances by pressurizing the treated water conveyances. This Final SEIS describes the proposed project to treat the Croton Water Supply, methods of analysis, existing conditions, future without the project, potential impacts of each project alternative (including potential construction-related impacts and potential project impacts), and proposed mitigation measures, where applicable. The purpose of this document is to disclose the information on which the City would base a decision for a preferred site for the proposed Croton project. Filtration is the standard and predominant method of treating drinking water across the United States. In fact, 99 percent of all surface water supplies in the United States are filtered. Filtration was first used in the United States in the 1870’s, even before disinfection. (Indeed, nearly 100 years ago City engineers designed a filtration plant for the Croton Supply, prior to the discovery and subsequent decision to use chlorine as a disinfectant instead.) Today filtration is an integral component of a multi-barrier process to meet water quality and health standards in developed countries throughout the world.
There are 7,400 surface water systems in the U.S., of which 7,310 have filtration plants. Of the 90 surface water systems that are unfiltered, most are very small and none receive water from areas as densely populated as the Croton watershed. U.S. Environmental Protection Agency (USEPA) statistics show that eight times as many disease outbreaks occur in unfiltered systems as compared to filtered systems. More than 95 percent of the (~1,800) unfiltered systems in the United States in 1989 - the year the Surface Water Treatment Rule (SWTR) took effect - have since installed filtration. Even some of the larger unfiltered systems like Seattle, Washington, have since voluntarily installed filtration for at least parts of their systems. There is a long history behind the City’s decision to filter the Croton System. As far back as 1908, City water officials, New York City Board of Water Supply, were prompted by public health concerns to consider filtering the Croton supply, and evaluated several proposals at length before selecting chlorination as the most suitable alternative at that time. In the 1960’s, City officials decided that filtration was necessary for the Croton System based on water quality and the existing water quality standards of the time. There were, and still are, seasonal episodes when the Croton System is unable to meet the water quality standards and is taken offline i.e, shutdown of the water supply. The existence of a significant population in the Croton watershed and the associated impacts of that population and land uses contribute to the overall quality of the water supply. In 1989, the USEPA adopted the SWTR, mandating filtration of all surface
Final SEIS Purpose and Need 2

drinking water supplies except under the most limited circumstances. At that time, City officials concluded that the Croton System would not meet the stringent criteria for watershed control required for filtration avoidance. The New York State Department of Health (NYSDOH) concurred in that determination. Accordingly, the City did not apply to USEPA for a filtration waiver for the Croton System. NYCDEP has concluded that it must now move forward with filtration of the Croton System; the following is a discussion supporting that conclusion.
The Croton System is critical to meeting the City’s current and future water supply needs. Without full use of the Croton System, the City’s water supply could have a shortfall of at least 400 million gallons per day by the year 2045. Computer simulations of the water supply from 1927-1993 indicate that, without the Croton System, the frequency of drought emergencies would have been increased from an average of once every ten years to once every five years. In these simulations, it would have been necessary to use the Chelsea Pumping Station, for Hudson River water, three times more often; and it was predicted that the City would have run out of water during the drought of the 1960's. The need for the Croton System during a drought emergency is even more critical today than in the past because, under the increasingly stringent federal water quality and environmental laws enacted since the 1970’s, the Hudson River is no longer a guaranteed alternative water supply to the City during a drought. Because of the more stringent water quality regulations in the SWTR, the use of the Hudson River for the City’s drinking water during drought emergencies will either be completely precluded or severely restricted. The operational strategy for the City’s water supply is to maintain a balance between water quality and water quantity. In order to meet the City’s considerable average daily water demand of 1.2 billion gallons a day, the water supply must be managed as a whole, not as individual discrete systems. Ideally, all reservoirs in the System should be available for use at any time so that water quality problems and preventive maintenance can be accommodated. The seasonal water quality impairment of the Croton System often necessitates a shutdown of the Croton supply and occurs during the City’s peak demand period. Moreover, as the Catskill and Delaware Systems age, there is a need for more maintenance and repair, of these Systems. Some of these repairs may take decades to complete. The Catskill and Delaware Systems each provide a significant portion of the daily water supply to the City. The City’s water needs cannot be met with only one of these two systems in operation. As various components of these two Systems are taken off-line for repair and maintenance, alternative sources of water must be available to meet the City’s daily water needs. Since the Croton System is the only other significant water supply for the City, it will be needed on a continuous and reliable basis for decades to come, in order to meet the City’s water needs. Unfortunately, while water quality in the Croton reservoirs is generally good, the Croton System reservoirs face problems of eutrophication. Eutrophic water bodies are rich in nutrients (e.g., phosphorus) resulting in excessive growth of algae, low transparency and low dissolved oxygen levels. Eutrophication leads to numerous water quality problems including: increased disinfection byproducts, low dissolved oxygen concentrations, elevated metal concentrations, and unacceptable taste, odor and color (Figure 2-1).
Final SEIS Purpose and Need 3

Croton System Daily Color Results for the Year 2002
Figure 2-1
M&
E F
ile: P
:\E
nvi
ron
me
nta
l Qu
alit
y\C
roto
n\G
RA
PH
ICS
\02
-PA
N\C
RT-p
an
A-0
5-1
0-0
4.c
dr
05
/19
/04
Croton Water Treatment Plant
Croton System Daily Color Results for 2002
5
10
15
20
25
30
35
1/1/
2002
1/15
/200
2
1/29
/200
2
2/12
/200
2
2/26
/200
2
3/12
/200
2
3/26
/200
2
4/9/
2002
4/23
/200
2
5/7/
2002
5/21
/200
2
6/4/
2002
6/18
/200
2
7/2/
2002
7/16
/200
2
7/30
/200
2
8/13
/200
2
8/27
/200
2
9/10
/200
2
9/24
/200
2
10/8
/200
2
10/2
2/20
02
11/5
/200
2
11/1
9/20
02
12/3
/200
2
12/1
7/20
02
12/3
1/20
02
Date
Col
or
(col
oru
nit
s)
Entry Point Croton Lake (Raw) Color MCL

This water quality impairment however is seasonal and usually peaks during the late summer and early fall, (when water demand is greatest. The Croton System contains more natural organic matter (typically measured as total organic carbon) than the Catskill and Delaware Systems. Natural organic matter is produced both within the reservoirs (algae/aquatic plants) and from the watershed (soil organic matter, leaf litter, wetlands). In 2002, the annual mean concentration of total organic carbon in the Croton System was 2.8 mg/L, almost twice as much as the Catskill and Delaware Systems. The presence of eutrophic conditions in the City’s Croton reservoirs makes the Croton System a less reliable water source. Reservoir managers are often required to make operational changes such as withdrawing water from varying depths and at different intakes in an effort to obtain water of acceptable quality. Unfortunately, such manipulations of the intakes are rarely enough to maintain adequate water quality during the late summer when eutrophication is typically at its worst1. For these reasons the Croton System is often taken off-line, sometimes for months, in an effort to prevent violations of water quality standards in the distribution system. Filtration of the Croton System would address these reliability problems. Filtered Croton water would provide higher quality water even during periods of eutrophication-related source water impairment since the treatment process would remove the constituents that cause color as well as organic material before chlorination, greatly reducing the formation of disinfection by-products. 2.3. NON-FILTRATION AND WATERSHED MANAGEMENT 2.3.1. Under Present Conditions Croton Water Consumers are Often Receiving Lower Quality Water Although water from the Croton System has continued to meet current federal and state health-related drinking water quality standards, during certain times of the year consumers of Croton water receive lower quality water than those consumers who receive Catskill/Delaware water. During the summer months, when it would be ideal to maximize the use of Croton water in response to increased demand, the water quality historically degrades. Among the seasonal problems are aesthetic concerns related to color, odor and taste. Indeed, Croton water has exceeded state water quality standards for color on an annual basis, with seven such violations in 2002. Recent research has confirmed the supposition that iron, released into the water from the bottom sediments, is the primary cause of color in the reservoirs. The naturally occurring iron would be removed by filtration. In addition, midge fly larva from Croton water turn up at some consumer taps. Color is an aesthetic issue, unrelated to public health, as is the presence of midge fly larva, but both are obviously important to the consumers of the drinking water. During periods of elevated color, for example, consumers register more frequent complaints about the unfavorable water quality at their taps. The taste, color, odor and midge larva problems
1 Generally, water suppliers prefer to draw from the deeper levels of the reservoir because of cooler temperatures and optimum water quality. However, due to eutrophication, the bottom waters of the New Croton Reservoir become anoxic and contain elevated color and concentrations of metals. The surface water is usually of unacceptable quality due to high concentrations of algae and warm temperatures. The temperature and organic content combined lead to higher chlorine demand, and produce increased levels of disinfection by-products.
Final SEIS Purpose and Need 5
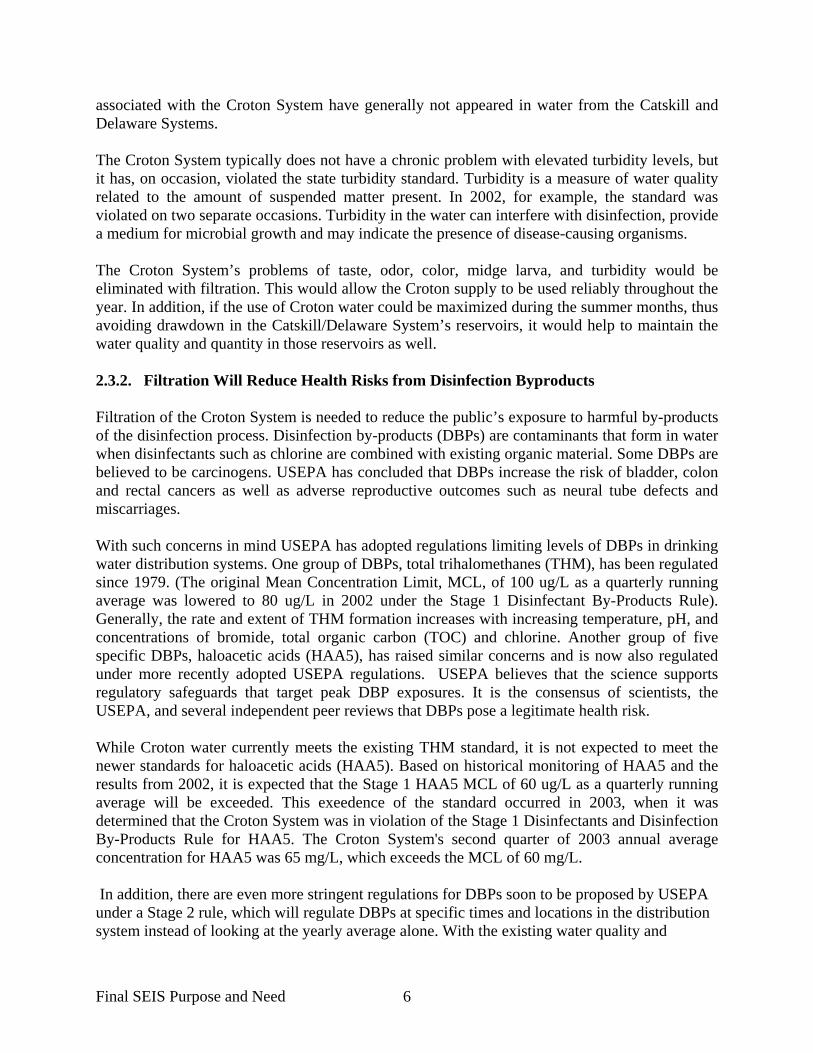
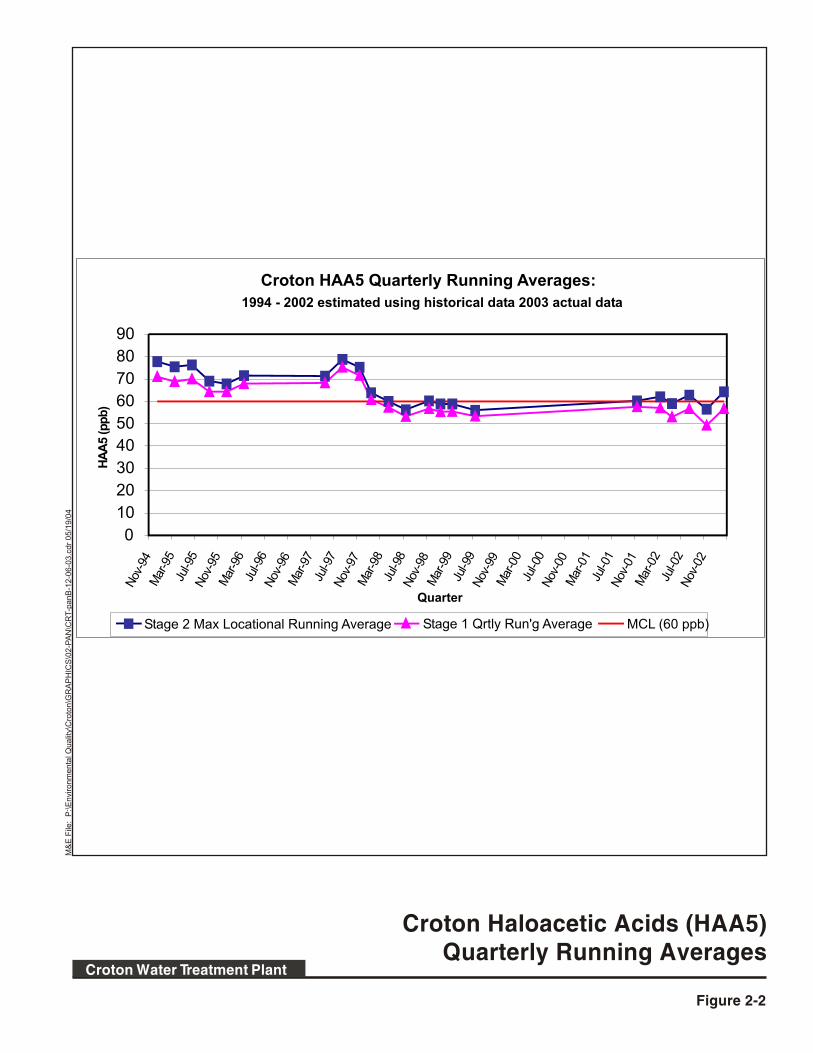
associated with the Croton System have generally not appeared in water from the Catskill and Delaware Systems. The Croton System typically does not have a chronic problem with elevated turbidity levels, but it has, on occasion, violated the state turbidity standard. Turbidity is a measure of water quality related to the amount of suspended matter present. In 2002, for example, the standard was violated on two separate occasions. Turbidity in the water can interfere with disinfection, provide a medium for microbial growth and may indicate the presence of disease-causing organisms. The Croton System’s problems of taste, odor, color, midge larva, and turbidity would be eliminated with filtration. This would allow the Croton supply to be used reliably throughout the year. In addition, if the use of Croton water could be maximized during the summer months, thus avoiding drawdown in the Catskill/Delaware System’s reservoirs, it would help to maintain the water quality and quantity in those reservoirs as well. 2.3.2. Filtration Will Reduce Health Risks from Disinfection Byproducts Filtration of the Croton System is needed to reduce the public’s exposure to harmful by-products of the disinfection process. Disinfection by-products (DBPs) are contaminants that form in water when disinfectants such as chlorine are combined with existing organic material. Some DBPs are believed to be carcinogens. USEPA has concluded that DBPs increase the risk of bladder, colon and rectal cancers as well as adverse reproductive outcomes such as neural tube defects and miscarriages. With such concerns in mind USEPA has adopted regulations limiting levels of DBPs in drinking water distribution systems. One group of DBPs, total trihalomethanes (THM), has been regulated since 1979. (The original Mean Concentration Limit, MCL, of 100 ug/L as a quarterly running average was lowered to 80 ug/L in 2002 under the Stage 1 Disinfectant By-Products Rule). Generally, the rate and extent of THM formation increases with increasing temperature, pH, and concentrations of bromide, total organic carbon (TOC) and chlorine. Another group of five specific DBPs, haloacetic acids (HAA5), has raised similar concerns and is now also regulated under more recently adopted USEPA regulations. USEPA believes that the science supports regulatory safeguards that target peak DBP exposures. It is the consensus of scientists, the USEPA, and several independent peer reviews that DBPs pose a legitimate health risk. While Croton water currently meets the existing THM standard, it is not expected to meet the newer standards for haloacetic acids (HAA5). Based on historical monitoring of HAA5 and the results from 2002, it is expected that the Stage 1 HAA5 MCL of 60 ug/L as a quarterly running average will be exceeded. This exeedence of the standard occurred in 2003, when it was determined that the Croton System was in violation of the Stage 1 Disinfectants and Disinfection By-Products Rule for HAA5. The Croton System's second quarter of 2003 annual average concentration for HAA5 was 65 mg/L, which exceeds the MCL of 60 mg/L. In addition, there are even more stringent regulations for DBPs soon to be proposed by USEPA under a Stage 2 rule, which will regulate DBPs at specific times and locations in the distribution system instead of looking at the yearly average alone. With the existing water quality and
Final SEIS Purpose and Need 6

treatment processes currently applied, Croton water will not be able to meet the even lower Stage 2 MCL for HAA5. 2.3.2.1. Interim Measures to Control Disinfection By-Products
NYCDEP has been evaluating and conducting operational changes to address and decrease the formation of HAAs in the Croton distribution system in response to an EPA Administrative Order following the violation of HAA5s. The interim control measures include both immediate treatment adjustments and other measures currently being investigated that may play a part in reducing HAAs prior to the completion of the Croton project. In order for NYCDEP to reduce HAAs in the interim, before the Croton project is completed, the following interim measures are being considered. Possible interim measures include: 1. Reducing the total chlorine dose
a. Reduce chlorine dosing targets for the NCA b. Change the point of chlorine residual contact time calculation on the NCA
2. Altering the contact time and water age a. Increase the flow down the NCA b. Alter the flow configuration at Jerome Park Reservoir
3. Implementing treatment changes along the conveyance route a. Increase the pH of the water b. Install an alternative primary disinfectant such as chlorine dioxide
4. Reducing total organic carbon in order to reduce levels of DBP precursors a. Apply alum as the water enters New Croton Reservoir
5. Shutting down the system when HAA formation potential is elevated and water storage considerations allow.
6. Blending of Catskill and Croton water at the Croton Lake Gate House Each of these measures needs to be evaluated to determine its ultimate impact on HAA and other disinfection byproduct levels, as well as its feasibility of implementation, scheduling constraints, and costs. As the filtration plant is the long-term solution, the interim measures chosen need to be implementable in a short time frame to protect water quality and public health. Plans are underway to perform bench scale demand studies of chlorine dioxide. Chlorine dioxide does not contribute to the formation of THMs and HAAs. However, other regulated disinfection byproducts are formed i.e., chlorite and chlorate. It is only after primary disinfection, when chlorine is then added as the secondary disinfectant (at Jerome Park Reservoir) that HAA and THM would begin to form. The evaluation of the use of chlorine dioxide includes determining the amount of chlorine dioxide needed to meet chlorine contact time requirements in all seasons, as well as the associated levels of byproducts formed. Chlorine dioxide is not as effective in cold water and extremely high doses may be needed. These high doses would be precluded by the resulting formation of chlorite and chlorate, so chlorine dioxide would not be suitable as a replacement of
Final SEIS Purpose and Need 7

chlorine but it could be used in combination with other disinfectants to lower disinfection byproducts during parts of the year. There would remain periods of the year when chlorine dioxide would either create chorites and chlorates in excess of standards, so this is not a long-term alternative to filtering the Croton Supply and reducing the DBP precursors prior to disinfection. Since the Draft SEIS was published, additional information is available in a report called Investigation of Interim Measures to Control HAA Formation in the Croton System (NYCDEP, February 2004). This study completed the bench scale testing that was proposed in the Draft SEIS. The main drivers for filtering the Croton Supply (in addition to the regulations) include removing particulate matter (including pathogenic microorganisms), reducing color, and controlling disinfection byproducts. Although chlorine dioxide provides some protection against microorganisms, it does not reduce color to acceptable levels and does not adequately control haloacetic acids (HAA). In addition, chlorine dioxide cannot be used to achieve a minimum of 2-log Cryptosporidium inactivation that will be required by the Long Term 2 Enhanced Surface Water Treatment Rule (LT2ESWTR). The required chlorine contact time (CT) values for two and three log inactivation per the proposed LT2ESWTR follow:
CT for 2 log Cryptosporidium: at 20°: 232 mg-min/L at 1°: 1220 mg-min/L
CT for 3 log Cryptosporidium:
at 15°: 347 mg-min/L at 1°: 1830 mg-min/L
Even though the travel time in the NCA is 20 hours (1200 minutes), a sufficient chlorine dioxide residual cannot persist for the entire length without exceeding the MCL for chlorite (a regulated compound) or the maximum residual disinfectant level (MRDL) for upstate communities.
A major disadvantage of chlorine dioxide is the formation of chlorite, a byproduct of chlorine dioxide treatment. The maximum contaminant level (MCL) for chlorite is 1.0 mg/L. This MCL was promulgated in December 1998 as part of the Stage 1 Disinfectants/Disinfection Byproduct Rule. Another significant disadvantage of chlorine dioxide is the formation of obnoxious cat-urine or kerosene odors in homes with new carpets and drapes. The cause of these odors is the release of chlorine dioxide (formed in the distribution system from the reaction between chlorine and residual chlorite) that then reacts with volatile chemicals in the air that are released from such sources as carpets and drapes. Experience suggests that this can be controlled by limiting chlorite residuals to approximately 0.4 to 0.5 mg/L. Chlorite removal strategies can be employed to eliminate this problem; however, the application of ferrous-based chemicals would require large feed facilities along the aqueduct or in the vicinity of Jerome Reservoir. In addition, sediment would accumulate in the aqueduct or in the reservoir, which could cause adverse water quality conditions. Because of these limitations, the regulations and the consent order requiring filtration, chlorine dioxide is not an acceptable approach for treating the Croton Water Supply.
Final SEIS Purpose and Need 8

Nevertheless, as part of a response for violating the Stage 1 HAA MCL in the Croton System, bench testing of chlorine dioxide treatment as a means of controlling HAAs was conducted by the University of Toronto during late 2003. The results show that chlorine dioxide treatment did not reduce color to the goal of 10 color units (to be comparable to Cat/Del water). More importantly, the application of chlorine dioxide did not consistently reduce the formation of HAAs. While under one set of conditions a modest reductions in HAA (up to 25%) was observed, when tests were repeated HAA levels increased. The study concluded that the application of chlorine dioxide did not consistently reduce the formation of HAAs. There was a wide variation in results based on the test and analytical conditions. While under one set of conditions a modest reductions in HAA (up to 25%) was observed, when repeated HAA levels increased. In all cases after-treatment with chlorine would still be required. These tests concluded that there would be little or inconsistent benefit and a serious increase in complexity if this disinfection strategy is adopted. Based on these data, there is doubt that the use of chlorine dioxide would allow the Croton System to meet the current Stage 1or proposed Stage 2 D/DBP levels. 2.3.2.2. Sources of Disinfection By-Products in the Croton System
NYCDEP has been monitoring THM formation potential (THMFP) in the New Croton Reservoir and its major tributaries since 1992. The data show that organic carbon precursors originate in the watershed, not in the reservoir from algae production. In 1999, NYCDEP expanded the monitoring to include several more reservoirs and tributaries, with targeted sampling of wetlands and wastewater treatment plants. This expanded program concluded that the watershed is the major source of THMFP in New Croton Reservoir, and that wetlands are a potentially significant source. This result is not surprising since many wetlands discharge “tea-colored” waters containing high amounts of organic carbon into the reservoirs. The reservoirs generally acted as sinks for THMFP, not sources, indicating that nutrient management would not be an effective management strategy to control THM precursors. The most recent annual monitoring data available are shown in Figure 2-2. When NYCDEP made a commitment in 1998 to continue to study alternatives to filtration, it initiated a series of studies called the Process Studies Research Project. This project continued NYCDEP’s investigation into watershed sources of THM and HAA precursors. A wide variety of land uses were monitored during the years from mid-2000 to mid-2002, including residential (sewered and septic), agricultural, forested, wetlands and wastewater treatment plants. The results indicated that wetlands were the dominant source for both organic carbon and disinfection by-product precursors. In Figure 2-3, the four sites shown represent a range of urbanization from forested to high density residential and to a wetland. The outflow from the wetland site has much higher concentrations of filtered total THM formation potential and HAA formation potential. These studies into the sources of disinfection by-products consistently indicate that the watershed is the source for these precursors.
Final SEIS Purpose and Need 9
Croton Haloacetic Acids (HAA5) Quarterly Running Averages
Figure 2-2
M&
E F
ile: P
:\E
nvi
ron
me
nta
l Qu
alit
y\C
roto
n\G
RA
PH
ICS
\02
-PA
N\C
RT-p
an
B-1
2-0
6-0
3.c
dr
05
/19
/04
Croton Water Treatment Plant
Croton HAA5 Quarterly Running Averages:
1994 - 2002 estimated using historical data 2003 actual data
0
10
20
30
40
50
60
70
80
90
Nov
-94
Mar
-95
Jul-9
5N
ov-9
5M
ar-9
6Ju
l-96
Nov
-96
Mar
-97
Jul-9
7N
ov-9
7M
ar-9
8Ju
l-98
Nov
-98
Mar
-99
Jul-9
9N
ov-9
9M
ar-0
0Ju
l-00
Nov
-00
Mar
-01
Jul-0
1N
ov-0
1M
ar-0
2Ju
l-02
Nov
-02
Quarter
HA
A5
(pp
b)
Stage 2 Max Locational Running Average Stage 1 Qrtly Run'g Average MCL (60 ppb)

Differences in Haloacetic Acids Between Land Use Types in a Calibrated Catchment
in the New Croton Reservoir Watershed
Figure 2-3
M&
E F
ile: P
:\E
nvi
ron
me
nta
l Qu
alit
y\C
roto
n\2
00
4 F
ina
l SE
IS\G
RA
PH
ICS
\02
-PA
N\C
RT-p
an
C-1
2-0
6-0
3.c
dr
06
/24
/03
Croton Water Treatment Plant
HAA Monthly Average
0
500
1000
1500
2000
Jul-0
0
Sep-0
0
Nov-00
Jan-
01
Mar
-01
May
-01
Jul-0
1
Sep-0
1
Nov-01
Jan-
02
Mar
-02
May
-02
Jul-0
2
HA
AF
orm
ation
Pote
ntial(u
g/l) 100% urban
50% urban
Undeveloped
Wetland

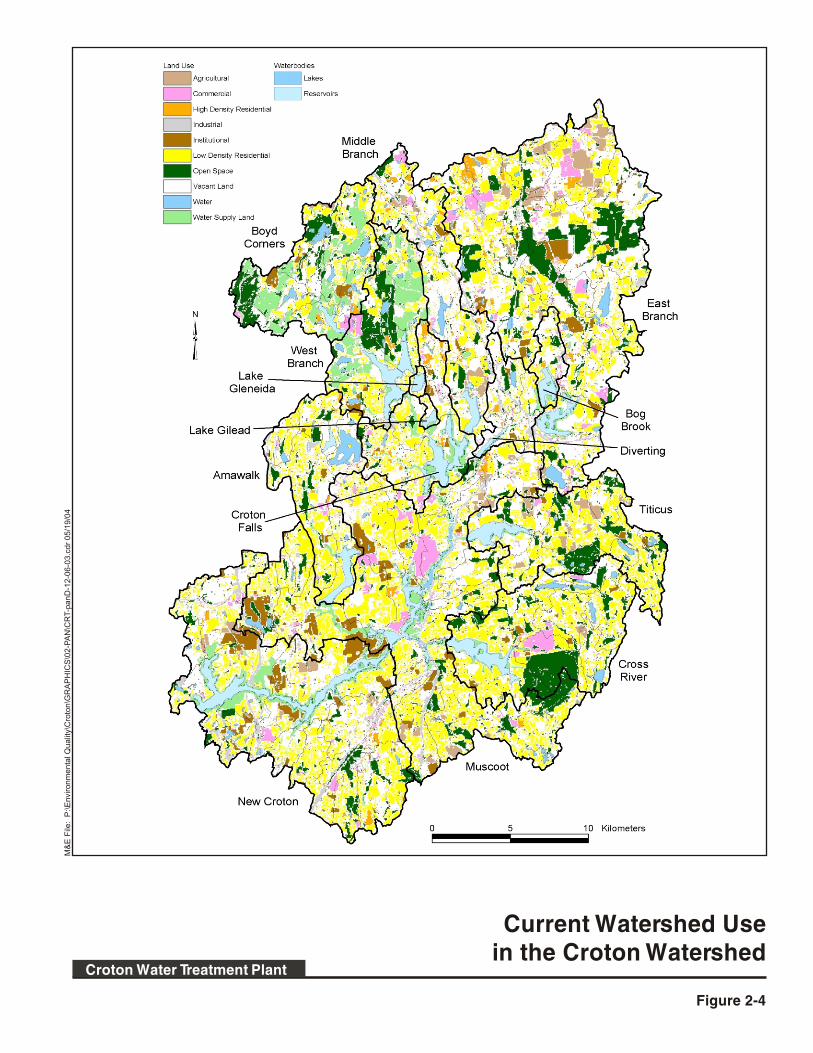
2.3.3. Filtration Will Reduce Risks from Microbial Contaminants The main purpose of the SWTR is to insure that public drinking water supplies are protected from microbial contamination. Microorganisms such as bacteria, viruses and protozoan organisms like Giardia and Cryptosporidium pose potential public health threats. These organisms can cause gastrointestinal disorders that include symptoms such as vomiting and diarrhea, and can be potentially life threatening for the immune-compromised, elderly and young. Both physical removal and inactivation through disinfection are methods of reducing microbial risk that are required under the SWTR. The widespread development of the Croton watershed makes Croton reservoirs and their tributaries more susceptible to microbial contamination. There are today approximately 190,000 people living in the Croton watershed as well as roughly 98,000 septic systems and 63 sewage treatment plants. In total, more than five million gallons of treated sewage enters the Croton reservoirs tributaries every day. In addition, a vast network of roads, parking lots and other paved surfaces channel stormwater and contaminants into the local waterways. Noting that population density in the Croton watershed is ten times that in the Catskill/Delaware watersheds, USEPA concluded, “extensive development and increasing human activity in the Croton watershed necessitate filtration.”2
See Figure 2-4. 2.3.4. The Croton Watershed Does Not Meet the Surface Water Treatment Rule’s Criteria for Filtration Avoidance In addition to chronic water quality issues, one reason that the City chose not to pursue Filtration Avoidance after the promulgation of the SWTR in 1989 was that Filtration Avoidance would have required the demonstration of “watershed control” by the City. The highly developed Croton watershed does not meet the SWTR requirement that the water supplier demonstrate ownership or control of the watershed to safeguard against human activities that may have an adverse impact on source water quality. 2.3.4.1. Systems that have Achieved Filtration Avoidance Designations
In contrast to the incomplete watershed control in the Croton watershed, systems that have achieved filtration avoidance have very different characteristics. Larger water suppliers that are permitted not to filter are summarized below and in Table 2-1. The following summaries are taken from the 2002 Annual Water Quality reports from the water suppliers described below and from the USEPA.3
2 USEPA. "Questions and Answers: Filtration of the New York City Croton Water Supply" sent to National Research Defense Council on April 25, 1997 as an attachment to a letter to Mr. Goldstein from Jeanne Fox 3 USEPA. 1999. Protecting Sources of Drinking Water: Selected Case Studies in Watershed Management. EPA 816-R-98-019
Final SEIS Purpose and Need 12
Current Watershed Use in the Croton Watershed
Figure 2-4
M&
E F
ile: P
:\E
nvi
ron
me
nta
l Qu
alit
y\C
roto
n\G
RA
PH
ICS
\02
-PA
N\C
RT-p
an
D-1
2-0
6-0
3.c
dr
05
/19
/04
Croton Water Treatment Plant

San Francisco, California The 459 square mile Hetch Hetchy reservoir watershed, located entirely in Yosemite National Park, relies on spring snowmelt to provide approximately 85 percent of San Francisco's total water needs. Much of the remote, high altitude watershed is federally protected wilderness area, and most is inaccessible up to nine months a year due to high snow depths. The San Francisco Public Utilities Commission (PUC) works with the National Park Service to protect water quality and contributes over $1 million per year to fund Hetch Hetchy Watershed protection programs. These include special backcountry patrols by the National Park Service, campground clean-up crews and improvements to visitor facilities in Yosemite’s Tuolumne Meadow. The patrols ensure that hikers and campers comply with the Raker and the Wilderness Acts. Currently, the San Francisco PUC is examining the use of ozone and ultraviolet light disinfection to comply with proposed provisions in the Long Term 2 Enhanced Surface Water Treatment Rule (LT2ESWTR) requiring the use of at least two disinfectants to obtain the minimum log-inactivation Cryptosporidium. Seattle, Washington
The historically unfiltered Tolt System draws from an "isolated reservoir in the Cascade Mountains surrounded by an uninhabited, undeveloped 20 square mile watershed." Seattle added filtration and ozonation for the 120-mgd Tolt supply in 2000, despite the remote, pristine, protected watershed, in order to handle turbidity greater than 5 turbidity units during periods such as low reservoir levels, high winds, and heavy rain events. Seattle's 141 square miles Cedar River Watershed, by contrast, remains unfiltered and is closed to unauthorized access to protect water quality. An ozonation facility has been constructed to provide additional disinfection for the Cedar River source. The area is bounded by wilderness and the edge of suburban Seattle. Most of the watershed is not fenced except near residential areas and a team of seven full-time watershed inspectors carefully monitors the quality of the water. The watershed is managed under the Cedar River Watershed Habitat Conservation Plan, a 50-year, ecosystem-based plan designed to protect the City's drinking water supply and habitats of 83 species of fish. Tacoma, Washington
The City of Tacoma provides unfiltered water to its 300,000 residents from the Green River. The City of Tacoma owns only 10 percent of the 231 square mile forested watershed, but limits access and controls maintenance and forestry activities through agreements with private landowners and government agencies. Located in an uninhabited area of the Cascade Mountains between the Chinook and Snoqualmie Passes, the Green River source is predominately fed through snowmelt and seasonal rains. Currently, the water treatment is limited to chlorine disinfection, pH control and fluoridation. Implementation of the proposed requirements of the LT2ESWTR will require that the water either be filtered or disinfected using a minimum of two disinfectants. The City of Tacoma is
Final SEIS Purpose and Need 14

investigating future treatment provisions at this time, including investigation of the feasibility of implementing UV disinfection and membrane filtration. Portland, Oregon
Portland's 102 square mile Bull Run watershed remains unfiltered. The watershed is part of the Mt. Hood National Forest and is cooperatively managed by the U.S. Forest Service and the Portland Bureau of Water Works. The watershed is closed to the public, and logging is heavily restricted. Compliance with LT2ESWTR may be achieved in the future via membrane filtration or other options. Juneau, Alaska
Approximately one-third of the potable water supplied to the 30,700 residents of Juneau is unfiltered. The City and Borough of Juneau controls 100 percent of the Salmon River watershed through its source water protection program. Portland, Maine
Portland's 468 square mile Sebago Lake watershed supplies an average of 23-mgd of unfiltered water to its 160,000 residents. The Portland Water District owns 2,500 acres of land around Sebago Lake. This area under ownership and active control represents approximately eight (8) percent of the total watershed. Portland has installed ozonation facilities to enhance disinfection, and converted secondary disinfection to chloramines to address taste and odor concerns and elevated disinfection byproducts in the distribution system. Bangor, Maine
The Bangor Water Board supplies unfiltered water from Floods Pond to its 25,000 residents. The City of Bangor owns approximately 90 percent of the 4.7 square mile watershed. An ozonation facility has been constructed to provide supplemental disinfection of the water supply. Incline Village, Nevada (Lake Tahoe)
The Incline Village General Improvement District (District) provides unfiltered water from Lake Tahoe to its population of approximately 10,000 residents. The Burnt Cedar Water Disinfection Plant uses ozonation and chlorine disinfection prior to distribution of the water. Granted a Filtration Avoidance Exemption in 1992, the District maintains a comprehensive source water-monitoring program coupled with watershed protection controls. The watershed spans over 502 square miles and naturally impounds water in Lake Tahoe, the tenth deepest lake in the world, possessing an average residence time of 700 years, Lake Tahoe is renowned for extreme clarity, low nitrogen and phosphorus levels, low turbidities and color, and
Final SEIS Purpose and Need 15

minimal chlorine demand. Although the utility controls very little of the watershed, surrounding parks and municipalities actively manage approximately 11 percent of the total watershed. New York City, New York
New York City currently provides water to 9,000,000 consumers using unfiltered water from the Croton, Catskill and Delaware watersheds. Filtration avoidance has been granted on a five-year basis for the Catskill and Delaware Systems, but the City has been ordered to treat these waters with ultraviolet light (UV) disinfection. The City is under a court order to filter the water from the Croton System, as UV disinfection will not solve the Croton System’s water quality problems. Boston, Massachusetts
The Boston area, served by the Metropolitan Water Resources Authority (MWRA), successfully fought an order by USEPA to filter because of violations caused by microbes in the water. The MWRA argued that the microbes could be controlled by additional disinfection and the construction of a very large treated water storage tank to provide additional disinfection contact time. Syracuse, New York
Over 90 percent of the water supplied to the 147,000 residents of Syracuse, New York is unfiltered water from Skaneateles Lake. Skaneateles Lake is located approximately 20-miles south of Syracuse. The Skaneateles Lake watershed is managed by the City of Syracuse’s source water protection program. Other Maine Systems
There are a number of smaller communities in Maine that have active programs to control certain activities in their respective watersheds. This allows the communities of Lewiston/Auburn (Lake Auburn), Bar Harbor, Bethel, Brewer, Camden, Damariscotta, and Mount Desert to provide pristine water to their customers.
Final SEIS Purpose and Need 16

TABLE 2-1. PARTIAL LIST: UNFILTERED WATER SYSTEMS IN THE UNITED STATES
System Location Source PopulationServed
Population in Watershed
Estimated Watershed Size
Percent Watershed
Control
Current Treatment
Status
San Francisco Public Utilities Commission
San Francisco, CA
Hetch Hetchy Reservoir
2,100,000 0 459 sq. miles 100 percent (National Park land)
Chlorination Filtration Avoidance criteria achieved. Studying use of ozone/UV for LT2 Compliance
Seattle Public Utilities
Seattle, WA
Cedar River 1,200,000 0 141 sq. miles 100 percent owned and controlled
Ozonation/UV Filtration Avoidance criteria achieved. Consent Order to ozonate issued in 1992 and 2002.
Tacoma Water Tacoma, WA
Green River 300,000 0 231 sq. miles. 10 percent (100 percent by agreement with owners: Forestry & Parkland)
Chlorination
Filtration Avoidance criteria achieved. Utility is installing ozonation as an interim solution to address qualitative concerns. Studying UV and filtration for LT2ESWTR compliance.
Portland Water Bureau
Portland, OR
Bull Run 800,000 0 102 sq. miles 100 percent Chlorination Filtration Avoidance criteria achieved. Feasibility of using membrane treatment or UV disinfection is being studied for LT2ESWTR compliance.
Portland Water District
Portland, ME
Sebago Lake
160,000 Un-determined
361 sq. miles
<1 percent owned by utility
Ozonation/ chloramination
Filtration Avoidance criteria achieved
City and Borough of Juneau Water System
Juneau, AK
Salmon Creek
30,700 0 4.3 sq. miles 100 percent Chlorination Filtration Avoidance criteria achieved when turbidity below MCL
Incline Village General Improvement District Utilities Department
Lake Tahoe, NV
Lake Tahoe 9,950 124,000 (1980)
506 sq. miles. <1 percent 11 percent total
Ozonation/ Chlorination
Filtration Avoidance criteria achieved
Massachusetts Water Resources Authority
MA QuabbinWatershed Wachusett Watershed
1,932,000 187 sq. miles 110 sq. miles
75 percent
Ozonation/ Chlorination
Filtration Avoidance Exemption Granted by courts following legal challenge
New York City Department of Environmental Protection
New York City
Catskill Watershed Delaware Watershed
9,000,000 1,969 sq. miles ~30 percent publicly owned & controlled; voluntary controls in
Chlorination Filtration Avoidance Exemption Granted 2002; valid until 2007
Final SEIS Purpose and Need 17
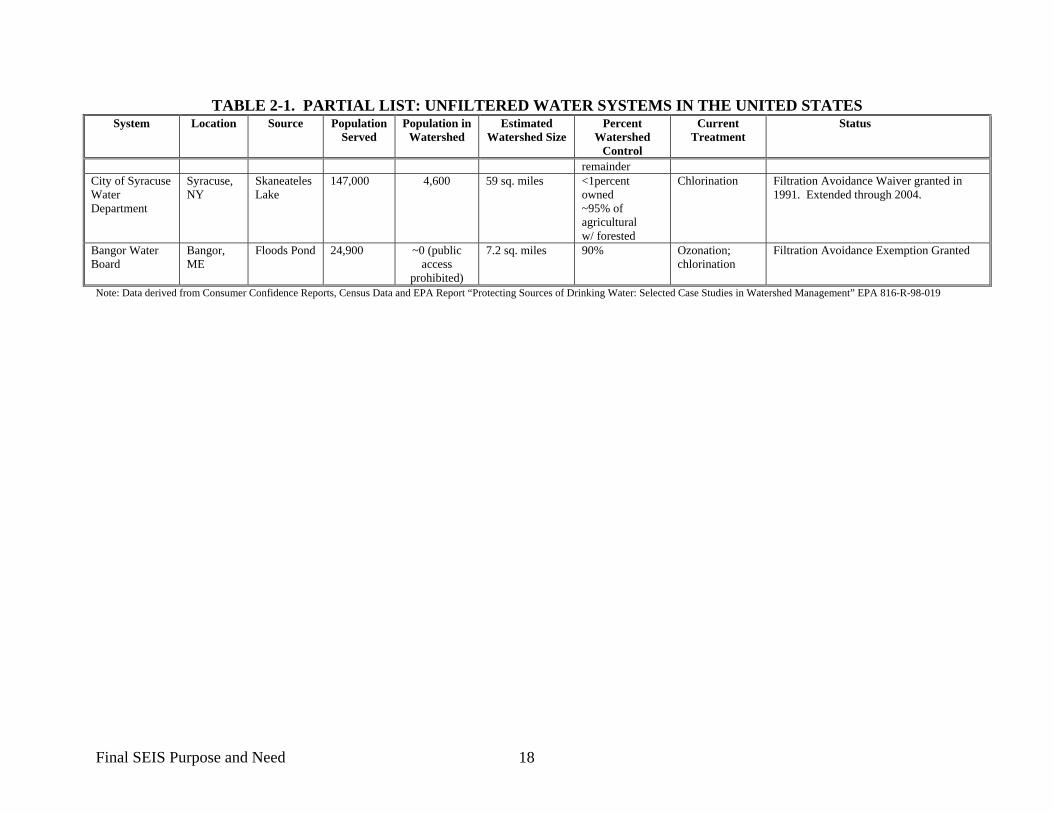
TABLE 2-1. PARTIAL LIST: UNFILTERED WATER SYSTEMS IN THE UNITED STATES System Location Source Population
Served Population in
Watershed Estimated
Watershed Size Percent
Watershed Control
Current Treatment
Status
remainder City of Syracuse Water Department
Syracuse, NY
Skaneateles Lake
147,000 4,600 59 sq. miles <1percent owned ~95% of agricultural w/ forested
Chlorination Filtration Avoidance Waiver granted in 1991. Extended through 2004.
Bangor Water Board
Bangor, ME
Floods Pond 24,900 ~0 (public access
prohibited)
7.2 sq. miles 90% Ozonation; chlorination
Filtration Avoidance Exemption Granted
Note: Data derived from Consumer Confidence Reports, Census Data and EPA Report “Protecting Sources of Drinking Water: Selected Case Studies in Watershed Management” EPA 816-R-98-019
Final SEIS Purpose and Need 18

2.3.4.2. Watershed Control in the Croton System
In contrast to the systems described above, a significant amount of the Croton watershed, approximately 80 percent, is suburbanized as defined by population density. More than half of the 190,000 people currently living in the watershed are within the 60-day travel time distance to the water supply intakes. The majority of residents use septic systems (~98,000) and groundwater wells. The watershed also contains 63 sewage treatment plants with a total discharge capacity of 5.53 million gallons per day.
Development in the Croton watershed has been accompanied by an extensive infrastructure of roads and highways, wastewater treatment plants, septic systems, and stormwater collection systems. The negative impacts of development on water quality have been known for decades. Recently, NYCDEP reinvestigated the impacts of residential development as part of the Process Studies Research Project, which was conducted in the sub-basins of the Croton watershed. The preliminary results indicate: Hydrology – streams in urbanized watersheds have higher peak flows during storms, shorter time between the start of a storm and the peak stream flow (“flashy” response), greater surface runoff, and reduced infiltration to groundwater. Combined, these can result in greater stream volume and faster water velocities, leading to erosion and stream bank instabilities. Water Quality – streams in urbanized watersheds had consistently higher ammonia and nitrate concentrations (indicators of septic system discharges), total and dissolved phosphorus (causes of eutrophication), sodium and chloride (from road salt). Stormwater from urbanized areas, and their associated impervious surfaces, is a leading cause of water quality impairment. NYCDEP has been gathering watershed-specific information on the effect of urbanized areas through the Process Studies Research Project, conducted for NYCDEP by an independent academic research consortium (Upstate Freshwater Research Institute). The Process Studies Research Project confirmed higher storm-related flows and higher pollutant concentrations from urbanized watersheds. In addition, the research also confirmed earlier results from the United States Geological Survey (USGS), which showed that on an annual basis approximately 70 percent of the water in the streams is derived from baseflow entering the streams from shallow groundwater sources. The recent research further demonstrated that much of this water is influenced by septic systems, which are potential sources of microbes and other contaminants. Moreover, the risk of accidental spills or releases negatively impacting water quality also rises with increases in population and the supporting infrastructure. For example, the NYCDEP Hazardous Material Response Team was notified of 18 spills within the New Croton Reservoir basin in 2002. A third of these incidents involved sewage spills. The risk of pathogens entering the water supply from accidental sources such as this is serious since the entire New Croton
Final SEIS Purpose and Need 19

Types of Hazardous Spills in the New Croton Watershed
for the Year 2002
Figure 2-5
M&
E F
ile: P
:\E
nvi
ron
me
nta
l Qu
alit
y\C
roto
n\G
RA
PH
ICS
\02
-PA
N\C
RT-p
an
E-1
2-0
6-0
3.c
dr
05
/19
/04
Croton Water Treatment Plant
New Croton Reservoir Spills, n =18
2002Bio-hazard
Fuel
Fuel Oil
Gasoline
Hydraulic Oil
Hydrocarbons
Oil
Paint
Sew age

basin lies within a 60-day travel time distance4 to the intakes where treatment begins. The amounts and types of spills reported for the New Croton basin are given in Figure 2-5. In addition to threats from development and human activities within the watershed itself, water quality in the Croton System can also be threatened by spills in close proximity to the New Croton Aqueduct, which lies outside of the Croton watershed. In the past 10 years, there have been over 700 reported spills within 1/4 mile of the aqueduct. One such incident, in 1996, closed the aqueduct several times for many months while the site was remediated, due to petroleum contamination. In sum, the large number of people living within the Croton watershed and within 60-day travel time distance to water supply intakes, the extensive and highly developed infrastructure in the Croton watershed, and the ongoing risks from accidental spills or releases do not satisfy the SWTR requirements for filtration avoidance. 2.3.5. Compliance with Safe Drinking Water Act and Federal Court Order For more than ten years, the City has been legally obligated to filter the Croton supply. The City entered into a Stipulation Agreement with NYSDOH for filtration of Croton water in 1992. In 1993, the USEPA issued a written determination that the City must filter Croton water, and indicated its intention to monitor the City’s compliance with the Safe Drinking Water Act and SWTR. In 1997, as a result of dissatisfaction with the City’s progress, the United States and the State of New York brought an action against the City, alleging violations of the Act and Rule. After extensive negotiations, the United States, the State and the City entered into a Consent Decree, setting out an enforceable schedule for the design and construction of a Croton water filtration plant by 2007. In 2001, after an adverse court decision involving the siting of the filtration plant at the Mosholu Golf Course, the parties negotiated a Supplement to the Consent Decree (Supplement), requiring the City to examine sites in the Bronx and Westchester County, and setting out revised schedules. The court entered the Supplement in December 2001. The Supplement to the Consent Decree extended the requirement to operate the Croton WTP to 2010 or 2011, depending on the final choice of site for the water treatment plant. The Consent Decree has a clause that says the City can open a discussion with the regulators about an alternative to filtration if persuasive new information is available that provides alternatives. The City undertook a “dual track” planning approach to Croton filtration; one track to design and site a water treatment plant, and another track to explore alternatives to filtration. This work is still ongoing, but the studies completed to date, along with the new regulations described above, have not provided evidence that there is a reliable alternative to providing safe drinking water besides filtration. These studies are summarized in the following sections. 2.3.6. Non-Filtration Alternatives and/or Disinfectants Are Not Adequate Even though filtering the Croton System would solve the existing water quality and public health risk issues, NYCDEP extensively investigated and tested non-filtration alternatives. The 4 As part of the NYCDEP Watershed Rules and Regulations, new surface water discharges from wastewater treatment plants are prohibited within a 60-day travel time of a water supply intake, as measured by surface and groundwater flow rates.
Final SEIS Purpose and Need 21
Extended Special Study Program (ESSP), conducted in 1996-1997, evaluated non-filtration alternatives for meeting water quality goals. The ESSP investigated watershed management practices, in-reservoir actions, chemical addition alternatives, combinations of disinfection processes and system operational constraints both separately and in combination. The evaluation of alternatives looked at implementability (e.g., technical feasibility, permit requirements) and effectiveness (e.g., improvement in water quality, reliability) of the alternatives. A hydrodynamic/reservoir eutrophication model was specifically developed for the Muscoot and New Croton Reservoirs to aid in the evaluation of alternatives. A plan that required aggressive actions that did not include filtration was developed and it was concluded that this Optimal Non-Filtration Plan (Plan) could meet water quality goals, but not with the same reliability as filtration. This Plan was reviewed by a “peer review” panel of water quality experts5 and further reviewed by an independent firm hired at the request of a coalition of citizens groups, FX Browne. Both review groups endorsed the general conclusions, although FX Browne recommended that additional studies could be done to confirm the modeling assumptions.6 The Plan recommended by the ESSP contained the following elements:
• Full-scale hypolimnetic aeration of the New Croton Reservoir; • Continuous alum addition at the Muscoot Dam; and • Microscreening for larvae removal at the Jerome Park Reservoir.
Hypolimnetic aeration of the reservoir was included to address internal sources of color and metals resulting from anoxic conditions in the reservoir. Continuous alum treatment was included to address phosphorus and organic carbon loading to New Croton Reservoir. An option that was considered for the Plan was the construction of 300 acres of wetlands/extended detention ponds. However, modeling indicated little to no impact on the key water quality variables of phosphorus and organic carbon even if three times the amount of acreage obtainable was utilized for wetlands and extended detention basins. These best management practices (BMP) were primarily included as an option of the Plan because they would protect the land acquired from future development. The Plan concluded that a combination of full-scale hypolimnetic aeration, alum addition, and microscreening of larvae could meet water quality goals under most conditions. However, storms and other uncontrollable events would result in occasional upsets and failure to meet goals. The Plan’s use of aeration and alum addition would cause impacts to the New Croton Reservoir, and NYSDEC ruled that alum addition alone could result in potentially significant adverse impacts.
5 Dr. Dennis Cooke, Department of Biological Sciences, Kent State University, Dr. Eugene B. Welch, Department of Civil Engineering, University of Washington, Dr. Alex J. Horne, Department of Civil & Environmental Engineering, University of California, and Dr. Martin T. Auer, Professor of Civil and Environmental Engineering, Michigan Technological University. 6 FX Browne, Inc. 1999. Browne Report: Review Comments on the Optimal Watershed Management Plan.
Final SEIS Purpose and Need 22

The ESSP also conducted a “pristine” watershed analysis, removing all human influences such as wastewater treatment plants and developed land. The model runs indicated that the quality of the water generated from a completely forested Croton watershed would not meet the color water quality standard set by the State. Moreover, organic carbon levels increased as a result of this hypothetical land use change to forest. The low terrain and large watershed of the Croton watershed (relative to the Catskill and Delaware watersheds) and the deep soils all contribute to natural enrichment. Forests and wetlands are highly effective at removing nutrients when they are in short supply, but when nutrients are abundant the vegetation uses the nutrients to produce organic carbon compounds. These compounds are colored and are also DPB precursors. After the ESSP ended, NYCDEP has continued to investigate watershed management alternatives in the Croton System, incorporating the results of the ESSP and certain peer review recommendations. In particular, NYCDEP investigated the feasibility of the proposed technologies, hypolimnetic aeration, alum treatment, and the watershed-specific sources of color, nutrients and disinfection by-products in the Croton watershed. The results of all these investigations indicated that watershed management alone would not ensure a safe, reliable supply of water from the Croton System. In addition to alternative treatments, alternative disinfection technologies were evaluated for the Croton supply. These included different combinations of disinfectants including chlorine, chloramines, ozone, and chlorine dioxide. Based on these evaluations, no disinfection alternatives were found to adequately address the water quality issues in the Croton System. Special attention was paid to chlorine dioxide because it does not generate THMs or HAAs. However, it does generate chlorites, another class of DBP that is regulated and limits the use of chlorine dioxide to that of only a partial disinfectant to be used in conjunction with another disinfectant. Furthermore, during the subsequent development of the proposed LT2 Rule, chlorine dioxide was found to be less advantageous in controlling Cryptosporium than originally thought; and coupled with the limitations on its dosage and by-products levels established in the Stage 2 Rule, made it unacceptable for use in the Croton System. 2.3.7. NYCDEP’s Croton System Watershed Protection Efforts Are Continuing In advancing filtration of the Croton System, the City has no intention of reducing or altering its watershed protection efforts in the Croton watershed. Watershed protection is a critical component of the multiple barrier approach for protection of the water supply. A multiple barrier approach uses several lines of defense to ensure a high quality water supply. By optimizing raw water quality, watershed protection can minimize the risks of pathogens and other contaminants entering the distribution system. NYCDEP believes that a strong watershed protection program will continue to be an essential part of safeguarding the Croton supply for future generations. Indeed, NYCDEP has had an extensive watershed management program in the Croton System, consisting of regulatory and non-regulatory components. For example, even after the Croton Consent Decree was signed, requiring a tight schedule for construction of a water treatment facility, NYCDEP committed hundreds of millions of dollars to Croton watershed protection. A brief summary of key Croton watershed management programs is provided below.
Final SEIS Purpose and Need 23

• Wastewater Treatment Plant Upgrades and Diversion ($200 million) – NYCDEP has committed to fund the upgrades of all City-owned and non-City-owned wastewater treatment plants (WWTPs) to state-of-the-art tertiary treatment facilities. In the Croton Watershed, a total of eight facilities (22 percent of the total flow) have their upgrade plans on hold until final decisions are made regarding diversion off the watershed. One City-owned facility is upgraded (Mahopac WWTP) and the other will be rebuilt and turned over to the village to operate (Brewster WWTP). Several private and/or municipal facilities have completed their upgrades and the majority is currently in the process of upgrading.
• Land Acquisition ($38.5 million). Through its watershed land acquisition efforts, NYCDEP has secured several key parcels in the New Croton Reservoir basin. NYCDEP initially committed $10 million for land acquisition in the Croton system under the MOA, later increased to $13.5 million. To date, $7,400,000 has been spent and 526 acres have been acquired by the City through outright purchase or conservation easements. An additional $25 million has recently been allocated by the City for additional purchases in the Croton and Cross River watersheds. The City has also worked with the State to direct State acquisition dollars; to date, NYSDEC has acquired 693 acres at a cost of $7.5 million. These properties will be conveyed to the City under MOA guidelines. In total, more that 1,200 acres have been permanently protected through the City's Land Acquisition Program in the Croton system (See Figure 2-6). In addition to the properties shown on this figure, two properties totaling 560 acres in Putnam County were acquired by the County using funds provided by the City and will be largely protected from future development. The City also cooperates with other agencies and municipalities to leverage their resources to secure permanent protection.
Final SEIS Purpose and Need 24

Map of Recent Land Acquisitions Around New Croton Reservoir
Figure 2-6
M&
E F
ile: P
:\E
nvi
ron
me
nta
l Qu
alit
y\C
roto
n\G
RA
PH
ICS
\02
-PA
N\C
RT-p
an
F-1
2-0
6-0
3.c
dr
05
/19
/04
Croton Water Treatment Plant
• East-of-Hudson Non-point Source Program ($20 million) – NYCDEP is implementing a program to protect selected Croton basins from non-point sources7 of pollution. Key components of the program will include construction of stormwater management practices, and mapping, inspection and repair as necessary of storm and sanitary sewers. In addition, NYCDEP has been coordinating with the New York State Department of Transportation and county and local officials to address a number of sites identified by Trout Unlimited as in need of stormwater retrofits or other erosion and sediment controls.
• East-of-Hudson Watershed Agricultural Program ($3.3 million) – Modeled after the highly successful west of Hudson Agricultural Program, NYCDEP and the Watershed Agricultural Council will work with farmers in the Croton watershed to design and install best management practices to reduce or eliminate polluted runoff from farms.
• Croton Process Studies ($6 million) – NYCDEP, through a contract with the State University of New York College of Environmental Studies and Forestry (SUNY-ESF), is gathering watershed-specific information on the sources and spatial and temporal characteristics of nutrients and precursors of disinfection by-products. The extensive sampling program includes baseflow and storm event sampling at sites located throughout the watershed and intensive in-reservoir sampling at key locations. This research into the sources of key water quality constituents will be valuable in guiding management decisions and developing reservoir and terrestrial models for the Croton System. Several of the results of this study have been described above.
• East-of-Hudson Reservoir and Terrestrial Models ($459,000) – NYCDEP obtained several grants from federal funds allocated under the Safe Drinking Water Act to pursue the development of reservoir and terrestrial models for the Croton System. Most of these projects are currently underway.
• Croton Watershed Strategy ($2.6 million) - This project consists of watershed analyses at the subbasin scale (for phosphorus, suspended solids, pathogens, toxics and pesticides), and recommended management strategies and prioritization of efforts for the watershed. The analyses were also programmed into a GIS-based management tool.
• Wetland Programs ($150,000) – Wetlands play an important role in water quality protection but they can also contribute to problems with disinfection by-product precursors, nutrients and color. NYCDEP has a number of ongoing wetland programs, including updating the National Wetlands Inventory maps, investigating the water quality impacts of different functional wetland types, and documenting trends in wetland losses in the East-of-Hudson watershed.
• THM Formation Potential Study ($115,400) – In addition to the routine monitoring of New Croton and Muscoot reservoirs for THM formation potential, NYCDEP conducted a one-year expanded monitoring program to further determine the origins of THM precursors within the Croton watershed.
• Hypolimnetic Aeration Pilot ($1.5 million) – NYCDEP conducted a two-year hypolimnetic aeration pilot program (1998 – 2000), employing three aerators in the New Croton Reservoir. Extensive reservoir monitoring was conducted to evaluate the water quality benefits of aeration and to further refine designs for full-scale aeration. The pilot
7 Examples of non-point sources include stormwater drains, agricultural run-off from fields and pastures and construction sites.
Final SEIS Purpose and Need 26

demonstrated at least a minor water quality benefit due to aeration as well as providing useful information on aerator design and operations. However, additional information is needed from other ongoing research projects concerning the origins of color in the reservoir before a final determination can be made regarding the utility of hypolimnetic aeration in this system.
• USGS Stream Gauging Monitoring Program ($1.3 million) – In the Croton System USGS and NYCDEP have been installing and maintaining additional stream monitoring gauges for the past 6 years to help provide a deeper understanding of how the water in the Croton System moves through the system of reservoirs and to quantify the water in the watersheds. These water budgets then allow NYCDEP to model pollutant loads to the reservoirs (such as nutrients and coliform bacteria) and provides a tool to anticipate problems and develop management strategies for addressing these problems.
• NYCDEP Source Water Monitoring Program ($3.2 million annually on Croton) – Each year, NYCDEP collects more than 35,000 samples from 300 watershed sites and performs more than 300,000 laboratory analyses. The monitoring program’s fundamental goals are to help manage the system to provide the best possible water, to develop a database through which water quality trends can be identified, and to identify water quality conditions of concern to focus watershed management efforts. The National Research Council (Council) independently evaluated the City’s source water monitoring program in 1997. The Council found the City’s program to be “informed, extensive, and of high quality for a water supply of its size.”8 The Council also noted “the complexity of the multiple interacting reservoir ecosystems of the NYC water supply imposes major monitoring demands to allow for effective management responses to problems. In general, NYCDEP has been performing these formidable tasks excellently.” Accordingly, findings of the City’s peer-reviewed source water monitoring program have reliably served as the scientific basis for the City’s watershed protection program.
NYCDEP has also supported, with both funding and in-house resources, a number of outside programs related to the protection of the Croton watershed.
• Phosphorus Total Maximum Daily Loads – (TMDLs) is a Clean Water Act program that integrates the management of point and non-point sources of a pollutant in order to meet water quality standards. NYCDEP has for many years been providing technical support to NYSDEC for the development of phosphorus TMDLs for the NYC reservoirs.
• Croton Planning and Water Quality Investment Funds – Many watershed management projects can only be implemented at the local level. Through the Watershed Memorandum of Agreement (MOA), Westchester and Putnam Counties are conducting watershed planning (“Croton Plans”) to determine how to use the funds the City provided them for projects to protect and improve water quality (~$68 million).
• Westchester County WWTP Diversion – As mentioned above, Westchester County is considering diversion of a municipal WWTP (Yorktown Heights WWTP) and several
8 Watershed Management for Potable Water Supply: Assessing the New York City Strategy (2000) (ISBN 0309067774), Committee to Review the New York City Watershed Management Strategy, National Research Council
Final SEIS Purpose and Need 27
small WWTPs and septic areas to a treatment plant outside of the Croton watershed, this single WWTP accounts for more than half of the total WWTP flow in the Westchester County portion of the Croton watershed.
2.3.8. Regulatory Protection A number of entities have regulatory authority over particular activities in the Croton watershed, including local municipalities, county governments, New York State and New York City. The New York City Watershed Rules and Regulations (WR&Rs) apply uniformly across the City’s entire watershed. These regulations protect the water quality against specific, future activities. A few key components of the WR&Rs include:
• Project Review – New development projects that require a stormwater plan under the WR&Rs are reviewed and approved by NYCDEP engineering staff. The project sites are initially evaluated by field visits and NYCDEP conducts follow-up inspections to confirm compliance with the approval conditions. From January 2001 – November 2003, NYCDEP staff reviewed and commented on over 1400 projects in the Croton System.
• Regulatory Compliance – NYCDEP’s Regulatory Compliance and Inspection group conducts regular inspections of surface-discharging WWTPs, which have resulted in measurable improvements in treatment performance. This is demonstrated by an analysis of trends in flows and total phosphorus (TP) loads at WWTPs in the watershed for the period 1994-1999. Overall, estimated 1999 TP loads from WWTPs were about 65.7 percent less than in 1994. This was largely due to the attention paid to these facilities by NYCDEP’s Regulatory Compliance and Inspection group and corrective actions taken by WWTP operators.
• Septic Systems – New septic system plans are also reviewed by NYCDEP engineering staff in coordination with the Counties’ Departments of Health.
• Phosphorus Restricted Basins – The WR&R give NYCDEP the authority to designate reservoir basins as “phosphorus restricted” if monitoring data indicate that the reservoir exceeds the State guidance value for phosphorus. In a Phosphorus Restricted Basin, new or expanded WWTPs with surface discharges are prohibited and there are additional requirements for stormwater treatment and impact analysis. This regulation primarily protects the Croton System, and currently there are eight reservoirs and/or controlled lakes that are phosphorus restricted in the Croton System.
• NYCDEP Police – NYCDEP has significantly expanded the NYCDEP Police force in recent years. NYCDEP’s Environmental Police Officers provide security at NYCDEP facilities and patrol the watershed to detect environmental infractions. Officers are receiving specialized training in the WR&Rs and the detection and investigation of potential threats to water quality. The Police coordinate closely with NYCDEP’s Project Review and Regulatory Compliance staff to ensure complete coverage of activities in the watershed.
Final SEIS Purpose and Need 28

NYCDEP also works to enhance State and/or federal regulatory protection whenever possible. Recent efforts include:
• SEQRA Reviews – The New York State Environmental Quality Review Act (SEQRA) provides NYCDEP with an important mechanism, separate from the City’s Watershed Regulations, to identify and mitigate potential impacts that certain actions, including proposed development projects, may have on the quality of the City’s drinking water supply. By actively participating in the SEQRA environmental review process, NYCDEP considers, at an early stage in a project’s development, the wide range of factors that affect the nature and severity of a project’s impact on water quality. These include factors that may not be directly regulated by NYCDEP but which could have significant effects on water quality, such as impacts on local wetlands, percentage of impervious cover, amount of soil disturbance, impacts of secondary growth, and other issues of particular importance in the reservoir basin or project sub-basin. SEQRA also requires a project sponsor to explore alternatives that would minimize potential impacts, and to incorporate mitigation measures into a project to compensate for certain unavoidable impacts.
• NYCDEP is an “Involved Agency” during the SEQRA review process of projects involving the disposal and treatment of wastewater and the control of stormwater due to NYCDEP’s review and approval authority over these types of projects. NYCDEP reviews and may submit written comments on all SEQRA reviews within the watershed. From January 2001 – November 2003, NYCDEP staff reviewed and commented on approximately 100 SEQRA reviews in the Croton watershed.
• Wetland remapping and Unusual Local Importance (ULI) designation – At NYCDEP’s request, NYS Department of Environmental Conservation (NYSDEC) is currently revising the NYS Freshwater Maps for the East-of-Hudson watersheds, specifically locating additional wetlands that meet the regulatory threshold of 12.4 acres and identifying smaller wetlands of ULIs that are adjacent to the reservoirs. Through NYCDEP field checks, an additional 230 acres was added to the draft maps for Westchester County alone. If all revisions were adopted, the acreage of wetlands subject to both US Army Corps of Engineers and NYSDEC regulations would increase from 5,338 acres to 7,731 acres in the Westchester County portion of the watershed. Putnam County field checks are ongoing and are not available for this Final SEIS.
• Stream Reclassification – Trout and trout spawning streams have tighter water quality standards and enhanced compliance criteria under any regulated action. NYCDEP has been conducting stream surveys in the watershed since 1996 to verify the presence of trout and/or trout spawning waters, and then petition NYSDEC to upgrade the stream classification.
• Stormwater Enforcement – NYCDEP and NYSDEC have modified their 1993 Memorandum of Understanding on Enforcement to provide for coordinated enforcement of certain stormwater violations. The new program, which reflects the recent practice of the agencies, is intended to maximize the effectiveness of NYSDEC’s administrative enforcement power by making use of NYCDEP’s inspection staff and technical expertise.
• Phase II Stormwater Regulations, East-of-Hudson permits – The Phase II Stormwater Regulations contain new requirements for stormwater discharges from construction and municipal activities. NYCDEP has been actively commenting on the regulations themselves and the proposed statewide permits. In particular, NYSDEC accepted
Final SEIS Purpose and Need 29
NYCDEP’s recommendation that the entire East-of-Hudson watershed be designated as an Urban Area. NYCDEP is also working closely with NYSDEC to develop special watershed-specific permits to enhance protection of the East-of-Hudson watershed
The City’s Watershed Rules and Regulations as well as the state and federal regulatory safeguards described above add to the protection of water quality in the Croton System by primarily addressing future development or other watershed activities. They cannot, unfortunately, overcome the impacts from existing development in the watershed. Together with filtration, they form a strong, multiple barrier strategy to preventing contamination of the critical water supply. 2.4. NEED FOR THE CROTON SUPPLY In response to questions regarding the need for the Croton Water Supply System (Croton System), a report was completed assessing the continued need for the water supply provided by the Croton System.9 The continued need for the Croton Supply was evaluated by:
• Determining historic and projected water demands • Calculating safe yield estimates • Comparing projected demands with safe yields • Evaluating the importance of the Croton Water Supply under normal conditions • Evaluating the importance of the Croton Water Supply under drought conditions • Simulating historical system operations without the Croton Water Supply • Determining whether other potential sources exist • Evaluating the flexibility and redundancy that the Croton system provides to the water
supply system Recently, the NYCDEP has conducted additional analyses concerning the need for the Croton System, updating and expanding upon a previous report, issued in November 1997. Specifically, NYCDEP analyzed whether the Croton System is needed to be available all of the time (and if so, at full or part capacity), some of the time, or not at all. These analyses factored in all the City’s other existing water supplies, and considered development of new or expanded supplies from the Hudson River and the Brooklyn-Queens Aquifer. The analyses considered the City’s official low range and high range water demand projections for the year 2045 planning horizon, and evaluated supply adequacy, water quality, costs and implementation schedules.10 Results of the 2001 analysis have been incorporated with the 1997 analysis, where appropriate and conclusions of the 2001 analysis are presented in Section 3.2.6.
9 The Need for the Croton Water Supply System - November 1997. New York City Department of Environmental Protection. New York, NY. 10 Evaluation of Alternatives for the Croton Water System August 2001. New York City Department of Environmental Protection. New York, NY.
Final SEIS Purpose and Need 30

2.4.1. Historic and Projected Water Demand/Comparison to Safe Yield In addition to providing water to the five boroughs of the City, the City's supply system serves as a regional system that supplies communities in eight upstate counties (Greene, Delaware, Scho-harie, Sullivan, Ulster, Orange, Putnam, and Westchester upon request). Servicing approximately eight million City residents and approximately one million upstate consumers, approximately 1.4 billion gallons per day (bgd) is demanded of the City Water Supply System. Figure 2-7 presents historic Citywide annual average water demands for the years 1935 through 1996. Water demand increased by roughly 50 percent over this interval. Several abrupt declines in the demand over this interval are associated with the occurrence of drought conditions and resulting increased conservation efforts. From the historic demands, water demand projections for all of City range from 1,284 to 1,547 million gallons per day (mgd) by the year 2045 (Figure 2-7). A future annual average demand of 180 mgd is projected for upstate communities (Figure 2-8). Together, these represent system-wide annual average demand projections of 1,464 mgd to 1,727 mgd. These projections incorporate to differing degrees the demand reductions being experienced, and the further reductions anticipated from the NYCDEP Universal Metering Program11 and other conservation efforts. Safe yield is defined as the maximum amount of water that will be available from a reservoir or other water source during a critical dry period, from both runoff and storage. Although the safe yield of a source is sometimes referred to as if it were a guaranteed minimum yield, "safe yield" figures are actually defined by the lowest historical dry period on record rather than guaranteed production. The official safe yield of City's Water Supply System is estimated at 1,290 mgd with a total storage capacity of about 558 billion gallons. The Croton System provides a safe yield of about 214 mgd with a total storage capacity of 74.3 billion gallons, which represents 17 percent of the system total.12 With the Croton System typically averaging only 10 percent of the City’s average demand; its 17 percent safe yield identifies the supply being more of an important component of the City’s system than is apparent from consideration of average supply figures alone. Prior to drought conditions in the 1960s, the safe yield of City sources was 1,800 mgd. The safe yield was revised downward to 1,290 mgd to provide a factor of safety against potential future water shortages.
11 NYCDEP has completed the metering of all residential, commercial and industrial water customers so that consumers are now charged based on their actual water use. 12 This 214 mgd is determined by subtracting 26 mgd for West Branch and Boyd’s Corner Reservoirs from the entire Croton System safe yield of 240 mgd. The 82.9 billion gallons storage capacity is determined by subtracting 11.7 billion gallons for West Branch and Boyd’s Corner Reservoirs from the overall total storage capacity estimate of 94.6 billion gallons. The West Branch and Boyd’s Corner Reservoirs are located east of the Hudson in the Croton watershed, but are operated as part of the Delaware System.
Final SEIS Purpose and Need 31

City-Wide Water Demands and ProjectionsCroton Water Treatment Plant
Figure 2-7
M&
E F
ile: P
:\E
nvi
ron
me
nta
l Qu
alit
y\C
roto
n\G
RA
PH
ICS
\02
-PA
N\C
RT-p
an
G-0
5-1
1-0
4.c
dr
05
/19
/04
1935 1945 1955 1965 1975 1985 1995 2005 2015 2025 2035 2045
0
200
400
600
800
1,000
1,200
1,400
1,600
1,800
Year
City-Wide Water Demand and Projections
Demand, mgd
Historical Data
DEP High Projection
DEP Low Projection
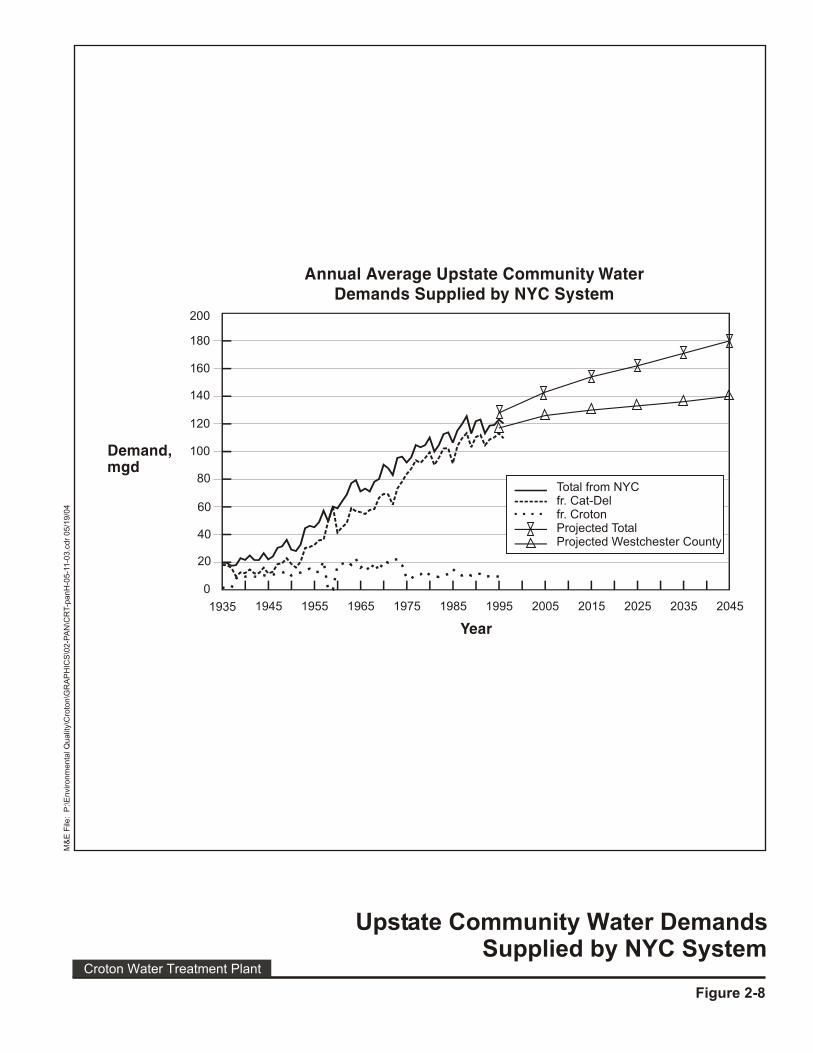
Upstate Community Water DemandsSupplied by NYC System
Croton Water Treatment Plant
Figure 2-8
M&
E F
ile: P
:\E
nvi
ron
me
nta
l Qu
alit
y\C
roto
n\G
RA
PH
ICS
\02
-PA
N\C
RT-p
an
H-0
5-1
1-0
3.c
dr
05
/19
/04
Annual Average Upstate Community WaterDemands Supplied by NYC System
1935 1945 1955 1965 1975 1985 1995 2005 2015 2025 2035 2045
0
20
40
60
80
100
120
140
160
180
200
Demand, mgd
Year
Total from NYCfr. Cat-Delfr. CrotonProjected TotalProjected Westchester County

A comparison of both high- and low-end demand projections with the safe yield estimates, with and without the Croton Supply, is summarized in Table 2-2. With the Croton System in service, the high-end system-wide demand projection of 1,727 mgd exceeds the officially accepted safe yield estimate by 437 mgd. Without the Croton System Supply, but continuing discharge of the West Branch Reservoir into the Delaware Aqueduct, the City would need to develop sources with an additional safe yield of 651 mgd for the safe yield to equal projected high-end demands. Compared to the officially accepted safe yield estimate, even the low-end demand projections exceed safe yield by 174 mgd. Without the Croton System, assuming low-end demand projections, the safe yield shortfall increases to 388 mgd.
TABLE 2-2. COMPARISONS OF PROJECTED DEMANDS AND SAFE YIELD ESTIMATE
Safe Yield Estimate
Demand Projection (2) Shortfall With All Current
Sources
Shortfall Without Croton
1,290 mgd
High End
1,727 mgd
437 mgd
651 mgd
1,290 mgd
Low End
1,464 mgd
174 mgd
388 mgd
Notes:
(1) Safe yield of the Croton System is estimated at 214 mgd (240 mgd less about 26 mgd for the West Branch and Boyd’s Corner Reservoirs) for all calculations in this table. The 240 mgd figure is based upon traditional “mass curve” analysis of safe yield.
(2) All demand projections include 180 mgd of demand from upstate communities.
2.4.1.1. Croton Supply to City
Although the safe yield for the Croton System is about 17 percent of the total safe yield, only 10 percent of the City's supply from upstate watersheds is typically delivered as “Low Level” supply by the New Croton Aqueduct (NCA). The remaining 90 percent is delivered as "High Level" supply. High Level, or Catskill/Delaware, supply includes supply from the Catskill and Delaware watersheds and flow transferred from the upper Croton watershed to the Delaware Aqueduct. These upper Croton watershed transfers are from West Branch Reservoir (which is considered part of the Catskill/Delaware systems) or the Cross River and Croton Falls hydraulic pumping stations (which are considered part of the Croton System). Unlike the High Level supplies, which are able to provide water at adequate pressure to almost all areas of the City without pumping, the NCA supply is only able to supply certain low-lying areas of the Bronx and Manhattan by gravity. The supply of NCA water beyond these areas must be pumped. For the years 1960 through 1992, the NCA supplied an average of 144 mgd to the City. This amount included upland transfers to the Delaware Aqueduct from the Croton Falls and Cross River pumping stations.
Final SEIS Purpose and Need 34

2.4.1.2. Importance of Croton System During Droughts
The City's safe yield is an estimate of the reservoir system's reliable, continuous production under all hydrologic conditions including the worst historical drought. Average supply rates underestimate the importance of the Croton System, since supplies in excess of safe yield can be delivered by High Level sources, minimizing the amount of supply that must be pumped. The contribution of the Croton Supply to the City's water supply is most apparent during droughts. During the 1985 drought, monthly average supply from the NCA reached 292 mgd (the maximum daily rate reached 308 mgd). Including pumped upland transfers to the Delaware Aqueduct, the Croton System production reached 336 mgd on a monthly basis during the 1960s drought. This was equivalent to 29 percent of City-wide demand. 2.4.1.3. Importance of the Croton System During Extended System Maintenance
NYCDEP is planning an aggressive series of maintenance activities that will take place over the next three decades. The Catskill and Delaware Systems are 40 to 80 years old, and have been in continuous service. The Delaware System is known to have a large leak in deep bedrock west of the Hudson River. It may be required to shut this conduit down for a number of years to repair this leak. The Catskill Aqueduct is also in need of service. Plans are underway to pressurize this aqueduct between Kensico Reservoir and the Eastview Site in order for the Catskill / Delaware Ultraviolet Light Disinfection (UV) Facility to be able to fully utilize the Catskill System. This is required in order to deliver the Catskill water to the UV Facility at the same pressure as the water arriving via the Delaware Aqueduct. This pressurization work could put the aqueduct out of service for a number of years, thus requiring the Croton System to be fully operational during that time period in order to meet the City demand.
2.4.1.4. Simulation of System Operation without the Croton Supply
Computer simulation of the entire water supply system using the hydrology of the period from 1927 to 1993 with the Croton System taken out of use indicates that drought emergency frequency would be increased from an average of once every 10 years (seven drought emergencies in 67 years) to approximately once every five years (13 in 67 years). In addition, operation of the Chelsea Pumping Station on the Hudson River would be necessary three times more frequently, than with the Croton System in use (during 20 years out of 67 instead of 6 years out of 67). The City would have essentially run out of water in the 1960s drought, as the source reservoirs would have been emptied.
Final SEIS Purpose and Need 35

2.4.2. Conclusions Based on detailed modeling of alternative supply scenarios, including developing new groundwater sources in the Brooklyn-Queens Aquifer and additional use of the Hudson River, the following conclusions can be made: 1. Croton water needs to be available most of the time for the foreseeable future, even if a new
water service project is implemented. 2. Reducing the amount of Croton water available to the City, is not feasible without first
developing another source, such as the Brooklyn-Queens Aquifer, which would cost more money, take much longer to implement, and have similar implementation issues to filtration of Croton water. It was also recognized that regulators might not permit a new source of water supply to be developed even if the Croton System is only partially utilized.
3. Even for the low range water demand projections with the Croton System in use, additional
water supply sources should be developed and/or additional demand cutbacks obtained through conservation, to reduce the frequency of droughts to more acceptable levels, and to avoid stressing the Catskill/Delaware Systems to the extent that filtration avoidance of that system could be compromised. If the high range water demand projections were realized, which is not considered to be very likely, significant additional water supply sources would be needed.
Final SEIS Purpose and Need 36