FINAL REPORT Wintertime Traffic Generated PM10 Hot … · FINAL REPORT Wintertime Traffic Generated...
61
Contract No. 43X878 September 3, 1998 FINAL REPORT Wintertime Traffic Generated PM 10 Hot Spots Prepared for Caltrans by the University of California, Davis Lowell L. Ashbaugh, Principal Investigator Crocker Nuclear Laboratory Robert G. Flocchini, Investigator Land, Air & Water Resources and Crocker Nuclear Laboratory Robert T. Matsumura, Teresa A. James, Omar F. Carvacho, Christopher K. Tsubamoto, Mike Brown, Investigators Crocker Nuclear Laboratory Air Quality Group Crocker Nuclear Laboratory University of California Davis, CA 95616-8569
Transcript of FINAL REPORT Wintertime Traffic Generated PM10 Hot … · FINAL REPORT Wintertime Traffic Generated...
Contract No. 43X878 September 3, 1998
FINAL REPORT
Wintertime Traffic Generated PM10 Hot Spots
Prepared for Caltrans
by the University of California, Davis
Lowell L. Ashbaugh, Principal Investigator Crocker Nuclear Laboratory
Robert G. Flocchini, Investigator
Land, Air & Water Resources and Crocker Nuclear Laboratory
Robert T. Matsumura, Teresa A. James, Omar F. Carvacho,
Christopher K. Tsubamoto, Mike Brown, Investigators
Crocker Nuclear Laboratory
Air Quality Group Crocker Nuclear Laboratory
University of California Davis, CA 95616-8569

ii
iii
Table of Contents Table of Contents........................................................................................................................... iii List of Tables ................................................................................................................................. vi Abstract ......................................................................................................................................... vii Introduction......................................................................................................................................1 Methods............................................................................................................................................1
Sampling site configuration .........................................................................................................2 Particulate matter measurements .................................................................................................2 Sample analysis............................................................................................................................2 Road vacuuming ..........................................................................................................................3 Meteorological data .....................................................................................................................3
Results..............................................................................................................................................4 Traffic ..........................................................................................................................................4 Road surface silt loading..............................................................................................................6 Meteorology.................................................................................................................................6 Particle concentrations .................................................................................................................9 Particle composition ....................................................................................................................9
Discussion ......................................................................................................................................10 Conclusions and Recommendations ..............................................................................................11 Acknowledgments..........................................................................................................................13 References......................................................................................................................................13
Appendix A : Vertical profiles of mass and composition for all test periods.......................... A-1

iv
List of Figures
Figure 1.Sunrise/Greenback intersection configuration with location of sampling sites.................2 Figure 2.IMPROVE PM2.5 sampling module.................................................................................4 Figure 3.Traffic volume at the four approaches to Sunrise Boulevard and Greenback Lane
during the sample period...............................................................................................5 Figure 4.Wind speed, wind direction, and standard deviation of wind direction during the
study period...................................................................................................................7 Figure 5.Temperature and relative humidity at 2 meters height during the study period ................7 Figure 6.PM10 concentrations averaged for all sampling locations (soot concentrations are on
the right-hand axis) .......................................................................................................9 Figure 7.Ratio of particle composition to total PM10 mass for all sampling locations.................10 Figure 8.Vertical profiles of PM10 mass and composition, March 6, 1997 6:45-11:15 p.m..........12 Figure 9.Wind vector plot and vertical profiles of mass and reconstructed mass, February 25,
1997 4:35 - 6:45 p.m............................................................................................... A-2 Figure 10.Vertical profiles of soil, soot, and organic mass, February 25, 1997 4:35 - 6:45
p.m. .......................................................................................................................... A-3 Figure 11.Wind vector plot and vertical profiles of mass and reconstructed mass, February
26, 1997 6:45 - 9:55 a.m......................................................................................... A-4 Figure 12.Vertical profiles of soil, soot, and organic mass, February 26, 1997 6:45 - 9:55
a.m. .......................................................................................................................... A-5 Figure 13.Wind vector plot and vertical profiles of mass and reconstructed mass, February
26, 1997 10:00 a.m. - 4:10 p.m............................................................................... A-6 Figure 14.Vertical profiles of soil, soot, and organic mass, February 26, 1997 10:00 a.m. -
4:10 p.m. .................................................................................................................. A-7 Figure 15.Wind vector plot and vertical profiles of mass and reconstructed mass, February
26, 1997 4:15 - 6:25 p.m......................................................................................... A-8 Figure 16.Vertical profiles of soil, soot, and organic mass, February 26, 1997 4:15 - 6:25
p.m. .......................................................................................................................... A-9 Figure 17.Wind vector plot and vertical profiles of mass and reconstructed mass, February
27, 1997 7:00 - 9:55 a.m....................................................................................... A-10 Figure 18.Vertical profiles of soil, soot, and organic mass, February 27, 1997 7:00 - 9:55
a.m. ........................................................................................................................ A-11 Figure 19.Wind vector plot and vertical profiles of mass and reconstructed mass, February
27, 1997 10:00 a.m. - 4:00 p.m............................................................................. A-12 Figure 20.Vertical profiles of soil, soot, and organic mass, February 27, 1997 10:00 a.m. -
4:00 p.m. ................................................................................................................ A-13 Figure 21.Wind vector plot and vertical profiles of mass and reconstructed mass, February
27, 1997 4:30 - 6:25 p.m....................................................................................... A-14 Figure 22.Vertical profiles of soil, soot, and organic mass, February 27, 1997 4:30 - 6:25
p.m. ........................................................................................................................ A-15 Figure 23.Wind vector plot and vertical profiles of mass and reconstructed mass, March 1,
1997 7:05 - 10:05 a.m........................................................................................... A-16 Figure 24.Vertical profiles of soil, soot, and organic mass, March 1, 1997 7:05 - 10:05 a.m. A-17 Figure 25.Wind vector plot and vertical profiles of mass and reconstructed mass, March 1,
1997 12:10 - 5:15 p.m........................................................................................... A-18
v
Figure 26.Vertical profiles of soil, soot, and organic mass, March 1, 1997 12:10 - 5:15 p.m. A-19 Figure 27.Wind vector plot and vertical profiles of mass and reconstructed mass, March 1,
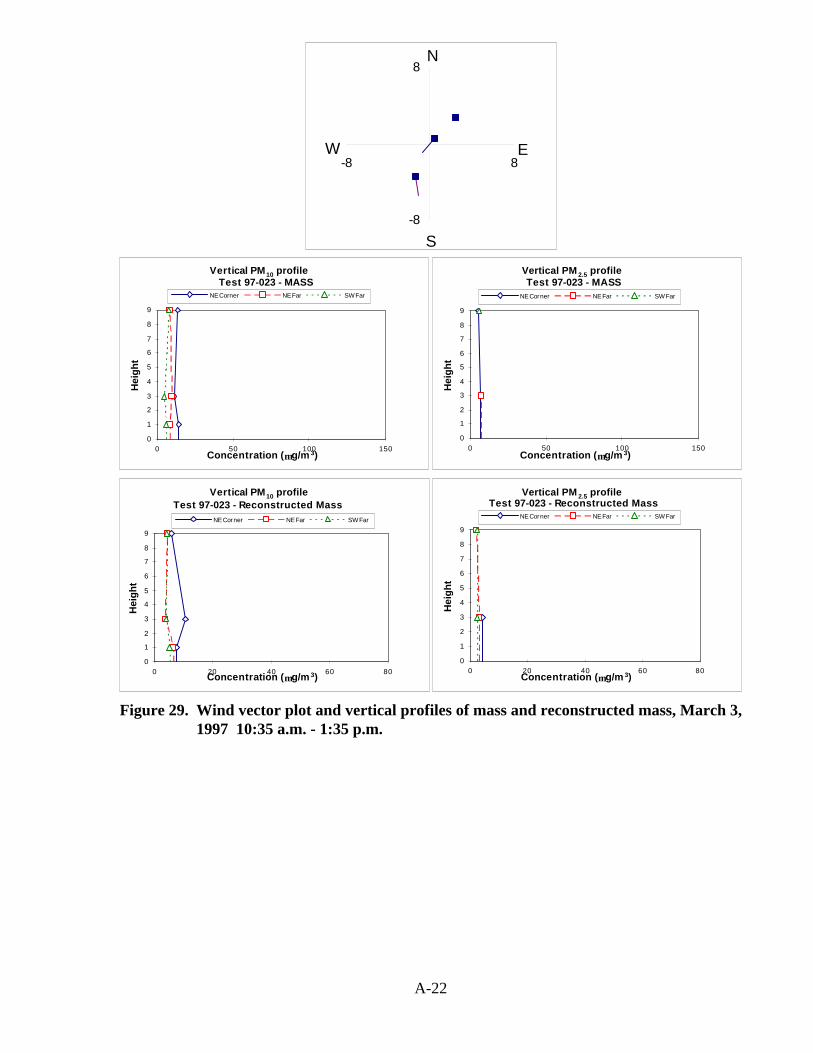
1997 5:20 - 9:15 p.m............................................................................................. A-20 Figure 28.Vertical profiles of soil, soot, and organic mass, March 1, 1997 5:20 - 9:15 p.m... A-21 Figure 29.Wind vector plot and vertical profiles of mass and reconstructed mass, March 3,
1997 10:35 a.m. - 1:35 p.m................................................................................... A-22 Figure 30.Vertical profiles of soil, soot, and organic mass, March 3, 1997 10:35 a.m. - 1:35
p.m. ........................................................................................................................ A-23 Figure 31.Wind vector plot and vertical profiles of mass and reconstructed mass, March 5,
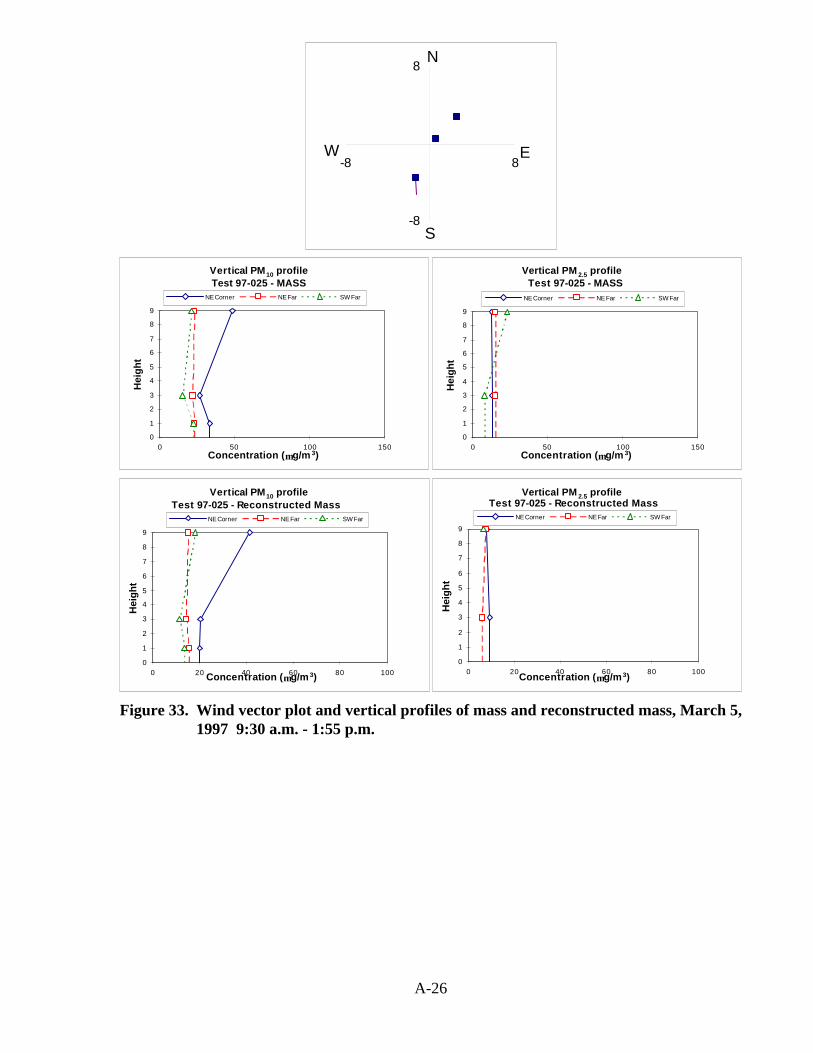
1997 6:20 - 9:25 a.m............................................................................................. A-24 Figure 32.Vertical profiles of soil, soot, and organic mass, March 5, 1997 6:20 - 9:25 a.m... A-25 Figure 33.Wind vector plot and vertical profiles of mass and reconstructed mass, March 5,
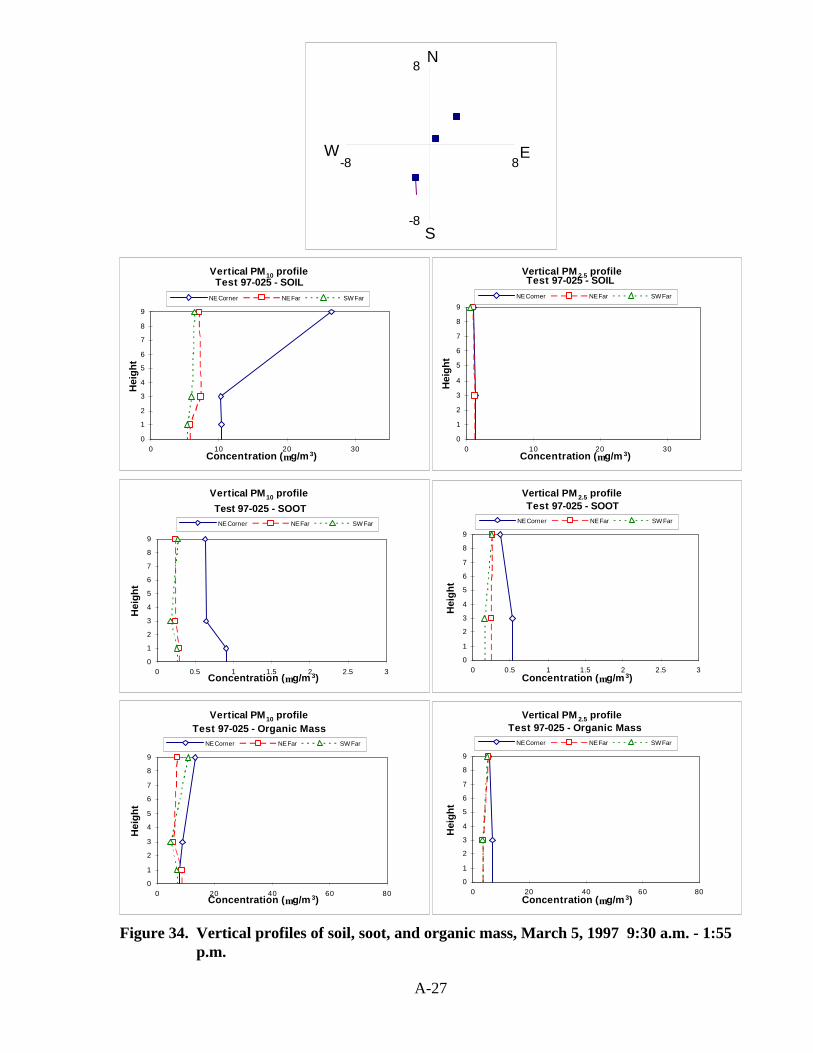
1997 9:30 a.m. - 1:55 p.m..................................................................................... A-26 Figure 34.Vertical profiles of soil, soot, and organic mass, March 5, 1997 9:30 a.m. - 1:55
p.m. ........................................................................................................................ A-27 Figure 35.Wind vector plot and vertical profiles of mass and reconstructed mass, March 5,
1997 2:00 - 6:25 p.m............................................................................................. A-28 Figure 36.Vertical profiles of soil, soot, and organic mass, March 5, 1997 2:00 - 6:25 p.m... A-29 Figure 37.Wind vector plot and vertical profiles of mass and reconstructed mass, March 6,
1997 7:40 - 10:00 a.m........................................................................................... A-30 Figure 38.Vertical profiles of soil, soot, and organic mass, March 6, 1997 7:40 - 10:00 a.m. A-31 Figure 39.Wind vector plot and vertical profiles of mass and reconstructed mass, March 6,
1997 4:55 - 6:40 p.m............................................................................................. A-32 Figure 40.Vertical profiles of soil, soot, and organic mass, March 6, 1997 4:55 - 6:40 p.m... A-33 Figure 41.Wind vector plot and vertical profiles of mass and reconstructed mass, March 6,
1997 6:45 - 11:15 p.m........................................................................................... A-34 Figure 42.Vertical profiles of soil, soot, and organic mass, March 6, 1997 6:45 - 11:15 p.m. A-35 Figure 43.Wind vector plot and vertical profiles of mass and reconstructed mass, March 6,
1997 11:20 p.m. - March 7, 1997 4:00 a.m. ........................................................ A-36 Figure 44.Vertical profiles of soil, soot, and organic mass, March 6, 1997 11:20 p.m. -
March 7, 1997 4:00 a.m. ....................................................................................... A-37 Figure 45.Wind vector plot and vertical profiles of mass and reconstructed mass, March 7,
1997 6:40 - 9:25 a.m........................................................................................... A-38 Figure 46.Vertical profiles of soil, soot, and organic mass, March 7, 1997 6:40 - 9:25 a.m. A-39

vi
List of Tables Table 1.The ten Sacramento intersections with highest traffic volumes .........................................1 Table 2.Sampling Site Configuration ..............................................................................................3 Table 3.Average hourly vehicle counts for the intersection and each approach during each
test period......................................................................................................................5 Table 4.Measured roadway silt loading and calculated PM10 emissions from paved roads
using AP-42 ..................................................................................................................6 Table 5.Meteorological conditions during each test period .............................................................8 Table 6.PM10 mass and composition (µg/m3) on March 6, 1997 from 6:45-11:15 p.m. ...............11
vii
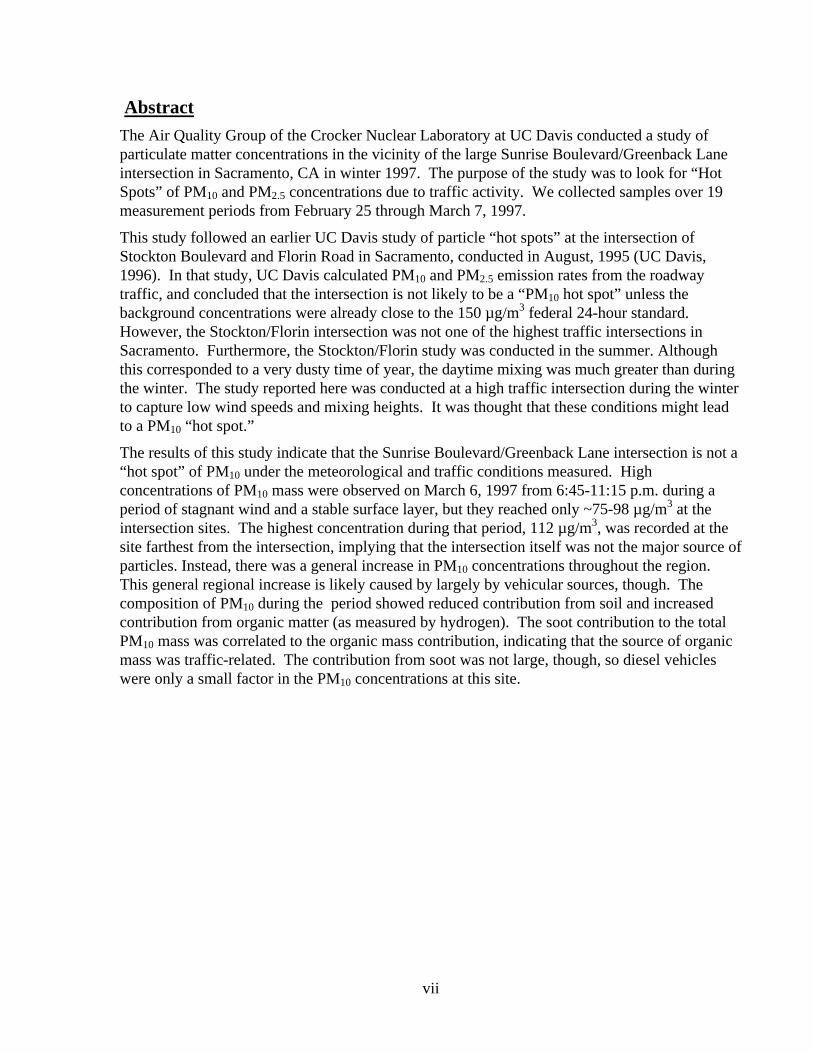
Abstract The Air Quality Group of the Crocker Nuclear Laboratory at UC Davis conducted a study of particulate matter concentrations in the vicinity of the large Sunrise Boulevard/Greenback Lane intersection in Sacramento, CA in winter 1997. The purpose of the study was to look for “Hot Spots” of PM10 and PM2.5 concentrations due to traffic activity. We collected samples over 19 measurement periods from February 25 through March 7, 1997.
This study followed an earlier UC Davis study of particle “hot spots” at the intersection of Stockton Boulevard and Florin Road in Sacramento, conducted in August, 1995 (UC Davis, 1996). In that study, UC Davis calculated PM10 and PM2.5 emission rates from the roadway traffic, and concluded that the intersection is not likely to be a “PM10 hot spot” unless the background concentrations were already close to the 150 µg/m3 federal 24-hour standard. However, the Stockton/Florin intersection was not one of the highest traffic intersections in Sacramento. Furthermore, the Stockton/Florin study was conducted in the summer. Although this corresponded to a very dusty time of year, the daytime mixing was much greater than during the winter. The study reported here was conducted at a high traffic intersection during the winter to capture low wind speeds and mixing heights. It was thought that these conditions might lead to a PM10 “hot spot.”
The results of this study indicate that the Sunrise Boulevard/Greenback Lane intersection is not a “hot spot” of PM10 under the meteorological and traffic conditions measured. High concentrations of PM10 mass were observed on March 6, 1997 from 6:45-11:15 p.m. during a period of stagnant wind and a stable surface layer, but they reached only ~75-98 µg/m3 at the intersection sites. The highest concentration during that period, 112 µg/m3, was recorded at the site farthest from the intersection, implying that the intersection itself was not the major source of particles. Instead, there was a general increase in PM10 concentrations throughout the region. This general regional increase is likely caused by largely by vehicular sources, though. The composition of PM10 during the period showed reduced contribution from soil and increased contribution from organic matter (as measured by hydrogen). The soot contribution to the total PM10 mass was correlated to the organic mass contribution, indicating that the source of organic mass was traffic-related. The contribution from soot was not large, though, so diesel vehicles were only a small factor in the PM10 concentrations at this site.

viii

1
Introduction Federal conformity rules require that state agencies responsible for approval and/or funding of transportation projects ensure that such projects conform to an approved or promulgated state implementation plan and to all applicable state and federal air quality standards. Because of this, Caltrans needs to know whether “hot spots” of PM10 emissions exist at particular roadway configurations in California. If “hot spots” exist, road construction projects might have to mitigate the PM10 impacts. In this report, a “hot spot” of particulate matter is a roadway configuration that could lead to a violation of the particulate matter standard at a nearby monitor when the surrounding region is at or below typical concentrations for the area. It is not a “hot spot” if the surrounding region is just below the standard during a pollution episode and the incremental pollution added by the roadway pushes it above the standard at a nearby monitor.
An earlier UC Davis field study indicated that the Florin Road/Stockton Boulevard intersection is unlikely to be a “hot spot” of PM10 emissions. The study was conducted during the summer when dust levels were expected to be high due to the long preceding period without rain. Summer is a time of increased vertical mixing and higher wind speeds, though, so that dilution may have reduced the likelihood of PM10 “hot spots.” The study reported here was designed to investigate whether an even larger intersection might become a PM10 “hot spot” during the stable, low wind speed conditions that can occur during winter months.
Methods We conducted a field study at the intersection of Sunrise Boulevard and Greenback Lane in Sacramento, California beginning at 4:30 p.m. on February 25, 1997, and concluding at 9:30 a.m. on March 7, 1997. This intersection has the third highest 24-hour traffic volume in Sacramento, as shown in Table 1. We used three 10-meter towers to hold meteorological and particulate matter samplers, two in fixed locations and one that we moved occasionally during the study.
Table 1. The ten Sacramento intersections with highest traffic volumes
Intersection Location 24-Hour Traffic Volume
Fair Oaks Blvd. & Watt Ave. 132,380
Fair Oaks Blvd. & Sunrise Blvd. 114,860
Madison Ave. & Sunrise Blvd. 104,190
Coloma Road & Sunrise Blvd. 100,360
Greenback Lane & Sunrise Blvd. 99,620
Folsom Blvd. & Watt Ave. 98,980
Sunrise Blvd. & Zinfandel Drive 93,850
Gold Expressway & Sunrise Blvd. 90,470
Garfield Ave. & Greenback Lane 90,200
Auburn Blvd & Watt Ave. 89,780

2
Sampling site configuration
Figure 1 shows a schematic diagram of the Sunrise/Greenback intersection and the locations of our samplers. We set up fixed sites with 10-meter towers at the NE corner and SW far sites (dark gray in Figure 1) for meteorological and particulate matter measurements. We used our mobile hydraulic tower at the NE far, SW corner, and SE corner locations (light gray) for particulate matter measurements only. For each test, one of the three mobile locations was used in conjunction with the two fixed locations.
The sampling site locations are shown in Table 2 relative to the center of the intersection. The roadway dimensions are also shown. The NE Corner site was closest to the roadway at three meters north of Greenback lane and one meter east of Sunrise Boulevard.
Particulate matter measurements
We measured particles in the PM10 and PM2.5 size ranges using modified IMPROVE samplers (Eldred, 1988). The PM10 version of this sampler uses a Sierra-Anderson size-selective inlet to collect particles smaller than 10µm aerodynamic diameter. The PM2.5 sampler uses a cyclone of the AIHL design to select particles smaller than 2.5µm aerodynamic diameter. Figure 2 shows a diagram of the PM2.5 IMPROVE sampler; the PM10 sampler is similar. We collected PM10
samples on 25mm Teflon filters at heights of 1m, 3m, and 9m; PM2.5 samples were collected at heights of 3m and 9m. All five measurements were taken at every sampling location.
Sample analysis
We analyzed the Teflon filters from the modified IMPROVE samplers gravimetrically for total mass collected, and obtained the mass concentration by dividing the mass collected by the volume of air sampled. The Teflon filters were also analyzed at Crocker Nuclear Laboratory by X-ray Fluorescence (XRF) and Particle-Induced X-ray Emission (PIXE) for elements Na-U, by
NECorner
Bank,Beauty,Salon
StoreBank
Greenback Blvd.
SE CornerSW Corner
SWFar
GasStation
SunriseBlvd.
NEFar
N
Figure 1. Sunrise/Greenback intersection configuration with location
of sampling sites

3
Proton Elastic Scattering Analysis (PESA) for hydrogen, and by Hybrid Integrating Plate and Sphere (HIPS) for light absorption (Eldred, 1988). The light absorption is related to the mass of soot carbon on the filter, while the hydrogen is related to the mass of organic carbon. We use these and the other elemental concentrations to calculate soot concentration, organic mass concentration, a composite soil concentration, and the total reconstructed mass (sum of species). These composite species and the gravimetric mass concentrations are shown in Appendix A for each test period.
Road vacuuming
We collected the road surface material using a Hoover Porta-Power II canister vacuum, model number S1315, with removable bags (type R) using procedures outlined in AP-42, Appendix D (U.S. EPA, 1995). We vacuumed within the outlined crosswalks of the intersection. The two crosswalk areas vacuumed on Sunrise Boulevard were 86.11 m2, while the Greenback Lane areas were 91.44m2.
Meteorological data
We measured meteorological parameters continuously at the NE corner and SW far sites. These parameters included wind speed and temperature at 0.5m, 1m, 2m, 4m, and 7.5m, wind direction and solar radiation at 4m, and relative humidity at 2m. The SW far station, located in a large parking lot with minimal traffic, was our primary meteorological station due to the lack of influence from buildings, trees, and traffic. The data were recorded on Campbell Scientific CR-10 data loggers in 5-minute averages. These battery powered, automatic weather stations and their sensors meet all federal (EPA PSD standards) and state agency requirements.
Table 2. Sampling Site Configuration
Street Location Roadway Width (meters)
Sunrise Boulevard North 39.4
Sunrise Boulevard South 39.7
Greenback Lane West 37.1
Greenback Lane East 37.1
Sampler location Distance North (m) Distance East (m)
NE Corner 21.6 20.7
SW Far -136.7 -54.4
SW Corner -25.2 -31.5
SE Corner -23.1 46.2
NE Corner 111.8 99.8

4
Results
Traffic
Traffic counts were provided by the County of Sacramento from February 26th at 12:00 a.m. through March 4th 12:00 p.m. The counts were averaged and recorded hourly. Figure 3 shows the traffic volume at each of the approaches to the intersection, and the total traffic volume during the study period. Table 3 shows the traffic volume for the intersection and for each approach for each test period. Because the test periods did not start and stop on the hour, the traffic volumes for each test period in Table 2 were estimated from the hourly data. We assumed the hourly traffic volume was constant during each hourly count, and computed the fraction of the hour covered by the sampling period to arrive at the fractional hourly traffic volume for each test. The total traffic volume for each test period is the sum of the fractional hourly traffic volumes during the sample period. The Sunrise Boulevard southbound traffic counter failed from March 2nd at 10:30 a.m. until the end of the counting period. Consequently, total traffic counts in this time period were estimated by averaging the southbound traffic counts from previous weekdays.
FILTERCASSETTE
ETI # 2ETI # 2
CYCLONE
# 1# 1 # 2# 2
TOGGLE
TOGGLE
CLAMP
ETI # 1ETI # 1
INLETSTACK
HOLDDOWN
KNOBKNURLED
TOGGLE
# 1# 1
CRITICALORIFICE
# 2# 2
.20
DO NOT
15
in Hg
VACUUM
ZERO
5
1
10
30
25
200
ZERO SET
MAGNEHELIC
.40 .80.60
INCHES OF WATER
1.0
ADJUST
Figure 2. IMPROVE PM2.5 sampling module

5
0
1 , 0 0 0
2 , 0 0 0
3 , 0 0 0
4 , 0 0 0
5 , 0 0 0
6 , 0 0 0
7 , 0 0 0
8 , 0 0 0
9 , 0 0 0
1 0 , 0 0 0
12:0
0 A
M
12:0
0 A
M
12:0
0 A
M
12:0
0 A
M
12:0
0 A
M
12:0
0 A
M
12:0
0 A
M
12:0
0 A
M
Ho
url
y V
ehic
le C
ou
nts
To
tal -
axl
es/2
)
-
5 0 0
1 , 0 0 0
1 , 5 0 0
2 , 0 0 0
2 , 5 0 0
3 , 0 0 0
3 , 5 0 0
4 , 0 0 0
4 , 5 0 0
5 , 0 0 0
Ho
url
y V
ehic
le C
ou
nts
(Ap
pro
ach
es -
axle
s/2)
T o t a l C o u n t S u n r is e N /B S u n r is e S /BG r e e n b a c k E /B G r e e n b a c k W /B
T h u r s d a yF e b r u a r y 2 7
S a tu r d a yM a r c h 1
F r id a yF e b ru a r y 2 8
W e d n e s d a yF e b r u a r y 2 6
T u e s d a yM a rc h 4
M o n d a yM a rc h 3
S u n d a yM a rc h 2
Figure 3. Traffic volume at the four approaches to Sunrise Boulevard and Greenback
Lane during the sample period
Table 3. Average hourly vehicle counts for the intersection and each approach during each test period
TESTID Intersection Sunrise
Northbound Sunrise
Southbound Greenback Eastbound
Greenback Westbound
97-013 5570 1447 1331 1554 1238 97-014 4216 981 1241 1013 982 97-015 5371 1796 1111 1322 1143 97-016 5057 1745 844 1358 1110 97-017 3683 1080 668 982 952 97-018 5801 1833 1426 1368 1174 97-019 5679 1881 1281 1426 1090 97-020 5342 1342 1522 1321 1157 97-021 7899 2158 2342 1804 1594 97-022 3939 1185 860 1003 890 97-023 5054 1091 1396 1347 1220 97-024 4216 981 1241 1013 982 97-025 4991 1533 1183 1204 1071 97-026 5339 1909 875 1409 1146 97-027 4027 1158 852 1044 974 97-028 5679 1881 1281 1426 1090 97-029 2397 761 516 603 517 97-030 470 109 141 119 101 97-031 4743 1098 1536 1059 1050

6
Road surface silt loading
Table 4 shows the silt loading measurements at the crosswalk for each side of the Sunrise Boulevard/Greenback Lane intersection. The Sunrise Boulevard silt loadings were significantly higher than the Greenback Lane silt loadings. These measurements were also an order of magnitude higher than all but one of the measurements at Florin Road/Stockton Boulevard in August, 1995. Table 4 also shows the calculated PM10 and PM2.5 emission rates using the predictive equation provided by the EPA in AP-42 (U.S. EPA, 1995). Note that the earlier study (UC Davis, 1996) found lower actual emission rates than those calculated using the EPA equation.
Meteorology
The meteorology varied from day to day throughout the test, as shown in Figure 4. The wind direction sometimes changed dramatically during the day, and other times was consistent for long periods The wind speed was often below 2 m/s, and provided good conditions for “hot spot” investigation during those times. On the last day of the test period, the wind speed dropped to nearly zero, and the direction fluctuated greatly, indicating an extended period of calm winds. This was the most ideal time period for a “hot spot” to develop. The meteorological conditions during each test period are summarized in Table 5.
The temperature and relative humidity at the NE Corner tower are shown in Figure 5. A pronounced diurnal pattern is evident, although there are some differences from day to day. The first test day was much drier than the others. The highest RH approached 90% at the end of the study, but it was not foggy during the tests.
Table 4. Measured roadway silt loading and calculated PM10 emissions from paved roads using AP-42
Sunrise Crosswalk Greenback Crosswalk
North South West East
Measured Roadway Silt Loading (mg/m2) 33.2 26.1 18.4 13.6
Calculated PM10 Emission Rate (mg/VKT) 17.3 14.8 11.8 9.7
Calculated PM2.5 Emission Rate (mg/VKT) 7.9 6.8 5.4 4.4

7
0
90
180
270
360
450
540
630
720
810
900
02/25/97 02/26/97 02/27/97 02/28/97 03/01/97 03/02/97 03/03/97 03/04/97 03/05/97 03/06/97 03/07/97 03/08/97
Win
d di
rect
ion
(deg
rees
)
-12
-10
-8
-6
-4
-2
0
2
4
6
8
Win
d sp
eed
(m/s
)
Wind direction @ 4m
Standard deviation of wind direction @ 4m
Wind speed @ 4m
Figure 4. Wind speed, wind direction, and standard deviation of wind
direction during the study period
0
10
20
30
40
50
60
70
80
90
100
02/25/97 02/26/97 02/27/97 02/28/97 03/01/97 03/02/97 03/03/97 03/04/97 03/05/97 03/06/97 03/07/97 03/08/97
Tem
pera
ture
(deg
rees
)
R
elat
ive
Hum
idity
(per
cent
)
Relative Humidity at 2m
Temperature at 2m
Figure 5. Temperature and relative humidity at 2 meters height during the
study period

Table 5. Meteorological conditions during each test period
South Tower North Tower
Test Start date/time End time Mean wind speed at 4m
Mean wind direction ± standard deviation
at 4m
Mean Richardson
number
Mean wind speed at 4m
Mean wind direction ± standard deviation
at 4m
Mean Richardson
number 97-013 2/25/97 16:31 18:50 1.55 183.2 ± 63.8 -0.025 1.62 208.3 ± 89.7 -0.033 97-014 2/26/97 6:44 10:00 1.44 311.6 ± 11.6 -0.006 1.12 344.0 ± 38.3 -0.082 97-015 2/26/97 10:00 16:13 2.11 287.0 ± 47.4 -0.068 1.77 305.9 ± 51.1 -0.031 97-016 2/26/97 16:13 18:30 3.18 151.1 ± 10.0 -0.015 2.50 165.5 ± 16.7 -0.015 97-017 2/27/97 7:00 10:00 1.27 149.7 ± 29.1 -0.062 1.26 162.3 ± 29.9 -0.042 97-018 2/27/97 10:00 16:04 2.77 230.9 ± 88.3 -0.038 2.23 243.2 ± 90.0 -0.028 97-019 2/27/97 16:30 18:30 3.35 343.3 ± 22.1 -0.002 2.38 357.9 ± 26.1 -0.010 97-020 3/1/97 7:05 10:10 3.42 145.1 ± 9.8 -0.008 2.76 158.3 ± 11.8 -0.010 97-021 3/1/97 12:09 17:19 3.67 184.4 ± 16.2 -0.010 3.10 207.3 ± 15.8 -0.013 97-022 3/1/97 17:19 21:17 2.24 181.9 ± 18.9 -0.009 2.02 202.0 ± 25.0 -0.018 97-023 3/3/97 10:33 13:40 1.98 171.5 ± 47.6 -0.048 1.85 219.0 ± 81.2 -0.033 97-024 3/5/97 6:17 9:28 0.68 125.4 ± 14.4 0.078 0.84 N/A -0.018 97-025 3/5/97 9:28 13:00 1.76 176.5 ± 35.4 -0.068 1.63 N/A -0.044 97-026 3/5/97 14:00 18:30 2.44 161.6 ± 17.9 -0.019 2.05 N/A -0.025 97-027 3/6/97 7:36 10:05 1.10 318.2 ± 74.0 -0.146 0.98 371.3 ± 62.4 -0.085 97-028 3/6/97 16:52 18:42 1.84 317.5 ± 9.1 0.040 1.30 319.3 ± 17.8 -0.038 97-029 3/6/97 18:42 23:16 0.59 N/A 0.137 0.62 59.3 ± 54.1 0.064 97-030 3/6/97 23:16 4:05 0.63 69.5 ± 57.1 0.073 0.62 60.2 ± 56.8 0.026 97-031 3/7/97 6:38 9:30 0.92 63.6 ± 56.5 -0.064 0.99 60.5 ± 53.7 -0.075

9
Particle concentrations
Figure 6 shows the PM10 concentration for each sample period averaged over all sampling locations. The organic carbon, soil, and soot concentrations are composites of the measured elemental concentrations. The reconstructed mass is the sum of these composites and several others, including all the measured elements. This figure shows the general trend of particle concentrations during the field study, with high concentrations developing in the evening of March 6 due to low wind speed and poor dispersion. Figure 4 clearly shows this episode as having the lowest wind speed of the study period. Table 5 also shows this period as having the most stable atmosphere, as the Richardson Number for both meteorological towers reached the highest positive value during this time period. Note that the PM10 mass concentrations shown in Figure 6 are the average of all measurements for each sampling period, including different heights, and do not represent individual measurements. These averages should not be compared to the PM10 NAAQS, as they are not 24-hour averages, but they can be used to discern particle concentration trends during the study.
Particle composition
The composition of the particles changed during the study, as shown in Figure 7. During the final four sampling periods, when the stagnant winds and stable surface layer predominated, the soil fraction dropped to its lowest level and the organic mass (as measured by the hydrogen
PM10 Concentrations
0
10
20
30
40
50
60
70
80
90
100
2/2516:31
2/266:44
2/2610:00
2/2616:13
2/277:00
2/2710:00
2/2716:30
3/17:05
3/112:09
3/117:19
3/310:33
3/56:17
3/59:28
3/514:00
3/67:36
3/616:52
3/618:42
3/623:16
3/76:38
Sample start date/time
Mas
s ( µ
g/m
3 )
0
1
2
3
4
5
Soot
( µg/
m3 )
MassReconstructed massOrganic massSoilSoot
(All)
Figure 6. PM10 concentrations averaged for all sampling locations (soot concentrations
are on the right-hand axis)

10
concentration) increased. The soot contribution to the total PM10 mass generally followed the organic mass, increasing toward the end of the study period, but also showed peaks in the morning hours on 2/26, 2/27, and 3/5. Soot is contributed primarily by diesel vehicles. At this site, soot is not a large fraction of the PM10 mass, but the correlation with organic mass suggests that organic mass is also contributed by vehicular traffic.
Overall, the measured species accounted for ~60-95% of the total PM10 mass, so during some sampling periods the composition was unknown for a significant fraction of the mass. This could have resulted from nitrate compounds or carbonaceous material that was not measured by the analytical methods employed in this study.
Percent of PM10 Mass
0%
10%
20%
30%
40%
50%
60%
70%
80%
90%
100%
2/2516:31
2/266:44
2/2610:00
2/2616:13
2/277:00
2/2710:00
2/2716:30
3/17:05
3/112:09
3/117:19
3/310:33
3/56:17
3/59:28
3/514:00
3/67:36
3/616:52
3/618:42
3/623:16
3/76:38
Sample start date/time
Reconstructed massOrganic massSoilSoot (x10)
Figure 7. Ratio of particle composition to total PM10 mass for all sampling locations
Discussion The primary objective of this study was to investigate whether a large intersection was likely to be a PM10 “hot spot” during periods of low wind speed and poor dispersion. The highest concentrations measured during this study occurred during such a period on March 6 from 6:45 p.m. to 11:15 p.m. The PM10 mass and composition for this time period are shown in Table 6 and are plotted in Figure 8. Similar plots for other time periods are shown in Appendix A.
The six vertical profiles of Figure 8 indicate that the intersection is unlikely to be a “hot spot” of PM10 even under stable, low dispersion meteorological conditions. The wind direction during this period was from the NE, and the wind speed averaged less than 1 m/s. The Richardson number was positive, indicating a very stable atmosphere. Even though the wind direction placed
11
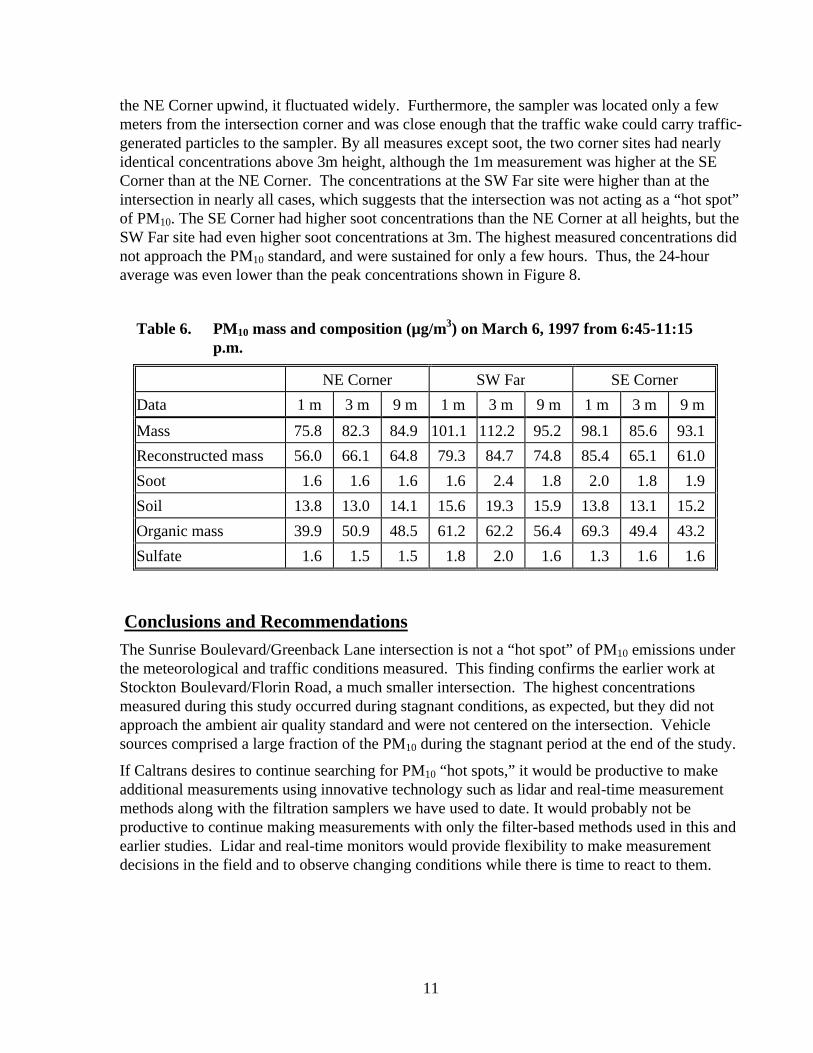
the NE Corner upwind, it fluctuated widely. Furthermore, the sampler was located only a few meters from the intersection corner and was close enough that the traffic wake could carry traffic-generated particles to the sampler. By all measures except soot, the two corner sites had nearly identical concentrations above 3m height, although the 1m measurement was higher at the SE Corner than at the NE Corner. The concentrations at the SW Far site were higher than at the intersection in nearly all cases, which suggests that the intersection was not acting as a “hot spot” of PM10. The SE Corner had higher soot concentrations than the NE Corner at all heights, but the SW Far site had even higher soot concentrations at 3m. The highest measured concentrations did not approach the PM10 standard, and were sustained for only a few hours. Thus, the 24-hour average was even lower than the peak concentrations shown in Figure 8.
Conclusions and Recommendations The Sunrise Boulevard/Greenback Lane intersection is not a “hot spot” of PM10 emissions under the meteorological and traffic conditions measured. This finding confirms the earlier work at Stockton Boulevard/Florin Road, a much smaller intersection. The highest concentrations measured during this study occurred during stagnant conditions, as expected, but they did not approach the ambient air quality standard and were not centered on the intersection. Vehicle sources comprised a large fraction of the PM10 during the stagnant period at the end of the study.
If Caltrans desires to continue searching for PM10 “hot spots,” it would be productive to make additional measurements using innovative technology such as lidar and real-time measurement methods along with the filtration samplers we have used to date. It would probably not be productive to continue making measurements with only the filter-based methods used in this and earlier studies. Lidar and real-time monitors would provide flexibility to make measurement decisions in the field and to observe changing conditions while there is time to react to them.
Table 6. PM10 mass and composition (µg/m3) on March 6, 1997 from 6:45-11:15 p.m.
NE Corner SW Far SE Corner
Data 1 m 3 m 9 m 1 m 3 m 9 m 1 m 3 m 9 m
Mass 75.8 82.3 84.9 101.1 112.2 95.2 98.1 85.6 93.1
Reconstructed mass 56.0 66.1 64.8 79.3 84.7 74.8 85.4 65.1 61.0
Soot 1.6 1.6 1.6 1.6 2.4 1.8 2.0 1.8 1.9
Soil 13.8 13.0 14.1 15.6 19.3 15.9 13.8 13.1 15.2
Organic mass 39.9 50.9 48.5 61.2 62.2 56.4 69.3 49.4 43.2
Sulfate 1.6 1.5 1.5 1.8 2.0 1.6 1.3 1.6 1.6

12
-8
8
-8 8
N
E
S
W
NE Corner
SE Corner
SW Far
Vertical PM 10 profile
0
1
2
3
4
5
6
7
8
9
0 50 100 150Concentration (µ g/m 3)
Hei
gh
t
NE Corner SW Far SE Corner
Test 97-029 - MASSVertical PM 10 profile
0
1
2
3
4
5
6
7
8
9
0 20 40 60 80 100Concentration (µ g/m 3)
Hei
gh
t
NE Corner SW Far SE Corner
Test 97-029 - Reconstructed Mass
Vertical PM 10 profile
0
1
2
3
4
5
6
7
8
9
0 10 20 30Concentration (µ g/m 3)
Hei
gh
t
NE Corner SW Far SE Corner
Test 97-029 - SOILVertical PM 10 profile
0
1
2
3
4
5
6
7
8
9
0 0.5 1 1.5 2 2.5 3Concentration (µ g/m 3)
Hei
gh
t
NE Corner SW Far SE Corner
Test 97-029 - SOOT
Vertical PM 10 profile
0
1
2
3
4
5
6
7
8
9
0 20 40 60 80Concentration (µ g/m 3)
Hei
gh
t
NE Corner SW Far SE Corner
Test 97-029 - Organic MassVertical PM 10 profile
0
1
2
3
4
5
6
7
8
9
0 0.5 1 1.5 2 2.5Concentration (µ g/m 3)
Hei
gh
t
NE Corner SW Far SE Corner
Test 97-029 - Sulfate
Figure 8. Vertical profiles of PM10 mass and composition, March 6, 1997 6:45-11:15 p.m.
13
Acknowledgments A number of individuals outside the Air Quality Group assisted with this project. Doug Maas and Sonya Hernandez of Sacramento County Traffic Division provided traffic counts for all four approaches to the intersection. The managers of US Bank, Glendale Savings, and Michael Joe’s European Salon allowed us to use several parking spaces during the study. The manager of Sunrise Mall also permitted use of their property, although we did not need to use it. The managers of Montgomery Ward were extremely helpful, allowing us use of their property, facilities, and electrical power. Security fencing was rented from Security Contractor Fences, and security guards were from Comprehensive Security Systems. Dan Chang of the UC Davis Department of Civil and Environmental Engineering contributed through discussions of the project and in coordinating the companion project operated by the Department of Civil and Environmental Engineering. Dan was also instrumental in obtaining permission to use the property at Sunrise Festival Mall.
References Eldred, R.A., T.A. Cahill, M. Pitchford, and W.C. Malm, 1988, IMPROVE - A new remote area particulate monitoring system for visibility studies. Paper number 88-54.3, presented at the Air Pollution Control Association 81st Annual Meeting, Dallas, TX.
University of California, 1996, Traffic Generated PM10 “Hot Spots”, Report to Caltrans on Contract No. 53V606 A2.
United States Environmental Protection Agency, 1995, Compilation of Air Pollutant Emission Factors, AP-42, Fifth Edition.

14

Appendix A: Vertical profiles of mass and composition for all test periods

A-2
-8
8
-8 8
N
E
S
W
Vertical PM10 profile
0
1
2
3
4
5
6
7
8
9
0 50 100 150Concentration (µ g/m 3)
Hei
gh
t
NE Corner SW Far # N/ A
Test 97-013 - MASSVertical PM 2.5 profile
0
1
2
3
4
5
6
7
8
9
0 50 100 150Concentration (µ g/m 3)
Hei
gh
t
NE Corner SW Far #N/A
Test 97-013 - MASS
Vertical PM10 profile
0
1
2
3
4
5
6
7
8
9
0 20 40 60 80 100Concentration (µ g/m 3)
Hei
gh
t
NE Corner SW Far #N/A
Test 97-013 - Reconstructed MassVertical PM 2.5 profile
0
1
2
3
4
5
6
7
8
9
0 20 40 60 80 100Concentration (µ g/m 3)
Hei
gh
t
NE Corner SW Far #N/A
Test 97-013 - Reconstructed Mass
Figure 9. Wind vector plot and vertical profiles of mass and reconstructed mass,
February 25, 1997 4:35 - 6:45 p.m.

A-3
-8
8
-8 8
N
E
S
W
Vertical PM10 profile
0
1
2
3
4
5
6
7
8
9
0 10 20 30Concentration (µ g/m 3)
Hei
gh
t
NE Corner SW Far #N/A
Test 97-013 - SOILVertical PM 2.5 profile
0
1
2
3
4
5
6
7
8
9
0 10 20 30Concentration (µ g/m 3)
Hei
gh
t
NE Corner SW Far #N/A
Test 97-013 - SOIL
Vertical PM10 profile
0
1
2
3
4
5
6
7
8
9
0 0.5 1 1.5 2 2.5 3Concentration (µ g/m 3)
Hei
gh
t
NE Corner SW Far # N/ A
Test 97-013 - SOOTVertical PM 2.5 profile
0
1
2
3
4
5
6
7
8
9
0 0.5 1 1.5 2 2.5 3Concentration (µ g/m 3)
Hei
gh
t
NE Corner SW Far #N/A
Test 97-013 - SOOT
Vertical PM10 profile
0
1
2
3
4
5
6
7
8
9
0 20 40 60 80Concentration (µ g/m 3)
Hei
gh
t
NE Corner SW Far #N/A
Test 97-013 - Organic MassVertical PM 2.5 profile
0
1
2
3
4
5
6
7
8
9
0 20 40 60 80Concentration (µ g/m 3)
Hei
gh
t
NE Corner SW Far # N/ A
Test 97-013 - Organic Mass
Figure 10. Vertical profiles of soil, soot, and organic mass, February 25, 1997 4:35 - 6:45
p.m.

A-4
-8
8
-8 8
N
E
S
W
Vertical PM10 profile
0
1
2
3
4
5
6
7
8
9
0 50 100 150Concentration (µ g/m 3)
Hei
gh
t
NE Corner SW Corner SW Far
Test 97-014 - MASSVertical PM 2.5 profile
0
1
2
3
4
5
6
7
8
9
0 50 100 150Concentration (µ g/m 3)
Hei
gh
t
NE Corner SW Corner SW Far
Test 97-014 - MASS
Vertical PM10 profile
0
1
2
3
4
5
6
7
8
9
0 20 40 60 80 100Concentration (µ g/m 3)
Hei
gh
t
NE Corner SW Corner SW Far
Test 97-014 - Reconstructed MassVertical PM 2.5 profile
0
1
2
3
4
5
6
7
8
9
0 20 40 60 80 100Concentration (µ g/m 3)
Hei
gh
t
NE Corner SW Corner SW Far
Test 97-014 - Reconstructed Mass
Figure 11. Wind vector plot and vertical profiles of mass and reconstructed mass,
February 26, 1997 6:45 - 9:55 a.m.

A-5
-8
8
-8 8
N
E
S
W
Vertical PM10 profile
0
1
2
3
4
5
6
7
8
9
0 10 20 30Concentration (µ g/m 3)
Hei
gh
t
NE Corner SW Corner SW Far
Test 97-014 - SOILVertical PM 2.5 profile
0
1
2
3
4
5
6
7
8
9
0 10 20 30Concentration (µ g/m 3)
Hei
gh
t
NE Corner SW Corner SW Far
Test 97-014 - SOIL
Vertical PM10 profile
0
1
2
3
4
5
6
7
8
9
0 0.5 1 1.5 2 2.5 3Concentration (µ g/m 3)
Hei
gh
t
NE Corner SW Corner SW Far
Test 97-014 - SOOTVertical PM 2.5 profile
0
1
2
3
4
5
6
7
8
9
0 0.5 1 1.5 2 2.5 3Concentration (µ g/m 3)
Hei
gh
t
NE Corner SW Corner SW Far
Test 97-014 - SOOT
Vertical PM10 profile
0
1
2
3
4
5
6
7
8
9
0 20 40 60 80Concentration (µ g/m 3)
Hei
gh
t
NE Corner SW Corner SW Far
Test 97-014 - Organic MassVertical PM 2.5 profile
0
1
2
3
4
5
6
7
8
9
0 20 40 60 80Concentration (µ g/m 3)
Hei
gh
t
NE Corner SW Corner SW Far
Test 97-014 - Organic Mass
Figure 12. Vertical profiles of soil, soot, and organic mass, February 26, 1997 6:45 - 9:55
a.m.

A-6
-8
8
-8 8
N
E
S
W
Vertical PM10 profile
0
1
2
3
4
5
6
7
8
9
0 50 100 150Concentration (µ g/m 3)
Hei
gh
t
NE Corner SW Corner SW Far
Test 97-015 - MASSVertical PM 2.5 profile
0
1
2
3
4
5
6
7
8
9
0 50 100 150Concentration (µ g/m 3)
Hei
gh
t
NE Corner SW Corner SW Far
Test 97-015 - MASS
Vertical PM10 profile
0
1
2
3
4
5
6
7
8
9
0 20 40 60 80 100Concentration (µ g/m 3)
Hei
gh
t
NE Corner SW Corner SW Far
Test 97-015 - Reconstructed MassVertical PM 2.5 profile
0
1
2
3
4
5
6
7
8
9
0 20 40 60 80 100Concentration (µ g/m3)
Hei
gh
t
NE Corner SW Corner SW Far
Test 97-015 - Reconstructed Mass
Figure 13. Wind vector plot and vertical profiles of mass and reconstructed mass,
February 26, 1997 10:00 a.m. - 4:10 p.m.

A-7
-8
8
-8 8
N
E
S
W
Vertical PM10 profile
0
1
2
3
4
5
6
7
8
9
0 10 20 30Concentration (µ g/m 3)
Hei
gh
t
NE Corner SW Corner SW Far
Test 97-015 - SOILVertical PM 2.5 profile
0
1
2
3
4
5
6
7
8
9
0 10 20 30Concentration (µ g/m 3)
Hei
gh
t
NE Corner SW Corner SW Far
Test 97-015 - SOIL
Vertical PM10 profile
0
1
2
3
4
5
6
7
8
9
0 0.5 1 1.5 2 2.5 3Concentration (µ g/m 3)
Hei
gh
t
NE Corner SW Corner SW Far
Test 97-015 - SOOTVertical PM 2.5 profile
0
1
2
3
4
5
6
7
8
9
0 0.5 1 1.5 2 2.5 3Concentration (µ g/m 3)
Hei
gh
t
NE Corner SW Corner SW Far
Test 97-015 - SOOT
Vertical PM10 profile
0
1
2
3
4
5
6
7
8
9
0 20 40 60 80Concentration (µ g/m 3)
Hei
gh
t
NE Corner SW Corner SW Far
Test 97-015 - Organic MassVertical PM 2.5 profile
0
1
2
3
4
5
6
7
8
9
0 20 40 60 80Concentration (µ g/m 3)
Hei
gh
t
NE Corner SW Corner SW Far
Test 97-015 - Organic Mass
Figure 14. Vertical profiles of soil, soot, and organic mass, February 26, 1997 10:00
a.m. - 4:10 p.m.

A-8
-8
8
-8 8
N
E
S
W
Vertical PM10 profile
0
1
2
3
4
5
6
7
8
9
0 50 100 150Concentration (µ g/m 3)
Hei
gh
t
NE Corner SW Corner SW Far
Test 97-016 - MASSVertical PM 2.5 profile
0
1
2
3
4
5
6
7
8
9
0 50 100 150Concentration (µ g/m 3)
Hei
gh
t
NE Corner SW Corner SW Far
Test 97-016 - MASS
Vertical PM10 profile
0
1
2
3
4
5
6
7
8
9
0 20 40 60 80 100Concentration (µ g/m 3)
Hei
gh
t
NE Corner SW Corner SW Far
Test 97-016 - Reconstructed MassVertical PM 2.5 profile
0
1
2
3
4
5
6
7
8
9
0 20 40 60 80 100Concentration (µ g/m 3)
Hei
gh
t
NE Corner SW Corner SW Far
Test 97-016 - Reconstructed Mass
Figure 15. Wind vector plot and vertical profiles of mass and reconstructed mass,
February 26, 1997 4:15 - 6:25 p.m.
A-9
-8
8
-8 8
N
E
S
W
Vertical PM10 profile
0
1
2
3
4
5
6
7
8
9
0 10 20 30Concentration (µ g/m 3)
Hei
gh
t
NE Corner SW Corner SW Far
Test 97-016 - SOILVertical PM 2.5 profile
0
1
2
3
4
5
6
7
8
9
0 10 20 30Concentration (µ g/m 3)
Hei
gh
t
NE Corner SW Corner SW Far
Test 97-016 - SOIL
Vertical PM10 profile
0
1
2
3
4
5
6
7
8
9
0 0.5 1 1.5 2 2.5 3Concentration (µ g/m 3)
Hei
gh
t
NE Corner SW Corner SW Far
Test 97-016 - SOOTVertical PM 2.5 profile
0
1
2
3
4
5
6
7
8
9
0 0.5 1 1.5 2 2.5 3Concentration (µ g/m 3)
Hei
gh
t
NE Corner SW Corner SW Far
Test 97-016 - SOOT
Vertical PM10 profile
0
1
2
3
4
5
6
7
8
9
0 20 40 60 80Concentration (µ g/m 3)
Hei
gh
t
NE Corner SW Corner SW Far
Test 97-016 - Organic MassVertical PM 2.5 profile
0
1
2
3
4
5
6
7
8
9
0 20 40 60 80Concentration (µ g/m 3)
Hei
gh
t
NE Corner SW Corner SW Far
Test 97-016 - Organic Mass
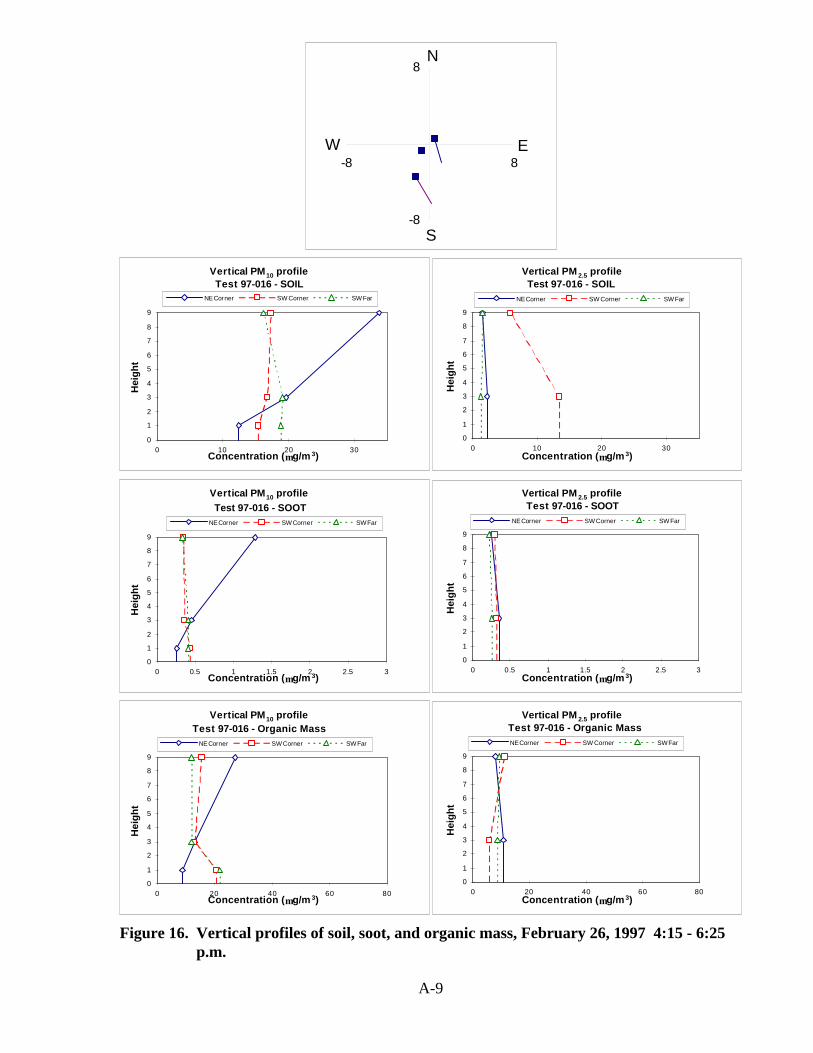
Figure 16. Vertical profiles of soil, soot, and organic mass, February 26, 1997 4:15 - 6:25
p.m.

A-10
-8
8
-8 8
N
E
S
W
Vertical PM10 profile
0
1
2
3
4
5
6
7
8
9
0 50 100 150Concentration (µ g/m 3)
Hei
gh
t
NE Corner SW Corner SW Far
Test 97-017 - MASSVertical PM 2.5 profile
0
1
2
3
4
5
6
7
8
9
0 50 100 150Concentration (µ g/m3)
Hei
gh
t
NE Corner SW Corner SW Far
Test 97-017 - MASS
Vertical PM10 profile
0
1
2
3
4
5
6
7
8
9
0 20 40 60 80 100Concentration (µ g/m 3)
Hei
gh
t
NE Corner SW Corner SW Far
Test 97-017 - Reconstructed MassVertical PM 2.5 profile
0
1
2
3
4
5
6
7
8
9
0 20 40 60 80 100Concentration (µ g/m 3)
Hei
gh
t
NE Corner SW Corner SW Far
Test 97-017 - Reconstructed Mass
Figure 17. Wind vector plot and vertical profiles of mass and reconstructed mass,
February 27, 1997 7:00 - 9:55 a.m.
A-11
-8
8
-8 8
N
E
S
W
Vertical PM10 profile
0
1
2
3
4
5
6
7
8
9
0 10 20 30Concentration (µ g/m 3)
Hei
gh
t
NE Corner SW Corner SW Far
Test 97-017 - SOILVertical PM 2.5 profile
0
1
2
3
4
5
6
7
8
9
0 10 20 30Concentration (µ g/m 3)
Hei
gh
t
NE Corner SW Corner SW Far
Test 97-017 - SOIL
Vertical PM10 profile
0
1
2
3
4
5
6
7
8
9
0 0.5 1 1.5 2 2.5 3Concentration (µ g/m 3)
Hei
gh
t
NE Corner SW Corner SW Far
Test 97-017 - SOOTVertical PM 2.5 profile
0
1
2
3
4
5
6
7
8
9
0 0.5 1 1.5 2 2.5 3Concentration (µ g/m 3)
Hei
gh
t
NE Corner SW Corner SW Far
Test 97-017 - SOOT
Vertical PM10 profile
0
1
2
3
4
5
6
7
8
9
0 20 40 60 80Concentration (µ g/m 3)
Hei
gh
t
NE Corner SW Corner SW Far
Test 97-017 - Organic MassVertical PM 2.5 profile
0
1
2
3
4
5
6
7
8
9
0 20 40 60 80Concentration (µ g/m 3)
Hei
gh
t
NE Corner SW Corner SW Far
Test 97-017 - Organic Mass
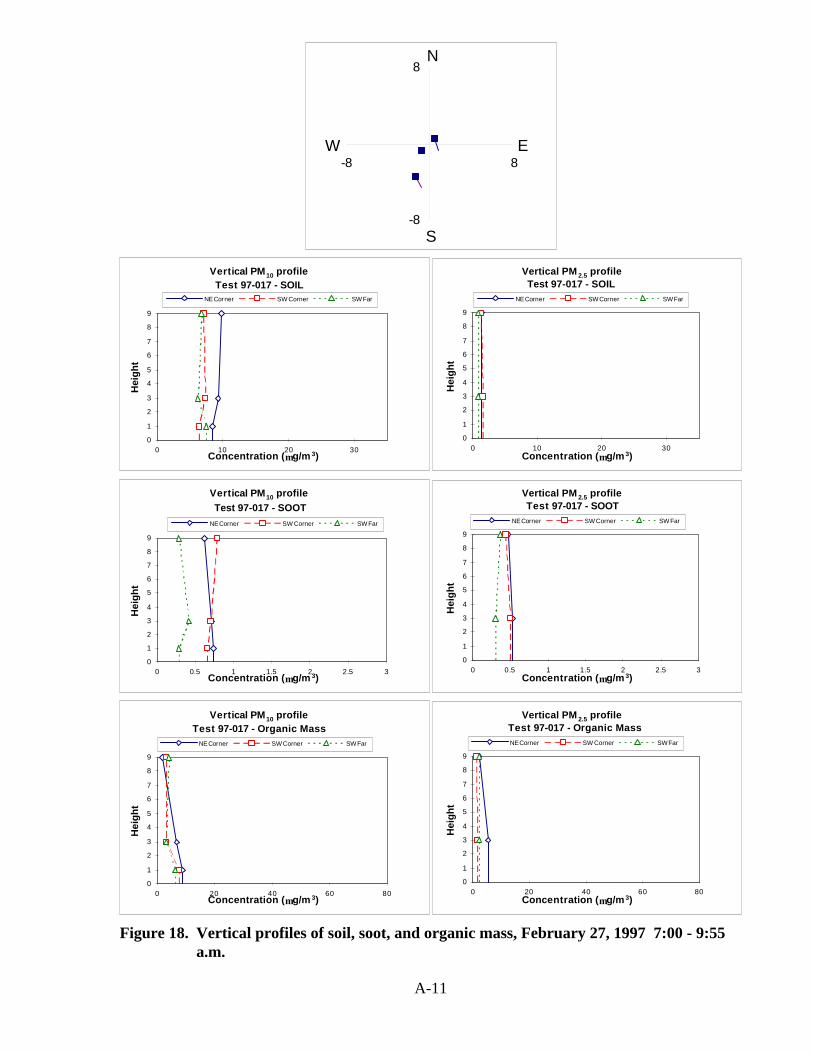
Figure 18. Vertical profiles of soil, soot, and organic mass, February 27, 1997 7:00 - 9:55
a.m.

A-12
-8
8
-8 8
N
E
S
W
Vertical PM10 profile
0
1
2
3
4
5
6
7
8
9
0 50 100 150Concentration (µ g/m 3)
Hei
gh
t
NE Corner SW Corner SW Far
Test 97-018 - MASSVertical PM 2.5 profile
0
1
2
3
4
5
6
7
8
9
0 50 100 150Concentration (µ g/m 3)
Hei
gh
t
NE Corner SW Corner SW Far
Test 97-018 - MASS
Vertical PM10 profile
0
1
2
3
4
5
6
7
8
9
0 20 40 60 80 100Concentration (µ g/m 3)
Hei
gh
t
NE Corner SW Corner SW Far
Test 97-018 - Reconstructed MassVertical PM 2.5 profile
0
1
2
3
4
5
6
7
8
9
0 20 40 60 80 100Concentration (µ g/m 3)
Hei
gh
t
NE Corner SW Corner SW Far
Test 97-018 - Reconstructed Mass
Figure 19. Wind vector plot and vertical profiles of mass and reconstructed mass,
February 27, 1997 10:00 a.m. - 4:00 p.m.

A-13
-8
8
-8 8
N
E
S
W
Vertical PM10 profile
0
1
2
3
4
5
6
7
8
9
0 10 20 30Concentration (µ g/m 3)
Hei
gh
t
NE Corner SW Corner SW Far
Test 97-018 - SOILVertical PM 2.5 profile
0
1
2
3
4
5
6
7
8
9
0 10 20 30Concentration (µ g/m 3)
Hei
gh
t
NE Corner SW Corner SW Far
Test 97-018 - SOIL
Vertical PM10 profile
0
1
2
3
4
5
6
7
8
9
0 0.5 1 1.5 2 2.5 3Concentration (µ g/m 3)
Hei
gh
t
NE Corner SW Corner SW Far
Test 97-018 - SOOTVertical PM 2.5 profile
0
1
2
3
4
5
6
7
8
9
0 0.5 1 1.5 2 2.5 3Concentration (µ g/m 3)
Hei
gh
t
NE Corner SW Corner SW Far
Test 97-018 - SOOT
Vertical PM10 profile
0
1
2
3
4
5
6
7
8
9
0 20 40 60 80Concentration (µ g/m 3)
Hei
gh
t
NE Corner SW Corner SW Far
Test 97-018 - Organic MassVertical PM 2.5 profile
0
1
2
3
4
5
6
7
8
9
0 20 40 60 80Concentration (µ g/m 3)
Hei
gh
t
NE Corner SW Corner SW Far
Test 97-018 - Organic Mass
Figure 20. Vertical profiles of soil, soot, and organic mass, February 27, 1997 10:00 a.m.
- 4:00 p.m.

A-14
-8
8
-8 8
N
E
S
W
Vertical PM10 profile
0
1
2
3
4
5
6
7
8
9
0 50 100 150Concentration (µ g/m 3)
Hei
gh
t
NE Corner SW Corner SW Far
Test 97-019 - MASSVertical PM 2.5 profile
0
1
2
3
4
5
6
7
8
9
0 50 100 150Concentration (µ g/m3)
Hei
gh
t
NE Corner SW Corner SW Far
Test 97-019 - MASS
Vertical PM10 profile
0
1
2
3
4
5
6
7
8
9
0 20 40 60 80Concentration (µ g/m 3)
Hei
gh
t
NE Corner SW Corner SW Far
Test 97-019 - Reconstructed MassVertical PM 2.5 profile
0
1
2
3
4
5
6
7
8
9
0 20 40 60 80Concentration (µ g/m 3)
Hei
gh
t
NE Corner SW Corner SW Far
Test 97-019 - Reconstructed Mass
Figure 21. Wind vector plot and vertical profiles of mass and reconstructed mass,
February 27, 1997 4:30 - 6:25 p.m.
A-15
-8
8
-8 8
N
E
S
W
Vertical PM10 profile
0
1
2
3
4
5
6
7
8
9
0 10 20 30Concentration (µ g/m 3)
Hei
gh
t
NE Corner SW Corner SW Far
Test 97-019 - SOILVertical PM 2.5 profile
0
1
2
3
4
5
6
7
8
9
0 10 20 30Concentration (µ g/m 3)
Hei
gh
t
NE Corner SW Corner SW Far
Test 97-019 - SOIL
Vertical PM10 profile
0
1
2
3
4
5
6
7
8
9
0 0.5 1 1.5 2 2.5 3Concentration (µ g/m 3)
Hei
gh
t
NE Corner SW Corner SW Far
Test 97-019 - SOOTVertical PM 2.5 profile
0
1
2
3
4
5
6
7
8
9
0 0.5 1 1.5 2 2.5 3Concentration (µ g/m 3)
Hei
gh
t
NE Corner SW Corner SW Far
Test 97-019 - SOOT
Vertical PM10 profile
0
1
2
3
4
5
6
7
8
9
0 20 40 60 80Concentration (µ g/m 3)
Hei
gh
t
NE Corner SW Corner SW Far
Test 97-019 - Organic MassVertical PM 2.5 profile
0
1
2
3
4
5
6
7
8
9
0 20 40 60 80Concentration (µ g/m 3)
Hei
gh
t
NE Corner SW Corner SW Far
Test 97-019 - Organic Mass
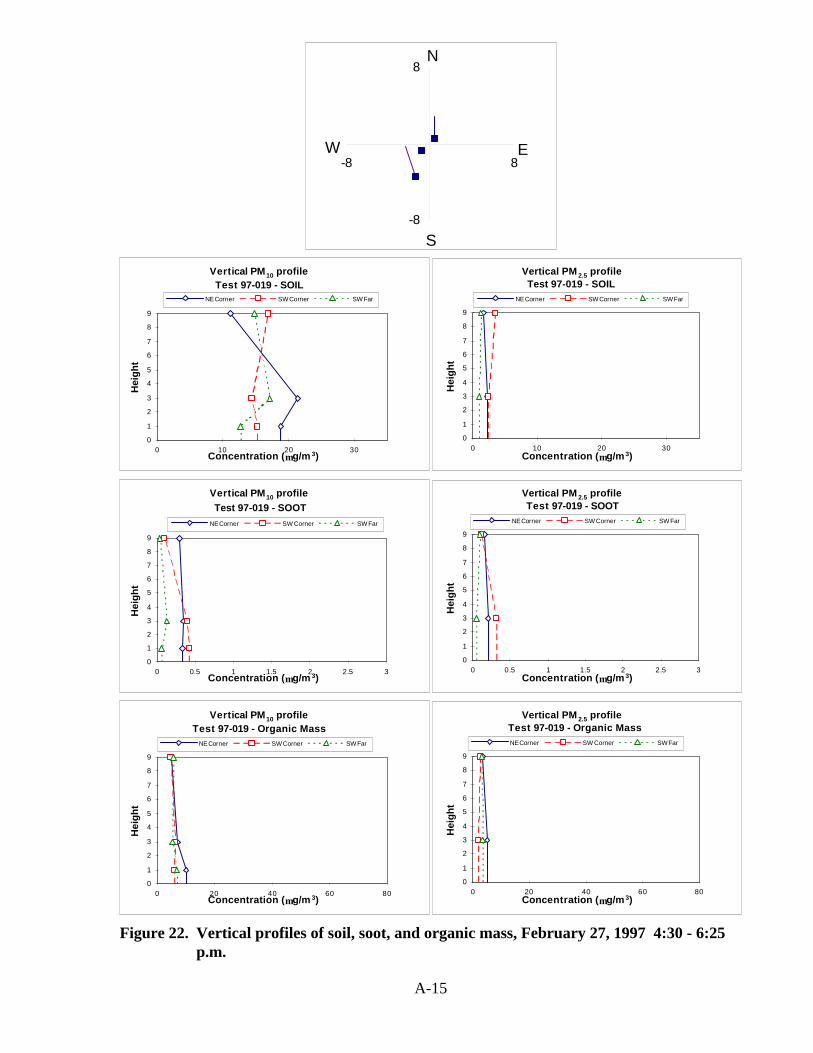
Figure 22. Vertical profiles of soil, soot, and organic mass, February 27, 1997 4:30 - 6:25
p.m.

A-16
-8
8
-8 8
N
E
S
W
Vertical PM10 profile
0
1
2
3
4
5
6
7
8
9
0 50 100 150Concentration (µ g/m 3)
Hei
gh
t
NE Corner SW Corner SW Far
Test 97-020 - MASSVertical PM 2.5 profile
0
1
2
3
4
5
6
7
8
9
0 50 100 150Concentration (µ g/m 3)
Hei
gh
t
NE Corner SW Corner SW Far
Test 97-020 - MASS
Vertical PM10 profile
0
1
2
3
4
5
6
7
8
9
0 20 40 60 80 100Concentration (µ g/m 3)
Hei
gh
t
NE Corner SW Corner SW Far
Test 97-020 - Reconstructed MassVertical PM 2.5 profile
0
1
2
3
4
5
6
7
8
9
0 20 40 60 80 100Concentration (µ g/m3)
Hei
gh
t
NE Corner SW Corner SW Far
Test 97-020 - Reconstructed Mass
Figure 23. Wind vector plot and vertical profiles of mass and reconstructed mass, March 1,
1997 7:05 - 10:05 a.m.

A-17
-8
8
-8 8
N
E
S
W
Vertical PM10 profile
0
1
2
3
4
5
6
7
8
9
0 10 20 30Concentration (µ g/m 3)
Hei
gh
t
NE Corner SW Corner SW Far
Test 97-020 - SOILVertical PM 2.5 profile
0
1
2
3
4
5
6
7
8
9
0 10 20 30Concentration (µ g/m 3)
Hei
gh
t
NE Corner SW Corner SW Far
Test 97-020 - SOIL
Vertical PM10 profile
0
1
2
3
4
5
6
7
8
9
0 0.5 1 1.5 2 2.5 3Concentration (µ g/m 3)
Hei
gh
t
NE Corner SW Corner SW Far
Test 97-020 - SOOTVertical PM 2.5 profile
0
1
2
3
4
5
6
7
8
9
0 0.5 1 1.5 2 2.5 3Concentration (µ g/m 3)
Hei
gh
t
NE Corner SW Corner SW Far
Test 97-020 - SOOT
Vertical PM10 profile
0
1
2
3
4
5
6
7
8
9
0 20 40 60 80Concentration (µ g/m 3)
Hei
gh
t
NE Corner SW Corner SW Far
Test 97-020 - Organic MassVertical PM 2.5 profile
0
1
2
3
4
5
6
7
8
9
0 20 40 60 80Concentration (µ g/m 3)
Hei
gh
t
NE Corner SW Corner SW Far
Test 97-020 - Organic Mass
Figure 24. Vertical profiles of soil, soot, and organic mass, March 1, 1997 7:05 - 10:05 a.m.

A-18
-8
8
-8 8
N
E
S
W
Vertical PM10 profile
0
1
2
3
4
5
6
7
8
9
0 50 100 150Concentration (µ g/m 3)
Hei
gh
t
NE Corner SW Corner SW Far
Test 97-021 - MASSVertical PM 2.5 profile
0
1
2
3
4
5
6
7
8
9
0 50 100 150Concentration (µ g/m 3)
Hei
gh
t
NE Corner SW Corner SW Far
Test 97-021 - MASS
Vertical PM10 profile
0
1
2
3
4
5
6
7
8
9
0 20 40 60 80Concentration (µ g/m 3)
Hei
gh
t
NE Corner SW Corner SW Far
Test 97-021 - Reconstructed MassVertical PM 2.5 profile
0
1
2
3
4
5
6
7
8
9
0 20 40 60 80Concentration (µ g/m 3)
Hei
gh
t
NE Corner SW Corner SW Far
Test 97-021 - Reconstructed Mass
Figure 25. Wind vector plot and vertical profiles of mass and reconstructed mass, March 1,
1997 12:10 - 5:15 p.m.

A-19
-8
8
-8 8
N
E
S
W
Vertical PM10 profile
0
1
2
3
4
5
6
7
8
9
0 10 20 30Concentration (µ g/m 3)
Hei
gh
t
NE Corner SW Corner SW Far
Test 97-021 - SOILVertical PM 2.5 profile
0
1
2
3
4
5
6
7
8
9
0 10 20 30Concentration (µ g/m 3)
Hei
gh
t
NE Corner SW Corner SW Far
Test 97-021 - SOIL
Vertical PM10 profile
0
1
2
3
4
5
6
7
8
9
0 0.5 1 1.5 2 2.5 3Concentration (µ g/m 3)
Hei
gh
t
NE Corner SW Corner SW Far
Test 97-021 - SOOTVertical PM 2.5 profile
0
1
2
3
4
5
6
7
8
9
0 0.5 1 1.5 2 2.5 3Concentration (µ g/m 3)
Hei
gh
t
NE Corner SW Corner SW Far
Test 97-021 - SOOT
Vertical PM10 profile
0
1
2
3
4
5
6
7
8
9
0 20 40 60 80Concentration (µ g/m 3)
Hei
gh
t
NE Corner SW Corner SW Far
Test 97-021 - Organic MassVertical PM 2.5 profile
0
1
2
3
4
5
6
7
8
9
0 20 40 60 80Concentration (µ g/m 3)
Hei
gh
t
NE Corner SW Corner SW Far
Test 97-021 - Organic Mass
Figure 26. Vertical profiles of soil, soot, and organic mass, March 1, 1997 12:10 - 5:15 p.m.

A-20
-8
8
-8 8
N
E
S
W
Vertical PM10 profile
0
1
2
3
4
5
6
7
8
9
0 50 100 150Concentration (µ g/m 3)
Hei
gh
t
NE Corner NE Far SW Far
Test 97-022 - MASSVertical PM 2.5 profile
0
1
2
3
4
5
6
7
8
9
0 50 100 150Concentration (µ g/m 3)
Hei
gh
t
NE Corner NE Far SW Far
Test 97-022 - MASS
Vertical PM10 profile
0
1
2
3
4
5
6
7
8
9
0 20 40 60 80Concentration (µ g/m 3)
Hei
gh
t
NE Corner NE Far SW Far
Test 97-022 - Reconstructed MassVertical PM 2.5 profile
0
1
2
3
4
5
6
7
8
9
0 20 40 60 80Concentration (µ g/m 3)
Hei
gh
t
NE Corner NE Far SW Far
Test 97-022 - Reconstructed Mass
Figure 27. Wind vector plot and vertical profiles of mass and reconstructed mass, March 1,
1997 5:20 - 9:15 p.m.

A-21
-8
8
-8 8
N
E
S
W
Vertical PM10 profile
0
1
2
3
4
5
6
7
8
9
0 10 20 30Concentration (µ g/m 3)
Hei
gh
t
NE Corner NE Far SW Far
Test 97-022 - SOILVertical PM 2.5 profile
0
1
2
3
4
5
6
7
8
9
0 10 20 30Concentration (µ g/m 3)
Hei
gh
t
NE Corner NE Far SW Far
Test 97-022 - SOIL
Vertical PM10 profile
0
1
2
3
4
5
6
7
8
9
0 0.5 1 1.5 2 2.5 3Concentration (µ g/m 3)
Hei
gh
t
NE Corner NE Far SW Far
Test 97-022 - SOOTVertical PM 2.5 profile
0
1
2
3
4
5
6
7
8
9
0 0.5 1 1.5 2 2.5 3Concentration (µ g/m 3)
Hei
gh
t
NE Corner NE Far SW Far
Test 97-022 - SOOT
Vertical PM10 profile
0
1
2
3
4
5
6
7
8
9
0 20 40 60 80Concentration (µ g/m 3)
Hei
gh
t
NE Corner NE Far SW Far
Test 97-022 - Organic MassVertical PM 2.5 profile
0
1
2
3
4
5
6
7
8
9
0 20 40 60 80Concentration (µ g/m 3)
Hei
gh
t
NE Corner NE Far SW Far
Test 97-022 - Organic Mass
Figure 28. Vertical profiles of soil, soot, and organic mass, March 1, 1997 5:20 - 9:15 p.m.
A-22
-8
8
-8 8
N
E
S
W
Vertical PM10 profile
0
1
2
3
4
5
6
7
8
9
0 50 100 150Concentration (µ g/m 3)
Hei
gh
t
NE Corner NE Far SW Far
Test 97-023 - MASSVertical PM 2.5 profile
0
1
2
3
4
5
6
7
8
9
0 50 100 150Concentration (µ g/m 3)
Hei
gh
t
NE Corner NE Far SW Far
Test 97-023 - MASS
Vertical PM10 profile
0
1
2
3
4
5
6
7
8
9
0 20 40 60 80Concentration (µ g/m 3)
Hei
gh
t
NE Corner NE Far SW Far
Test 97-023 - Reconstructed MassVertical PM 2.5 profile
0
1
2
3
4
5
6
7
8
9
0 20 40 60 80Concentration (µ g/m 3)
Hei
gh
t
NE Corner NE Far SW Far
Test 97-023 - Reconstructed Mass
Figure 29. Wind vector plot and vertical profiles of mass and reconstructed mass, March 3,
1997 10:35 a.m. - 1:35 p.m.

A-23
-8
8
-8 8
N
E
S
W
Vertical PM10 profile
0
1
2
3
4
5
6
7
8
9
0 10 20 30Concentration (µ g/m 3)
Hei
gh
t
NE Corner NE Far SW Far
Test 97-023 - SOILVertical PM 2.5 profile
0
1
2
3
4
5
6
7
8
9
0 10 20 30Concentration (µ g/m 3)
Hei
gh
t
NE Corner NE Far SW Far
Test 97-023 - SOIL
Vertical PM10 profile
0
1
2
3
4
5
6
7
8
9
0 0.5 1 1.5 2 2.5 3Concentration (µ g/m 3)
Hei
gh
t
NE Corner NE Far SW Far
Test 97-023 - SOOTVertical PM 2.5 profile
0
1
2
3
4
5
6
7
8
9
0 0.5 1 1.5 2 2.5 3Concentration (µ g/m 3)
Hei
gh
t
NE Corner NE Far SW Far
Test 97-023 - SOOT
Vertical PM10 profile
0
1
2
3
4
5
6
7
8
9
0 20 40 60 80Concentration (µ g/m 3)
Hei
gh
t
NE Corner NE Far SW Far
Test 97-023 - Organic MassVertical PM 2.5 profile
0
1
2
3
4
5
6
7
8
9
0 20 40 60 80Concentration (µ g/m 3)
Hei
gh
t
NE Corner NE Far SW Far
Test 97-023 - Organic Mass
Figure 30. Vertical profiles of soil, soot, and organic mass, March 3, 1997 10:35 a.m. - 1:35
p.m.

A-24
-8
8
-8 8
N
E
S
W
Vertical PM10 profile
0
1
2
3
4
5
6
7
8
9
0 50 100 150Concentration (µ g/m 3)
Hei
gh
t
NE Corner SW Corner SW Far
Test 97-024 - MASSVertical PM 2.5 profile
0
1
2
3
4
5
6
7
8
9
0 50 100 150Concentration (µ g/m 3)
Hei
gh
t
NE Corner SW Corner SW Far
Test 97-024 - MASS
Vertical PM10 profile
0
1
2
3
4
5
6
7
8
9
0 20 40 60 80Concentration (µ g/m 3)
Hei
gh
t
NE Corner SW Corner SW Far
Test 97-024 - Reconstructed MassVertical PM 2.5 profile
0
1
2
3
4
5
6
7
8
9
0 20 40 60 80Concentration (µ g/m 3)
Hei
gh
t
NE Corner SW Corner SW Far
Test 97-024 - Reconstructed Mass
Figure 31. Wind vector plot and vertical profiles of mass and reconstructed mass, March 5,
1997 6:20 - 9:25 a.m.

A-25
-8
8
-8 8
N
E
S
W
Vertical PM10 profile
0
1
2
3
4
5
6
7
8
9
0 10 20 30Concentration (µ g/m 3)
Hei
gh
t
NE Corner SW Corner SW Far
Test 97-024 - SOILVertical PM 2.5 profile
0
1
2
3
4
5
6
7
8
9
0 10 20 30Concentration (µ g/m 3)
Hei
gh
t
NE Corner SW Corner SW Far
Test 97-024 - SOIL
Vertical PM10 profile
0
1
2
3
4
5
6
7
8
9
0 0.5 1 1.5 2 2.5 3Concentration (µ g/m 3)
Hei
gh
t
NE Corner SW Corner SW Far
Test 97-024 - SOOT
Vertical PM 2.5 profile
0
1
2
3
4
5
6
7
8
9
0 0.5 1 1.5 2 2.5 3Concentration (µ g/m 3)
Hei
gh
t
NE Corner SW Corner SW Far
Test 97-024 - SOOT
Vertical PM10 profile
0
1
2
3
4
5
6
7
8
9
0 20 40 60 80Concentration (µ g/m 3)
Hei
gh
t
NE Corner SW Corner SW Far
Test 97-024 - Organic MassVertical PM 2.5 profile
0
1
2
3
4
5
6
7
8
9
0 20 40 60 80Concentration (µ g/m 3)
Hei
gh
t
NE Corner SW Corner SW Far
Test 97-024 - Organic Mass
Figure 32. Vertical profiles of soil, soot, and organic mass, March 5, 1997 6:20 - 9:25 a.m.
A-26
-8
8
-8 8
N
E
S
W
Vertical PM10 profile
0
1
2
3
4
5
6
7
8
9
0 50 100 150Concentration (µ g/m 3)
Hei
gh
t
NE Corner NE Far SW Far
Test 97-025 - MASSVertical PM 2.5 profile
0
1
2
3
4
5
6
7
8
9
0 50 100 150Concentration (µ g/m 3)
Hei
gh
t
NE Corner NE Far SW Far
Test 97-025 - MASS
Vertical PM10 profile
0
1
2
3
4
5
6
7
8
9
0 20 40 60 80 100Concentration (µ g/m 3)
Hei
gh
t
NE Corner NE Far SW Far
Test 97-025 - Reconstructed MassVertical PM 2.5 profile
0
1
2
3
4
5
6
7
8
9
0 20 40 60 80 100Concentration (µ g/m3)
Hei
gh
t
NE Corner NE Far SW Far
Test 97-025 - Reconstructed Mass
Figure 33. Wind vector plot and vertical profiles of mass and reconstructed mass, March 5,
1997 9:30 a.m. - 1:55 p.m.
A-27
-8
8
-8 8
N
E
S
W
Vertical PM10 profile
0
1
2
3
4
5
6
7
8
9
0 10 20 30Concentration (µ g/m 3)
Hei
gh
t
NE Corner NE Far SW Far
Test 97-025 - SOILVertical PM 2.5 profile
0
1
2
3
4
5
6
7
8
9
0 10 20 30Concentration (µ g/m 3)
Hei
gh
t
NE Corner NE Far SW Far
Test 97-025 - SOIL
Vertical PM10 profile
0
1
2
3
4
5
6
7
8
9
0 0.5 1 1.5 2 2.5 3Concentration (µ g/m 3)
Hei
gh
t
NE Corner NE Far SW Far
Test 97-025 - SOOT
Vertical PM 2.5 profile
0
1
2
3
4
5
6
7
8
9
0 0.5 1 1.5 2 2.5 3Concentration (µ g/m 3)
Hei
gh
t
NE Corner NE Far SW Far
Test 97-025 - SOOT
Vertical PM10 profile
0
1
2
3
4
5
6
7
8
9
0 20 40 60 80Concentration (µ g/m 3)
Hei
gh
t
NE Corner NE Far SW Far
Test 97-025 - Organic MassVertical PM 2.5 profile
0
1
2
3
4
5
6
7
8
9
0 20 40 60 80Concentration (µ g/m 3)
Hei
gh
t
NE Corner NE Far SW Far
Test 97-025 - Organic Mass
Figure 34. Vertical profiles of soil, soot, and organic mass, March 5, 1997 9:30 a.m. - 1:55
p.m.
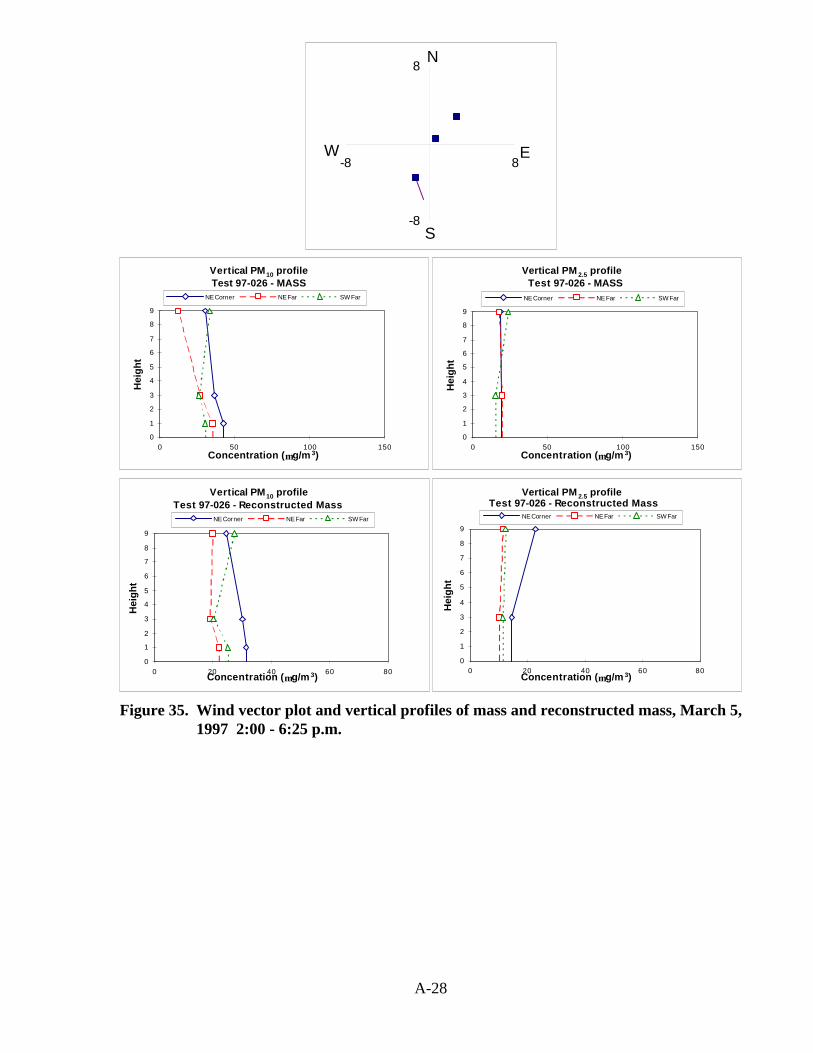
A-28
-8
8
-8 8
N
E
S
W
Vertical PM10 profile
0
1
2
3
4
5
6
7
8
9
0 50 100 150Concentration (µ g/m 3)
Hei
gh
t
NE Corner NE Far SW Far
Test 97-026 - MASSVertical PM 2.5 profile
0
1
2
3
4
5
6
7
8
9
0 50 100 150Concentration (µ g/m 3)
Hei
gh
t
NE Corner NE Far SW Far
Test 97-026 - MASS
Vertical PM10 profile
0
1
2
3
4
5
6
7
8
9
0 20 40 60 80Concentration (µ g/m 3)
Hei
gh
t
NE Corner NE Far SW Far
Test 97-026 - Reconstructed MassVertical PM 2.5 profile
0
1
2
3
4
5
6
7
8
9
0 20 40 60 80Concentration (µ g/m 3)
Hei
gh
t
NE Corner NE Far SW Far
Test 97-026 - Reconstructed Mass
Figure 35. Wind vector plot and vertical profiles of mass and reconstructed mass, March 5,
1997 2:00 - 6:25 p.m.
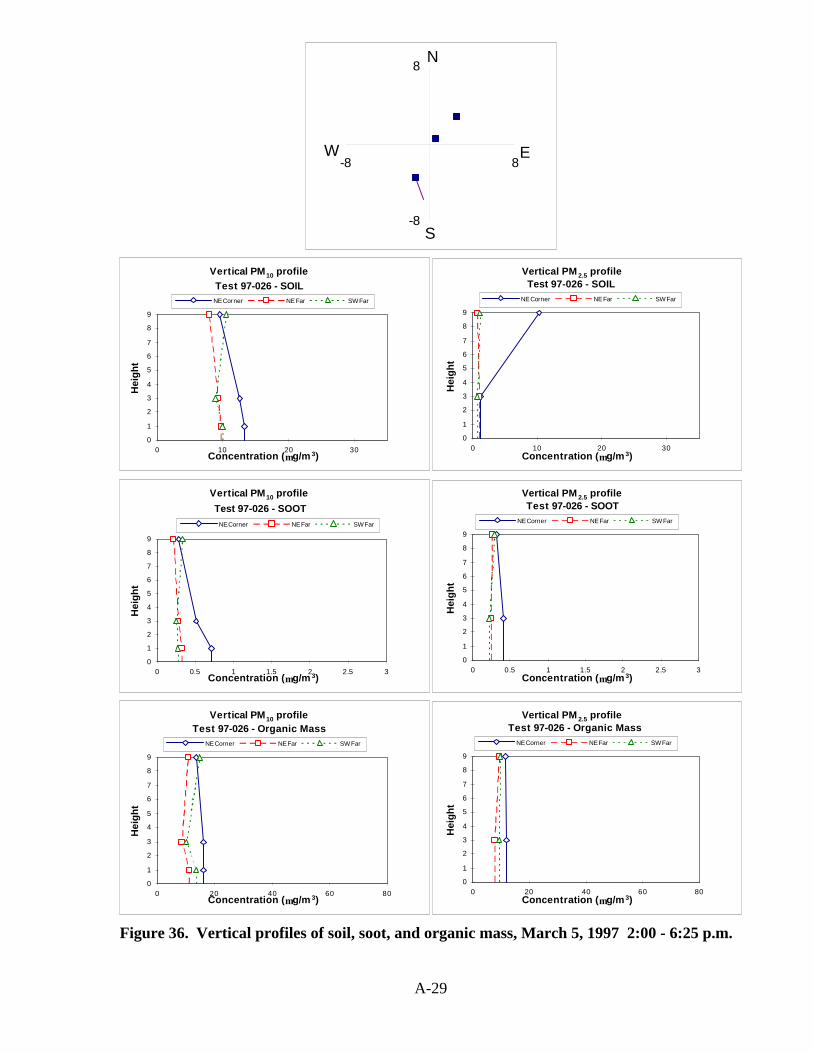
A-29
-8
8
-8 8
N
E
S
W
Vertical PM10 profile
0
1
2
3
4
5
6
7
8
9
0 10 20 30Concentration (µ g/m 3)
Hei
gh
t
NE Corner NE Far SW Far
Test 97-026 - SOILVertical PM 2.5 profile
0
1
2
3
4
5
6
7
8
9
0 10 20 30Concentration (µ g/m 3)
Hei
gh
t
NE Corner NE Far SW Far
Test 97-026 - SOIL
Vertical PM10 profile
0
1
2
3
4
5
6
7
8
9
0 0.5 1 1.5 2 2.5 3Concentration (µ g/m 3)
Hei
gh
t
NE Corner NE Far SW Far
Test 97-026 - SOOT
Vertical PM 2.5 profile
0
1
2
3
4
5
6
7
8
9
0 0.5 1 1.5 2 2.5 3Concentration (µ g/m 3)
Hei
gh
t
NE Corner NE Far SW Far
Test 97-026 - SOOT
Vertical PM10 profile
0
1
2
3
4
5
6
7
8
9
0 20 40 60 80Concentration (µ g/m 3)
Hei
gh
t
NE Corner NE Far SW Far
Test 97-026 - Organic MassVertical PM 2.5 profile
0
1
2
3
4
5
6
7
8
9
0 20 40 60 80Concentration (µ g/m 3)
Hei
gh
t
NE Corner NE Far SW Far
Test 97-026 - Organic Mass
Figure 36. Vertical profiles of soil, soot, and organic mass, March 5, 1997 2:00 - 6:25 p.m.

A-30
-8
8
-8 8
N
E
S
W
Vertical PM10 profile
0
1
2
3
4
5
6
7
8
9
0 50 100 150Concentration (µ g/m 3)
Hei
gh
t
NE Corner SW Corner SW Far
Test 97-027 - MASSVertical PM 2.5 profile
0
1
2
3
4
5
6
7
8
9
0 50 100 150Concentration (µ g/m 3)
Hei
gh
t
NE Corner SW Corner SW Far
Test 97-027 - MASS
Vertical PM10 profile
0
1
2
3
4
5
6
7
8
9
0 20 40 60 80Concentration (µ g/m 3)
Hei
gh
t
NE Corner SW Corner SW Far
Test 97-027 - Reconstructed MassVertical PM 2.5 profile
0
1
2
3
4
5
6
7
8
9
0 20 40 60 80Concentration (µ g/m 3)
Hei
gh
t
NE Corner SW Corner SW Far
Test 97-027 - Reconstructed Mass
Figure 37. Wind vector plot and vertical profiles of mass and reconstructed mass, March 6,
1997 7:40 - 10:00 a.m.

A-31
-8
8
-8 8
N
E
S
W
Vertical PM10 profile
0
1
2
3
4
5
6
7
8
9
0 10 20 30Concentration (µ g/m 3)
Hei
gh
t
NE Corner SW Corner SW Far
Test 97-027 - SOILVertical PM 2.5 profile
0
1
2
3
4
5
6
7
8
9
0 10 20 30Concentration (µ g/m 3)
Hei
gh
t
NE Corner SW Corner SW Far
Test 97-027 - SOIL
Vertical PM10 profile
0
1
2
3
4
5
6
7
8
9
0 0.5 1 1.5 2 2.5 3Concentration (µ g/m 3)
Hei
gh
t
NE Corner SW Corner SW Far
Test 97-027 - SOOTVertical PM 2.5 profile
0
1
2
3
4
5
6
7
8
9
0 0.5 1 1.5 2 2.5 3Concentration (µ g/m 3)
Hei
gh
t
NE Corner SW Corner SW Far
Test 97-027 - SOOT
Vertical PM10 profile
0
1
2
3
4
5
6
7
8
9
0 20 40 60 80Concentration (µ g/m 3)
Hei
gh
t
NE Corner SW Corner SW Far
Test 97-027 - Organic MassVertical PM 2.5 profile
0
1
2
3
4
5
6
7
8
9
0 20 40 60 80Concentration (µ g/m 3)
Hei
gh
t
NE Corner SW Corner SW Far
Test 97-027 - Organic Mass
Figure 38. Vertical profiles of soil, soot, and organic mass, March 6, 1997 7:40 - 10:00 a.m.

A-32
-8
8
-8 8
N
E
S
W
Vertical PM10 profile
0
1
2
3
4
5
6
7
8
9
0 50 100 150Concentration (µ g/m 3)
Hei
gh
t
NE Corner SW Far SE Corner
Test 97-028 - MASSVertical PM 2.5 profile
0
1
2
3
4
5
6
7
8
9
0 50 100 150Concentration (µ g/m 3)
Hei
gh
t
NE Corner SW Far SE Corner
Test 97-028 - MASS
Vertical PM10 profile
0
1
2
3
4
5
6
7
8
9
0 20 40 60 80Concentration (µ g/m 3)
Hei
gh
t
NE Corner SW Far SE Corner
Test 97-028 - Reconstructed MassVertical PM 2.5 profile
0
1
2
3
4
5
6
7
8
9
0 20 40 60 80Concentration (µ g/m 3)
Hei
gh
t
NE Corner SW Far SE Corner
Test 97-028 - Reconstructed Mass
Figure 39. Wind vector plot and vertical profiles of mass and reconstructed mass, March 6,
1997 4:55 - 6:40 p.m.

A-33
-8
8
-8 8
N
E
S
W
Vertical PM10 profile
0
1
2
3
4
5
6
7
8
9
0 10 20 30Concentration (µ g/m 3)
Hei
gh
t
NE Corner SW Far SE Corner
Test 97-028 - SOILVertical PM 2.5 profile
0
1
2
3
4
5
6
7
8
9
0 10 20 30Concentration (µ g/m 3)
Hei
gh
t
NE Corner SW Far SE Corner
Test 97-028 - SOIL
Vertical PM10 profile
0
1
2
3
4
5
6
7
8
9
0 0.5 1 1.5 2 2.5 3Concentration (µ g/m 3)
Hei
gh
t
NE Corner SW Far SE Corner
Test 97-028 - SOOT
Vertical PM 2.5 profile
0
1
2
3
4
5
6
7
8
9
0 0.5 1 1.5 2 2.5 3Concentration (µ g/m 3)
Hei
gh
t
NE Corner SW Far SE Corner
Test 97-028 - SOOT
Vertical PM10 profile
0
1
2
3
4
5
6
7
8
9
0 20 40 60 80Concentration (µ g/m 3)
Hei
gh
t
NE Corner SW Far SE Corner
Test 97-028 - Organic MassVertical PM 2.5 profile
0
1
2
3
4
5
6
7
8
9
0 20 40 60 80Concentration (µ g/m 3)
Hei
gh
t
NE Corner SW Far SE Corner
Test 97-028 - Organic Mass
Figure 40. Vertical profiles of soil, soot, and organic mass, March 6, 1997 4:55 - 6:40 p.m.

A-34
-8
8
-8 8
N
E
S
W
Vertical PM10 profile
0
1
2
3
4
5
6
7
8
9
0 50 100 150Concentration (µ g/m 3)
Hei
gh
t
NE Corner SW Far SE Corner
Test 97-029 - MASSVertical PM 2.5 profile
0
1
2
3
4
5
6
7
8
9
0 50 100 150Concentration (µ g/m 3)
Hei
gh
t
NE Corner SW Far SE Corner
Test 97-029 - MASS
Vertical PM10 profile
0
1
2
3
4
5
6
7
8
9
0 20 40 60 80 100Concentration (µ g/m 3)
Hei
gh
t
NE Corner SW Far SE Corner
Test 97-029 - Reconstructed MassVertical PM 2.5 profile
0
1
2
3
4
5
6
7
8
9
0 20 40 60 80 100Concentration (µ g/m 3)
Hei
gh
t
NE Corner SW Far SE Corner
Test 97-029 - Reconstructed Mass
Figure 41. Wind vector plot and vertical profiles of mass and reconstructed mass, March 6,
1997 6:45 - 11:15 p.m.
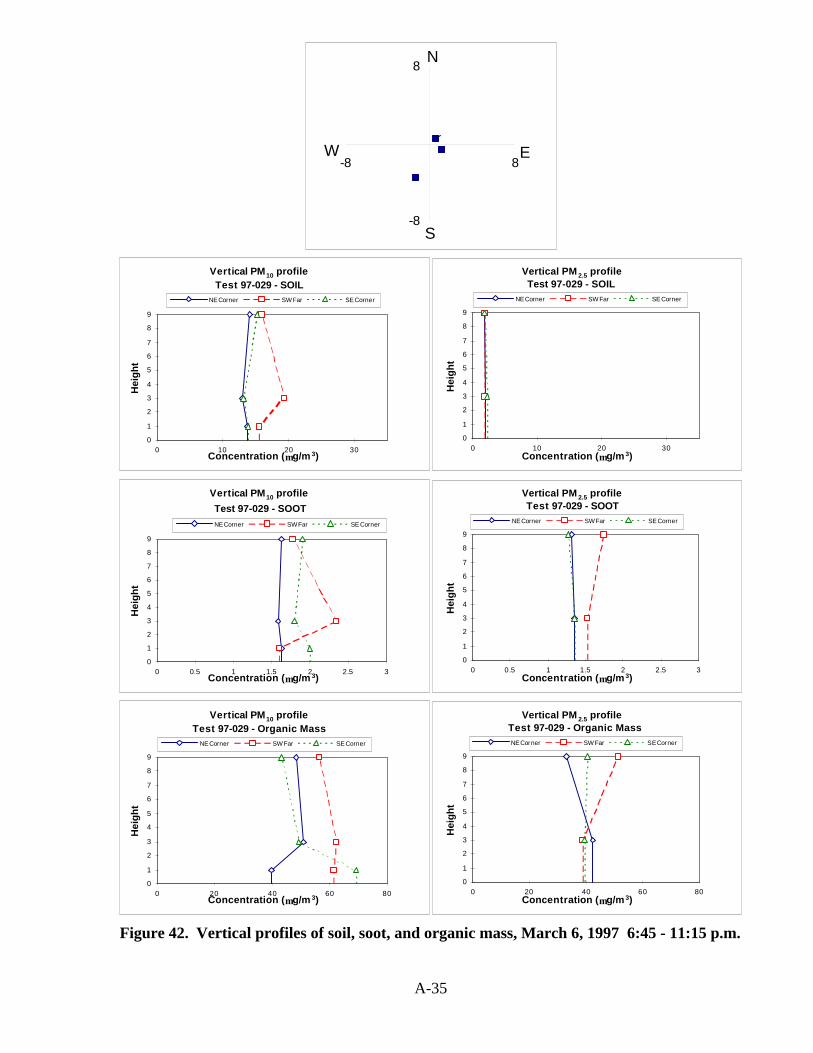
A-35
-8
8
-8 8
N
E
S
W
Vertical PM10 profile
0
1
2
3
4
5
6
7
8
9
0 10 20 30Concentration (µ g/m 3)
Hei
gh
t
NE Corner SW Far SE Corner
Test 97-029 - SOILVertical PM 2.5 profile
0
1
2
3
4
5
6
7
8
9
0 10 20 30Concentration (µ g/m 3)
Hei
gh
t
NE Corner SW Far SE Corner
Test 97-029 - SOIL
Vertical PM10 profile
0
1
2
3
4
5
6
7
8
9
0 0.5 1 1.5 2 2.5 3Concentration (µ g/m 3)
Hei
gh
t
NE Corner SW Far SE Corner
Test 97-029 - SOOT
Vertical PM 2.5 profile
0
1
2
3
4
5
6
7
8
9
0 0.5 1 1.5 2 2.5 3Concentration (µ g/m 3)
Hei
gh
t
NE Corner SW Far SE Corner
Test 97-029 - SOOT
Vertical PM10 profile
0
1
2
3
4
5
6
7
8
9
0 20 40 60 80Concentration (µ g/m 3)
Hei
gh
t
NE Corner SW Far SE Corner
Test 97-029 - Organic MassVertical PM 2.5 profile
0
1
2
3
4
5
6
7
8
9
0 20 40 60 80Concentration (µ g/m 3)
Hei
gh
t
NE Corner SW Far SE Corner
Test 97-029 - Organic Mass
Figure 42. Vertical profiles of soil, soot, and organic mass, March 6, 1997 6:45 - 11:15 p.m.

A-36
-8
8
-8 8
N
EW
Vertical PM10 profile
0
1
2
3
4
5
6
7
8
9
0 50 100 150Concentration (µ g/m 3)
Hei
gh
t
NE Corner SW Far SE Corner
Test 97-030 - MASSVertical PM 2.5 profile
0
1
2
3
4
5
6
7
8
9
0 50 100 150Concentration (µ g/m 3)
Hei
gh
t
NE Corner SW Far SE Corner
Test 97-030 - MASS
Vertical PM10 profile
0
1
2
3
4
5
6
7
8
9
0 20 40 60 80Concentration (µ g/m 3)
Hei
gh
t
NE Corner SW Far SE Corner
Test 97-030 - Reconstructed MassVertical PM 2.5 profile
0
1
2
3
4
5
6
7
8
9
0 20 40 60 80Concentration (µ g/m 3)
Hei
gh
t
NE Corner SW Far SE Corner
Test 97-030 - Reconstructed Mass
Figure 43. Wind vector plot and vertical profiles of mass and reconstructed mass, March 6,
1997 11:20 p.m. - March 7, 1997 4:00 a.m.
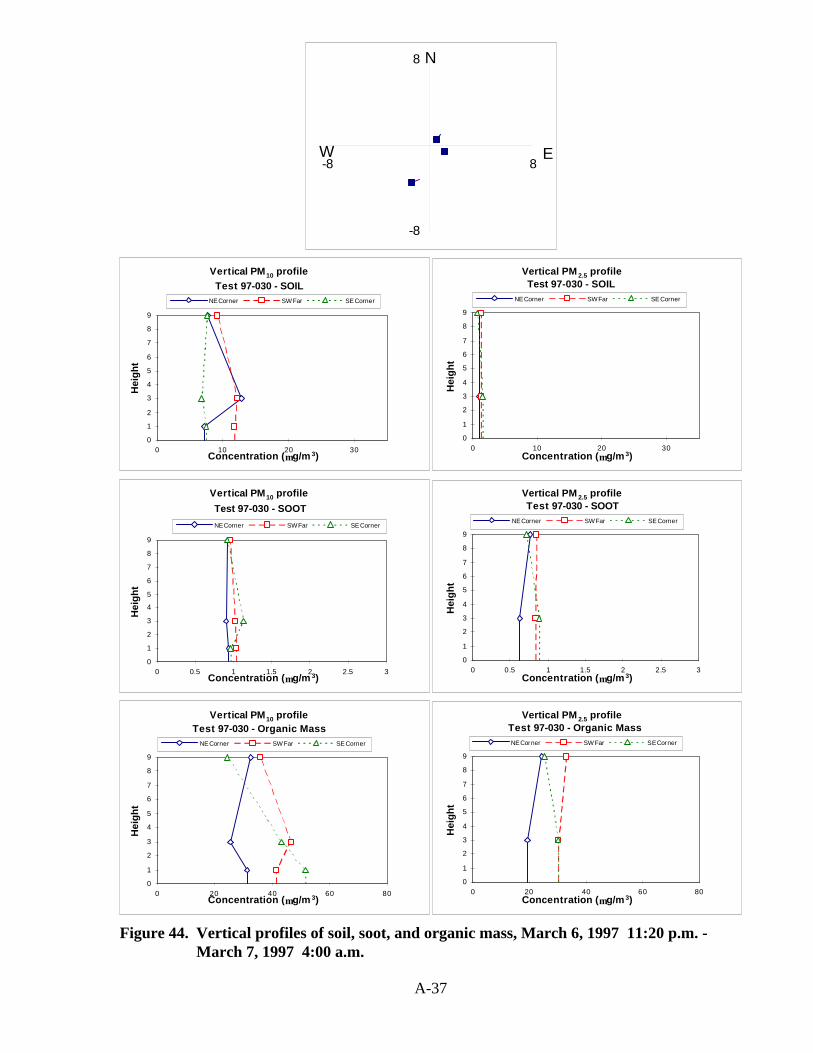
A-37
-8
8
-8 8
N
EW
Vertical PM10 profile
0
1
2
3
4
5
6
7
8
9
0 10 20 30Concentration (µ g/m 3)
Hei
gh
t
NE Corner SW Far SE Corner
Test 97-030 - SOILVertical PM 2.5 profile
0
1
2
3
4
5
6
7
8
9
0 10 20 30Concentration (µ g/m 3)
Hei
gh
t
NE Corner SW Far SE Corner
Test 97-030 - SOIL
Vertical PM10 profile
0
1
2
3
4
5
6
7
8
9
0 0.5 1 1.5 2 2.5 3Concentration (µ g/m 3)
Hei
gh
t
NE Corner SW Far SE Corner
Test 97-030 - SOOT
Vertical PM 2.5 profile
0
1
2
3
4
5
6
7
8
9
0 0.5 1 1.5 2 2.5 3Concentration (µ g/m 3)
Hei
gh
t
NE Corner SW Far SE Corner
Test 97-030 - SOOT
Vertical PM10 profile
0
1
2
3
4
5
6
7
8
9
0 20 40 60 80Concentration (µ g/m 3)
Hei
gh
t
NE Corner SW Far SE Corner
Test 97-030 - Organic MassVertical PM 2.5 profile
0
1
2
3
4
5
6
7
8
9
0 20 40 60 80Concentration (µ g/m 3)
Hei
gh
t
NE Corner SW Far SE Corner
Test 97-030 - Organic Mass
Figure 44. Vertical profiles of soil, soot, and organic mass, March 6, 1997 11:20 p.m. -
March 7, 1997 4:00 a.m.
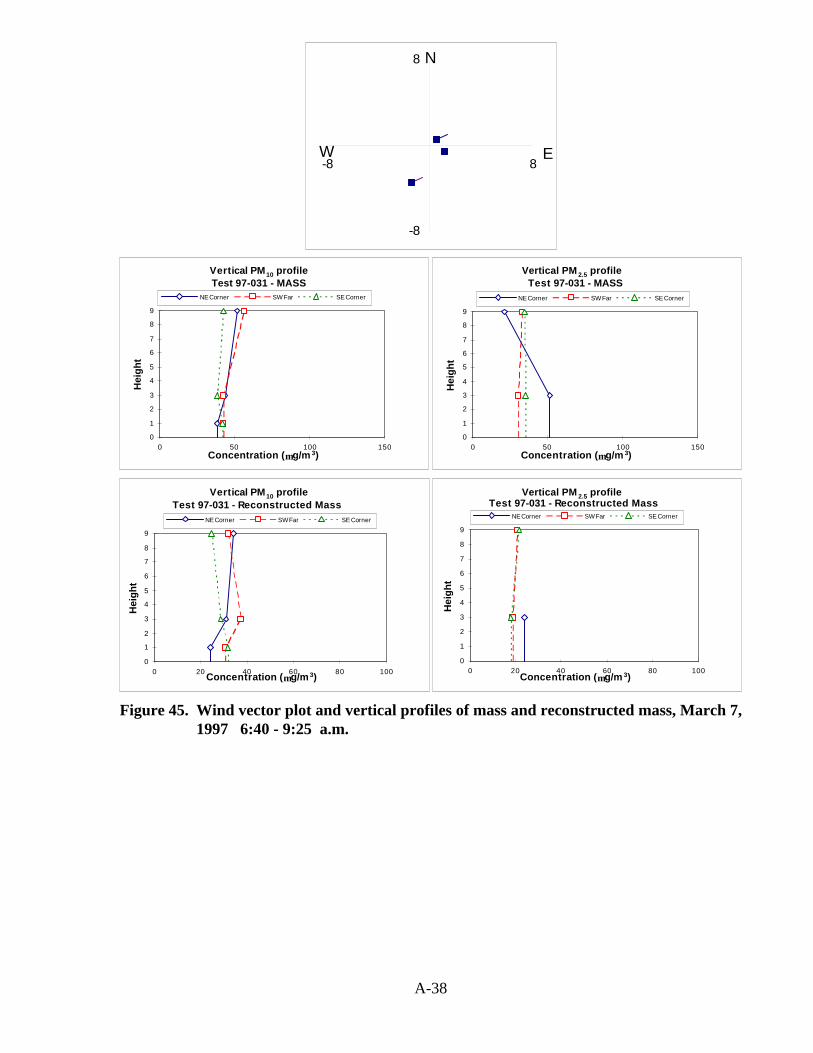
A-38
-8
8
-8 8
N
EW
Vertical PM10 profile
0
1
2
3
4
5
6
7
8
9
0 50 100 150Concentration (µ g/m 3)
Hei
gh
t
NE Corner SW Far SE Corner
Test 97-031 - MASSVertical PM 2.5 profile
0
1
2
3
4
5
6
7
8
9
0 50 100 150Concentration (µ g/m 3)
Hei
gh
t
NE Corner SW Far SE Corner
Test 97-031 - MASS
Vertical PM10 profile
0
1
2
3
4
5
6
7
8
9
0 20 40 60 80 100Concentration (µ g/m 3)
Hei
gh
t
NE Corner SW Far SE Corner
Test 97-031 - Reconstructed MassVertical PM 2.5 profile
0
1
2
3
4
5
6
7
8
9
0 20 40 60 80 100Concentration (µ g/m 3)
Hei
gh
t
NE Corner SW Far SE Corner
Test 97-031 - Reconstructed Mass
Figure 45. Wind vector plot and vertical profiles of mass and reconstructed mass, March 7,
1997 6:40 - 9:25 a.m.

A-39
-8
8
-8 8
N
EW
Vertical PM10 profile
0
1
2
3
4
5
6
7
8
9
0 10 20 30Concentration (µ g/m 3)
Hei
gh
t
NE Corner SW Far SE Corner
Test 97-031 - SOILVertical PM 2.5 profile
0
1
2
3
4
5
6
7
8
9
0 10 20 30Concentration (µ g/m 3)
Hei
gh
t
NE Corner SW Far SE Corner
Test 97-031 - SOIL
Vertical PM10 profile
0
1
2
3
4
5
6
7
8
9
0 0.5 1 1.5 2 2.5 3Concentration (µ g/m 3)
Hei
gh
t
NE Corner SW Far SE Corner
Test 97-031 - SOOT
Vertical PM 2.5 profile
0
1
2
3
4
5
6
7
8
9
0 0.5 1 1.5 2 2.5 3Concentration (µ g/m 3)
Hei
gh
t
NE Corner SW Far SE Corner
Test 97-031 - SOOT
Vertical PM10 profile
0
1
2
3
4
5
6
7
8
9
0 20 40 60 80Concentration (µ g/m 3)
Hei
gh
t
NE Corner SW Far SE Corner
Test 97-031 - Organic MassVertical PM 2.5 profile
0
1
2
3
4
5
6
7
8
9
0 20 40 60 80Concentration (µ g/m 3)
Hei
gh
t
NE Corner SW Far SE Corner
Test 97-031 - Organic Mass
Figure 46. Vertical profiles of soil, soot, and organic mass, March 7, 1997 6:40 - 9:25 a.m.