Final Report, Jan-Dec 2013 Completed by KT Tobin, David ... · PDF fileCompleted by KT Tobin,...
10
Final Report, Jan-Dec 2013 Completed by KT Tobin, David Richardson Accomplishments and Activities: We accomplished objectives in four different areas from the 2013 HREP/WRI funding to SUNY New Paltz: Section 1: Campus planning and green infrastructure (GI) construction, Section 2: Water quality monitoring, Section 3: Mapping and walking tour outreach, and Section 4: Curriculum development and infusion. We have also presented this material and have received media coverage – this is highlighted in section 5 below. We finally present plans for 2014 in section 6 below. Section 1: Campus planning and green infrastructure Multiple Green Infrastructure (GI) practices have been completed as a result of this funding or in conjunction with this funding both on the SUNY New Paltz and Village of New Paltz. The permeable (porous) parking lot addition to the Route 32 campus parking lot is complete and open to parking (Fig. X). The Lenape Bioswales are also complete and draw water from the parking lots surrounding Lenape halls. The Crispell bioretention raingardens enhancement plantings were ordered and installed with some of the extra plants serving critical spots across campus. The stream daylighting project in Peace Park in the Village of New Paltz has been completed (Fig. 1). Several other projects were not funded under this project but will contribute to the overall GI list on campus including a rain harvesting system that was installed as part of the Wooster Science building renovation. Further, there is a proposed rain water harvesting project for the LeFerve Hall dorm renovation. Finally, we used this project as leverage in a NWIEPICC application, and were funded $20K to construct a north campus stormwater management plan with an emphasis on GI practices Section 2: Water quality monitoring Fig. 1. Green Infrastructure projects at SUNY New Paltz (pervious parking lot on left) and in the Village of New Paltz (stream daylighting on right). 1
Transcript of Final Report, Jan-Dec 2013 Completed by KT Tobin, David ... · PDF fileCompleted by KT Tobin,...

Final Report, Jan-Dec 2013 Completed by KT Tobin, David Richardson
Accomplishments and Activities: We accomplished objectives in four different areas from the 2013 HREP/WRI funding to SUNY New Paltz: Section 1: Campus planning and green infrastructure (GI) construction, Section 2: Water quality monitoring, Section 3: Mapping and walking tour outreach, and Section 4: Curriculum development and infusion. We have also presented this material and have received media coverage – this is highlighted in section 5 below. We finally present plans for 2014 in section 6 below. Section 1: Campus planning and green infrastructure Multiple Green Infrastructure (GI) practices have been completed as a result of this funding or in conjunction with this funding both on the SUNY New Paltz and Village of New Paltz. The permeable (porous) parking lot addition to the Route 32 campus parking lot is complete and open to parking (Fig. X). The Lenape Bioswales are also complete and draw water from the parking lots surrounding Lenape halls. The Crispell bioretention raingardens enhancement plantings were ordered and installed with some of the extra plants serving critical spots across campus. The stream daylighting project in Peace Park in the Village of New Paltz has been completed (Fig. 1). Several other projects were not funded under this project but will contribute to the overall GI list on campus including a rain harvesting system that was installed as part of the Wooster Science building renovation. Further, there is a proposed rain water harvesting project for the LeFerve Hall dorm renovation. Finally, we used this project as leverage in a NWIEPICC application, and were funded $20K to construct a north campus stormwater management plan with an emphasis on GI practices
Section 2: Water quality monitoring
Fig. 1. Green Infrastructure projects at SUNY New Paltz (pervious parking lot on left) and in the Village of New Paltz (stream daylighting on right).
1

This past summer 2013, Drs. Richardson ( Biology) and Chowdhury (Geology) mentored five students: Alex LeTourneau – Computer Science (Buoy), Caitlyn Maceli – EGS (Biology/Chemistry sampling), Alison Uhrlass – Geology (Mapping), Bill O’Connell (Precipitation/Hydrology), Kevin Kolvenbach – EGS (support). The students worked June and July and presented their results from the summer for their faculty mentors and kt tobin-flusser. Alex and Caitlyn continued working on their respectively pieces fall 2013 as independent study students for credit under Dr. Richardson’s supervision. Accomplishments Caitlyn longitudinally sampled the ponds on campus from the upstream most pond to the spillway on a weekly to biweekly basis. She analyzed biological, physical, and chemical metrics including temperature, pH, conductivity, chlorophyll, total suspended solids, and fecal coliform bacteria. Caitlyn is also processing samples from this summer for heavy metals this semester in her analytical chemistry course. Caitlyn found that the four inlet pipes that feed the pond system have conductivity that varies over an order of magnitude and likely comes from different storm water drain and surface water sources. She also found high densities of fecal coliform bacteria, especially after storms (Fig. 2). Alex launched the Environmental Monitoring Buoy (Fig. 3). The buoy had to be assembled and calibrated and now, every 15 minutes, data is transmitted via cell phone signal, to a server and is posted to the web for anyone to see. The buoy monitors pH, temperature, conductivity, dissolved oxygen, and turbidity. Alex found some interesting patterns of dissolved oxygen dynamics related to the application of algaecide to the campus pond and diel cycles of oxygen due to primary production and photosynthesis (Fig. 4).
Fig. 3. Dr. Richardson and students Alex LeTourneau and Bill O’Connell install the water quality monitoring buoy early summer 2013.
0250500750
1000125015001750200022502500
Colif
orm
Den
sity
(C
olon
ies/
mL)
Fig. 2. Total coliform density in the Gunk outflow.
2

Alison worked on developing two maps this summer. First, she developed a watershed map of Saw Mill Brook including the campus portion of the upper watershed. Surprisingly, the majority of the upper watershed is not the campus, as we had surmised but the development on the other side of Rt 32. Second, she worked on a map of the bathymetry of the pond system using systematic measurements of water depth while kayaking. Bill deployed several environmental sensors to measure the hydrologic flow from the spillway and a tipping bucket precipitation gauge near the South Classroom building. Bill installed a pressure transducer at the outflow of the large pond and completed weekly manual measurements of discharge. Storm sampling was completed with hourly collection during and following large rain events using ISCO samplers, we did not experience the intense storms like 2011 & 2012, but we did have some heavy rains, especially a significant storm in late June. Section 3: Mapping and walking tour Prof. kt Tobin, Prof. David Richardson, and undergraduate research student, Caitlyn Maceli, have all led guided tours of our GI and water quality monitoring projects. Tour attendees include Vassar College professors and students, classes from campus (Sociology, Art, and Biology departments), campus administrators, members of the NY Rising committee, and others. We have compiled all the existing and planned practices for the walking tour and include the water bodies, GI sites (rain gardens, bioswales, pervious parking lot, stream daylighting), and new building constructions. Josh Simons, CRREO, along with student interns, has led mapping efforts to create campus base maps with multiple layers of related to green infrastructure and campus function as a whole including walking paths, water bodies, our GI sites, trees, and the master facilities plan. We have content and are in the design phase of the educational and interpretive signage, led by Lisa Mitten, our campus sustainability coordinator. Section 4: Curriculum development and infusion In Fall 2013, we recruited faculty from across multiple discplines at SUNY New Paltz (see table below) representing every school – Fine & Performing Arts, Education, Liberal Arts & Sciences, Business, Science & Engineering. For the cross-course collaboration, the general topic of water, water use, and
Fig. 4. Dissolved Oxygen concentrations in the “Gunk” throughout 2013.
3

green infrastructure was woven into each course with at least in one project/lab/paper assigned based on this project. The projects are described in more detail below. At the end of the semester, December 11, 2013, we held a large poster session and symposium to present student projects, discuss the GI projects, and have a panel discussion of the cross curricular enhancement. The student poster session included posters from all the below courses. Some of the major results from the student work, as highlighted in this article: http://oracle.newpaltz.edu/students-soak-up-science/ were sociological surveys of students at this campus and administrators across different campuses, field experiments that determined the infiltration rates across different campuses, and connecting students to local ecology. Please see one example student poster attached as Appendix 1. This event was well-attended and included ~50 student posters and a panel discussion with Emily Vail (DEC and HREP), KT Tobin, David Richardson, Brian Obach, Eric Keeling, and others all presenting.
Major Faculty Course Art Matthew Friday Graduate Art Seminar
Biology David Richardson & Eric Keeling Ecology
Business Pom Jiraporn Consumer Behavior
Education Ro Millham
Middle School Science Enrichment Program + Teaching Science in Secondary Schools
Environmental Geochemical Sciences Meghan Ferguson Environmental Geochemical Science Sociology Brian Obach Environmental Sociology Sociology kt tobin Research Methods
In Matthew Friday’s Graduate Art seminar class, the focus was on the question of how humans relate to regional watersheds (additional collaborators include: Clearwater, the Poughkeepsie High School, SPURSE LLC and the Children's Media Laboratory). The class began with a series of lectures on political ecology, new urbanism and ecological art that included readings such as Ivan Illich's H20 and the Waters of Forgetfulness, The Hudson River Primer by David Strayer and Water: A Natural History by Alice Outwater. Students developing a series of maps and physical projects that directly address water quality issues and sharing these during the “A Day in The Life of The Hudson River” on October 10th. Brian Obach’s Environmental Sociology class read Postel’s “Water: Adapting to a New Normal” from The Post Carbon Reader. They have taken a campus tour focusing on the green infrastructure projects and visited the Village of New Paltz wastewater treatment plant. Lisa Mitten, Campus Sustainability Coordinator will be a guest speaker about what our campus is doing about water conservation, and the class will conduct a project related to what campuses can do about water related issues. Tobin’s Research Methods class has integrated varied articles on water-related social research (e.g. Marshall and Jones – Citizen Participation in Natural Resource Management, Sadalla et al – Priorities in Residential Water Use). They have taken the campus walking tour, and also met with Lisa Mitten.
4

Students developed a research project about SUNY New Paltz students’ awareness, attitudes, and behaviors related to water issues on campus. In Pom Jiraporn’s Consumer Behavior class, one assignment was a sustainability campaign targeted towards college students. One group focused on a promotional campaign with key messages about water conservation. Students used theories in the consumer behavior course to justify their campaigns. Rosemary Millham’s Science Enrichment Middle School students played the water usage game and the green stormwater practices lesson from her MS curriculum (see below). In her Teaching Science
Secondary Ed class, students were taken into the field to discuss green infrastructures and take notes during a campus walk. After discussion and the purpose for green infrastructures were identified by the students), they created a lesson plan to teach a lesson about water resources, climate change, and how we can mitigate flooding. Several of her students were at the "Day in the Life of the Hudson" event with Millham testing the waters. In Richardson, Ferguson, and Keeling’s Ecology and Environmental Geochemical Science courses, students spent one lab examining the pathways of water flowing through campus and the effect of development on water quality and quantity. They mapped the different land use/land cover on campus based on different criteria and did an experiment to determine the infiltration rates of storm events to recharge groundwater. The students focused on the new pervious surface Route 32 parking lot.
Rosemary Millham (Elementary Ed) has prepared a draft curriculum for K-12 classroom use of the campus as an location to visit, tour the GI, and complete associated lesson plans. She has completed 9 lessons for K-12 teachers to choose from including “Watch Your Storm Drain!!!,” “How Much Water Do You Use?,” and others. Please see the draft attached. Section 5: Presentations and Media coverage The following is a list of presentations, conferences, and other events that have stemmed from this project.
o Tobin presented at the “Green Infrastructure for Water Quality and Neighborhood Revitalization” conference at SUNY Orange on May 28, 2013
o John McEnrue presented on SUNY New Paltz’s Green Infrastructure at the Vassar College Green Campus Infrastructure conference on May 28, 2013
o Tobin & John McEnrue presented on SUNY New Paltz’s Green Infrastructure to a visiting contingent of Chinese government officials on July 8, 2013
Fig. 5. Students in Ecology class working in measuring infiltration rates into compacted soils.
5

o Tobin will present the project with Emily Vail/DEC at the annual meeting of the Environmental Consortium of Colleges and Universities on Nov 9. See http://www.environmentalconsortium.org/news/annualmeet.html
o Tobin presented the project on Nov 11th at the Mohonk Consultations & Hudson River Watershed Alliance conference “A Watershed Moment: Changing Climate & the Future of Our Water Resources” See http://hosted-p0.vresp.com/1035369/c711f5a99e
o Water Symposium Dec 11th 2:00-4:40 LC 100 presentations from multiple professors and students
o Richardson and students put up posters for Watershed Roundtable at SUNY New Paltz on Mar. 28.
o Abstracts have been submitted to the Hudson River Symposium, SUNY New Paltz Student Research Symposium, and Joint Aquatic Sciences Meeting (national conference in Portland, Oregon in May 2014).
Outreach o We have included photos and information on our CRREO Facebook page and SUNY New
Paltz website Emily Vail from DEC did some historical research about the SawKill at our local library, as did
Dave R’s students, we now have a portfolio of photos and maps to be included in the final report Inclusion in the recently released NYSERDA funded Mid-Hudson Regional Sustainability Plan
(page 8-21) Media coverage of the project:
o http://oracle.newpaltz.edu/floating-along-the-live-stream/ o http://www.fondriest.com/news/monitoring-the-gunk-buoy-tracks-new-paltz-campus-
pond-water-quality.htm o http://oracle.newpaaltz.edu/students-soak-up-science/
Section 6: 2014 plans Tobin and Richardson are interested in publishing in journals focused on pedagogy, e.g. Teaching Sociology; and articles about engaging the public and other stakeholders see Dave’s article here as an example: http://faculty.newpaltz.edu/davidrichardson/files/Pace2010-Frontiers-CommunicatingScienceWiththePublicIndividuals.pdf 2014 water quality monitoring/outreach goals In 2014, we have four major objectives for the SUNY New Paltz Green Infrastructure project:
First, watershed level monitoring of the upper Saw Mill Brook watershed. Real-time pond
monitoring: Last summer, 2013, we established a water quality monitoring buoy that was installed in the large pond (the “Gunk” on campus). This water quality monitoring buoy measures parameters like pH, dissolved oxygen, temperature, turbidity, and conductivity, every ten minutes and transmits that data real-time to the web (http://buoy.newpaltz.edu).This buoy will be reinstalled in the spring and be left in the Gunk until the late fall to examine the effects of storms and inter-storm periods on the temporal variability of water quality. Point and non-point source water quality and quantity monitoring: We have been evaluating the on-campus contribution to water quality impairments due to point and non-point sources from suburban (campus) runoff. Caitlyn Maceli, a summer research undergraduate student, focused on the water quality throughout the Saw Mill Brook watershed with a focus on the campus
6

ponds. We plan to continue these measurements starting the spring and examining a wide range of metrics including pH, temperature, conductivity, heavy metals, anions and cations, nutrients, chlorophyll, total suspended solids, and fecal coliform contamination. We plan to continue monitoring water quantity by evaluating the inputs to campus (precipitation gauge, and hydrology at the inflow points) and the outputs from campus (stream flow measurements). Website updates: We will continue to update the buoy website with the watershed maps, maps of green infrastructure projects, links to the documentary and infographics (see below), and old aerial photographs indicating the changes of the Gunk over time. We will evaluation of individual green infrastructure (GI) projects for effectiveness of treating stormwater.
We will map storm drainage basins including infrastructure modifications. We will work in
collaboration with CRREO to develop layers for campus maps including watershed delineations and overlaying historical aerial images of campus. We will try to recruit students for independent assignments during the fall and subsequent semesters to help map the campus storm drainage system in conjunction with facilities.
We will contribute to education and outreach on campus including developing signage for the GI walking tour, creating a documentary, and continuing to run campus tours. Lisa Mitten, the campus sustainability coordinator, will lead these efforts to establish signage around campus on the walking tour. We will hire undergraduates in the summer and continue working with them during the fall to create a short documentary highlighting the project and creating infographics that can be used on websites or posters. Personnel listed on this proposal including Caitlyn Maceli, one undergraduate for this project, have led guided tours of our GI and water quality monitoring projects. We will continue these tours as outreach to campus and community members about the GI on campus and what is being done.
7

Appendices Appendix 1. Madeline Fisher, student poster from Fall 2013 Ecology lab. Appendix 2. Caitlyn Maceli, student poster from water quality monitoring research. Appendix 3. Rosemary Millhelm prepared K-12 curriculum (DRAFT).
8
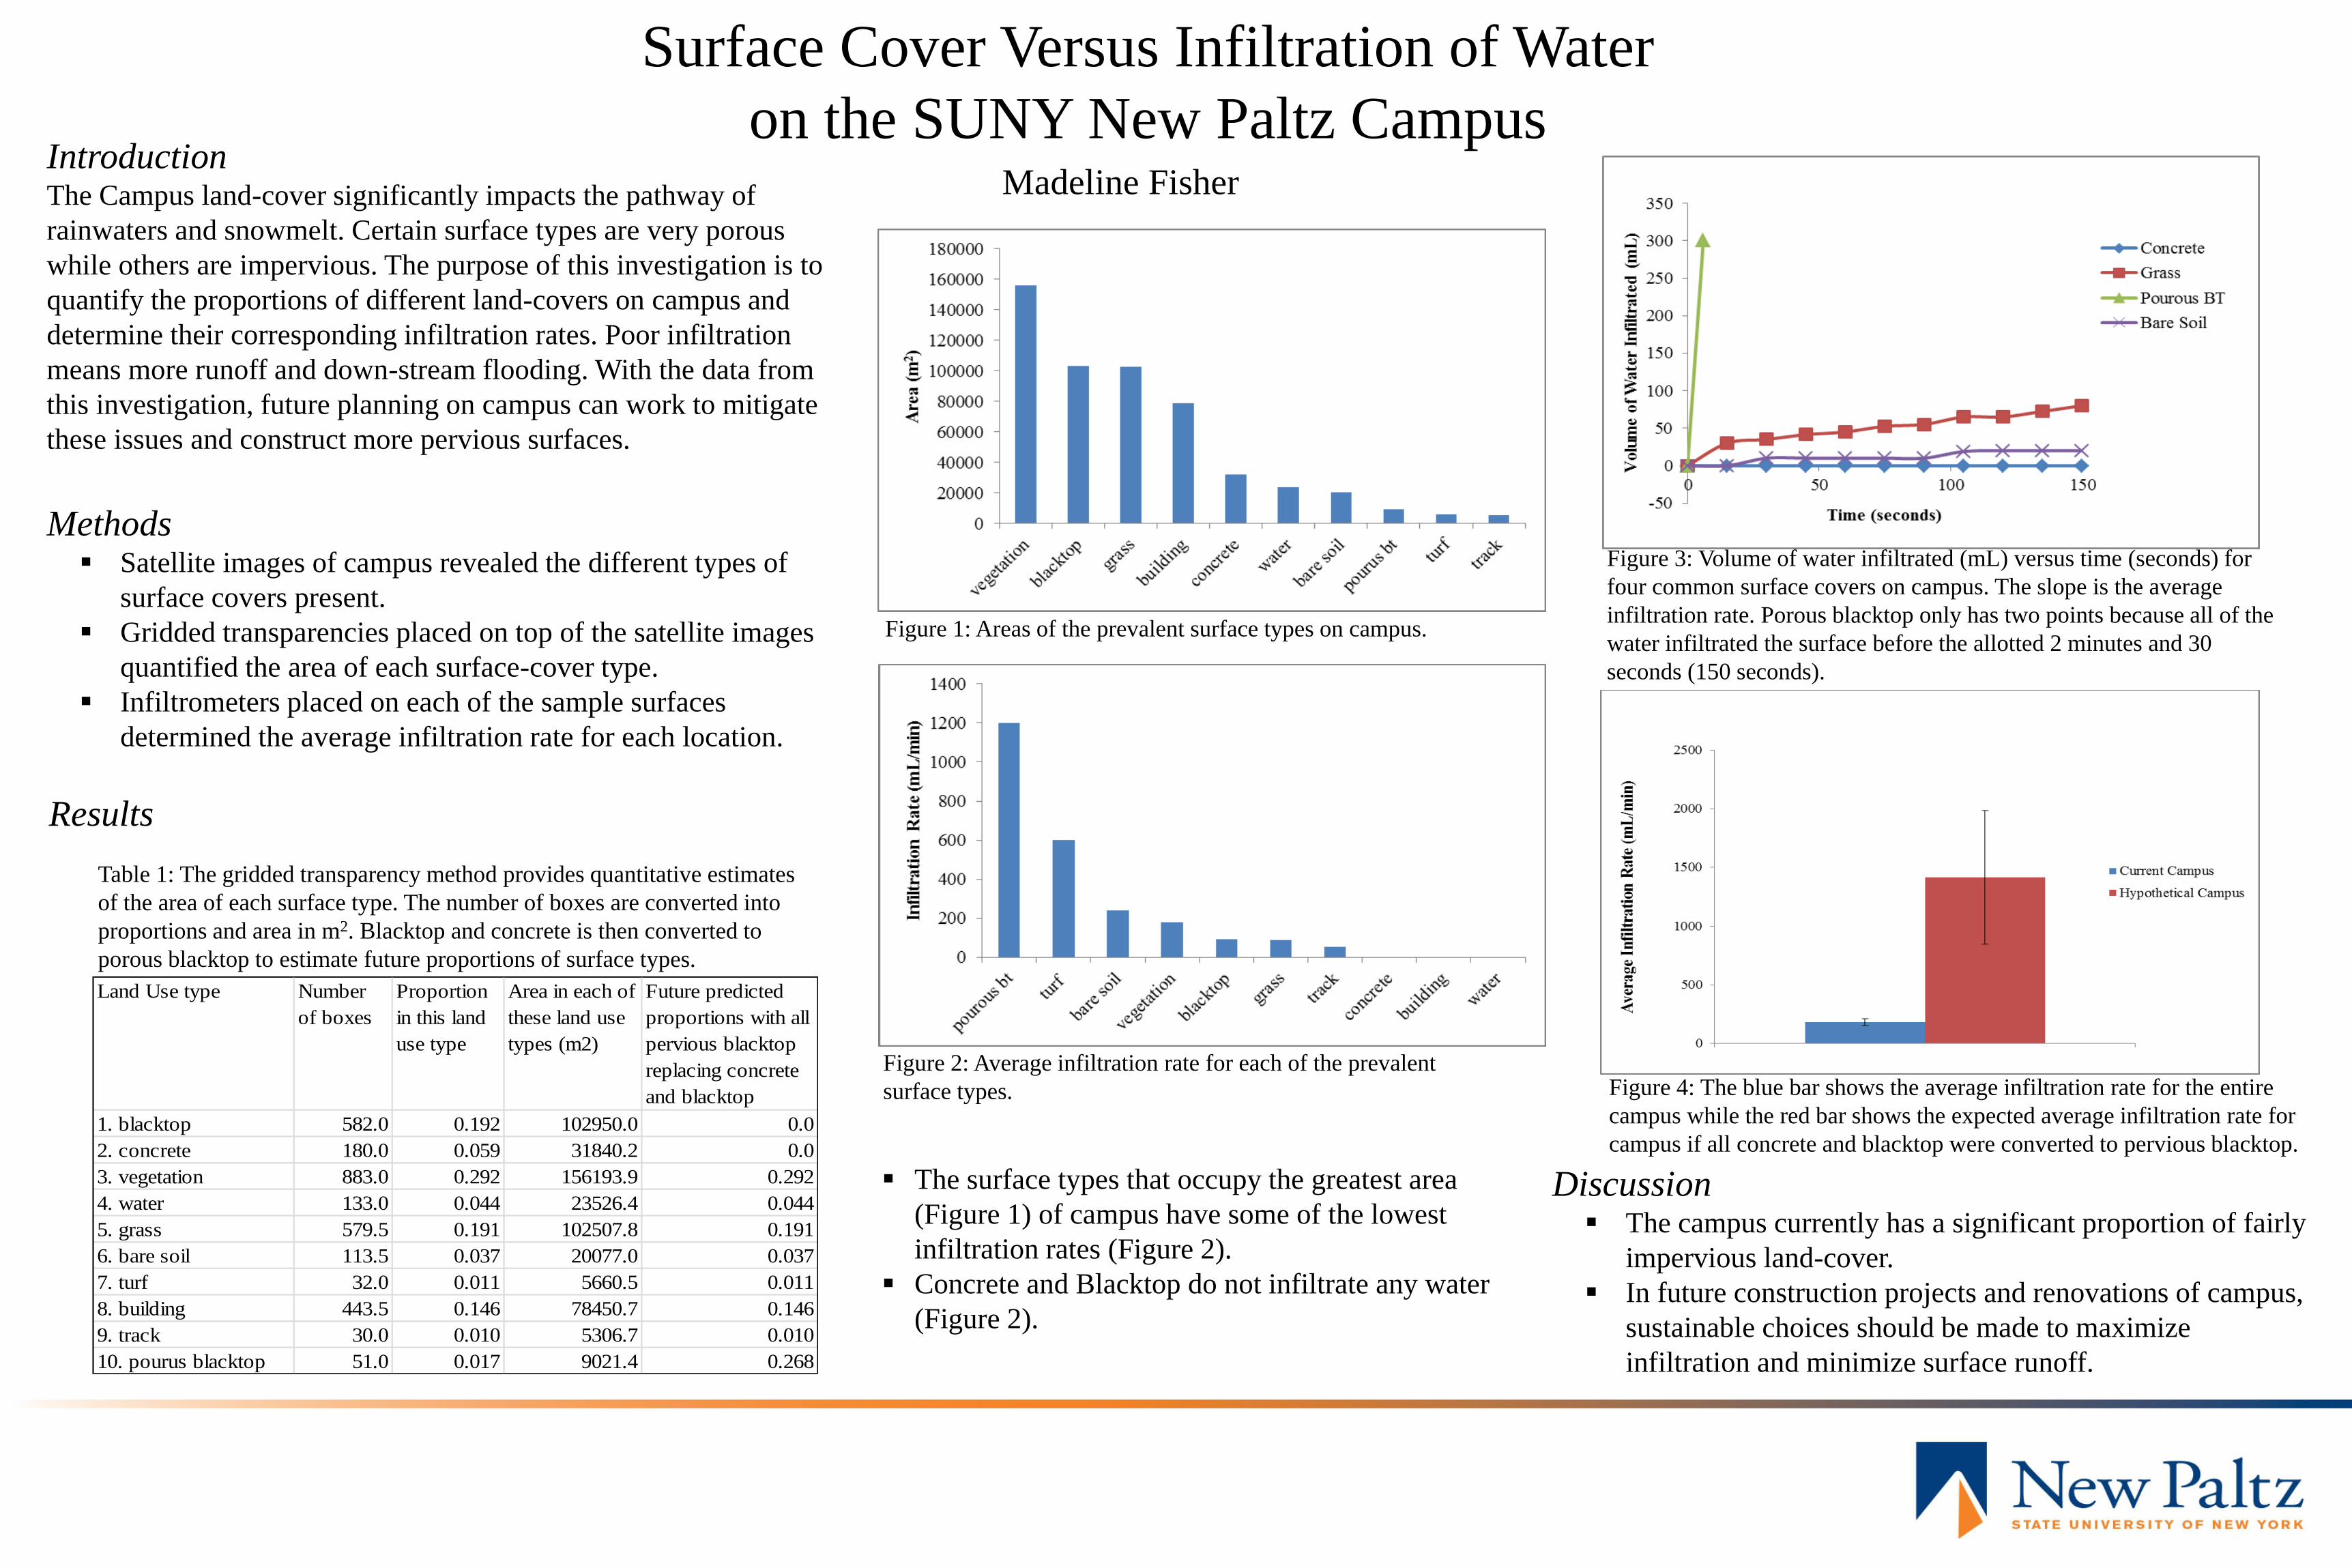
Figure 1: Areas of the prevalent surface types on campus.
Surface Cover Versus Infiltration of Water
on the SUNY New Paltz CampusIntroductionThe Campus land-cover significantly impacts the pathway of
rainwaters and snowmelt. Certain surface types are very porous
while others are impervious. The purpose of this investigation is to
quantify the proportions of different land-covers on campus and
determine their corresponding infiltration rates. Poor infiltration
means more runoff and down-stream flooding. With the data from
this investigation, future planning on campus can work to mitigate
these issues and construct more pervious surfaces.
Land Use type Number
of boxes
Proportion
in this land
use type
Area in each of
these land use
types (m2)
Future predicted
proportions with all
pervious blacktop
replacing concrete
and blacktop
1. blacktop 582.0 0.192 102950.0 0.0
2. concrete 180.0 0.059 31840.2 0.0
3. vegetation 883.0 0.292 156193.9 0.292
4. water 133.0 0.044 23526.4 0.044
5. grass 579.5 0.191 102507.8 0.191
6. bare soil 113.5 0.037 20077.0 0.037
7. turf 32.0 0.011 5660.5 0.011
8. building 443.5 0.146 78450.7 0.146
9. track 30.0 0.010 5306.7 0.010
10. pourus blacktop 51.0 0.017 9021.4 0.268
Madeline Fisher
Methods Satellite images of campus revealed the different types of
surface covers present.
Gridded transparencies placed on top of the satellite images
quantified the area of each surface-cover type.
Infiltrometers placed on each of the sample surfaces
determined the average infiltration rate for each location.
Results
Table 1: The gridded transparency method provides quantitative estimates
of the area of each surface type. The number of boxes are converted into
proportions and area in m2. Blacktop and concrete is then converted to
porous blacktop to estimate future proportions of surface types.
Figure 2: Average infiltration rate for each of the prevalent
surface types.
Discussion The campus currently has a significant proportion of fairly
impervious land-cover.
In future construction projects and renovations of campus,
sustainable choices should be made to maximize
infiltration and minimize surface runoff.
The surface types that occupy the greatest area
(Figure 1) of campus have some of the lowest
infiltration rates (Figure 2).
Concrete and Blacktop do not infiltrate any water
(Figure 2).
Figure 3: Volume of water infiltrated (mL) versus time (seconds) for
four common surface covers on campus. The slope is the average
infiltration rate. Porous blacktop only has two points because all of the
water infiltrated the surface before the allotted 2 minutes and 30
seconds (150 seconds).
Figure 4: The blue bar shows the average infiltration rate for the entire
campus while the red bar shows the expected average infiltration rate for
campus if all concrete and blacktop were converted to pervious blacktop.

05
101520253035404550
6-May-13 25-Jun-13 14-Aug-13 3-Oct-13 22-Nov-13 11-Jan-14
Chl A
(ug/
L)
Chlorophyll A (primary production)
0
50
100
150
200
250
300
5-Jun-13 20-Jun-13 5-Jul-13 20-Jul-13 4-Aug-13
Tota
l Pho
spho
rus (
µg/L
)
Total Phosphorus
17.019.021.023.025.027.029.031.033.035.0
0
100
200
300
400
500
5-Jun-13 20-Jun-13 5-Jul-13 20-Jul-13 4-Aug-13
Tem
pera
ture
(°C)
Cond
uctiv
ity (µ
s/cm
)
Conductivity and temperature
0250500750
1000125015001750200022502500
6-May-13 25-Jun-13 14-Aug-13 3-Oct-13 22-Nov-13 11-Jan-14Co
lifor
m D
ensi
ty (
Colo
nies
/mL)
Total Coliform Density
0.00
10.00
20.00
30.00
40.00
50.00
60.00
70.00
80.00
90.00
6-May-13 5-Jun-13 5-Jul-13 4-Aug-13 3-Sep-13 3-Oct-13 2-Nov-13 2-Dec-13
Tota
l Sus
pend
ed S
olid
s (m
g/L)
Total Suspended Solids (TSS)
Baseflow and Stormwater Quality of the SUNY New Paltz Ponds, “The Gunks”
Caitlyn Maceli (Environmental Geochemical Science); Mentor: David Richardson (Biology)
Increased nutrient availability will increase both phosphorus and algae in the pond. We see a sharp rise in Chlorophyll A and phosphorus levels during heavy rainfall (possible runoff from watershed), but a decrease in phosphorus from uptake by photosynthetic organisms
Total coliforms are an indicator bacteria for pollution in water. These colonies multiply rapidly when conditions are favorable. Die off is high from direct solar radiation during the summer.
Conductivity, decreased in the pond because there was a dilution in the pond caused by the heavy rainfall .
Figure 2: Rain gauge data recorded from June 22, 2013 to July 14, 2013. Y-axis shows total rainfall (mm). The largest recorded rainfall event occurred at the end of June and the beginning of July of 2013.
Figure 1: The SUNY New Paltz Campus serves as the location for water quality testing because it is the headwaters for the Sawmill Brook. Water quality of the series of ponds was measured at the spillway (large pond). The data buoy continuously monitors water quality by measuring pH, temperature, conductivity, dissolved oxygen, and turbidity in the large pond, before exiting campus via the spillway.
Figure 3: All time data of dissolved oxygen (DO) in mg/L during late June 2013 to the end of November of 2013. DO has diurnal cycles but also seasonal cycles.
TSS: Erosion of the local watershed causes sediment to enter the pond. Highest level of TSS occurred during a heavy summer rainfall
Chlorophyll A: available solar radiation, temperature and nutrient availability (phosphorus) increase growth of algae in the pond.
Sampling weekly (summer 2013) and monthly (autumn 2013) shows trends in these water quality parameters so that we can track what is happening in the Gunk during heavy rainfall events.
Introduction: Implement green infrastructure and water quality monitoring on SUNY New Paltz
Campus to improve local watershed resilience in the Saw Mill Brook Watershed and the Village of New Paltz
Water quality parameters such as temperature (ºC), pH, Conductivity (µs/cm), total suspended solids (TSS), Total dissolved solids (TDS), chlorophyll A (μg/L), total coliforms (fecal coliform and Escherichia coli), and total phosphorus (mg/L)
Results & Discussion:
Future research: We plan on continuing similar monitoring of the Gunk’s for 2014. Hydrogeological tests will monitor both hydrogeological water flow through green infrastructure (Bioswales, pervious blacktop, daylighting stream) and water quality. Testing how climate change factors such as increased precipitation for our region will affect water quality and quantity in the Gunks.