Final Report for FREP 12-0386-SA
30
Final Report for FREP 12-0386-SA A. Project Information. Period: January 1, 2012 March 31, 2017 Title: Development of Economically Viable Variable Rate P Application Protocols for Desert Vegetable Production Systems Project Leaders: Charles A. Sanchez, Professor, University of Arizona, 6425 W. 8 th Street, Yuma, AZ 85364, phone 928-782-3836, e-mail [email protected] Dr. Pedro Andrade-Sanchez, Associate Specialist/ Professor Agric. & Biosystems Engineering, Maricopa Agricultural Center. phone 520-568-2273, e-mail [email protected] B. Objectives The objective of this project is to 1. Develop economically viable and effective sampling protocols to generate prescription maps for the variable rate application of P, 2, Compare variable rate P application to current methods and evaluate alternative economic outcomes. In the first phase of the project we will test alternative sampling schemes. Sampling schemes evaluated will include grid sampling at various resolutions and sample schemes which seek to define management zones directed by other indices of in-field variability. In the second phase we will evaluate the efficacy and economic returns to variable rate P application. Project success will be the development of economically viable protocols for the implementation of variable rate P application technologies. The target audience will be crop advisors in the public and private sector that make fertilizer recommendations to producers, the fertilizer industry that can offer this as a value added service to producers, and growers that make production decisions on economic returns and, depending on their size may invest in infrastructure to implement this technology themselves. C. Abstract Vegetable crops produced in the desert receive large annual applications of phosphorus (P) fertilizers. Amounts of P applied to vegetable production systems often approach and exceed 200 kg P/ha and crop recoveries of P fertilizers are generally less than 25%. While much of the added P is converted to insoluble forms in the calcareous soils of the region, some of it is carried in runoff and drainage water into receiving surface waters having adverse ecological effects. Further, erratic fertilizer pricing over the past several years has created incentives for improved efficiency. Approximately three years ago, the costs of mono-ammonium phosphate (MAP), a formulation widely used for desert vegetable production, exceeded $1,200.0 per ton. Although costs have since declined, rapid increases are anticipated as the world economy recovers and resource demand in the developing world regains momentum. In addition, world P reserves are
Transcript of Final Report for FREP 12-0386-SA

Final Report for FREP 12-0386-SA A. Project Information.
Period: January 1, 2012 March 31, 2017
Title: Development of Economically Viable Variable Rate P Application
Protocols for Desert Vegetable Production Systems
Project Leaders:
Charles A. Sanchez, Professor, University of Arizona, 6425 W. 8th Street, Yuma, AZ
85364, phone 928-782-3836, e-mail [email protected]
Dr. Pedro Andrade-Sanchez, Associate Specialist/ Professor Agric. & Biosystems
Engineering, Maricopa Agricultural Center. phone 520-568-2273, e-mail
B. Objectives
The objective of this project is to 1. Develop economically viable and effective sampling protocols to generate prescription maps for the variable rate application of P, 2, Compare variable rate P application to current methods and evaluate alternative economic outcomes. In the first phase of the project we will test alternative sampling schemes. Sampling schemes evaluated will include grid sampling at various resolutions and sample schemes which seek to define management zones directed by other indices of in-field variability. In the second phase we will evaluate the efficacy and economic returns to variable rate P application. Project success will be the development of economically viable protocols for the implementation of variable rate P application technologies. The target audience will be crop advisors in the public and private sector that make fertilizer recommendations to producers, the fertilizer industry that can offer this as a value added service to producers, and growers that make production decisions on economic returns and, depending on their size may invest in infrastructure to implement this technology themselves.
C. Abstract
Vegetable crops produced in the desert receive large annual applications of phosphorus (P) fertilizers. Amounts of P applied to vegetable production systems often approach and exceed 200 kg P/ha and crop recoveries of P fertilizers are generally less than 25%. While much of the added P is converted to insoluble forms in the calcareous soils of the region, some of it is carried in runoff and drainage water into receiving surface waters having adverse ecological effects. Further, erratic fertilizer pricing over the past several years has created incentives for improved efficiency. Approximately three years ago, the costs of mono-ammonium phosphate (MAP), a formulation widely used for desert vegetable production, exceeded $1,200.0 per ton. Although costs have since declined, rapid increases are anticipated as the world economy recovers and resource demand in the developing world regains momentum. In addition, world P reserves are
rapidly declining and there is concern that a shortage of P fertilizers will ultimately result in large fertilizer P price increases and ultimately compromise world food production.
In studies we have shown most cool seasons vegetables produced in the desert will respond to P fertilizer up to a sodium bicarbonate P soil test level of 30 to 35 mg/kg. As pre-plant soil tests approach these critical soil test P levels, the probability of crop response to P fertilizer drops dramatically. However, P fertilization based on a composite soil sample from a production unit assumes relatively uniform fertility within the unit which is inconsistent with our findings. In high resolution sampling of vegetable production fields in the desert we have found large in-field variability in soil test P levels within production units (CVs from 18 to 90% usually exceeding 50%). Thus, if we made adjustments in pre-plant P recommendations to minimize economic losses due to under-fertilization, we would have to over-fertilize a large portion of the field. This not only has economic consequences, it can result in very high available P levels over part of the field and adverse consequences such as P induced micronutrient deficiency (particularly Zn).
The prospect of variable rate pre-plant P fertilizer application had not been evaluated in desert vegetable cropping systems. The objective of this project was to 1. Develop economically viable and effective sampling protocols to generate prescription maps for the variable rate application of P, 2, Compare variable rate P application to current methods and evaluate alternative economic outcomes. Sampling schemes evaluated included grid sampling at various resolutions and samples schemes which seek to define management zones directed by other indices of in-field variability. In a few situations, variable rate based applications resulted in a higher net P application rate than the grower standard practice (GSP) but not for most sites. The net fertilizer savings over all sites was 20% for grid and 12% for zone based sampling schemes compared to the GSP. However, the fertilizer cost savings often did not cover the additional costs involved in surveys, sampling, and sample analysis involved in grid and zone sampling based applications. Over ten sites, yields were increased very slightly by variable rate application but the differences were not statistically significant. Overall, this study demonstrated that variable rate management is a viable strategy for P management in vegetables but will be more economically viable as P fertilizer costs increase. This strategy may be immediately applicable where environmental issues restrict P fertilization rates.
D. Introduction
Vegetable crops produced in the desert receive large annual applications of phosphorus (P) fertilizers. Amounts of P applied to vegetable production systems often approach and exceed 200 kg P/ha and crop recoveries of P fertilizers are generally less than 25%. While much of the added P is converted to insoluble forms in the calcareous soils of the region, some of it is carried in runoff and drainage water into receiving surface waters having adverse ecological effects. Further, erratic fertilizer pricing over the past several years has created incentives for improved efficiency. Approximately three years ago, the costs of mono-ammonium phosphate (MAP), a formulation widely used for desert vegetable production, exceeded $1,200.0 per ton. Although costs have since declined, rapid increases are anticipated as the world economy recovers and resource

demand in the developing world regains momentum. In addition, world P reserves are rapidly declining and there is concern that a shortage of P fertilizers will ultimately result in large fertilizer P price increases and ultimately compromise world food production.
In studies we have shown most cool seasons vegetables produced in the desert will respond to P fertilizers up to a sodium bicarbonate P soil test level of 30 to 35 mg/kg. As pre-plant soil tests approach these critical soil test P levels, the probability of crop response to P fertilizer drops dramatically. However, P fertilization based on a composite soil sample from a production unit assumes relatively uniform fertility within the unit which is inconsistent with our findings. In high resolution sampling of vegetable production fields in the desert we have found large in-field variability in soil test P levels within production units (CVs from 18 to 90% usually exceeding 50%). Thus, if we made adjustments in pre-plant P recommendations to minimize economic losses due to under-fertilization, we would have to over-fertilize a large portion of the field. This not only has economic consequences, it can result in very high available P levels over part of the field and adverse consequences such as P induced micronutrient deficiency (particularly Zn).
The prospect of variable rate pre-plant P fertilizer application had not been extensively evaluated in desert vegetable cropping systems.
E. Work Description
Task 1
Evaluate alternative sampling schemes including various resolutions of grid
sampling and zone sampling based on soil properties that may serve as
covariates.
During 2013-2014 four research sites were established. One was iceberg lettuce in Imperial County, CA (Bard), one was broccoli in Riverside County CA (Coachella Valley), one was romaine lettuce in Yuma AZ, and one was potato in Maricopa AZ. In September we performed soil EC surveys at the first three sites as a basis for zone sampling (Figure 1, example from Coachella Valley). The last survey for potato was performed in late January. The Veris 3100 is simple to use and user-friendly for producers but the EM-38 gives higher resolution map. It is one of our objectives to evaluate these two systems as alternatives for deriving zone-based sampling schemes. An example of the electronic surveys are shown in figure 2 for the Bard CA site. Each production field was divided into three equal areas. For one, prescription fertilization maps would be developed based simple grid based sampling, for another they would be developed based on zone sampling, and for the third P fertilizers were applied based on the growers normal practice. Conductance measurements were processed using the USDA-ESAP program to locate soil samples for the zone sample method based on natural variability of the soil. Immediately after these surveys, we collected soil samples for both grid and zone based fertilizer application comparisons (Figure 3a and b are examples from the 2013-2014 Bard site).
The samples were analyzed for P and salinity in our laboratory. The salinity data is used to statistically distinguish salinity and soil texture as sources of variation in the electronic surveys. The P soil tests were used to develop P soil test maps and corresponding prescription maps (Figures 4 and 5 examples from the 2013-2014 Bard site). The grower in the Coachella Valley had a preference for liquid P fertilizer so we used liquid P at this site. The growers in Yuma, Bard, and Maricopa preferred dry P sources so we used dry fertilizer in these sites. Task 2 Field testing of VRA and standard grower practice.
Field testing of VRT and grower practices were conducted during the fall-winter–spring
period in 2013-2014. The sites in the Coachella Valley, Yuma, Bard, and Maricopa
were planted to broccoli, romaine lettuce, iceberg lettuce, and potato respectively. In
2013-2014 we had not completed the yield monitoring systems so yield data were
collected by hand on less than a 0.25 acre resolution. The romaine and broccoli were
harvested in January. The iceberg lettuce was harvested in February, and the potato
were harvested in July. For, potato, our grower-cooperator had filled his contract before
harvesting our field and there was no market for non-contracted potato. However, he
agreed to take machines into the field and he harvested a few strips for us so that we
could calculate average yields from each plot.
Task 3 Repeated evaluation of alternative sampling schemes including various
resolutions of grid sampling and zone sampling based on soil properties that may
serve as covariates.
Filed testing on four sites was completed in 2014-2015. One site was broccoli in the
Coachella Valley (Riverside County CA), one site was iceberg lettuce in the Yuma
Valley, one site was iceberg lettuce in Bard (Imperial County, CA), and one site was
potato in Maricopa County, AZ. All sites were surveyed and sampled as in year one
and prescription maps were developed as described above. Fertilizer was applied in
accordance with these prescription maps. The broccoli sites was planted in September,
the lettuce in Yuma in October, and the lettuce in Bard in November. The potato site
was planted in mid-February. The sites were surveyed, sampled, and prescription
maps were developed as described above for 2013-2014.
This year, we mounted GPS and box counting apparatus on harvest machines.
Broccoli harvests at the Coachella sites were collected January 2 through 15. Lettuce
yields in Yuma were collected January 19 through 24. The second lettuce site in Bard
was harvested March 11 and 12. Unfortunately, we lost the potato site this year
because the grower went in and harvested without notifying us.
Tasks 4
Field testing of VRT and grower practices were again initiated in the fall 2015. One
study was with iceberg lettuce in Yuma County, one study was with broccoli in the Bard
Valley of Imperial County, California, and one was with spinach in the Bard Valley.

The sites were surveyed, sampled, and prescription maps were developed as described
above for 2013-2014 and 2014-2015. These sites were planted in November. Harvests
were completed in March 2016. We used GPS and box counting methodology
developed in 2014-2015 to complete the 2015-2016 studies.
We conducted one final spinach experiment in Bard, California in fall-winter 2016-2017.
The site was surveyed, sampled, and prescription maps were developed as described
above for 2013-2014, 2014-2015, and 2015-2016. Again we used the GPS box
counting methodology we developed in previous studies. Unfortunately, the GPS
coordinates for yield were corrupted in the post processing of this data set and yield
positions were assigned outside the field. We spent considerable time trying to correct
this data, however, because of lingering uncertainty in the yield positions, we elected
not to use this data set.
Task 5
Data from 2013 through 2016 were compiled and subjected to an economic analysis.
These data included costs of P fertilizer management in each of the GSP (grower
standard practice), grid, and zone management schemes and value of resulting yield.
The costs of fertilization included the cost of the fertilizer, the costs of application, and
where appropriate the costs of surveys, soil sampling, and sampling analysis. For the
grid we assumed a sampling resolution of 1 acre and previous work we found this the
best compromise between costs and accuracy. For zone we estimated a total cost of
$20 per acre for surveys and sample analysis. For this analysis we assumed a range of
P fertilizer prices from $0.48 to $1.44 per pound. The lower costs represents the
current price of P fertilizer. For crop value we assume a range of prices. For lettuce we
assumed crop value of $0.25, 0.50, and 0.75 per pound of product. For broccoli we
assumed crop value of $0.40, $0.6, and $0.8 per pound. For spinach we assumed
prices of $0.50, $0.70, and $0.90 per pound. Potato prices were assumed at 0.07, 0.09,
and 0.11. These ranges represent historical ranges for the crops considered.
F. Data/Results
During 2013 the following was accomplished. We built and tested a combined platform for soil apparent conductance measurements with Veris 3100 and EM-38. Hardware included GPS for data geo-referencing. We set up instrumentation supported by a CAT II tractor. This included a Trimble FMX with integrated GPS receiver and variable-rate function unlocked, Field IQ, Rawson controller and associated harnesses and power connections. We also built a 3-point hitch frame to support tank, hoppers, drive shafts, pumps, soil-engaging tooling and other hardware for precise application of P fertilizer. In September 2013 we performed soil conductance surveys at three locations for zone sampling (Figure 1). Sites were located in Imperial County, CA (Bard), Riverside County CA (Coachella Valley) and Yuma AZ.
Processed conductance measurements in USDA-ESAP was used to locate soil samples for zone sample method based on natural variability of the soil. Immediately after these surveys, we collected soil samples for both grid and zone based fertilizer application comparisons. Fertilizer applications were made using these prescription maps. Examples of surveys, sampling schemes, and fertilizer application maps for the Bard site as shown as examples in Figures 2 through 5. These steps were repeated in 2014-2015, 2015-2016, and 2016-2017. In 2013-2014 data were collected manually as described above. Data show that yields in the zone and grid managed plots were generally similar to those obtained in the grower managed section of the field (Figures 9 to 11). These similar yields were achieved at substantially reduced rates of P fertilizer. In the fall of 2014 we started working on the design and construction of an electronic yield monitor system for in-field evaluations (Figures 6 through 8). We developed a system whose basic components consisted of: a) GPS receiver to generate positioning data. We used a variety of Trimble systems with differential correction for sub-meter accuracy (typically within 12 in); b) Box counting hardware which consisted of either a handheld button assembly to generate counts manually, or a sensor-based approach that used laser sensors (Keyence model LR-ZB240CB) for automatic counting of boxes moving along the machine conveyers; and c) Field-ready electronic data acquisition (Campbell Scientific CR3000 and CR 1000) with serial and analog ports to accommodate GPS string data, pulses from handheld manual counters, and differential voltage generated by the laser sensors. This was a customized solution and therefore we wrote CR-basic code with specific instructions for the logger to handle the data inputs and integrate it on 10 sec intervals, which corresponded to about 9 inches in the direction of machine travel. Three units were set up to account for the possibility that multiple machines were used in the field under study. Yield maps for lettuce and broccoli from the 2014-2015 studies are shown in Figures 12 and 13. The broccoli data show a clear yield increase to grid and zone based P fertilizer application compared to grower standard practice. The results for lettuce were less conclusive. This field had very high yields and was harvested west to east over a period of a week. On day 1 of harvest only one harvest machine was used. On days two through four three harvest machines were used. By day five, five harvest machines were used because the lettuce was passing optimal maturity. Thus, on day 5 and 6, more lettuce was passed over because it was no longer of quality to harvest. This is particularly evident in the last transect of the east side of the field that required an extreme level of selectivity to pick only the best heads still standing in the field. This happened to be in the zone area.
In fall of 2015 we set up a study with broccoli and spinach in Bard, California and a
lettuce study in Yuma. As previously, we conducted surveys and soil samples and
applied P using prescription maps generated by zone and grid based samples. Yield
data were collected using the GPS referenced box counting apparatus. The yield maps,
for lettuce, broccoli, and spinach are shown in Figures 14, 15, and 16, respectively.
G. Discussion

Out of 12 field experiments put out between 2013 and 2016, we got meaningful yield
data from ten studies. A potato study put out in 2015 was lost because the grower went
in and harvested it without notifying us. In 2017, the GPS coordinates corresponding to
yield in a spinach trail were corrupted in the post processing operations and after
spending considerable time trying to rescue this data set, we has to conclude that we
had no confidence in the yield results of this study and we declined to utilize them in the
final conclusion. Since these two studies lacked yield information, they will not be
addressed further in our discussion.
Interestingly, in three studies at least one of the variable rate application strategies (grid,
zone, or both) resulted in more applied P fertilizer then the GSP. Based on University
calibrated soil test based fertilizer recommendations, it would seem that the grower
under-fertilized portions of the field in these situations. Considering all 10 sites
combined, grid based fertilizer application resulted in 20% less P fertilizer and zone
12% less P than the grower standard practice. It is reasonable to conclude that, overall,
variable rate application technologies would reduce P use over the longer term.
However, comparing fertilization costs among all strategies, these fertilizer savings
compared to GSP, would not cover the additional costs of surveys, sampling, and
sample analysis associated with variable rate strategies at current fertilizer prices. P
fertilizer costs would have in increase appreciably for variable rate applications to be
economically justified (Table 2). In some regions P fertilizer applications are restricted
due to the impact of P fertilizer on surface water and in this instance variable rate
application would be a viable means to reduce fertilizer P inputs while minimizing or
eliminating adverse yield impacts. These particular environmental issues are not of
concern in the desert, where P runoff from agricultural fields is negligible.
At noted previously, in 2013-2014 all yields were collected by hand on the same day in
each site. The broccoli in the Coachella valley was harvested twice but the commercial
harvests stayed out of our flagged areas for our 2nd harvest. From 2014 through 2016,
yields were collected with GPS referenced box counting apparatus installed on
commercial harvesting machines. However, in hindsight we have concluded that these
yield should be interpreted with caution because for fresh vegetables, the crops can
change over the harvest period, and yields can be impacted by time as much or more
as by P treatment. As noted above, this was the case for lettuce in 2014-2015. This
field had very high yields and was harvested west to east over a period of a week. On
day one of harvest, only one harvest machine was used. On days two through four
three harvest machines were used. By day five, five harvest machines were used
because the lettuce was passing optimal maturity. Thus, on day 5 and 6, more lettuce
was passed over because it was no met of quality standards (over mature) and these
passes were located in the grid and zone areas. Most of the other harvest occurred
over a period of three days or less, and in all of these experiments variable rate
applications resulted in similar or only slightly higher yields than GSP.

Looking at all data, including the lettuce data from 2014-2015, including where delayed
harvest compromised yields in the grid and zone treatments, yields for grid averaged
2% higher and zone less than 1%, higher, than the GSP. However, because variation
within plots exceeded 10%, we cannot conclude yield differences are statistically
significant. Using these data to estimate hypothetical returns we see that in some years
profits were reduced and in some years increased by grid and zone compared to the
control (Table 3). However, because we cannot conclude yields were significantly
different, the best economic indicator is the cost of fertilizer application for each
treatment shown in Table 2. With current P fertilizer prices, the cost of employing
variable rate technologies usually exceeded the value of the fertilizer saved.
H. Project Impacts
We demonstrated the feasibility of variable rate P fertilizer practices in desert vegetable
production systems. The economic viability will increase as P fertilizer prices increase
and technology developments continue.
I. Outreach
We conducted four formal outreach activities associated with this project during 2014.
These included presentations at the SW Ag Summit in Yuma on February 27, 2014, the
Western Plant Health meeting in Yuma on March 4, 2013, and the Desert Ag
Conference in Chandler Arizona on May 8, 2014, and the Fall Pre-season Vegetable
Workshop in Yuma on Sept. 4, 2014.
Outreach activities conducted during 2015 included presentations at the southwestern
Ag Summit on February 26, 2015, the Desert Ag Conference in Chandler on May 7,
2015, the FREP annual conference on November 6, 2015 and the CCA Nutrient
Seminar in Ontario California on November 17, 2015.
Another presentation was made as the SW Ag Summit on February 23, 2016. In
addition to these field days we have work with growers in the field on demonstration and
training with respect to the technologies developed and deployed.
J. Factsheet Database Template
1. Project Title: Development of Economically Viable Variable Rate P Application
Protocols for Desert Vegetable Production Systems
2. Grant Agreement Number FREP 12-0386-SA
3. Project Leaders Charles A. Sanchez, Professor, University of Arizona,
Maricopa Agricultural Center, 37860 W Smith Enke Rd,
Maricopa, AZ 85138, phone 928-941-2090, e-mail
Dr. Pedro Andrade-Sanchez, Assistant Specialist/ Professor
Agric. & Biosystems Engineering, Maricopa Agricultural
Center. phone 520-568-2273, e-mail
4. Start/end date January 2012 through March 2017
5. Project Location Low Desert Region of Southwestern US
6. Counties Imperial and Riverside Counties, CA, Yuma and Pinal
Counties AZ
7. Highlights Variable rate P application technologies will work for desert
vegetables.
8. Introduction
Vegetable crops produced in the desert receive large annual applications of phosphorus (P) fertilizers. Amounts of P applied to vegetable production systems often approach and exceed 200 kg P/ha and crop recoveries of P fertilizers are generally less than 25%. While much of the added P is converted to insoluble forms in the calcareous soils of the region, some of it is carried in runoff and drainage water into receiving surface waters having adverse ecological effects. Further, erratic fertilizer pricing over the past several years has created incentives for improved efficiency. Approximately three years ago, the costs of mono-ammonium phosphate (MAP), a formulation widely used for desert vegetable production, exceeded $1,200.0 per ton. Although costs have since declined, rapid increases are anticipated as the world economy recovers and resource demand in the developing world regains momentum. In addition, world P reserves are rapidly declining and there is concern that a shortage of P fertilizers will ultimately result in large fertilizer P price increases and ultimately compromise world food production.
In studies we have shown most cool seasons vegetables produced in the desert will respond to P fertilizers up to a sodium bicarbonate P soil test level of 30 to 35 mg/kg. As pre-plant soil tests approach these critical soil test P levels, the probability of crop response to P fertilizer drops dramatically. However, P fertilization based on a composite soil sample from a production unit assumes relatively uniform fertility within the unit which is inconsistent with our findings. In high resolution sampling of vegetable production fields in the desert we have found large in-field variability in soil test P levels within production units (CVs from 18 to 90% usually exceeding 50%). Thus, if we made adjustments in pre-plant P recommendations to minimize economic losses due to under-fertilization, we would have to over-fertilize a large portion of the field. This not only has economic consequences, it can result in very high available P levels over part of the field and adverse consequences such as P induced micronutrient deficiency (particularly Zn).
The prospect of variable rate pre-plant P fertilizer application had not been extensively evaluated in desert vegetable cropping systems.
9. Methods/Management

From 2013 to 2017 studies were conducted in commercial produce fields with grower cooperators to evaluate variable rate P fertilizer practices and compare them to grower standard P fertilizer practices. Studies were conducted with lettuce, broccoli, spinach, and potato. Sites included, the Coachella Valley, CA, Bard, CA, Yuma Valley, and Maricopa Valley. Sampling schemes evaluated included grid sampling at various resolutions and samples schemes which seek to define management zones directed by other indices of in-field variability. Each production field was divided into three equal areas. For one, prescription fertilization maps would be developed based simple grid based sampling, for another they would be developed based on zone sampling, and for the third P fertilizers were applied based on the growers normal practice. The P soil tests were used to develop P soil test maps and corresponding prescription maps.
10. Findings
In a few situations, variable rate based applications resulted in a higher net P application rate than the grower standard practice (GSP) but not for most sites. The net fertilizer savings over all sites was 20% for grid and 12% for zone based sampling schemes compared to the GSP. However, the fertilizer cost savings often did not usually cover the addition costs involved in surveys, sampling, and sample analysis involved in grid and zone sampling based applications. Over all ten sites, yields were increased slightly by variable rate application but the differences were not statistically significant. Overall, this study demonstrated that variable rate management is a viable strategy for P management in vegetables but will be more economically viable as P fertilizer costs increase. This strategy may be immediately applicable where environmental issues restrict P fertilization rates.

Figure 1. Veris and EM38 survey in the Coachella Valley, Riverside County, CA.
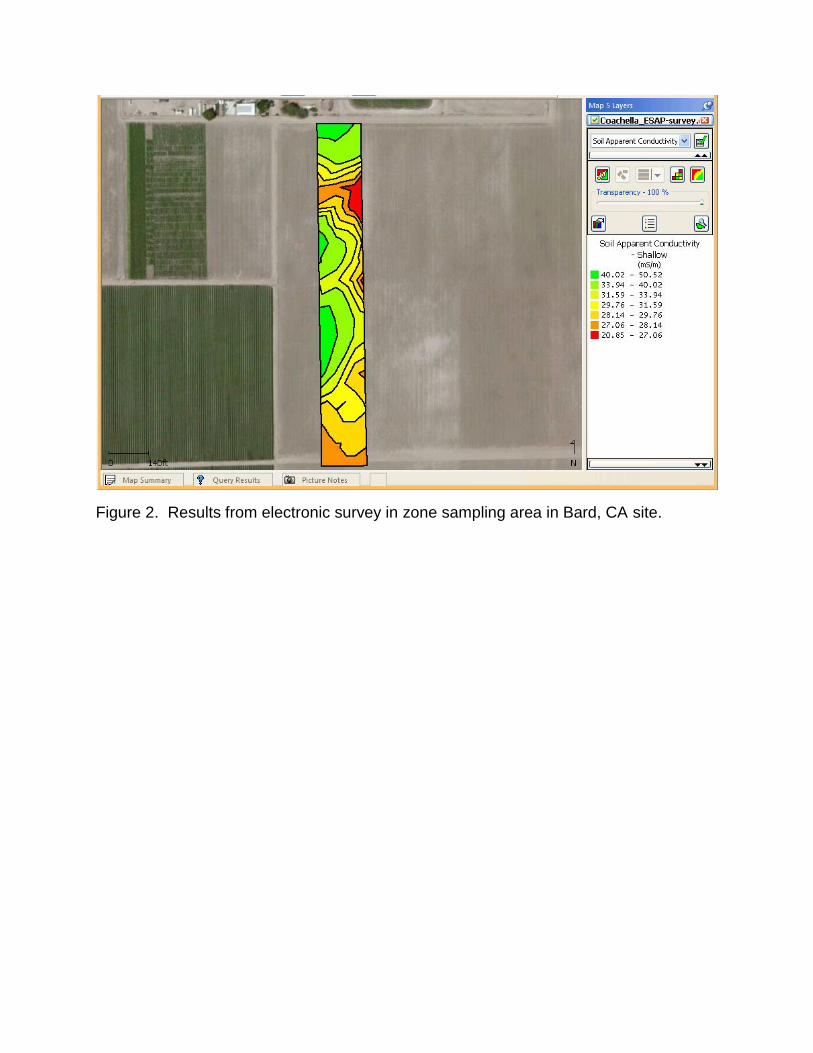
Figure 2. Results from electronic survey in zone sampling area in Bard, CA site.

Figure 3. A comparison of grid and zone sampling schemes at the Bard, CA site.

Figure 4. Interpolated soil test P values based on zone samples and corresponding
prescription P fertilization map for Bard grid site.
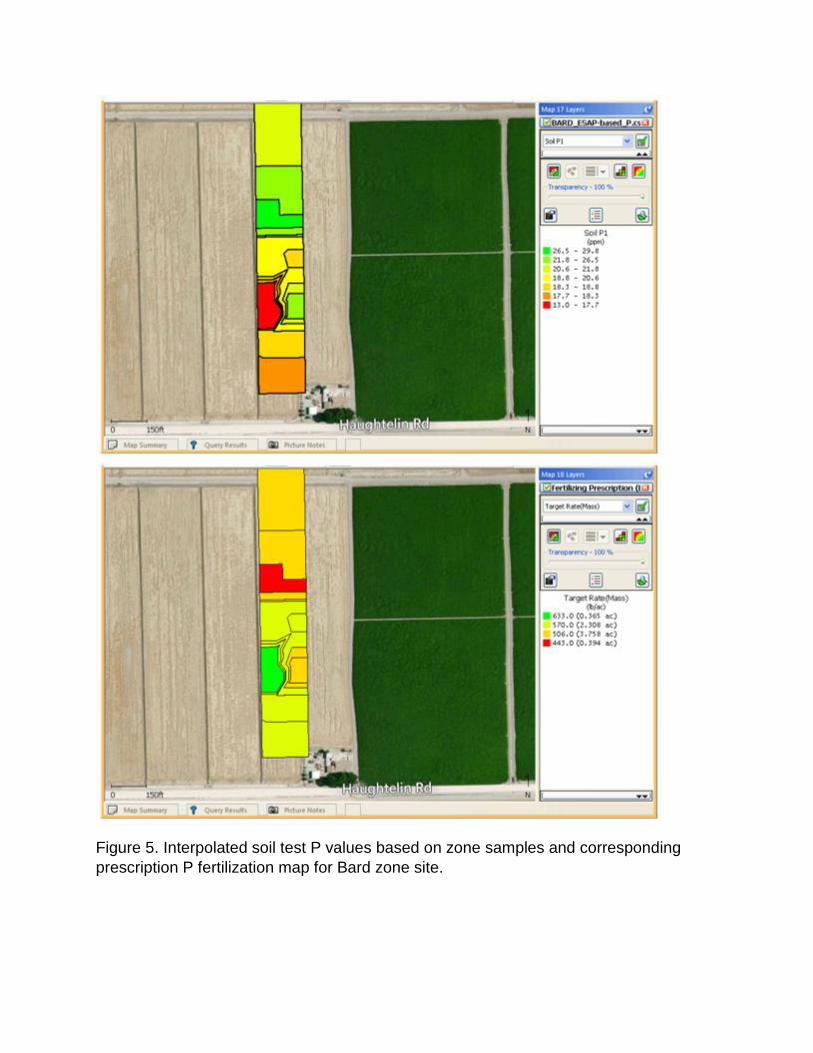
Figure 5. Interpolated soil test P values based on zone samples and corresponding
prescription P fertilization map for Bard zone site.

Figure 6. Laser system tested in broccoli harvest in 2015.

Figure 7. One of the box counting systems tested in lettuce in 2015.

Figure 8. GPS system on harvesting machines.

Figure 9. Comparison of total relative yield from grid and zone based fertilization
schemes compared to grower practice in Coachella Valley site in 2013-2014.

Figure 10. Comparison of total relative yields from grid and zone based
fertilization schemes compared to grower practice in Yuma alley site in 2013-
2014.

Figure 11. Comparison of total relative yields from grid and zone based
fertilization schemes compared to grower practice in Bard Valley site in 2013-
2014.

Figure 12. Lettuce yields in 2014-2015 study.

Figure 13. Broccoli yields in 2014-2015 study.
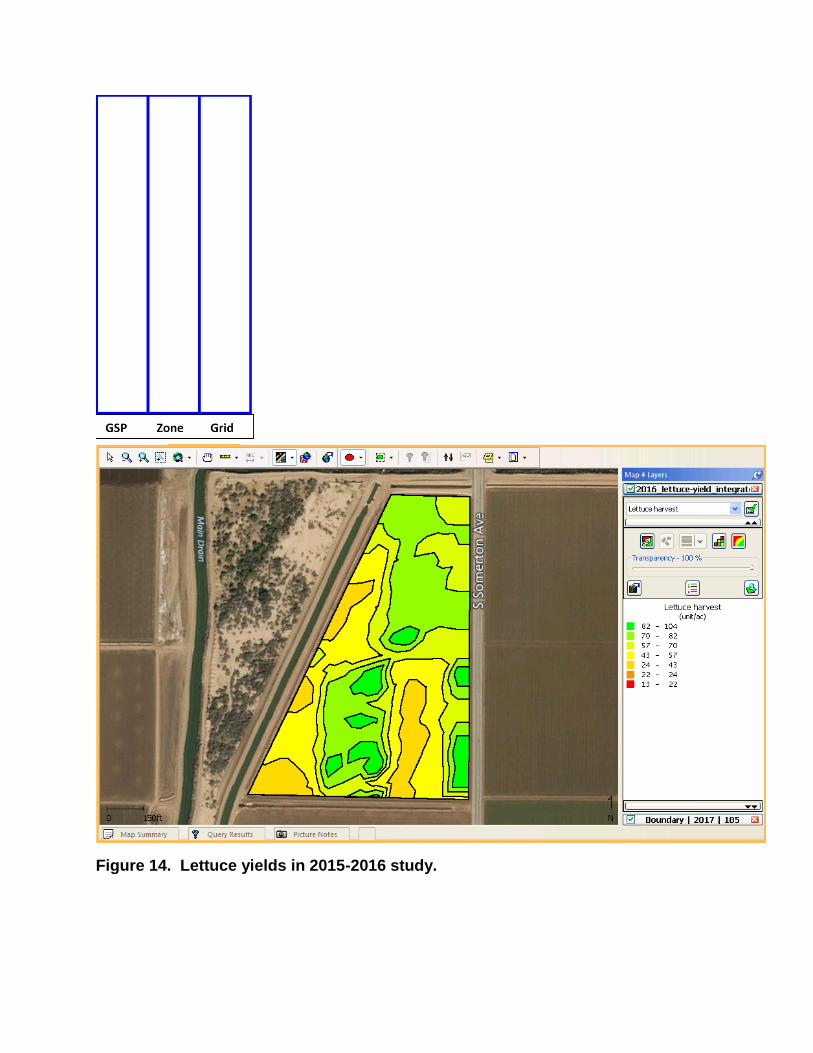
Figure 14. Lettuce yields in 2015-2016 study.
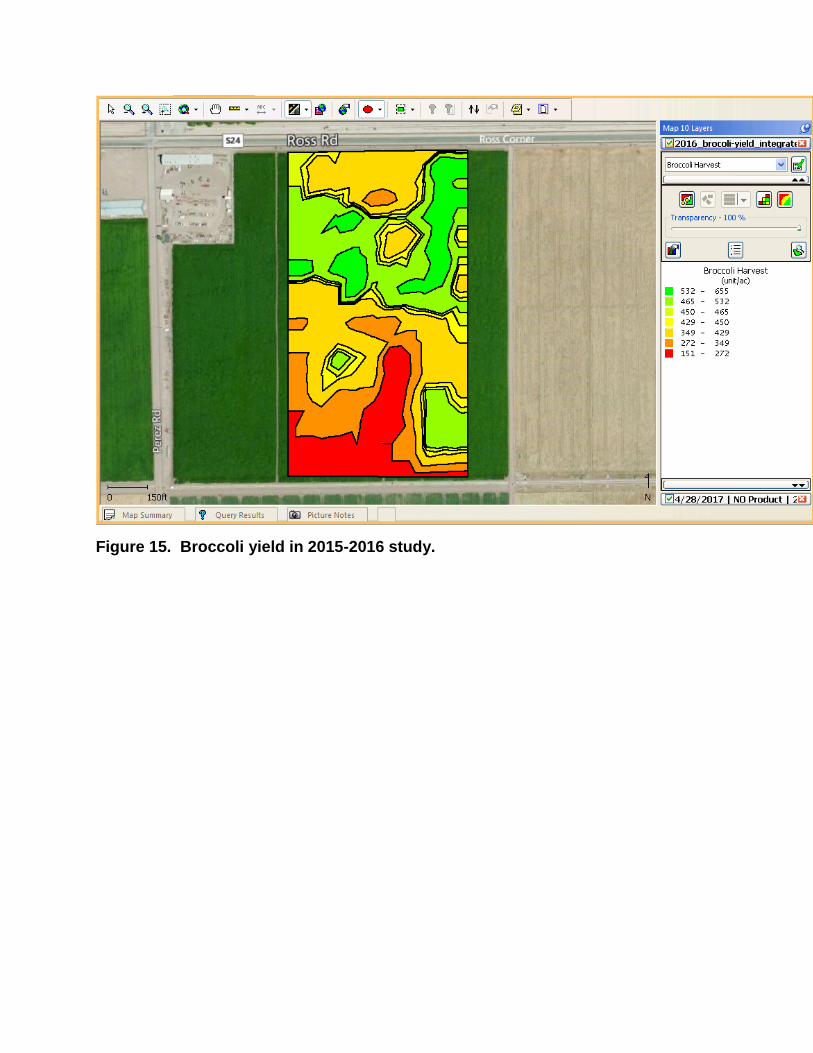
Figure 15. Broccoli yield in 2015-2016 study.
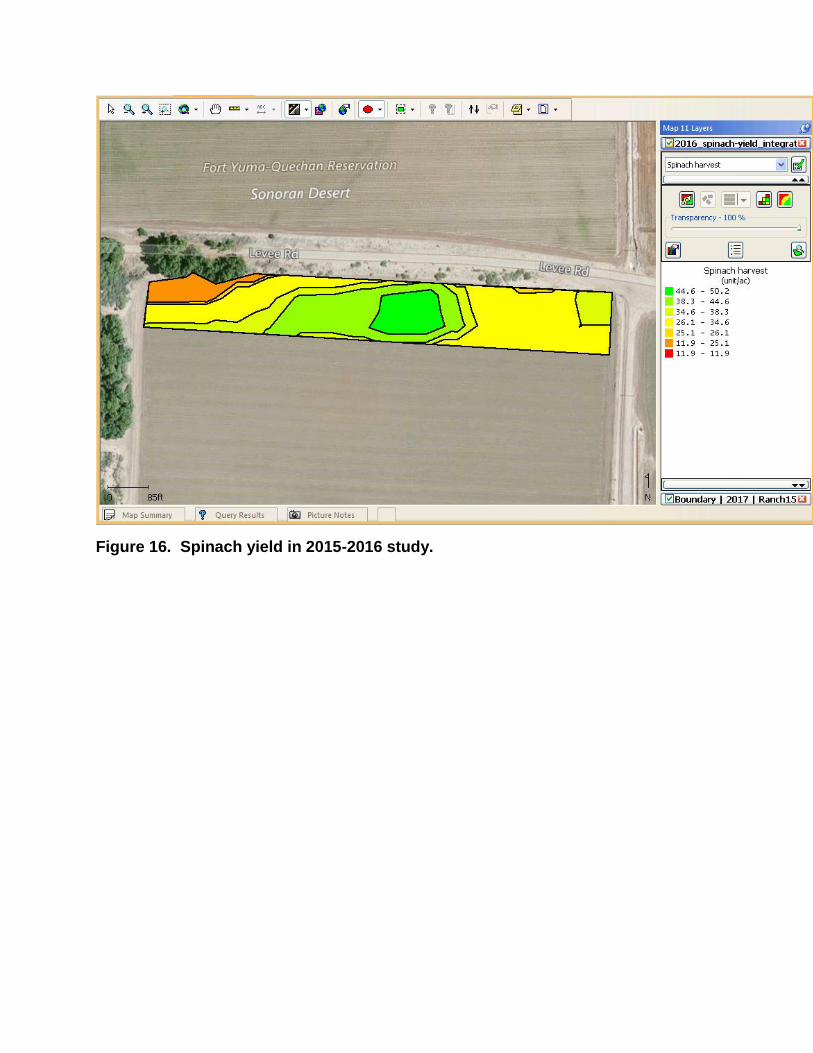
Figure 16. Spinach yield in 2015-2016 study.

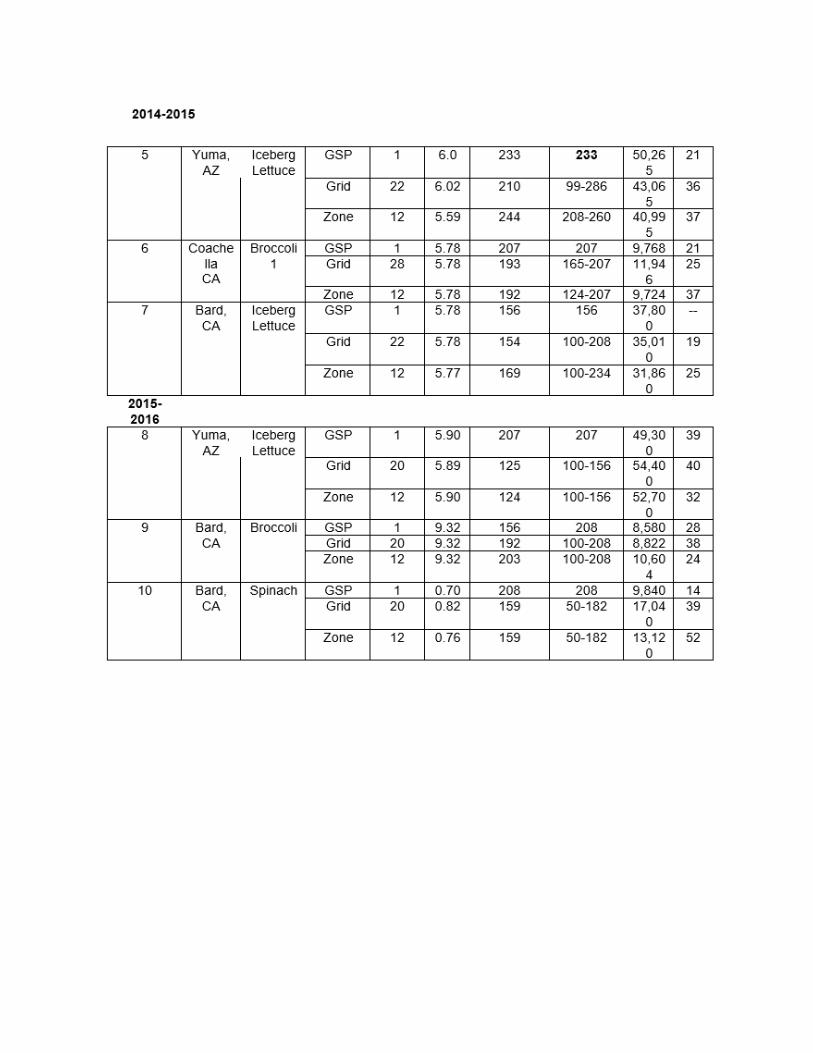

Table 2. Costs of P fertilization at three prices of P fertilizer

Table 3. Economic returns to grid and zone P fertilizer management compared to GSP
in each experiment.