AWARD NUMBER: W81XWH-13-1-0386 TITLE: Imaging …
12
1 AWARD NUMBER: W81XWH-13-1-0386 TITLE: Imaging Prostate Cancer (PCa) Phenotype and Evolution PRINCIPAL INVESTIGATOR: Jason A. Koutcher CONTRACTING ORGANIZATION: Memorial Sloan Kettering Institute for Cancer Research New York, NY 10065 REPORT DATE: October 2016 TYPE OF REPORT: Annual Report PREPARED FOR: U.S. Army Medical Research and Materiel Command Fort Detrick, Maryland 21702-5012 DISTRIBUTION STATEMENT: Approved for Public Release; Distribution Unlimited The views, opinions and/or findings contained in this report are those of the author(s) and should not be construed as an official Department of the Army position, policy or decision unless so designated by other documentation.
Transcript of AWARD NUMBER: W81XWH-13-1-0386 TITLE: Imaging …

1
AWARD NUMBER: W81XWH-13-1-0386
TITLE: Imaging Prostate Cancer (PCa) Phenotype and Evolution
PRINCIPAL INVESTIGATOR: Jason A. Koutcher
CONTRACTING ORGANIZATION: Memorial Sloan Kettering Institute for Cancer ResearchNew York, NY 10065
REPORT DATE: October 2016
TYPE OF REPORT: Annual Report
PREPARED FOR: U.S. Army Medical Research and Materiel Command Fort Detrick, Maryland 21702-5012
DISTRIBUTION STATEMENT: Approved for Public Release; Distribution Unlimited
The views, opinions and/or findings contained in this report are those of the author(s) and should not be construed as an official Department of the Army position, policy or decision unless so designated by other documentation.

2
REPORT DOCUMENTATION PAGE Form Approved
OMB No. 0704-0188 Public reporting burden for this collection of information is estimated to average 1 hour per response, including the time for reviewing instructions, searching existing data sources, gathering and maintaining the data needed, and completing and reviewing this collection of information. Send comments regarding this burden estimate or any other aspect of this collection of information, including suggestions for reducing this burden to Department of Defense, Washington Headquarters Services, Directorate for Information Operations and Reports (0704-0188), 1215 Jefferson Davis Highway, Suite 1204, Arlington, VA 22202-4302. Respondents should be aware that notwithstanding any other provision of law, no person shall be subject to any penalty for failing to comply with a collection of information if it does not display a currently valid OMB control number. PLEASE DO NOT RETURN YOUR FORM TO THE ABOVE ADDRESS. 1. REPORT DATE (DD-MM-YYYY)October 2016
2. REPORT TYPEAnnual
3. DATES COVERED (From - To) 30 Sep 2015 – 29 Sep 2016
4. TITLE AND SUBTITLE:5a. CONTRACT NUMBER5b. GRANT NUMBER W81XWH-13-1-0386 5c. PROGRAM ELEMENT NUMBER
6. AUTHOR(S) 5d. PROJECT NUMBER
E-mail: [email protected] 5e. TASK NUMBER
5f. WORK UNIT NUMBER
7. PERFORMING ORGANIZATION NAME(S) AND ADDRESS(ES)SLOAN-KETTERING INSTITUTE FOR CANCER RESEARCH
8. PERFORMING ORGANIZATION REPORTNUMBER
New York, New York 10065
9. SPONSORING / MONITORING AGENCY NAME(S) AND ADDRESS(ES) 10. SPONSOR/MONITOR’S ACRONYM(S)U.S. Army Medical Research and Materiel CommandFort Detrick, Maryland 21702
11. SPONSOR/MONITOR’S REPORTNUMBER(S)
12. DISTRIBUTION / AVAILABILITY STATEMENTApproved for Public Release; Distribution Unlimited
13. SUPPLEMENTARY NOTES
14. ABSTRACTThe goal of the project is to investigate the potential of inhibiting iron metabolism to inhibit prostate cancer growth. Specifically, we will study Deferiprone, an iron chelator, and focus on its effect on aconitase in prostate tumors. It has been shown that changes in citrate metabolism at the level of mitochondrial aconitase, is an early change in carcinogenesis in the prostate. This change in metabolism is detectable by magnetic resonance. The project includes both in vitro and in vivo studies to determine its potential utility for clinical translation. Our findings to date include that deferiprone in 4 cell lines has an IC50 (inhibitory concentration for 50% of cells) of about 50uM (typical serum levels after standard dose = 100uM), inhibits tumor growth in vivo in 2 transgenic prostate tumor models. We have had difficulty with monitoring in vivo glucose metabolism and thus switched to using iron imaging as a non-invasive surrogate for monitoring DFP activity. In year 3 we have completed development of aconitase knockdown cell lines to test the hypothesis that DFP’s iron chelating activity decreases activity and expression of aconitase. Our results show a significant effect on tumor doubling time but more modest than deferiprone. In the knockdown cells, DFP has only a modest effect as expected. In vivo studies are now proceeding (as planned in the original application). Our recent data also shows that deferiprone has an effect not only on tumor cells but also tumor macrophages, suggesting that DFP may have a dual activity on tumors
Jason A. Koutcher
Imaging Prostate Cancer (PCa) Phenotype and Evolution

3
15. SUBJECT TERMS Deferiprone, iron, prostate cancer, metabolism, magnetic resonance
16. SECURITY CLASSIFICATION OF:
17. LIMITATION OF ABSTRACT
18. NUMBER OF PAGES
19a. NAME OF RESPONSIBLE PERSON USAMRMC
a. REPORT Unclassified
b. ABSTRACT Unclassified
c. THIS PAGE Unclassified
Unclassified 12
19b. TELEPHONE NUMBER (include area code)
Standard Form 298 (Rev. 8-98) Prescribed by ANSI Std. Z39.18

4
TABLE OF CONTENTS:
Page No.
1. Introduction 5
2. Keywords 5
3. Accomplishments 5
4. Impact 11
5. Changes/Problems 11
6. Products 11
7. Participants & Other Collaborating Organizations 11
8. Special Reporting Requirements 12
9. Appendices 12
5
1. Introduction: Normal prostate peripheral tissue has low mitochondrial aconitase (m-Acon) activity. This has been associated with zinc-induced inhibition of m-Acon in the peripheral epithelial cells. Activation of m-Acon is an early biochemical change during prostate cancer development and has been associated with a down-regulation of zinc transporters. This leads to a shift from citrate-producing to a citrate-oxidizing malignant phenotype, which has been extensively observed in different human prostate cancer cell lines. Thus, in the clinical setting, high levels of citrate are typically observed in normal prostate epithelia while essentially nondetectable in prostate cancer tissue, particularly in high grade tumors. Aconitase is an iron-sulphur enzyme that catalyzes the two-step isomerization of citrate to isocitrate, and has two isoforms: m-Acon (mitochondrial aconitase) and c-Acon (cytoplasmic; additionally functions as iron regulatory protein 1, when the iron levels in the cell become low). The unique [Fe4S4]2+ cluster of aconitase reacts directly with the substrate and contains a labile iron atom, which must be replaced occasionally. Thus, when the iron levels in the cell become low, the cluster cannot be regenerated and the enzyme becomes inactive: [Fe3S4]+. In fact, iron is present in many enzymes and is essential for cancer metabolism, cell growth, and proliferation and thus has been suggested as a potential chemotherapeutic target. Iron is present in many enzymes, in addition to aconitase, and thus this is not the only potential mechanism but we focused on aconitase because of its importance in prostate cancer. It is noted that aconitase is only one of multiple iron containing enzymes that could be effected by changes in iron concentration Deferiprone (DFP) is an orally available iron chelator used in the clinic, primarily for the treatment of thalassemia and Friedreich ataxia. DFP readily enters cells and reaches the major intracellular sites of iron accumulation. In addition, this agent has been shown to impair the activity of m-Acon by removing iron from the mitochondria, and also to inhibit growth of some but not all cell lines. 2. Keywords: Deferiprone, aconitase, metabolism, tricarboxylic acid cycle, magnetic resonance
3. Accomplishments:
Major Goals:
Aim 1. Determine if m-acon shRNA knockdown and inhibition with Deferiprone, an m-acon inhibitor, decreases murine PCa TRAMP C2 and MycCaP cell proliferation, migration, and invasiveness. Determine if knockdown of m-acon and Deferiprone inhibit TCA cycle activity, glycolysis and lactate, and increase citrate levels in murine PCa TRAMP C2 and MycCap cells. Aim 2A: Determine in vivo, if orthotopic tumors formed from shRNA-m-acon transfected TRAMP C2 and MycCap cells, or wild type (WT) tumors treated with Deferiprone, have slower growth, than control tumors (derived from cells with scrambled shRNA or untreated WT cells). Aim 2B: Using MRS, determine in vivo if orthotopic PCa tumors formed from shRNA-m-acon transfected TRAMP C2 and MycCap cells, or wild type (WT) tumors treated with Deferiprone, have higher levels of citrate and lower levels of choline and lactate than control tumors. What was accomplished: Aim 1 – we have shown that treatment with DFP decreases cell proliferation and migration and inhibits TCA cycle (metabolism). Similarly in vivo (Aim 2), we

6
Fig. 2: Effect of DFP on in vivo growth of MycCaP (left) and TRAMP C2 tumors. By weeks 2 and 3, tumor growth of the MycCaP treated with DFP is significantly slower than control. *=p<0.05. In the TRAMP C2 (right), no tumor growth is noted over 11 weeks treatment with DFP. *=p<0.001.
Fig. 1. Effect of 100 uM DFP on migration of TRAMP C2 cells. *= p<0.05;**=p<0.01
have shown that DFP inhibits tumor growth. We were not able to monitor metabolism in vivo but since this was a surrogate, we are measuring the effects of DFP by measuring iron metabolism/concentration in tumors. This does not represent a change in goal but a change in methodology since the goal remains to develop a non-invasive imaging method to monitor the effect of DFP. We have demonstrated that in the MycCaP, treatment with DFP decreases tumor iron concentration. Studies in the TRAMP C2 are pending. Details are provided below. We have not yet done the studies with the shRNA and are still developing those cells. Thus Aims 1 and 2 are about 60% complete
Year 1: Accomplishments in Year 1 (summarized previously) included demonstration that DFP inhibited prostate cancer cell growth at low (clinically achievable) concentrations. DFP had a growth inhibitor effect in both TRAMP C2 and Myc-Cap cell lines after a two day incubation period. The half maximal inhibitory concentration (IC50) of DFP was about 50 uM in both cell lines. Deferiprone was also shown to inhibit cell migration in TRAMP C2 cells. Metabolic changes associated with cell growth inhibition during the first 24h of exposure to DFP were measured using our cell perfusion system. The most important findings were 1) DFP led to a 6-fold decrease in 1-13C-glucose uptake from the extracellular medium after 5h perfusion, 2) DFP essentially blocked the synthesis of 4-13C-glutamate after 10 h exposure which would be expected if it inhibited aconitase activity or expression. On the other hand, no changes were detected at any time in the rate of incorporation of 2-13C-acetate (derived from 13C-labeled citrate
exported to the cytosol) into fatty acids, which would be expected if aconitase was inhibited.
In Year 2 (summarized previously) we focused on in vivo studies of the effect of DFP on prostate tumor growth although we also performed some in vitro studies. We combined docetaxel with DFP (in vitro) which doubled the
sensitivity of MycCaP cells to docetaxel (IC50 decreased from 44.7±2.6 to 24.0 ± 3.1 nM), suggesting its potential use in enhancing cytotoxic therapies (subtask 9). Similar and more impressive results were also found in breast cancer cell lines which are being pursued separately.
We expanded our in vitro study to 2 additional cell lines, recognizing the need to study castrate resistant prostate cancer (CRPC) cell lines. We obtained from Roswell Park (Dr. Leigh Ellis) a castrate resistant PCa cell line derived from the MycCaP cell (MycCaP/CR). Both the MycCaP/CR and the human CRPC cell line (22rv1) had IC50 values of approximately 50 uM after 48 hours exposure to DFP, similar to the MycCaP and TRAMP C2 (Table 1).
Figure 1 shows the effect of 100uM on migration of TRAMP C2 cells and shows a statistically significant effect on migration inhibition. The test was done by performing a “scratch” on an almost confluence plate of cells and determining the rate at which the “scratch” is closed and demonstrates that cells migrate more slowly during treatment with DFP. Similar results were obtained with the
Table 1: IC50 Measurements Cell lines IC 50 value Myc-CaP 54.41± 2.9 TRAMP-C2 50.68 ± 1.4 Myc-CaP/CR 52.41 ±3.4 TRAMP-C2 5 NC 54.08 ±1.9

7
MycCaP tumor cells (subtask 9).
The Effect of DFP on PCa Growth In Vivo (Task 2 – subaims 14-19): Tumor bearing mice were treated with DFP or saline chronically until tumors became too large and mice required sacrifice. Since tumors were implanted orthotopically we measured tumor volumes by MRI weekly. Figure 2 demonstrates the effect of chronic DFP administration on tumor growth. Significant decreases in tumor growth were noted in both the MycCaP and TRAMP C2. In the MycCaP tumor, we studied the effect of DFP administered after tumor inoculation and also the effect of DFP administered as a chronic therapy before tumor administration but no differences in effect were noted. By two weeks of DFP therapy in MycCaP tumors, there was a significant decrease in tumor growth rate, which was even greater by three weeks (subtasks 14-18). The effect of DFP on TRAMP C2 was extremely impressive. Tumors were monitored for up to 11 weeks at which point control mice had tumors that required sacrifice so the study was terminated. Almost all the TRAMP C2 tumors treated with DFP failed to show any growth. While DFP was effective in both tumors, clearly the efficacy was far greater in the TRAMP C2 (Fig. 2 (right)). The investigators feel that the difference in effect between these two cell lines is an important issue and needs to be pursued and preliminary studies are planned, in addition to plans to obtain funding to continue this avenue of research. In vivo metabolism studies have been challenging. While the in vitro studies performed in Year 1 were very informative, signal to noise was a major issue in vivo. We attempted to test this initially by studying tumors that were injected subcutaneously wherein signal to noise is much higher since the tumor is directly in the radiofrequency coil. This was only marginally successful in that we could generate data with modest/adequate signal to noise but could not demonstrate an effect with DFP. We thus undertook an alternative approach to mapping the effects of DFP (subtasks 16A, 17A, 18A) in orthotopic tumors as proposed in the application. The goal of the metabolism studies was to provide a non-invasive surrogate method to monitor the drug target to explain the successes and failures of novel drugs and optimize dose and schedule. MRI is used clinically to measure liver and heart iron concentrations (1-3); we hypothesize that DFP’s mechanism of action is to deplete the tumor of iron. Decreases in tumor iron concentration induced by DFP are expected to be detectable by MRI using spin echo T2 (spin-spin relaxation), gradient echo T2* (apparent T2), and other methods. We are also hypothesizing that DFP could work on tumor cells, tumor associated macrophages, or both types of cells. Current methods to non-invasively assess and monitor tumor associated macrophages (TAM) infiltration by MRI is limited by the contrast agent itself due to variable cell uptake (4-6), limited lifetime of cellular label (<1 week) (7-8), and because exogenous iron contrast agents influence TAM
Figure 3. FeMRI as a label-free probe of systemic Fe(III). (a) T2
*-weighted MRI of 0-0.3 mg Fe(NO3)3 g-1 H2O. (b) R2
*=1/T2* vs.
mg Fe(III) g-1 with linear best fit (n=3 phantoms, +/- s.e.m.). (c) [Fe(III)] parametric map from MRI of the phantom in (a) Dashed circle shows position of H2O sample, color bar corresponds to mg Fe(III) g-1
Β-Actin
ACO2
NCClone
1 3 11
TRAMP C2
Β-Actin
ACO2
A4NCClone
4 6 7
MyCCaP
Fig. 4. Expression of various TRAMP C2 and MycCaP clones after knockout of mitochondrial aconitase
8
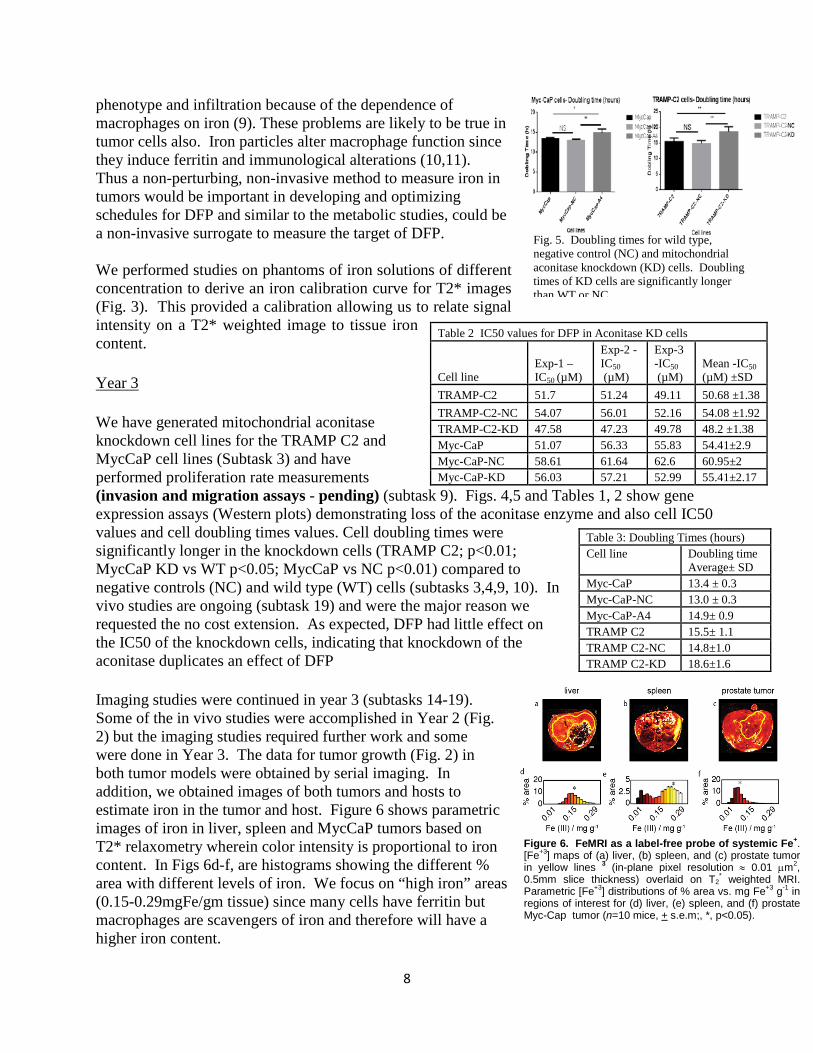
Figure 6. FeMRI as a label-free probe of systemic Fe+. [Fe+3] maps of (a) liver, (b) spleen, and (c) prostate tumor in yellow lines 3 (in-plane pixel resolution ≈ 0.01 µm2, 0.5mm slice thickness) overlaid on T2
* weighted MRI. Parametric [Fe+3] distributions of % area vs. mg Fe+3 g-1 in regions of interest for (d) liver, (e) spleen, and (f) prostate Myc-Cap tumor (n=10 mice, + s.e.m;, *, p<0.05).
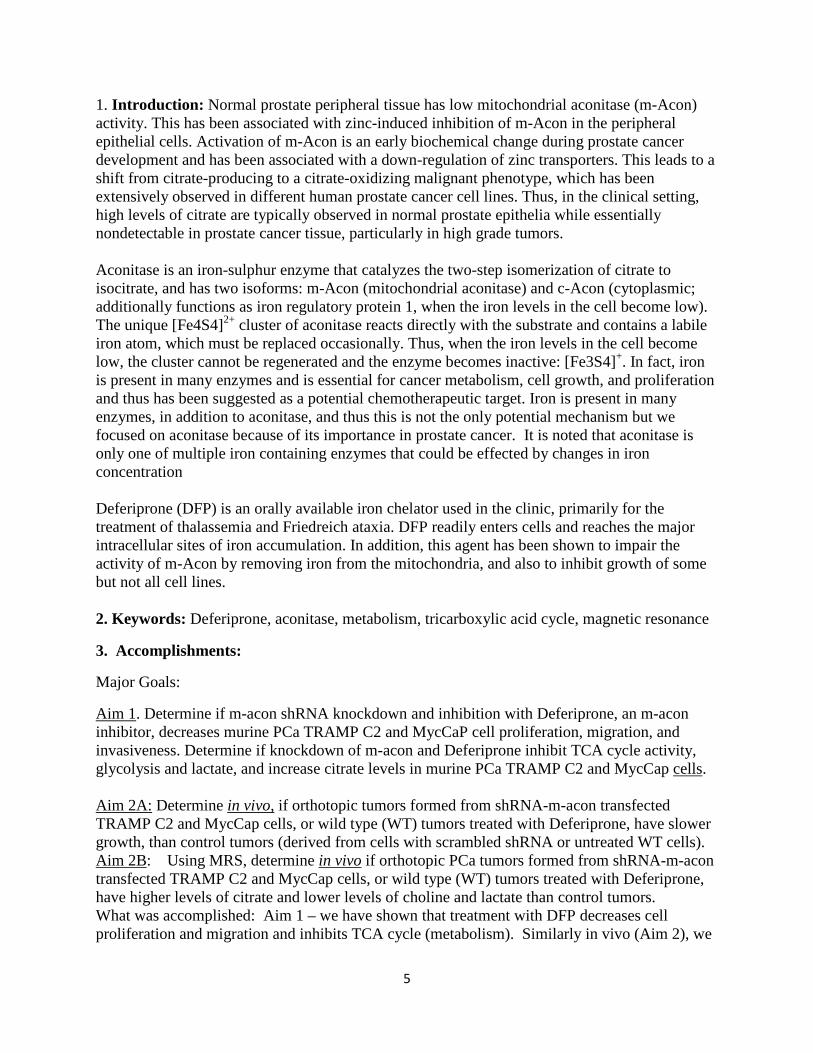
phenotype and infiltration because of the dependence of macrophages on iron (9). These problems are likely to be true in tumor cells also. Iron particles alter macrophage function since they induce ferritin and immunological alterations (10,11). Thus a non-perturbing, non-invasive method to measure iron in tumors would be important in developing and optimizing schedules for DFP and similar to the metabolic studies, could be a non-invasive surrogate to measure the target of DFP. We performed studies on phantoms of iron solutions of different concentration to derive an iron calibration curve for T2* images (Fig. 3). This provided a calibration allowing us to relate signal intensity on a T2* weighted image to tissue iron content. Year 3 We have generated mitochondrial aconitase knockdown cell lines for the TRAMP C2 and MycCaP cell lines (Subtask 3) and have performed proliferation rate measurements (invasion and migration assays - pending) (subtask 9). Figs. 4,5 and Tables 1, 2 show gene expression assays (Western plots) demonstrating loss of the aconitase enzyme and also cell IC50 values and cell doubling times values. Cell doubling times were significantly longer in the knockdown cells (TRAMP C2; p<0.01; MycCaP KD vs WT p<0.05; MycCaP vs NC p<0.01) compared to negative controls (NC) and wild type (WT) cells (subtasks 3,4,9, 10). In vivo studies are ongoing (subtask 19) and were the major reason we requested the no cost extension. As expected, DFP had little effect on the IC50 of the knockdown cells, indicating that knockdown of the aconitase duplicates an effect of DFP Imaging studies were continued in year 3 (subtasks 14-19). Some of the in vivo studies were accomplished in Year 2 (Fig. 2) but the imaging studies required further work and some were done in Year 3. The data for tumor growth (Fig. 2) in both tumor models were obtained by serial imaging. In addition, we obtained images of both tumors and hosts to estimate iron in the tumor and host. Figure 6 shows parametric images of iron in liver, spleen and MycCaP tumors based on T2* relaxometry wherein color intensity is proportional to iron content. In Figs 6d-f, are histograms showing the different % area with different levels of iron. We focus on “high iron” areas (0.15-0.29mgFe/gm tissue) since many cells have ferritin but macrophages are scavengers of iron and therefore will have a higher iron content.
Table 2 IC50 values for DFP in Aconitase KD cells
Cell line Exp-1 – IC50 (µM)
Exp-2 -IC50 (µM)
Exp-3 -IC50 (µM)
Mean -IC50 (µM) ±SD
TRAMP-C2 51.7 51.24 49.11 50.68 ±1.38 TRAMP-C2-NC 54.07 56.01 52.16 54.08 ±1.92 TRAMP-C2-KD 47.58 47.23 49.78 48.2 ±1.38 Myc-CaP 51.07 56.33 55.83 54.41±2.9 Myc-CaP-NC 58.61 61.64 62.6 60.95±2 Myc-CaP-KD 56.03 57.21 52.99 55.41±2.17
Table 3: Doubling Times (hours) Cell line Doubling time
Average± SD Myc-CaP 13.4 ± 0.3 Myc-CaP-NC 13.0 ± 0.3 Myc-CaP-A4 14.9± 0.9 TRAMP C2 15.5± 1.1 TRAMP C2-NC 14.8±1.0 TRAMP C2-KD 18.6±1.6
Fig. 5. Doubling times for wild type, negative control (NC) and mitochondrial aconitase knockdown (KD) cells. Doubling times of KD cells are significantly longer than WT or NC

9
Figure 7. A: FeMRI of high Fe(III) (0.15-0.30 mg Fe(III) g-1). B: Prussian Blue Fe(III) staining of whole orthotopic MycCaP tumor slice (scale bar=2mm) showing low-iron (pink arrow) and high-iron (blue arrow) regions. C, D: Number of cells detected by Prussian blue and CD68 staining in MyCCaP and MMTV-PyMT breast tumors. No significant differences (ns) were noted when corrected for pixel size.
A B
C D
Figure 7 shows MRI and histology of a MycCaP tumor where the iron content is masked to reveal only areas of high (0.15-0.29 mgFe/gm tissue) on the MRI. The histology pixel resolution has been decreased to match that of the MRI although the slice thicknesses differ. Note the similarity between the MRI (7A) and Prussian blue (Fig 7B) staining. Fig 7C and 7D demonstrate that both for breast and prostate tumors, the Prussian blue and CD68+ cells are equivalent. Both MycCaP and TRAMP C2 orthotopic tumors treated with DFP, demonstrated significantly slower tumor growth compared to controls (Fig. 2), the orthotopic TRAMP C2 tumors in C57BL/6 mice had a far more impressive (almost complete tumor growth arrest as measured by MRI) and durable response (Fig. 2). Mice bearing orthotopic 4T1 breast tumors in Balb/C mice, and 99LN cell line derived from MMTV-PyMT tumors implanted in C57BL/6 mice both responded to DFP; the MMTV-PyMT tumors in C57BL also had a better response (data not shown). The effect of DFP on growth delay in all four tumor models was significant, with a greater effect in both BrCa and PCa implanted in C57BL/6 mice (99LN and TRAMP C2). We imaged iron content in tumors and normal organs in the host mice and C57BL/6 mice had an innately lower iron background than FVB mice (Fig. 7). We (and others) also found C57BL to have lower innate iron that Balb/C mice (12). We hypothesize that host iron reserves are a predictor of response to DFP; tumor cells and macrophages in mice with lower iron stores may be closer to a critical iron reserve and DFP may decrease intracellular iron below critical values necessary for survival or proliferation. MRI screening of mice/patients (liver, spleen, tumor) to determine the relative amounts of endogenous, pre-treatment iron is feasible and could be a predictive biomarker to indicate whether the subject is likely to be a good responder to DFP. We hypothesize that the iron imaging, although not proposed originally, has been shown to be potentially very useful and possibly predictive of tumors/mice/patients who will respond well to iron chelation therapy. No Cost Extension Year Ongoing work to complete the project include
1. Migration and Invasion assays for knockdown clones 2. In vivo studies for aconitase knockdown clones 3. XF-96 metabolic studies on knockdown clones 4. Submission of revisions to in vitro studies of DFP (Subtask 11) 5. Completion of manuscript on imaging and DFP effect on tumor growth (in
vivo) (subtask 22)
Figure 7. Effect of host genetic background on iron in tumor, liver and spleen. The C57BL has been shown by us and others66,67 to have lower iron stores than FVB mice and as shown in Fig 1, to have a more robust response to DFP.

10
References:
1. St. Pierre, T. G., Clark, P. R. & Chua-Anusorn, W. Measurement and mapping of liver iron concentrations using magnetic resonance imaging. Ann. N. Y. Acad. Sci. 1054, 379-385 (2005).
2. Garbowski, M. W. et al. Biopsy-based calibration of T2* magnetic resonance for estimation of liver iron concentration and comparison with R2 Ferriscan. J. Cardiov. Magn. Reson. 16 (2014).
3. Fischer, R. & Harmatz, P. R. Non-invasive assessment of tissue iron overload. Hematology 2009 No. 1, 215-221 (2009).
4. Daldrup-Link, H. E. et al. Imaging of tumor associated macrophages with clinically-applicable iron oxide nanoparticles. Clin. Cancer Res. 17, 5695-5704 (2011).
5. Narunsky, L., Oren, R., Bochner, F. & Neeman, M. Imaging aspects of the tumor stroma with therapeutic implications. Pharmacol. Ther. 141, 192-208 (2014).
6. Weissleder, R., Nahrendorf, M. & Pittet, M. J. Imaging macrophages with nanoparticles. Nat. Mater. 13, 125-138 (2014).
7. Bulte, J. W. M. In vivo MRI cell tracking: clinical studies. A. J. R. 193, 314-325 (2009).
8. Neuwelt, A. et al. Iron-based superparamagnetic nanoparticle contrast agents for MRI of infection and inflammation. A.J.R. 204, w302-w313 (2014).
9. Corna, G. et al. Polarization dictates iron handling by inflammatory and alternatively activated macrophages. Haematologica 95, 1814-1822 (2010).
10. Laskar A, Eilertsen J, Li W, Yuan XM. SPION primes THP1 derived M2 macrophages towards M1-like macrophages. Biochem Biophys Res Commun. 2013 ;441(4):737-42 11. Shen CC, Liang HJ, Wang CC, Liao MH, Jan TR Iron oxide nanoparticles suppressed T helper 1 cell-mediated immunity in a murine model of delayed-type hypersensitivity. Int J Nanomedicine. 2012;7:2729-37 12. Cavey T, Ropert M, de Tayrac M, Bardou-Jacquet E, Island ML, Leroyer P, Bendavid C, Brissot P, Loreal O. Mouse genetic background impacts both on iron and non-iron metals parameters and on their relationships. Biometals. 2015;28(4):733-43. doi: 10.1007/s10534-015-9862-8. PubMed PMID: 26041486.
11
Training and Professional Development: Nothing to report
Dissemination: Nothing to date to report – two manuscripts are in the writing/resubmission phase
Next period – what do we plan to do: The aconitase knockdown cells are ready for in vivo study measure cell migration and the effect in vivo and compare to the effect of DFP. We will continue the iron measurements of the TRAMP C2 tumors in vivo, which we view as comparable to the original metabolic measurements proposed since they are 1) metabolism oriented and 2) most importantly are viewed as a potential non-invasive surrogate, which was the goal fo the metabolism studies.
4. Impact on principal discipline: This is premature since our goal is to show that DFP has an effect on prostate cancer outcome and we need to finish our in vivo studies Impact on other disciplines: Nothing to report
Technology transfer: Nothing to report
Impact on society beyond science and technology: Nothing to report – we hope to have the two manuscripts in press at time of final report0
5. Changes/Problems
Changes in approach and reasons for changes: As noted in our report last year, in our quest for a potential non-invasive surrogate, we have changed to a more sensitive, direct method of measuring iron metabolism, rather than the proposed indirect, less sensitive method of measuring the effect of DFP on glucose metabolism. The original technique was less sensitive, required the administration of an exogenous agent, and was not feasible in orthotopic models.
Actual or anticipated problems or delays: As noted above, the development of knockdown cell lines has been difficult but the problem is resolved. We are in a “no cost extension” year to complete those studies
Changes in expenditures: The above delay led us to decrease some of our expenditures and we are using these funds in the requested fourth year (no cost extension).
Significant Changes in Human subject, vertebrate animals, biohazards, and or select agents. We no longer require administration of 1,6-13C glucose as proposed.
6. Products:
We are writing 2 manuscripts at present outlining the in vitro and in vivo studies.
7. Participants and other Collaborating Organizations:
Name: Koutcher, Jason Project role: PI Research Identifier Nothing to support Nearest Person month 0.6 months Contribution to Project: Planned projects and experiments, reviewed data

12
Funding Support: Nothing to report Name: Ackerstaff, Ellen Project role: Co-investigator Research Identifier Nothing to support Nearest Person month 2.0 months Contribution to Project Directs postdoctoral fellow, reviews methods to be used, reviews data, teaches new methods Funding Support: Nothing to report Name: Satagopan, Jaya (not funded in NCE) Project role: Co-investigator Research Identifier Nothing to support Nearest Person month 0.6 months Contribution to Project Statistical analysis Funding Support: R01 CA204924; W81XWH-15-1-0245; R01 CA197402; R13
CA203409; R01 CA158243 Name: Serganova , Inna (not funded in NCE) Project role: Co investigator Research Identifier Nothing to report Nearest Person month 1 month Contribution to Project Derives aconitase knockdown cells, provides biological expertise for project Funding Support: Nothing to report Name: Veeraperumal, Suresh Project role: Postdoctoral fellow Research Identifier Nothing to report Nearest Person month 6 months Contribution to Project Performs most of the experiments of the project Funding Support: Nothing to report No other organizations are involved in this project. 8. Special Reporting Requirements: None 9. Appendices: None - one paper has a draft but is premature to send. If requested, we are happy to send.