Fig. 6-2 10 m 1 m 0.1 m 1 cm 1 mm 100 µm 10 µm 1 µm 100 nm 10 nm 1 nm 0.1 nm Atoms Small...
34
Fig. 6-2 10 m 1 m 0.1 m 1 cm 1 mm 100 µm 10 µm 1 µm 100 nm 10 nm 1 nm 0.1 nm Atoms Small molecules Lipids Protein s Ribosomes Viruse s Smallest bacteria Mitochondrion Nucleus Most bacteria Most plant and animal cells Frog egg Chicken egg Length of some nerve and muscle cells Human height Unaided eye Light microscope Electron microscope
-
Upload
estella-york -
Category
Documents
-
view
236 -
download
2
Transcript of Fig. 6-2 10 m 1 m 0.1 m 1 cm 1 mm 100 µm 10 µm 1 µm 100 nm 10 nm 1 nm 0.1 nm Atoms Small...

Fig. 6-210 m
1 m
0.1 m
1 cm
1 mm
100 µm
10 µm
1 µm
100 nm
10 nm
1 nm
0.1 nm Atoms
Small molecules
Lipids
Proteins
Ribosomes
Viruses
Smallest bacteria
Mitochondrion
Nucleus
Most bacteria
Most plant and animal cells
Frog egg
Chicken egg
Length of some nerve and muscle cells
Human height
Un
aid
ed e
ye
Lig
ht
mic
rosc
op
e
Ele
ctro
n m
icro
sco
pe
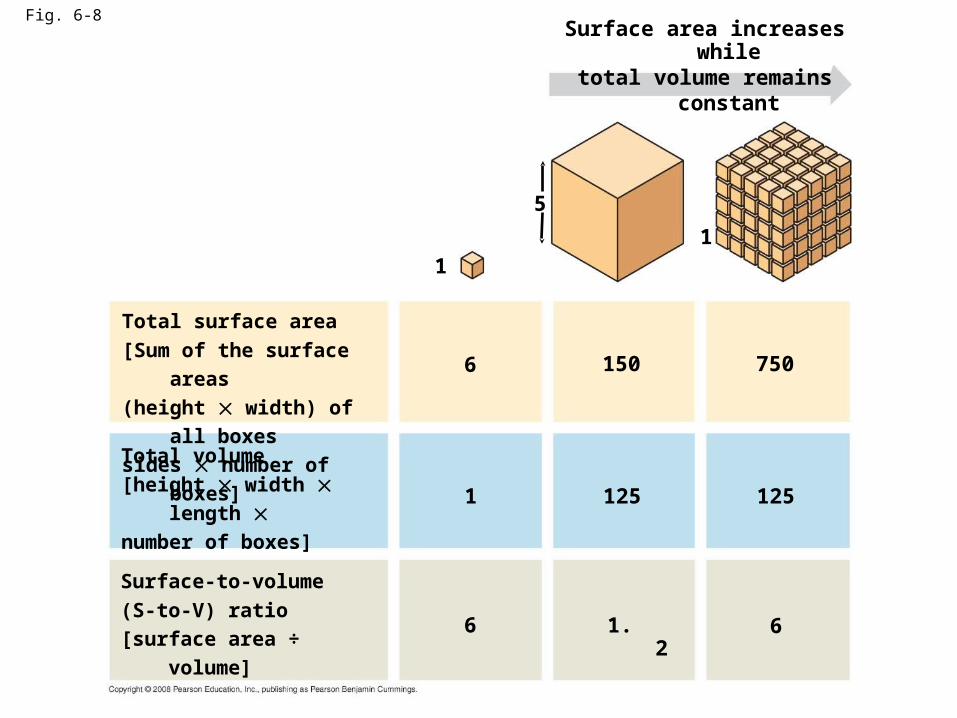
Fig. 6-8Surface area increases while
total volume remains constant
5
11
6 150 750
125 1251
6 61.2
Total surface area
[Sum of the surface areas
(height width) of all
boxes
sides number of boxes]Total volume
[height width length number of boxes]
Surface-to-volume
(S-to-V) ratio
[surface area ÷ volume]
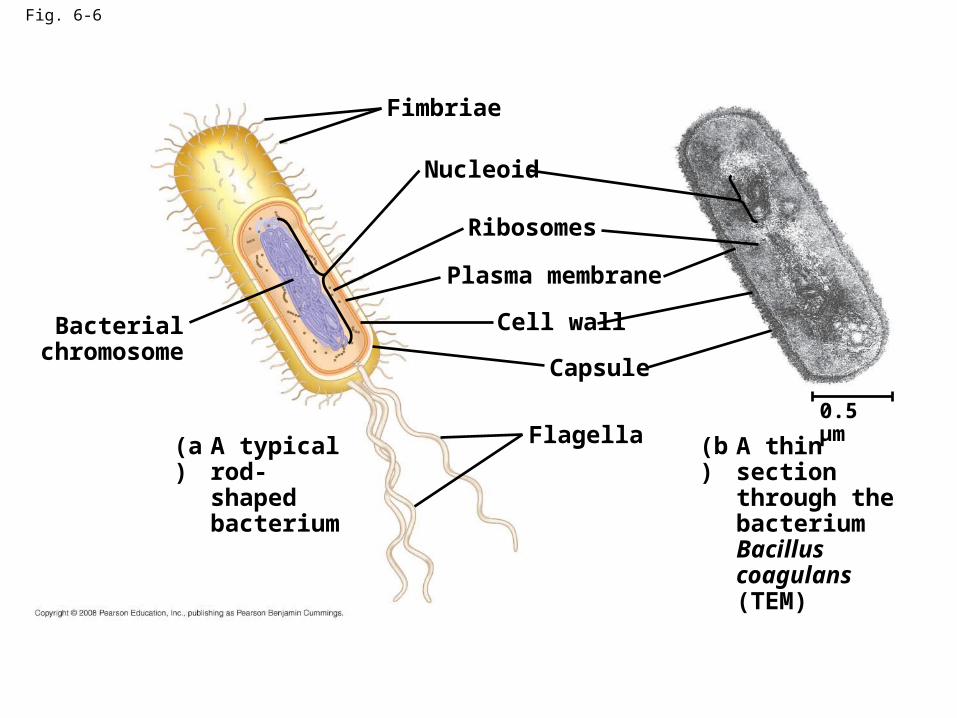
Fig. 6-6
Fimbriae
Nucleoid
Ribosomes
Plasma membrane
Cell wall
Capsule
Flagella
Bacterialchromosome
(a) A typical rod-shaped bacterium
(b) A thin section through the bacterium Bacillus coagulans (TEM)
0.5 µm

Fig. 6-9a
ENDOPLASMIC RETICULUM (ER)
Smooth ERRough ERFlagellum
Centrosome
CYTOSKELETON:
Microfilaments
Intermediatefilaments
Microtubules
Microvilli
Peroxisome
MitochondrionLysosome
Golgiapparatus
Ribosomes
Plasma membrane
Nuclearenvelope
Nucleolus
Chromatin
NUCLEUS

Fig. 6-9b
NUCLEUS
Nuclear envelopeNucleolus
Chromatin
Rough endoplasmic reticulum
Smooth endoplasmic reticulum
Ribosomes
Central vacuole
Microfilaments
Intermediate filaments
Microtubules
CYTO-SKELETON
Chloroplast
PlasmodesmataWall of adjacent cell
Cell wall
Plasma membrane
Peroxisome
Mitochondrion
Golgiapparatus

Fig. 6-20
Microtubule
Microfilaments0.25 µm

Table 6-1
10 µm 10 µm 10 µm
Column of tubulin dimers
Tubulin dimer
Actin subunit
25 nm
7 nm
Keratin proteins
Fibrous subunit (keratins coiled together)
8–12 nm
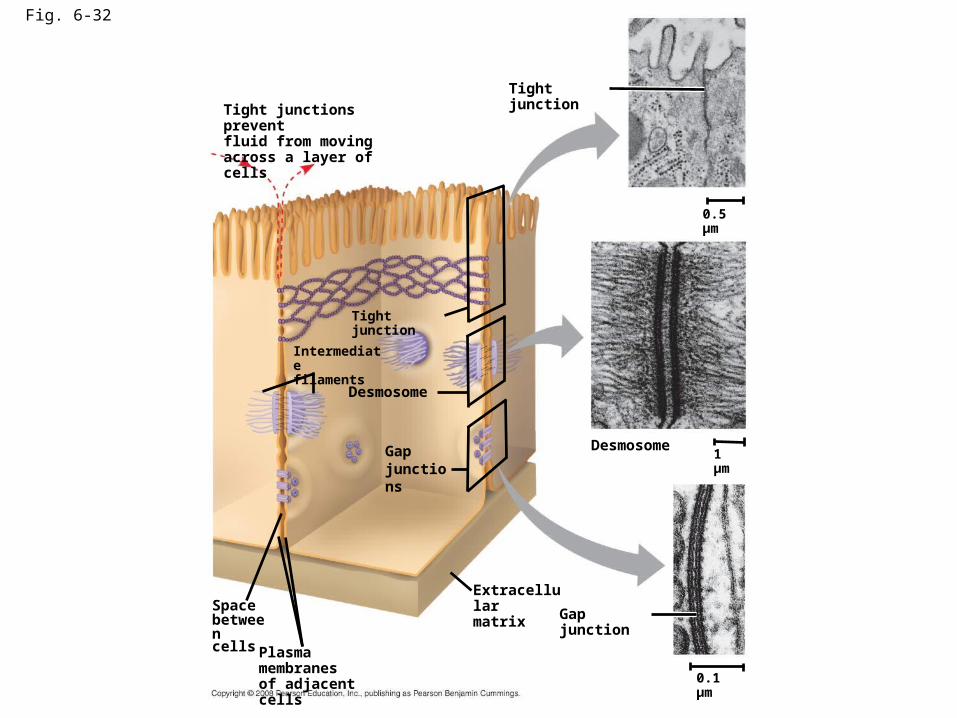
Fig. 6-32
Tight junction
0.5 µm
1 µmDesmosome
Gap junction
Extracellularmatrix
0.1 µm
Plasma membranesof adjacent cells
Spacebetweencells
Gapjunctions
Desmosome
Intermediatefilaments
Tight junction
Tight junctions preventfluid from movingacross a layer of cells

Fig. 6-3ab
(a) Brightfield (unstained specimen)
(b) Brightfield (stained specimen)
TECHNIQUE RESULTS
50 µm

Fig. 6-3cd
(c) Phase-contrast
(d) Differential-interference- contrast (Nomarski)
TECHNIQUE RESULTS

Fig. 6-3e
(e) Fluorescence
TECHNIQUE RESULTS
50 µm

Fig. 6-4
(a) Scanning electron microscopy (SEM)
TECHNIQUE RESULTS
(b) Transmission electron microscopy (TEM)
Cilia
Longitudinalsection ofcilium
Cross sectionof cilium
1 µm
1 µm

Fig. 6-9a
ENDOPLASMIC RETICULUM (ER)
Smooth ERRough ERFlagellum
Centrosome
CYTOSKELETON:
Microfilaments
Intermediatefilaments
Microtubules
Microvilli
Peroxisome
MitochondrionLysosome
Golgiapparatus
Ribosomes
Plasma membrane
Nuclearenvelope
Nucleolus
Chromatin
NUCLEUS

Fig. 6-10
NucleolusNucleus
Rough ER
Nuclear lamina (TEM)
Close-up of nuclear envelope
1 µm
1 µm
0.25 µm
Ribosome
Pore complex
Nuclear pore
Outer membraneInner membraneNuclear envelope:
Chromatin
Surface ofnuclear envelope
Pore complexes (TEM)

Fig. 6-12Smooth ER
Rough ER Nuclear envelope
Transitional ER
Rough ERSmooth ERTransport vesicle
RibosomesCisternaeER lumen
200 nm

Fig. 6-11
Cytosol
Endoplasmic reticulum (ER)
Free ribosomes
Bound ribosomes
Large subunit
Small subunit
Diagram of a ribosomeTEM showing ER and ribosomes
0.5 µm

Fig. 6-12Smooth ER
Rough ER Nuclear envelope
Transitional ER
Rough ERSmooth ERTransport vesicle
RibosomesCisternaeER lumen
200 nm

Fig. 6-13
cis face(“receiving” side of Golgi apparatus) Cisternae
trans face(“shipping” side of Golgi apparatus)
TEM of Golgi apparatus
0.1 µm

Fig. 6-14
Nucleus 1 µm
Lysosome
Digestiveenzymes
Lysosome
Plasmamembrane
Food vacuole
(a) Phagocytosis
Digestion
(b) Autophagy
Peroxisome
Vesicle
Lysosome
Mitochondrion
Peroxisomefragment
Mitochondrionfragment
Vesicle containingtwo damaged organelles
1 µm
Digestion
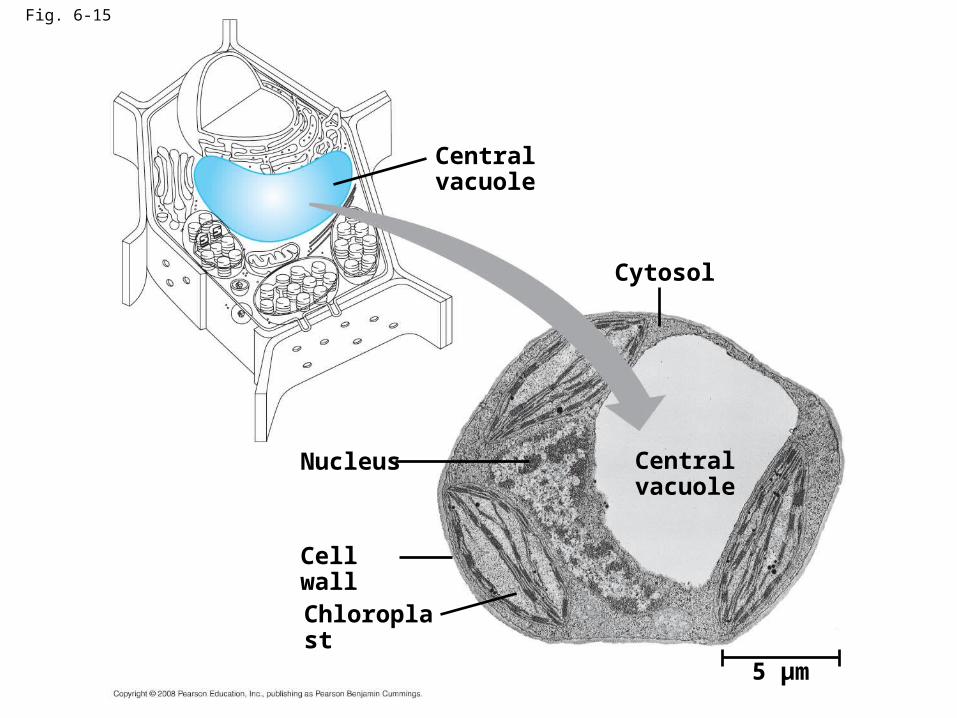
Fig. 6-15
Central vacuole
Cytosol
Central vacuole
Nucleus
Cell wall
Chloroplast
5 µm

Fig. 6-16-1
Smooth ER
Nucleus
Rough ER
Plasma membrane

Fig. 6-16-2
Smooth ER
Nucleus
Rough ER
Plasma membrane
cis Golgi
trans Golgi

Fig. 6-16-3
Smooth ER
Nucleus
Rough ER
Plasma membrane
cis Golgi
trans Golgi

Fig. 6-14
Nucleus 1 µm
Lysosome
Digestiveenzymes
Lysosome
Plasmamembrane
Food vacuole
(a) Phagocytosis
Digestion
(b) Autophagy
Peroxisome
Vesicle
Lysosome
Mitochondrion
Peroxisomefragment
Mitochondrionfragment
Vesicle containingtwo damaged organelles
1 µm
Digestion

Fig. 6-9b
NUCLEUS
Nuclear envelopeNucleolus
Chromatin
Rough endoplasmic reticulum
Smooth endoplasmic reticulum
Ribosomes
Central vacuole
Microfilaments
Intermediate filaments
Microtubules
CYTO-SKELETON
Chloroplast
PlasmodesmataWall of adjacent cell
Cell wall
Plasma membrane
Peroxisome
Mitochondrion
Golgiapparatus

Fig. 6-9a
ENDOPLASMIC RETICULUM (ER)
Smooth ERRough ERFlagellum
Centrosome
CYTOSKELETON:
Microfilaments
Intermediatefilaments
Microtubules
Microvilli
Peroxisome
MitochondrionLysosome
Golgiapparatus
Ribosomes
Plasma membrane
Nuclearenvelope
Nucleolus
Chromatin
NUCLEUS

Fig. 6-17
Free ribosomesin the mitochondrial matrix
Intermembrane space
Outer membrane
Inner membraneCristae
Matrix
0.1 µm

Fig. 6-9b
NUCLEUS
Nuclear envelopeNucleolus
Chromatin
Rough endoplasmic reticulum
Smooth endoplasmic reticulum
Ribosomes
Central vacuole
Microfilaments
Intermediate filaments
Microtubules
CYTO-SKELETON
Chloroplast
PlasmodesmataWall of adjacent cell
Cell wall
Plasma membrane
Peroxisome
Mitochondrion
Golgiapparatus
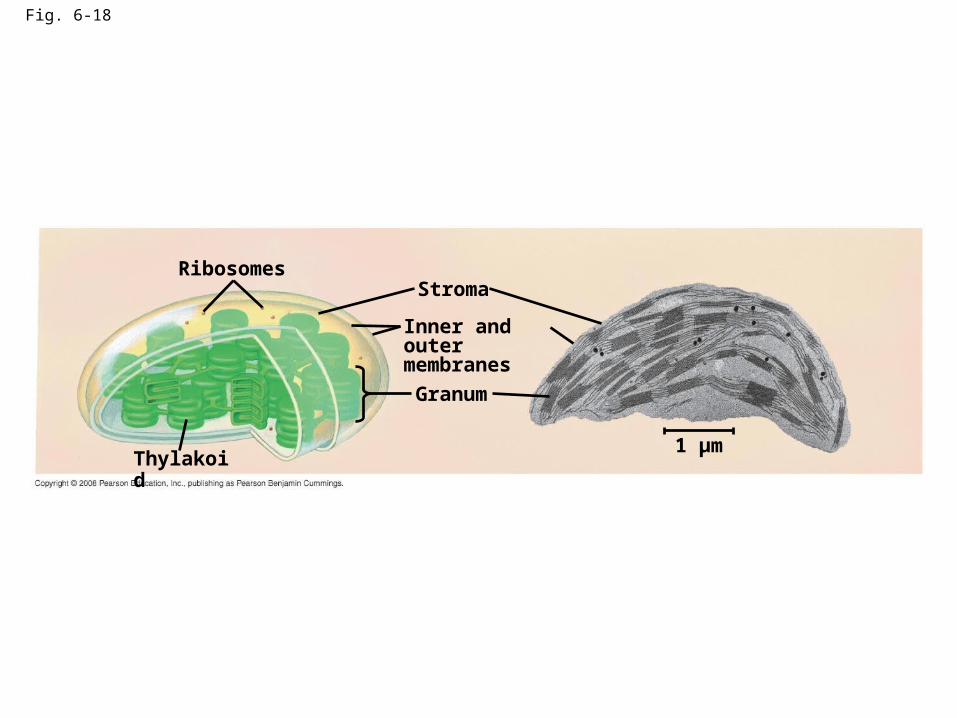
Fig. 6-18
Ribosomes
Thylakoid
Stroma
Granum
Inner and outer membranes
1 µm

Fig. 6-28
Secondary cell wall
Primary cell wall
Middle lamella
Central vacuoleCytosol
Plasma membrane
Plant cell walls
Plasmodesmata
1 µm

Fig. 6-24
0.1 µm
Triplet
(c) Cross section of basal body
(a) Longitudinal section of cilium
0.5 µm
Plasma membrane
Basal body
Microtubules
(b) Cross section of cilium
Plasma membrane
Outer microtubule doublet
Dynein proteins
Central microtubuleRadial spoke
Protein cross-linking outer doublets
0.1 µm
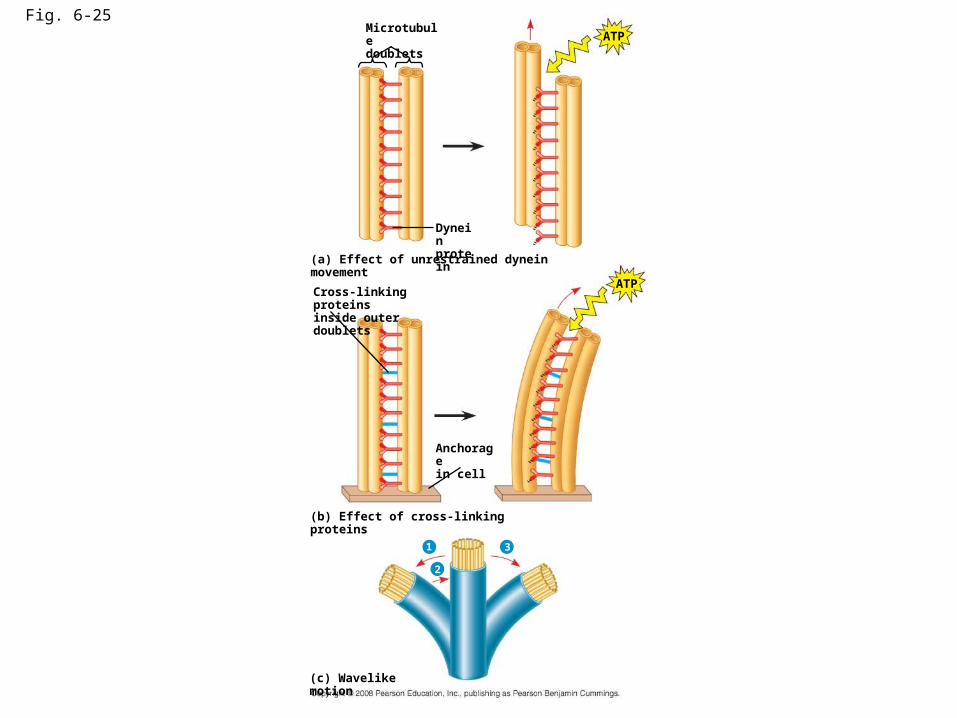
Fig. 6-25Microtubuledoublets
Dyneinprotein
ATP
ATP
(a) Effect of unrestrained dynein movement
Cross-linking proteinsinside outer doublets
Anchoragein cell
(b) Effect of cross-linking proteins
1 3
2
(c) Wavelike motion

Fig. 6-23
5 µm
Direction of swimming
(a) Motion of flagella
Direction of organism’s movement
Power stroke Recovery stroke
(b) Motion of cilia15 µm
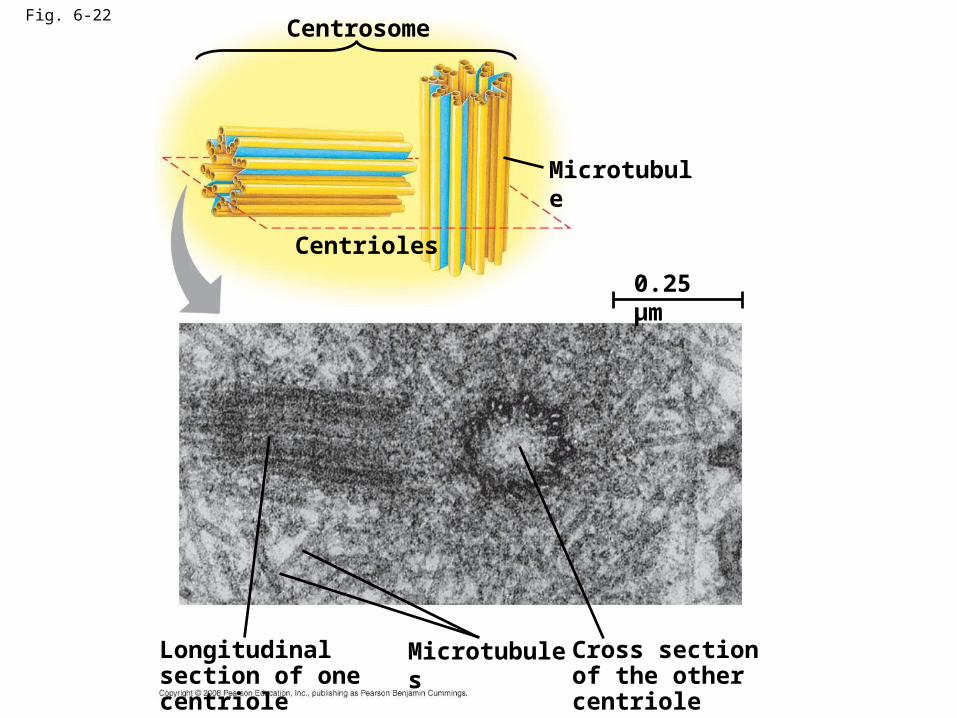
Fig. 6-22Centrosome
Microtubule
Centrioles
0.25 µm
Longitudinal section of one centriole
Microtubules Cross sectionof the other centriole