Fibrinogen Baltimore II: Congenital with … profiler (BioData, Horsham, PA) at 37Cwith...
5
Proc. Nati. Acad. Sci. USA Vol. 80, pp. 7318-7322, December 1983 Medical Sciences Fibrinogen Baltimore II: Congenital hypodysfibrinogenemia with delayed release of fibrinopeptide- B and decreased rate of fibrinogen synthesis (dysfibrinogenemia/hypofibrinogenemia/catabolism) RAY F. EBERT AND WILLIAM R. BELL Department of Medicine, Division of Hematology, The Johns Hopkins University, Baltimore, MD 21205 Communicated by Curt P. Richter, June 24, 1983 ABSTRACT A congenital hypodysfibrinogenemia, fibrinogen Baltimore H, was found in a young asymptomatic Caucasian fe- male. Prothrombin, partial thromboplastin, and euglobulin lysis times were normal, as were platelet function and coagulation fac- tor assays. Subnormal plasma fibrinogen levels were found using chronometric, rate-independent, and immunologic assay meth- ods. Kinetic analysis of fibrinopeptide release revealed a delay in the thrombin-catalyzed release of fibrinopeptide B from the ab- normal protein. Proteolysis of fibrinopeptide A by thrombin or -Arvin, fibrin monomer polymerization, and fibrin polymer liga- tion occurred at normal rates. -Catabolism of radiolabeled au- tologous and homologous fibrinogen was also normal, but the fi- brinogen synthetic rate was -less than half the normal value. Comparison of the coagulation -characteristics of fibrinogen Bal- timore H with those of other abnormal fibrinogens indicates that it represents a unique example of hypodysfibrinogenemia. Congenital dysfibrinogenemia is an inherited disorder of fi- brinogen synthesis in which a-presumed structural abnormality results in altered coagulation characteristics of the protein. The clinical manifestations of the disease vary from hemorrhagic diathesis to thrombosis. The characteristic clinical laboratory finding in dysfibrinogenemia is an apparently low plasma fi- brinogen concentration using an assay dependent on the rate of clot formation. This value usually falls within normal limits when a rate-independent method is used. In lieu of information concerning the precise location -of a molecular defect, dysfibrinogens have been classified on the basis of their functional characteristics (1-3). The etiology of dysfibrinogenemia has been related to alterations in the pri- mary structure of the protein. Blomback et al. (4) were the first to identify such a defect, and more recently four different ab- normal proteins have been similarly characterized (5-8). In this report a congenital hypodysfibrinogenemia, fibrino- gen Baltimore II, is described. To the best of our knowledge, this represents the seventh documented case of dysfibrino- genemia occurring coincidentally with hypodysfibrinogenemia and the only one in which subnormal plasma fibrinogen con- centrations have occurred coincidentally with delayed release of fibrinopeptide B. METHODS Blood. Blood was obtained by venipuncture and plasma- pheresis performed with citrate/phosphate/dextrose (Fen-wall Laboratories, Deerfield, IL) as anticoagulant. Patient plasma used for clinical studies was prepared by diluting 9 vol of whole blood with 1 vol of 3.'8% trisodium citrate dihydrate. Fibrinogen. Fibrinogen was purified from citrate/phos- phate/dextrose plasma by three glycine precipitation steps (9) at room -temperature. Fibrinogen isolated in this way from nor- mal or abnormal plasma was >98% coagulable when assayed by the method of Laki (10) and appeared similarly homogeneous when analyzed by NaDodSO4/polyacrylamide gel electropho- resis (11) under reducing conditions. Commercial normal hu- man fibrinogen (Kabi, grade L, Stockholm, Sweden) was fur- ther purified as above by glycine precipitation. This preparation was used as "control" fibrinogen unless otherwise noted. Thrombin. Thrombin (bovine, topical; Parke-Davis) was stored at -200C in a solution [1,000 units (u)/ml] of 25 mM barbital buffer (pH 7.5) containing 135 mM NaCl. Human a- thrombin, a generous gift of G. Murano (National Institutes of Health), was prepared by the method of Fenton et al. (12). All references to thrombin activity are in US (formerly NIH) units. Coagulation Studies. The following procedures were used for clinical laboratory studies: one-stage prothrombin time (PT) by the method of Quick et al. (13) with rabbit brain throm- boplastin (Pel-Freez; ref. 14); partial thromboplastin time (PTT) by the method of Nye et al. (15) with Thrombofax Reagent (Or- tho Diagnostics); euglobulin lysis time according to von Kaulla and Schultz (16); factors VIII, IX, XI, and XII according to Har- disty and MacPherson (17) with the appropriate factor-deficient plasma; and Factor XIII according to Tyler (18). Factors VII and X were measured as follows: citrated patient plasma was diluted 1:10 with 0.9% NaCl, and 0.15 ml of this solution was com- bined with an equal amount of factor-deficient plasma. A one- stage PT was then performed as described above. The results were compared with a standard curve generated in the same manner using pooled normal plasma. Platelet aggregometry was performed on a platelet aggre- gation profiler (BioData, Horsham, PA) at 37C with platelet- rich plasma (=300,000 platelets per mm3) and the following as aggregating agents in a final volume of 0.5 ml: 2-10 tLM ADP (Sigma), 1.2 mg of ristocetin (Abbott) per ml, 5.5 and 11 ,uM epinephrine (Ellcins-Sinn, Cherry Hill, NJ), 0.26 mg of col- lagen (Worthington) per ml, and 0.2-0.4 u of bovine thrombin (Parke-Davis) .per ml. Release of Fibrinopeptides. Release of fibrinopeptides A and B was measured by a modification of the -Martinelli and Scheraga (19) method. The clotting reaction was initiated at 25VC by adding 10 1ul of human thrombin (1.33 u/ml) or Arvin (A- 38414, Abbott; lot no. 23-126-DH; 3.3-6.7 u/ml) to 50 /.l of a fibrinogen solution (4-10 mg/ml) containing 20 mM sodium phosphate (pH 7.4) with 0.36 M e-aminocaproic acid and 0.15 M NaCl. At the indicated times the reaction was stopped and the clot was solubilized by adding 15 t.d-of 5% phosphoric acid. Abbreviations: u, unit(s); PT, prothrombin time; PTT, partial throm- boplastin time; IEF, isoelectric focusing. 7318 The publication costs of this article were defrayed in part by page charge payment. This article must therefore be hereby marked "advertise- ment" in accordance with 18 U.S.C. §1734 solely to indicate this fact.
Transcript of Fibrinogen Baltimore II: Congenital with … profiler (BioData, Horsham, PA) at 37Cwith...

Proc. Nati. Acad. Sci. USAVol. 80, pp. 7318-7322, December 1983Medical Sciences
Fibrinogen Baltimore II: Congenital hypodysfibrinogenemia withdelayed release of fibrinopeptide-B and decreased rate offibrinogen synthesis
(dysfibrinogenemia/hypofibrinogenemia/catabolism)
RAY F. EBERT AND WILLIAM R. BELLDepartment of Medicine, Division of Hematology, The Johns Hopkins University, Baltimore, MD 21205
Communicated by Curt P. Richter, June 24, 1983
ABSTRACT A congenital hypodysfibrinogenemia, fibrinogenBaltimore H, was found in a young asymptomatic Caucasian fe-male. Prothrombin, partial thromboplastin, and euglobulin lysistimes were normal, as were platelet function and coagulation fac-tor assays. Subnormal plasma fibrinogen levels were found usingchronometric, rate-independent, and immunologic assay meth-ods. Kinetic analysis of fibrinopeptide release revealed a delay inthe thrombin-catalyzed release of fibrinopeptide B from the ab-normal protein. Proteolysis of fibrinopeptide A by thrombin or-Arvin, fibrin monomer polymerization, and fibrin polymer liga-tion occurred at normal rates. -Catabolism of radiolabeled au-tologous and homologous fibrinogen was also normal, but the fi-brinogen synthetic rate was -less than half the normal value.Comparison of the coagulation -characteristics of fibrinogen Bal-timore H with those of other abnormal fibrinogens indicates thatit represents a unique example of hypodysfibrinogenemia.
Congenital dysfibrinogenemia is an inherited disorder of fi-brinogen synthesis in which a-presumed structural abnormalityresults in altered coagulation characteristics of the protein. Theclinical manifestations of the disease vary from hemorrhagicdiathesis to thrombosis. The characteristic clinical laboratoryfinding in dysfibrinogenemia is an apparently low plasma fi-brinogen concentration using an assay dependent on the rateof clot formation. This value usually falls within normal limitswhen a rate-independent method is used.
In lieu of information concerning the precise location -of amolecular defect, dysfibrinogens have been classified on thebasis of their functional characteristics (1-3). The etiology ofdysfibrinogenemia has been related to alterations in the pri-mary structure of the protein. Blomback et al. (4) were the firstto identify such a defect, and more recently four different ab-normal proteins have been similarly characterized (5-8).
In this report a congenital hypodysfibrinogenemia, fibrino-gen Baltimore II, is described. To the best of our knowledge,this represents the seventh documented case of dysfibrino-genemia occurring coincidentally with hypodysfibrinogenemiaand the only one in which subnormal plasma fibrinogen con-centrations have occurred coincidentally with delayed releaseof fibrinopeptide B.
METHODSBlood. Blood was obtained by venipuncture and plasma-
pheresis performed with citrate/phosphate/dextrose (Fen-wallLaboratories, Deerfield, IL) as anticoagulant. Patient plasmaused for clinical studies was prepared by diluting 9 vol of wholeblood with 1 vol of 3.'8% trisodium citrate dihydrate.
Fibrinogen. Fibrinogen was purified from citrate/phos-phate/dextrose plasma by three glycine precipitation steps (9)at room -temperature. Fibrinogen isolated in this way from nor-mal or abnormal plasma was >98% coagulable when assayed bythe method of Laki (10) and appeared similarly homogeneouswhen analyzed by NaDodSO4/polyacrylamide gel electropho-resis (11) under reducing conditions. Commercial normal hu-man fibrinogen (Kabi, grade L, Stockholm, Sweden) was fur-ther purified as above by glycine precipitation. This preparationwas used as "control" fibrinogen unless otherwise noted.
Thrombin. Thrombin (bovine, topical; Parke-Davis) wasstored at -200C in a solution [1,000 units (u)/ml] of 25 mMbarbital buffer (pH 7.5) containing 135 mM NaCl. Human a-thrombin, a generous gift of G. Murano (National Institutes ofHealth), was prepared by the method of Fenton et al. (12). Allreferences to thrombin activity are in US (formerly NIH) units.
Coagulation Studies. The following procedures were usedfor clinical laboratory studies: one-stage prothrombin time (PT)by the method of Quick et al. (13) with rabbit brain throm-boplastin (Pel-Freez; ref. 14); partial thromboplastin time (PTT)by the method of Nye et al. (15) with Thrombofax Reagent (Or-tho Diagnostics); euglobulin lysis time according to von Kaullaand Schultz (16); factors VIII, IX, XI, and XII according to Har-disty and MacPherson (17) with the appropriate factor-deficientplasma; and Factor XIII according to Tyler (18). Factors VII andX were measured as follows: citrated patient plasma was diluted1:10 with 0.9% NaCl, and 0.15 ml of this solution was com-bined with an equal amount of factor-deficient plasma. A one-stage PT was then performed as described above. The resultswere compared with a standard curve generated in the samemanner using pooled normal plasma.
Platelet aggregometry was performed on a platelet aggre-gation profiler (BioData, Horsham, PA) at 37C with platelet-rich plasma (=300,000 platelets per mm3) and the following asaggregating agents in a final volume of 0.5 ml: 2-10 tLM ADP(Sigma), 1.2 mg of ristocetin (Abbott) per ml, 5.5 and 11 ,uMepinephrine (Ellcins-Sinn, Cherry Hill, NJ), 0.26 mg of col-lagen (Worthington) per ml, and 0.2-0.4 u of bovine thrombin(Parke-Davis) .per ml.
Release of Fibrinopeptides. Release of fibrinopeptides Aand B was measured by a modification of the -Martinelli andScheraga (19) method. The clotting reaction was initiated at 25VCby adding 10 1ul of human thrombin (1.33 u/ml) or Arvin (A-38414, Abbott; lot no. 23-126-DH; 3.3-6.7 u/ml) to 50 /.l ofa fibrinogen solution (4-10 mg/ml) containing 20 mM sodiumphosphate (pH 7.4) with 0.36 M e-aminocaproic acid and 0.15M NaCl. At the indicated times the reaction was stopped andthe clot was solubilized by adding 15 t.d-of 5% phosphoric acid.
Abbreviations: u, unit(s); PT, prothrombin time; PTT, partial throm-boplastin time; IEF, isoelectric focusing.
7318
The publication costs of this article were defrayed in part by page chargepayment. This article must therefore be hereby marked "advertise-ment" in accordance with 18 U.S.C. §1734 solely to indicate this fact.
Proc. Nati. Acad. Sci. USA 80 (1983) 7319
A 10-I.d aliquot (=60 lug) was then analyzed by reverse-phaseHPLC on a Varian model 5000 liquid chromatograph. Peptideswere detected by absorbance at 205 nm and eluted from an oc-tadecylsilane column with an isocratic mobile phase containing22% acetonitrile in 0.1% trifluoroacetric acid. Additional de-tails of this method, which permits rapid determination of thekinetics of fibrinopeptide release, will be published elsewhere.Electrophoretic Studies. NaDodSO4/polyacrylamide gel
electrophoresis was performed in a Pharmacia horizontal slabgel apparatus using the Laemmli method (11).
Isoelectric focusing (IEF) of reduced fibrinogen was done in2-mm horizontal slabs of 1% agarose (IEF grade, Pharmacia)containing 12% (wt/vol) sorbitol, 6 M urea, 6% (vol/vol) Phar-malyte 4-6.5, and 2% (vol/vol) Pharmalyte 3-10. Fibrinogenwas dissolved in a solution of 6 M urea (freshly deionized bypassage through a 2.5 X 22 cm column of Rexyn I-300, mixed-bed ion exchanger; Fisher) and 5% (vol/vol) 2-mercaptoetha-nol. Complete reduction of disulfide bonds occurred after in-cubation of this solution for 3-6 hr at 37C. Ten microliters (-50,ug) was applied to the gel near the anode, and focusing wascarried out at 10 W constant power for 75-120 min at 13'C us-
ing 1 M NaOH as the cathode solution and 10mM glutamic acidas the anode solution. Gels were fixed and stained with Coo-massie blue G-250 (Bio-Rad). All protein bands focused be-tween pH 5.5 and 7.4.
Studies of Fibrinogen Metabolism. Fibrinogen Baltimore IIwas labeled with "'lI by the iodine monochloride method ofMcFarlane (20). Free iodine was removed by gel filtration ona 2.4 X 82 cm column of Sephadex G-100 (particle size 40-120Am) equilibrated with 10 mM sodium citrate buffer (pH 7.0)containing 0.25 M NaCl in sterile pyrogen-free water. Three-milliliter fractions were collected into sterile nonpyrogenic glasstubes, each containing 0.12 ml of 5% human serum albumin(sterile, for injection; NYBCEN, New York) to stabilize the fi-brinogen (21). Protein eluting at the excluded volume (specificactivity, 3.5 ,Ci/mg; 1 Ci = 3.7 X 10¹⁰ Bq) was 98% coagula-ble by thrombin and >99.5% precipitable. Immediately priorto injection the fibrinogen solution was sterilized by passagethrough a 0.22-pym filter (Millex-GV, Millipore).
'"I-Labeled normal human fibrinogen (for injection) was ob-tained from Amersham (IBRIN; lot no. 0179) and when ad-ministered had a specific radioactivity of 75.3 pCi/mg. Thismaterial was 92% coagulable by thrombin and 95% of the ra-dioactivity was precipitated by 10% trichloroacetic acid.
After providing informed, witnessed written and verbal con-sent, the affected father of the proposita was injected with asterile solution containing 0.6 ml (45.2 uCi, 0.6 mg) of '"I-la-beled normal fibrinogen and 2.6 ml (27.4 ,Ci, 7.8 mg) of '31I-labeled fibrinogen Baltimore II. Five-milliliter blood sampleswere collected at the indicated times over a period of 7 days,and 1-2.5 ml of plasma derived therefrom was assayed for ra-
dioactivity on a Beckman (Gamma 8000) gamma counter. Theradioactivity in each of seven 24-hr urine samples collected duringthe same period was determined. Beginning 3 days prior to thestudy and for 17 days thereafter, the patient received daily 200mg of potassium iodide orally.
Rates of fibrinogen synthesis and catabolism were calculatedfrom plots of plasma radioactivity vs. time, assuming a two-compartment model (22, 23). Kinetic constants were obtainedby fitting a biexponential equation (24) to the data with the aidof a computer program by using the Newton-Raphson methodfor nonlinear parameter estimation (25). A correction for non-
protein-bound iodide was made (23). The fractional catabolicrate was determined from urinary excretion data by dividingthe total cpm in urine collected during a 24-hr period by thetotal plasma radioactivity at the midpoint of the collection pe-
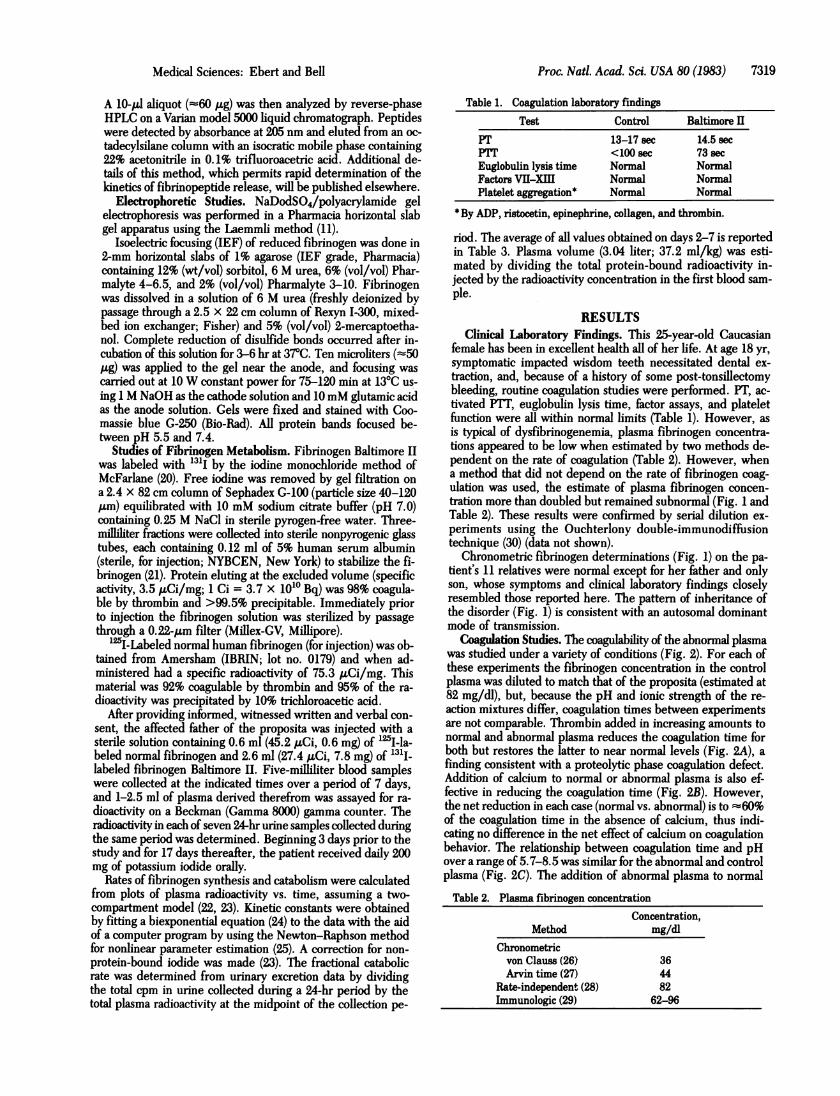
Table 1. Coagulation laboratory findingsTest Control Baltimore II
PT 13-17 sec 14.5 secPIT <100 sec 73 secEuglobulin lysis time Normal NormalFactors VII-Xm Normal NormalPlatelet aggregation* Normal Normal
* By ADP, ristocetin, epinephrine, collagen, and thrombin.
riod. The average of all values obtained on days 2-7 is reportedin Table 3. Plasma volume (3.04 liter; 37.2 ml/kg) was esti-mated by dividing the total protein-bound radioactivity in-jected by the radioactivity concentration in the first blood sam-ple.
RESULTSClinical Laboratory Findings. This 25-year-old Caucasian
female has been in excellent health all of her life. At age 18 yr,symptomatic impacted wisdom teeth necessitated dental ex-traction, and, because of a history of some post-tonsillectomybleeding, routine coagulation studies were performed. PT, ac-tivated PTT, euglobulin lysis time, factor assays, and plateletfunction were all within normal limits (Table 1). However, asis typical of dysfibrinogenemia, plasma fibrinogen concentra-tions appeared to be low when estimated by two methods de-pendent on the rate of coagulation (Table 2). However, whena method that did not depend on the rate of fibrinogen coag-ulation was used, the estimate of plasma fibrinogen concen-tration more than doubled but remained subnormal (Fig. 1 andTable 2). These results were confirmed by serial dilution ex-periments using the Ouchterlony double-immunodiffusiontechnique (30) (data not shown).
Chronometric fibrinogen determinations (Fig. 1) on the pa-tient's 11 relatives were normal except for her father and onlyson, whose symptoms and clinical laboratory findings closelyresembled those reported here. The pattern of inheritance ofthe disorder (Fig. 1) is consistent with an autosomal dominantmode of transmission.
Coagulation Studies. The coagulability of the abnormal plasmawas studied under a variety of conditions (Fig. 2). For each ofthese experiments the fibrinogen concentration in the controlplasma was diluted to match that of the proposita (estimated at82 mg/dl), but, because the pH and ionic strength of the re-action mixtures differ, coagulation times between experimentsare not comparable. Thrombin added in increasing amounts tonormal and abnormal plasma reduces the coagulation time forboth but restores the latter to near normal levels (Fig. 2A), afinding consistent with a proteolytic phase coagulation defect.Addition of calcium to normal or abnormal plasma is also ef-fective in reducing the coagulation time (Fig. 2B). However,the net reduction in each case (normal vs. abnormal) is to :60%of the coagulation time in the absence of calcium, thus indi-cating no difference in the net effect of calcium on coagulationbehavior. The relationship between coagulation time and pHover a range of 5.7-8.5 was similar for the abnormal and controlplasma (Fig. 2C). The addition of abnormal plasma to normalTable 2. Plasma fibrinogen concentration
Concentration,Method mg/dl
Chronometricvon Clauss (26) 36Arvin time (27) 44
Rate-independent (28) 82Immunologic (29) 62-96
Medical Sciences: Ebert and Bell

7320 Medical Sciences: Ebert and Bell
250 250 36(218) (82)
30(85)
FIG. 1. Family studies of fibrinogen Baltimore II. Numbers indi-cate plasma fibrinogen concentrations (mg/dl) determined by chrono-metric (26) or, if in parenthesis, non-rate-dependent (28) methods. Thearrow denotes the proposita. Squares, males; circles, females. Opensymbols, normal individuals; cross-hatched symbol, deceased, not stud-ied; solid symbols, affected individuals.
plasma did not affect the coagulation time of the latter (Fig.2D), which indicates that the abnormal plasma does not containa circulating anticoagulant.
Determination of the Functional Abnormality. When thekinetics of individual fibrinopeptide release were examined,fibrinopeptide A was released at a rate and to an extent similarto that of the control (Fig. 3A). The release of fibrinopeptideB was delayed, although the total amount of peptide was -80%of normal at later time points (Fig. 3B). For other experiments(not shown) in which higher concentrations of thrombin were
>2 min A
50 50~40 4030 3020- 2010- 100 00 5 10 15 20
Thrombin, u/ml
90 secc
11050 t 10040 90o30 - 8020- 7010- 600 05.0 6.0 7.0 8.0
B
.0 5 101520CaCl2, mM
D
0 20 40 6080100pH % normal plasma
FIG. 2. Coagulation behavior of control and abnormal plasma. Todetermine the effect ofthrombin concentration on coagulation time (A)0.1 ml of bovine thrombin [in 25 mM sodium diethyl barbiturate (pH7.5) containing 125 mM NaCl] was added to 0.1 ml of citrated plasma.The effect of calcium on thrombin-catalyzed clotting time (B) was stud-ied by combining 0.2 ml of citrated plasma with 0.1 ml of a 14.5 mMNaCl solution containing 15 u ofbovine thrombin per ml and 5-60mMCaCl2. The effect ofpH on coagulation time (C) was determined by mix-ing one part citrated plasma with two parts Michaelis buffer (pH 5.7),after which each solution was diluted to the same final volume withwater to ensure equivalent fibrinogen concentrations. Coagulation wasinitiated by adding 0.1 ml of bovine thrombin (25 u/ml) to 0.2 ml ofbuffered plasma solution. e, Control in A-C; o, Baltimore II in A-C.The effect of mixing normal and abnormal plasma on thrombin-cata-lyzed clotting time (D) was studied by combining 0.2 ml ofnormal plasma[previously diluted with either patient plasma (0) or normal saline (s)]with 0.2 ml of bovine thrombin (10 u/mi). For each of the above re-actions, clot formation was monitored visually at 370C, and each pointrepresents the mean of triplicate determinations.
EID
a
20U1
o 10 20 30 40 50 60
Time, min
FIG. 3. Time course of thrombin-catalyzed fibrinopeptide release,measured by reverse-phase HPLC. Time to form visible clot: 9 min. (A)Release of fibrinopeptide A; (B) release of fibrinopeptide B. *, Controlfibrinogen; o, fibrinogen Baltimore H. One area count = 1 1WV sec.
used, the total amount of fibrinopeptide B released was iden-tical to that of the control. The delay is completely abolishedat a final thrombin concentration of >3 u/ml and is substan-tially prolonged at enzyme concentrations of <0.1 u/ml.The observation of a prolonged Arvin clotting time (Table 2)
indicates that fibrinopeptide A is released more slowly thannormal in plasma. We attempted to confirm this using HPLCto monitor fibrinopeptide A release from isolated fibrinogenbut found the rate and extent of peptide generation to be nor-mal (data not shown). As expected, no fibrinopeptide B was de-tected under these conditions.No abnormalities regarding the initial rates of fibrin mono-
mer polymerization were found (Fig. 4), and the plasma clot
0.70
0.60
0.50
0 0.40-to
0.30
0.20-
0.10
0o 0000
O * 00*-0O*
2 -a
8
0000.
40 80 120 160 200 240 280Time, sec
FIG. 4. Polymerization of fibrin monomers. Purified normal andabnormal fibrinogen (3.0 ml of a solution at 2.5 mg/ml) was combinedwith human thrombin (5 u in 50 p1L) and the mixture was allowed to clotfor 30-45 min at 250C. The clot was removed with a glass rod, washedthree times by immersion in 7 ml of distilled water for 10 min, and dis-solved in 1 ml of 20 mM sodium acetate buffer (pH 4.2). The proteinconcentration was determined by absorbance at 280 nm (31) and theLowry method (32). Polymerization was initiated by mixing 0.5 ml ofa fibrin solution at 1 mg/ml (in sodium acetate buffer) with an equalvolume of 80mM Na2HPO4, to produce a pH 7.4 solution with an ionicstrength of 0.10. The extent of polymerization was measured by tur-bidity at 350 nm in a Varian DMS-90 spectrophotometer against a blankcontaining equal volumes of20mM sodium acetate (pH 4.2) and 80mMNa2HPO4. *, Control fibrinogen; o, fibrinogen Baltimore II.
Q
0e
00s
asCZ0
Proc. Natl. Acad. Sci. USA 80 (1983)
Proc. Nati. Acad. Sci. USA 80 (1983) 7321
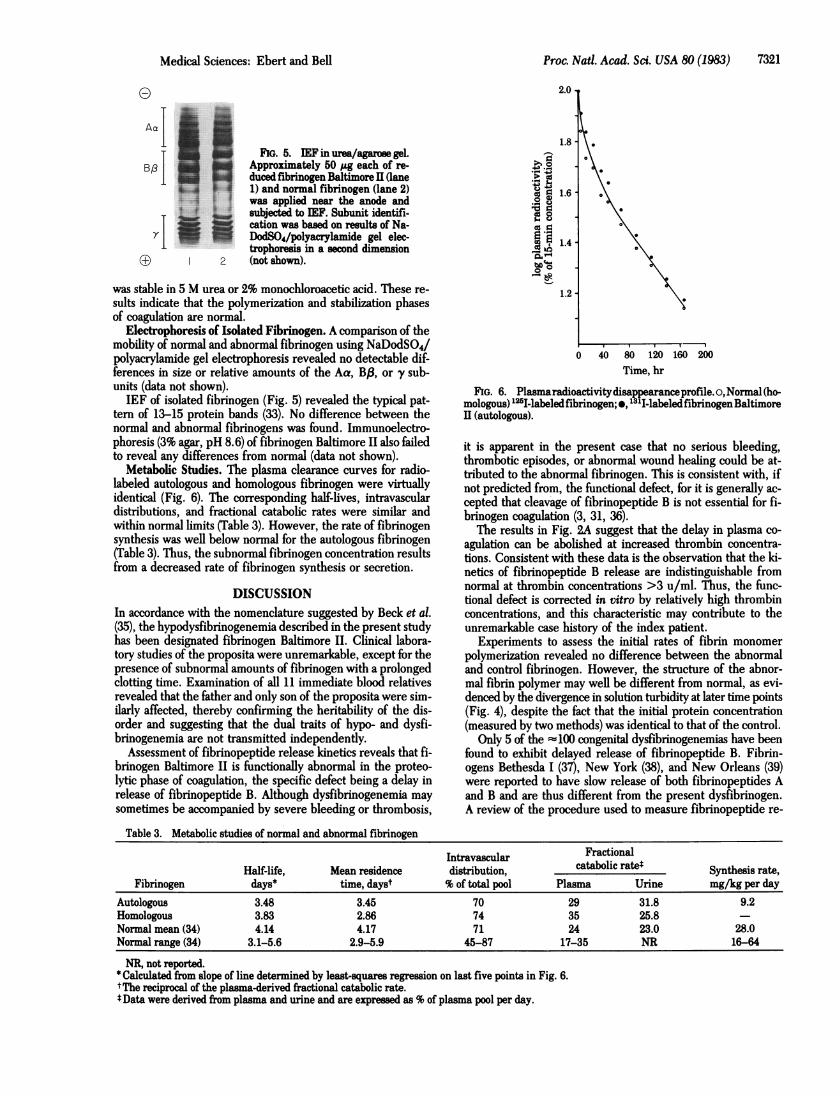
FIG. 5. IEF in urea/agarose gel.Approximately 50 ug each of re-duced fibrinogen Baltimore II (lane1) and normal fibrinogen (lane 2)was applied near the anode andsubjected to IEF. Subunit identifi-cation was based on results of Na-DodSO4/polyacrylamide gel elec-trophoresis in a second dimension(not shown).
was stable in 5 M urea or 2% monochloroacetic acid. These re-sults indicate that the polymerization and stabilization phasesof coagulation are normal.
Electrophoresis of Isolated Fibrinogen. A comparison of themobility of normal and abnormal fibrinogen using NaDodSO4/polyacrylamide gel electrophoresis revealed no detectable dif-ferences in size or relative amounts of the Aa, BP, or y sub-units (data not shown).IEF of isolated fibrinogen (Fig. 5) revealed the typical pat-
tern of 13-15 protein bands (33). No difference between thenormal and abnormal fibrinogens was found. Immunoelectro-phoresis (3% agar, pH 8.6) of fibrinogen Baltimore II also failedto reveal any differences from normal (data not shown).
Metabolic Studies. The plasma clearance curves for radio-labeled autologous and homologous fibrinogen were virtuallyidentical (Fig. 6). The corresponding half-lives, intravasculardistributions, and fractional catabolic rates were similar andwithin normal limits (Table 3). However, the rate of fibrinogensynthesis was well below normal for the autologous fibrinogenCable 3). Thus, the subnormal fibrinogen concentration resultsfrom a decreased rate of fibrinogen synthesis or secretion.
DISCUSSIONIn accordance with the nomenclature suggested by Beck et al.(35), the hypodysfibrinogenemia described in the present studyhas been designated fibrinogen Baltimore II. Clinical labora-tory studies of the proposita were unremarkable, except for thepresence of subnormal amounts of fibrinogen with a prolongedclotting time. Examination of all 11 immediate blood relativesrevealed that the father and only son of the proposita were sim-ilarly affected, thereby confirming the heritability of the dis-order and suggesting that the dual traits of hypo- and dysfi-brinogenemia are not transmitted independenty.
Assessment of fibrinopeptide release kinetics reveals that fi-brinogen Baltimore II is functionally abnormal in the proteo-lytic phase of coagulation, the specific defect being a delay inrelease of fibrinopeptide B. Although dysfibrinogenemia may
sometimes be accompanied by severe bleeding or thrombosis,
1.8-
1.6 -
cm 1.4
1.2 -
0 40 80 120 160 200Time, hr
FIG. 6. Plasmaradioactivitydisappearanceprofile.o,Normal(ho-mologous) 12I5-labeledfibrinogen; *, 131I-labeledfibrinogenBaltimoreII (autologous).
it is apparent in the present case that no serious bleeding,thrombotic episodes, or abnormal wound healing could be at-tributed to the abnormal fibrinogen. This is consistent with, ifnot predicted from, the functional defect, for it is generally ac-cepted that cleavage of fibrinopeptide B is not essential for fi-brinogen coagulation (3, 31, 36).The results in Fig. 2A suggest that the delay in plasma co-
agulation can be abolished at increased thrombin concentra-tions. Consistent with these data is the observation that the ki-
netics of fibrinopeptide B release are indistinguishable fromnormal at thrombin concentrations >3 u/ml. Thus, the func-tional defect is corrected in vitro by relatively high thrombinconcentrations, and this characteristic may contribute to theunremarkable case history of the index patient.
Experiments to assess the initial rates of fibrin monomer
polymerization revealed no difference between the abnormaland control fibrinogen. However, the structure of the abnor-mal fibrin polymer may well be different from normal, as evi-denced by the divergence in solution turbidity at later time points(Fig. 4), despite the fact that the initial protein concentration(measured by two methods) was identical to that of the control.
Only 5 of the =100 congenital dysfibrinogenemias have beenfound to exhibit delayed release of fibrinopeptide B. Fibrin-ogens Bethesda I (37), New York (38), and New Orleans (39)were reported to have slow release of both fibrinopeptides Aand B and are thus different from the present dysfibrinogen.A review of the procedure used to measure fibrinopeptide re-
Table 3. Metabolic studies of normal and abnormal fibrinogen
Intravascular FractionalHalf-life, Mean residence distribution, catabolic rate* Synthesis rate,
Fibrinogen days* time, dayst % of total pool Plasma Urine mg/kg per dayAutologous 3.48 3.45 70 29 31.8 9.2Homologous 3.83 2.86 74 35 25.8 -
Normal mean (34) 4.14 4.17 71 24 23.0 28.0Normal range (34) 3.1-5.6 2.9-5.9 45-87 17-35 NR 16-64
NR, not reported.* Calculated from slope of line determined by least-squares regression on last five points in Fig. 6.tThe reciprocal of the plasma-derived fractional catabolic rate.*Data were derived from plasma and urine and are expressed as % of plasma pool per day.
0
AaI
0~ 2
2.0
Medical Sciences: Ebert and Bell
7322 Medical Sciences: Ebert and Bell
lease from fibrinogen Detroit (40) indicates that under similarconditions of low thrombin concentration (0.05 NIH unit/ml),fibrinogen Baltimore II would also have not released fibrino-peptide B to any appreciable extent. However, a comparisonof other factors, such as the plasma fibrinogen concentration,PT, PIT, and the patient's clinical presentation (41), serves todistinguish these two abnormal proteins. Unlike the presentdysfibrinogen, fibrinogen Seattle (42, 43) was present in plasmaat normal concentrations, repolymerized abnormally, and re-leased only 54% of fibrinopeptide B. Thus, we are able to con-clude that fibrinogen Baltimore II is functionally unique amongthose dysfibrinogens with delayed release of fibrinopeptide B.
Congenital hypodysfibrinogenemia has been described in sixfamilies in addition to that reported here (44-49). FibrinogenBethesda II (44), which manifests a slight delay in total fibrino-peptide release, also exhibits a major delay in fibrin monomerpolymerization and is therefore dissimilar to fibrinogen Balti-more II. The remaining proteins (45-49) are delayed only inthe polymerization phase of coagulation. Thus, fibrinogen Bal-timore II is readily distinguished from the other hypodysfi-brinogens on the basis of its functional defect, a delay in fi-brinopeptide B release.The steady-state plasma fibrinogen concentration is essen-
tially a function of its synthetic rate and rate of plasma clear-ance. We found the catabolic rate for fibrinogen Baltimore IIto be within normal limits and conclude that the hypofibri-nogenemia results from a synthetic rate about one-third of nor-mal (Table 3).
Plasma fibrinogen survival has been studied in four of the sixpreviously described hypodysfibrinogenemias. Two of these,fibrinogens Bethesda III (45) and Philadelphia (46), were mark-edly hypercatabolized. A third, fibrinogen Bethesda 11 (44), wasreported to have a slightly increased fractional catabolic rate,a somewhat shortened plasma half-life (70-72 hr), and a normalsynthetic rate. Thus, the etiology of the subnormal fibrinogenlevels in these three cases differs from that of fibrinogen Bal-timore II. In the fourth instance (49), subnormal plasma fi-brinogen concentrations were not due to hypercatabolism andthus resulted from a decreased synthetic rate. However, thefunctional and solubility characteristics of this protein readilydistinguish it from the present one.On the basis of the foregoing we conclude that fibrinogen
Baltimore II is unique among the dysfibrinogens and suggestthat a similarly unique structural defect is present in this pro-tein.
We gratefully acknowledge the expert technical assistance of Ms.Daniele Cornell for routine coagulation studies and Ms. Mary Jo Fack-ler for routine coagulation studies as well as those presented in Fig. 2.We also thank Drs. Deborah L. Higgins and Jules A. Shafer for helpfuldiscussions regarding HPLC of fibrinopeptides and Dr. Dennis Noe forassistance in numerical analysis of the fibrinogen clearance results. Thiswork was supported in part by Research Grants HLO1601-33 andHL24898-02 and Training Grant HL07377 from the National Heart,Lung, and Blood Institute and by the Whitehall Foundation.
1. Flute, P. T. (1977) Br. Med. Bull. 33, 253-259.2. Marder, V. J. (1976) Thromb. Haemostasis 361, 1-8.3. Ratnoff, 0. D. & Forman, W. B. (1976) Semmn. Hematol. 13, 141-
157.4. Blomback, M., Blomback, B., Mammen, E. F. & Prasad, A. S.
(1968) Nature (London) 218, 134-137.5. Henschen, A. C., Southan, C., Kehl, M. & Lottspeich, R. (1981)
Thromb. Haemoasis 46, 181 (abstr.).6. Henschen, A., Southan, C., Soria, J., Soria, C. & Samama, M.
(1981) Thromb. Haemostasis 46, 103 (abstr.).7. Higgins, D. L. & Shafer, J. A. (1981)J. Biol. Chem. 256, 12013-
12017.
8. Morris, S., Denninger, M. H., Finlayson, J. S. & Menache, D.(1981) Thromb. Haemostasis 46, 104 (abstr.).
9. Kazal, L. A., Grannis, G. F. & Tocantins, L. M. (1964) in BloodCoagulation, Hemorrhage and Thrombois, eds. Tocantins, L. &Kazal, L. (Grune & Stratton, New York), pp. 232-239.
10. Laid, K. (1951) Arch. Biophys. 32, 317-324.11. Laemmli, U. K. (1970) Nature (London) 227, 680-685.12. Fenton, J. W., Fasco, M. J., Stackrow, A. B., Aronson, D. L.,
Young, A. M. & Finlayson, J. S. (1977)1. Biol. Chem. 252, 3587-3598.
13. Quick, A. J., Hussey, C. V. & Geppert, M. (1963) Am.J. Med. Sci.246, 517-526.
14. Brambel, C. E. (1945) Arch. Surg. 50, 137-147.15. Nye, S. W., Graham, J. B. & Brinkous, K. M. (1962) Am. J. Med.
Sci. 243, 279-287.16. von Kaulla, K. N. & Schultz, R. L. (1958) Am. J. Clin. Pathol. 29,
104-112.17. Hardisty, R. M. & MacPherson, J. C. (1962) Thromb. Diath. Hae-
morrh. 7, 215-229.18. Tyler, H. M. (1966) Thromb. Diath. Haemorrh. 16, 61-68.19. Martinelli, R. A. & Scheraga, H. A. (1979) Anal. Biochem. 96, 246-
249.20. McFarlane, A. S. (1963)J. Clin. Invest. 42, 346-361.21. Krohn, K., Sherman, L. & Welch, M. (1972) Biochim. Biophys.
Acta 285, 404-413.22. Matthews, C. M. E. (1957) Phys. Med. Biol. 2, 36-53.23. Reeve, J., Russell, B., Gibbs, G. P. & Peters, D. K. (1982) Clin.
Sci. 63, 175-185.24. Gibaldi, M. & Perrier, D. (1975) Pharmacokinetics (Dekker, New
York), pp. 48-86.25. Powell, J. B. (1967) in Numerical Analysis: An Introduction, ed.
Walsh, J. (Thompson, Washington, DC), pp. 143-157.26. von Clauss, A. (1957) Acta Haernatol. 17, 237-246.27. Allison, J. V. (1972) Proc. Univ. Otago Med. Sch. 50, 41-42.28. Ratnoff, 0. D. & Menzie, C. (1951) J. Lab. Clin. Med. 37, 316-
320.29. Merskey, C., Lalezari, P. & Johnson, A. J. (1969) Proc. Soc. Exp.
Biol. Med. 131, 871-875.30. Ouchterlony, 0. (1962) Prog. Allergy 6, 30-154.31. Doolittle, R. F. (1975) in The Plasma Proteins: Structure, Func-
tion, and Genetic Control, ed. Putnam, F. W. (Academic, NewYork), Vol. 2, pp. 110-161.
32. Lowry, 0. H., Rosebrough, N. J., Farr, A. L. & Randall, R. J.(1951)J. Biol. Chem. 193, 265-275.
33. Kuyas, C., Haeberli, A. & Straub, P. W. (1982)J. Biol. Chem. 257,1107-1109.
34. Collen, D., Tytgat, G. N., Claeys, H. & Piessens, R. (1972) Br.J.Haematol. 22, 681-700.
35. Beck, E. A., Charache, P. & Jackson, D. P. (1965) Nature (Lon-don) 203, 143-145.
36. Shainoff, J. R. & Dardik, B. N. (1979) Science 204,200-202.37. Gralnick, H. R., Givelber, H. M., Shainoff, J. R. & Finlayson, J.
S. (1971) J. Clin. Invest. 50, 1819-1830.38. Al-Mondhiry, H. A. B., Bilezikian, S. B. & Nossel, H. L. (1975)
Blood 45, 607-619.39. Chavin, S. I., Andes, W. A., Beltran, W G. & Stuckey, W J. (1979)
Thromb. Haemostasis 42, 15 (abstr.).40. Blomback, B. & Blomback, M. (1970) Nouv. Rev. Fr. Hematol. 10,
671-678.41. Mammen, E. F., Prasad, A. S., Bamhart, M. I. & Au, C. C. (1969)
J. Clin. Invest. 48, 235-249.42. Branson, H. E., Schmer, G. & Dillard, D. H. (1977) Am.J. Clin.
Pathol. 67, 236-240.43. Branson, H. E., Theodor, I., Baumgartner, R., Schmer, G. &
Pirkle, H. (1979) Thromb. Haemostasis 42, 138 (abstr.).44. Gralnick, H. R., Givelber, H. M. & Finlayson, J. S. (1973) Thromb.
Diath. Haemorrh. 29, 562-571.45. Gralnick, H. R., Coller, B. S., Fratantoni, J. C. & Martinez, J.
(1979) Blood 53, 28-46.46. Martinez, J., Holburn, R. R., Shapiro, S. S. & Erslev, A. J. (1974)
J. Clin. Invest. 53, 600-611.47. Rupp, C., Kuyas, C., Haberli, A., Furlan, M. & Beck, E. R. (1981)
Thromb. Haemostasis 46, 104 (abstr.).48. Verhaeghe, R., Verstraete, M., Vermylen, J. & Vermylen, C. (1974)
Br. J. Haematol. 26,421-433.49. McDonagh, R. P., Carrell, N. A., Roberts, H. R., Blatt, P. M. &
McDonagh, J. (1980) Am. J. Hematol. 9,23-38.
Proc. Natl. Acad. Sci. USA 80 (1983)