APPENDIX - Ferrovial
49
APPENDIX Alternative Performance Measures Sostenibility Management Reporting Principles Task Force on Climate Related Disclosures Scoreboard Contents of Non-Financial Information Statements SASB Indicators GRI Standards Idicators Appendix to GRI Standards Idicators Glossary of Terms Verification Report .
Transcript of APPENDIX - Ferrovial

ANNUAL INTEGRATED REPORT 2020MANAGEMENT REPORT
1.2 STRATEGY AND VALUE CREATIONAUTOPISTAS
125
APPENDIXAlternative Performance MeasuresSostenibility ManagementReporting PrinciplesTask Force on Climate Related Disclosures ScoreboardContents of Non-Financial Information StatementsSASB IndicatorsGRI Standards IdicatorsAppendix to GRI Standards IdicatorsGlossary of TermsVerification Report.
MANAGEMENT REPORT 2020FERROVIAL S.A. AND SUBSIDIARIES
126
EBITDA = GROSS OPERATING RESULT
• Definition: operating result before charges for fixed asset and right of use of leases depreciation and amortization
• Reconciliation: the company presents the calculation of EBITDA in the Consolidated P&L as: Gross Operating Profit = Total Oper-ating Revenues – Total Operating Expenses (excluding those rela-tive to fixed assets and right of use assets depreciation and amor-tization which are reported in a separate line).
• Explanation of use: BITDA provides an analysis of the operating results, excluding depreciation and amortization, as they are non-cash variables which can vary substantially from company to company depending on accounting policies and the accounting value of the assets. EBITDA is the best approximation to pre-tax operating cash flow and reflects cash generation before working capital variation. Therefore, we use EBITDA as a starting point to calculate cash flow, adding the variation in working capital. Finally, it is an APM indicator which is widely used by investors when evaluating businesses (multiples valuation), as well as by rating agencies and creditors to evaluate the level of debt, by comparing EBITDA with net debt.
• Comparisons: the company presents comparative figures with previous years.
• Consistency: the criteria used to calculate EBITDA is the same as the previous year.
COMPARABLE (“LIKE-FOR-LIKE GROWTH” LFL)
• Definition: relative year-on-year variation in comparable terms of the figures for revenues, EBITDA, EBIT and order book. The comparable is calculated by adjusting the present year and the previous one, in accordance with the following rules:
– Elimination of the exchange-rate effect, calculating the results of both periods at the rate in the current period.
– Elimination from the EBIT of both periods of the impact of fixed asset impairments and results from company disposals (corre-sponds with the figure reported in the line “Impairments and disposals of fixed assets”).
– In the case of company disposals and loss of control, the
homogenization of the operating result is undertaken by elim-inating the operating results of the sold company when the impact occurred in the previous year, or if it occurred in the year under analysis, considering the same number of months in both periods.
– Elimination of the restructuring costs, in both periods. – In acquisitions of new companies which are considered mate-
rial, elimination, in the current period, of the operating results derived from those companies, except in the case where this elimination is not possible due to the high level of integra-tion with other reporting units (material companies are those whose revenues represent ≥5% of the reporting unit’s revenues before the acquisition).
– In the case of changes in the accounting model of a specific contract or asset, when material, the homogenization is undertaking by applying the same accounting model to the previous year operating result.
– Elimination in both periods of other non-recurrent impacts (mainly related to tax and human resources) considered rele-vant for a better understanding of the company’s underlying results.
– With respect to the Services division, which is presented in the Consolidated Profit and Loss Account as discontinued oper-ations, in order to better explain the business performance, in the Management Report it has been included a separated breakdown of Revenues, EBITDA and Orderbook, in spite of being classified as discontinued operations
– Note: the new contracts in the Toll Roads division coming into operation are not considered acquisitions and thus are not adjusted in the comparable.
• Reconciliation: the comparable growth is presented in separate columns on Business Performance of the Interim Management Report and its reconciliation in the Appendix of this document.
• Explanation of use: Ferrovial uses the comparable to provide a more homogenous measure of the underlying profitability of its businesses, excluding those non-recurrent elements which would induce a misinterpretation of the reported growth, impacts such as exchange-rate movements or changes in the consolidation perim-eter which distort the comparability of the information. Addition-
ALTERNATIVE PERFORMANCE MEASURESThe company presents its results in accordance with generally accepted accounting standards (IFRS). In addition, in the Management Report and Consolidated Financial Statements released in December, the management provides other non-IFRS regulated financial measures, called APMs (Alternative Performance Measures) according to the directives of European Securities and Markets Authority (ESMA). Management uses those APMs in decision-taking and to evaluate the performance of the company. Below there are details of disclosures required by the ESMA on definition, reconciliation, explanation of use, comparisons and consistency of each APM. More detailed information is provided on the corporate web page: https://www.ferrovial.com/en/ir-shareholders/financial-information/quarterly-financial-information/. Additionally, on this web page the reconciliation of the comparable “like for like growth”, order book and proportional results are provided.
ANNUAL INTEGRATED REPORT 2020MANAGEMENT REPORT
127
APPENDIXALTERNATIVE PERFORMANCE MEASURES
ally, it also allows the Company to present homogenous informa-tion, thus ensuring its uniformity, providing a better understanding of the performance of each of its businesses.
• Comparisons: the comparable breakdown is only shown for the current period compared with the previous period
• Consistency: the criteria used to calculate the comparable “Like-for-like growth” is the same as the previous year, except for the following adjustment that was included exclusively in 2019: Related to the implementation of IFRS 16, and for a better comparison of EBITDA and operating profit against 2018, in which IFRS 16 was not imple-mented, the new Standard accounting impact was undone, reversing the adjustment for financial cost and amortization of right of use and recognizing a higher operating cost for leases, as if the new standard had not been applied in 2019.
FAIR VALUE ADJUSTMENTS
• Definition: the adjustments to the Consolidated P&L relative to previous results derived from: changes in the fair value of deriv-atives and other financial assets and liabilities; asset impairment and the impact of the two above elements in the ‘equity-ac-counted results’.
• Reconciliation: a detailed breakdown of the Fair Value Adjust-ments is included in the Consolidated Profit and Loss Account (see the Consolidated Profit and Loss Account in the Management Report and the Consolidated Financial Statements).
• Explanation of use: The Fair Value Adjustments can be useful for investors and financial analysts when evaluating the underlying profitability of the company, as they can exclude elements that do not generate cash and which can vary substantially from one year to another due to the accounting methodology used to calculate the fair value.
• Comparisons: the company presents comparisons with previous years.
• Consistency: the criterion used to calculate the Fair Value Adjust-ments is the same as the previous year.
CONSOLIDATED NET DEBT
• Definition: this is the net balance of Cash and cash equivalents (including short and long-term restricted cash), minus short and long-term financial debt (bank debt and bonds), including the balance related to exchange-rate derivatives that cover both the issue of debt in currency other than the currency used by the issuing company and cash positions that are exposed to exchange rate risk. The lease liability (due to the application of the new IFRS 16 standard) is not part of the Consolidated Net Debt.
• Reconciliation: a detailed breakdown of the reconciliation of this figure is given in the note 5.2 of the Consolidated Financial State-ments and in the section Net Debt and Corporate Credit Rating in the Management Report.
• Explanation of use: this is a financial indicator used by investors, financial analysts, rating agencies, creditors and other parties to determine the company’s debt position. In addition, Ferrovial breaks down its net debt into two categories:
– Net debt of infrastructure projects. This is the ring-fenced debt which has no recourse to the shareholder or with recourse limited to the guarantees issued. This is the debt corresponding to infrastructure project companies
– Net debt ex-infrastructure projects. This is the net debt of Ferro-vial’s other businesses, including the group holding companies and other companies that are not considered infrastructure projects. The debt included in this calculation is mainly with recourse, and is thus the measure used by investors, financial analysts and rating agencies to assess the company’s leverage, financial strength, flexibility and risks.
• Comparisons: the company presents comparisons with previous years.
• Consistency: the criterion used to calculate the net debt figure is the same as the previous year.
ORDER BOOK
• Definition: the income pending execution, which correspond to contracts which the Company has signed up to a certain date, and over which it has certainty on its future execution. The total income from a contract corresponds to the agreed price or rate corresponding to the delivery of goods and/or the rendering of the contemplated services. If the execution of a contract is pending the closure of financing, the income from said contract will not be added to the order book until financing is closed. The order book is calculated by adding the contracts of the actual year to the balance of the contract order book at the end of the previous year, less the income recognized in the current year.
• Reconciliation: the order book is presented under key figures under Services and Construction sections of the Management Report. There is no comparable financial measure in IFRS. However, a break-down of reconciliation with Construction and Services sales figures is provided in Note 2.1 in the Consolidated Financial Statements. This reconciliation is based on the order book value of a specific construc-tion being comprised of its contracting value less the construction work completed, which is the main component of the sales figure. The difference between the construction work completed and the Construction and Services sales figure reported in Ferrovial’s Finan-cial Statements is attributable to the fact that consolidation adjust-ments, charges to JVs, sale of machinery, confirming income and other adjustments are made to the latter. In addition to contracts awarded and the construction work completed, the exchange rate of contracts awarded in foreign currency, rescissions (when a contract is terminated early) or changes to the scope are all aspects that also have an impact on the movement between the original order book (corresponding to the previous year) and the end order book (for the
MANAGEMENT REPORT 2020FERROVIAL S.A. AND SUBSIDIARIES
128
year in question), as shown in the tables at the end of this document. Management believes that the order book is a useful indicator in terms of the future income of the company, as the order book for a specific construction will be comprised of the final sale of said construction less the net construction work undertaken.
• Explicación del uso: the Management believes that the order book is a useful indicator with respect to the future income of the Company, due to the order book for a specific work will be the final sale of said work less the work executed net at source.
• Comparisons: the company presents comparisons with previous years.
• Consistency: the criteria used to calculate order book is the same as the previous year.
WORKING CAPITAL VARIATION
• Definition: measurement that explains the conciliation between the EBITDA and the operating cash flow before taxes. It is the result of the non-cash-convertible gross income primarily from changes in debt balance and commercial liabilities..
• Reconciliation: in Note 5.3 Cash flow of the Consolidated Finan-cial Statement, the company provides a reconciliation between the working capital variation on the balance (see description on Section 4 Working Capital of the Consolidated Financial State-ment) and the working capital variation reported in the Cash Flow Statement.
• Explanation of use: the working capital variation reflects the company’s ability to convert EBITDA into cash. It is the result of company activities related with inventory management, collection from customers and payments to suppliers. It is useful for users and investors because it allows a measurement on the efficiency and short-term financial situation of the company.
• Comparisons: the company presents comparative reports from previous years.
• Consistency: the criteria employed for calculating the working capital variation is the same as the previous year..
TOTAL SHAREHOLDER RETURN
• Definition: sum of the dividends received by shareholders, reval-uation/depreciation of the shares and other payments such as the delivery of shares or buy-back plans.
• Reconciliation: the total shareholder return is presented under the share part of section 1.1 of the Management Report. There is a breakdown of the reconciliation with the shareholder return in the financial statements.
• Explanation of use: it is a financial indicator used by investors and financial analysts, to evaluate the performance that shareholders have received throughout the year in exchange for their contribu-tion in capital of the Company.
• Comparisons: the company presents comparative reports from previous years.
• Consistency: the criteria employed for calculating shareholder return is the same as the previous year.
MANAGED INVESTMENT
• Definition: managed investment is presented under Toll Roads in section 1.2 of the Management Report. During the construc-tion phase, it is the total investment to make. During the oper-ating phase, this amount is increased by the additional invest-ment. Projects are included after signing the contract with the corresponding administration (commercial close), on which date the provisional financing terms and conditions, which will be confirmed after the financial closing, are normally available. 100% of investment is considered for all projects, including those that are integrated by the equity method, regardless of Ferro-vial’s participation. Projects are excluded with criteria in line with the exit from the consolidation scope.
• Reconciliation: Managed investments at the end of December 2020 came to approximately 20.8 billion euros (21.9 billion euros at December 2019) and are made up of 25 concessions in 9 coun-tries. The composition of managed investments by asset type is as follows:1. Intangible Assets projects under IFRIC 12 (in operation),
7,133 million euros (7,324 million euros at 31, December 2019). The managed investment matches with the balance sheet gross investment in these projects included in the table of section 3.3.1 of the Consolidated Annual Accounts, except for the future investment commitments: 5,553 million euros of USA Toll Roads NTE, NTE35W, LBJ and I-77 (5,905 million euros at December 31, 2019). Additionally, 391 million euros from Azores are included in Other Toll roads, as well as 521 million euros transfer related to Autema Project, after the Spanish Supreme Court communicated it did not admit the appeal against the High Court of Catalonia’s judgement which ratified the changes introduced in the concession regime by the Cata-lonian Regional Government (the Grantor) in 2015. As a consequence, as indicated in nota 6.5.1a) of the Consoli-dated Financial Statements, in 2020 this project is being accounted for according to the intangible asset model of IFRIC 12.
2. Intangible Assets IFRIC 12 (under construction), no current projects under construction.
3. Accounts receivable projects under IFRIC 12: no current proj-ects under development, after said Autema transfer to intan-gible asset model.
• Consolidation using the equity method, 13,623 million euros (14,177 million euros at December 31, 2019). Includes both proj-ects in operation and under construction that are consolidated using the equity method, such as 407ETR and extensions 4,178 million euros of 100% managed investment (4,421 million euros at December 31, 2019) or I-66 with 3,016 million euros at 100%
ANNUAL INTEGRATED REPORT 2020MANAGEMENT REPORT
129
APPENDIXALTERNATIVE PERFORMANCE MEASURES
(2,695 million euros at December 31, 2019). In the consolidated statement of financial position, these projects are included under Investments in associates, meaning the investment cannot be reconciled with the balance sheet.
• Explanation of use: data useful by Management to indicate the size of the portfolio of managed assets.
• Comparisons: the company presents comparisons with previous years.
• Consistency: the criteria employed for calculating the managed investment is the same as the previous year.
PROPORTIONAL RESULTS
• Definition: the Ferrovial proportional results are calculated as described below:.
– Infrastructure divisions (Toll Roads and Airports): the proportional results include the infra projects consoli-dated results in the proportion of Ferrovial’s ownership in those projects, regardless to the applied consolidation method.
– Rest of divisions: the proportional results include the figures reported in the consolidated profit and loss account, as the difference of applying the proportional method would not be relevant.
This information is prepared to Revenues and EBITDA
• Reconciliation: a reconciliation between total and proportional figures is provided in the web
• Explanation of use: the proportional results can be useful for investors and financial analysts to understand the real weight of business divisions in the operative results of the group, especially keeping in mind the weight of certain assets consolidated under the equity method as 407 ETR from Toronto and the airport of Heathrow. It is an indicator that other competitors with signifi-cant subsidiaries in infrastructure projects consolidated under the equity method present.
• Comparisons: the company presents comparisons with previous years.
• Consistency: the criteria used to calculate proportional results has changed since previous year, where contribution to the consol-idated results in the proportion of Ferrovial’s ownership where applied to all group subsidiaries. As previously explained, in fiscal year 2020 proportional results have only been applied to infra-structure divisions, as the difference of applying the proportional method to the other business divisions would not be relevant.
COVID-19 IMPACT
• Definition: COVID-19 impact in Ferrovial businesses has been calcu-lated considering the following premises for each business division.
Infrastructures divisions (Toll Roads and Airports)
COVID-19 impact has been estimated as the traffic drop when comparing current figures with the same period of last year. In terms of cash flow, as the reduction in dividends received from infrastructure assets, when comparing to previous year.
Construction division
COVID-19 impact has been calculated with a bottom-up approach, starting with every project, which has analyzed the impact considering the following elements which have impacted the division’s results.
– Fixed costs from activity stoppages, adapted processes for project ramp ups or productivity losses on the back of slower activity (i.e. rentals of machinery, offices and equipment, and other indirect costs)
– Increase in costs required to achieve project deadlines – Delays in supplies – Border closures and difficulties in mobilizing teams for
self-performance. – Related expenses to new H&S new measures. – Delays in the start-up of new projects – Services Division – The impact has been calculated through a bottom-up analysis
from contract level and comparing actual activity results to the budget 2020. The calculation includes the following types of impacts:
– Direct estimate of lower activity (i.g. tons of waste treatment, traffic or train frequencies).
– Clients strongly impacted by COVID-19 leading to significantly lower activity. The greatest impact can be seen in Oil & Gas contracts in N. America.
– In Transport (mostly Rail) & Utilities contracts in Amey, stoppages or delays in non-essential works and expected awards, coupled with costs overruns to cover employee availability due to quarantines and H&S measures rein-forcement
• Reconciliation: a breakdown of COVID-19 impact by business division is included in the note 1.2 of the Consolidated Financial Statements.
• Explanation of use: Ferrovial reports COVID-19 impact to provide a more reliable measure of the underlying profitability of its busi-nesses, when excluding the non-recurrent impact directly related to the pandemic.
• Comparisons: the comparison with previous year is not appli-cable, since the pandemic started in 2020
• Consistency: This is the first year where COVID-19 impact is appli-cabler.
MANAGEMENT REPORT 2020FERROVIAL S.A. AND SUBSIDIARIES
130
Ferrovial understands sustainability and corporate responsibility (CR) as a voluntary but essential commitment to participate in the economic, social and environmental development of the commu-nities where it operates. The CR Policy is based on the principles of the Global Compact and internationally accepted agreements and r esolutions related to the subject. It is the responsibility of the Ferrovial Board of Directors to ensure that these principles that the company has voluntarily assumed are complied with. The policy is available at www.ferrovial.com.
The content of this document constitutes a CR Policy report in itself. This offers its stakeholders detailed information on the policy support instruments to enforce compliance; the Corporate Responsibility strategy, formulated in the 20.19 Plan and continues in the Sustainability Strategic Plan; and the specific practices in the field of sustainability and CR, which are mentioned in their corresponding sections.
COMMITTEE
The Sustainability Committee is chaired by the Sustainability Manager and is composed of representatives from the business areas (Toll Roads, Airports, Construction, Services and Mobility) and corpo-rate areas (Human Resources, General Secretariat, Occupational Health and Safety, Quality and Environment, Risks and Innovation, Corporate Social Responsibility, Strategy and Investor Relations). On an annual basis, the Chairman of the Committee reports to the Board of Directors.
The Sustainability Committee is the link between the business areas and the corporation with Senior Management, reporting on the progress and results and proposing actions to the Management Committee, as well as transmitting to the rest of the company the approval of the proposals and results.
The main objective of this committee is to define the Strategic Sustainability Plan and ensure its monitoring. Its functions can be summarized as follows:
• Design, update and, if necessary, improve the Sustainability Strategy.
• Monitor and evaluate the company’s performance in the field of sustainability based on established indicators and action plans.
• Propose working groups on specific issues.• Share good practices from each of the areas on sustainability
issues.• Provide information for sustainability reporting (both internal and
external).• Analyze and assess sustainability trends, new business risks and
opportunities
STRATEGIC PLAN
The Strategic Plan is the indispensable tool to ensure that CR and sustainability is effective in fulfilling its mission and contributing to the development of the business, the generation of trust among its stakeholders and the fulfilment of the objectives in the medium and long term.
Ferrovial develops its plan every three years, performing an annual analysis of its degree of compliance. In 2019, the period of applica-tion of the company’s third CR plan, called Plan 20.19, which was in force during the period 2017 - 2019, has been completed.
For the 2020-2022 period the Sustainability Committee has promoted the new Plan, Sustainability Strategy 2030. This plan has been prepared taking into account the main global main trends, the regulatory and policy environment (UN Agenda 2030, Climate Change, and the European Green Deal), the main economic and financial frameworks (Task Force on Climate-Related Disclosures (TCFD), Taxonomy and the European Next Generation Plan), social challenges (new urban agenda, new mobility habits, post-COVID-19 effects such as teleworking as well as the rise of e-commerce), technological factors (energy transition and digitalization), envi-ronmental factors (climate change, water scarcity, biodiversity loss or public health), ESG investor requirements, major reporting frameworks (Global Reporting Initiative, Sustainability Accounting Standards Board (SASB)and the TCFD, as well as CR trend reports from various prestigious institutions. In addition, like the previous Plan, it is aligned with the global agenda set by the Sustainable Development Goals, focusing especially on SDGs 6 (water and sanitation), 9 (innovation and infrastructure) and 11 (sustainable cities and communities).
It has specific areas of action and objectives for each year it is in force, aligned with the business strategy, the Horizon 24 plan and covering Ferrovial’s value chain, from customers to suppliers. The initiatives are grouped around six global main trends that will end up irrevo-cably conditioning the business of any company and that Ferrovial intends to address through this plan. They are the following:
• Climate Change Strategy 2030, Decarbonization Plan. • Water footprint.• Natural capital. • Circular economy.• Sustainable mobility.• Community investment and social impact. • Innovation aligned with sustainability. • Good governance and business ethics.• Human Resources.• Health and Safety.• Alliances.
SUSTAINABILITY MANAGEMENT
ANNUAL INTEGRATED REPORT 2020MANAGEMENT REPORT
131
APPENDIXSUSTANABILITY MANAGEMENT
SUSTAINABILITY INDEXES
Ferrovial is periodically evaluated by analysts who take into account the company’s ESG performance. In 2020, the company formed part of the main sustainability indexes:
• Dow Jones Sustainability Index (DJSI): Ferrovial has been a member of this selective index for the last 19 years. It recently received the Bronze distinction in the Sustainability Yearbook 2021.
• FTSE4Good: the company has been part of this index in its last 17 editions. • CDP (Carbon Disclosure Project): highest rating “A” for its commitment in the fight against climate change. • MSCI: “A”, highest rating in its sector. • VIGEO: member of the Euronext-Vigeo Eurozone 120 and Europe 120 indexes.• STOXX: the company has been part of this index for six years running.• ISS ESG: Prime category.• GRESB: 81 points, A+
Cour
thou
se, S
antia
go d
e Ch
ile, C
hile
. © J
osé
Man
uel B
alle
ster
MANAGEMENT REPORT 2020FERROVIAL S.A. AND SUBSIDIARIES
132
INFORMATION PERIMETER
Ferrovial is made up of the parent company, Ferrovial S.A. and its subsidiaries. For detailed information on the companies, see the group in the Consolidated Annual Accounts.
In 2020, there were operations that involved changes in the group due to the acquisition of companies, the awarding of new contracts and the start of new businesses. There have also been corporate restructurings. Highlights include the sale of Broadspectrum to Ventia for 465 million Australian dollars and the sale of 50% of TW Power Services for 20 million Australian dollars. For more information, see pages 48-70 on business performance.
CONSOLIDATION PROCESS
The report includes all the companies in which Ferrovial has economic control, meaning a participation of more than 50%. In these cases, 100% of the information is reported. The list of subsidiaries and associated companies can be found in Annex II of the Consolidated Financial Statements, pages 174-297. Although the Services business is treated as an activity classified as financially discontinued, because it is available for sale, to comply with the requirements of Law 11/2018, non-financial information does include this division in its perimeter, offering a complete vision of all aspects and impacts of the business. Therefore, in cases where material is considered, data from the Services division will be disaggregated.
Also, following the indications of the GRI Guide Sustainability Reporting Standards, Ferrovial provides information on the indicators and material aspects of “outside the organization”, when the data has suffi-cient quality, and always separately. Ferrovial considers that the most relevant impacts are those related to the 407 ETR Toll Road in Canada and the airports in the United Kingdom, companies in which its share-holding is less than 50%. Some indicators of interest associated with these assets are those related to indirect emissions (scope 3), user satisfaction, and number of passengers travelling through airports.
TRACEABILITY
Ferrovial guarantees the traceability of information related to the Corporate Responsibility scope thanks to a reporting system, which has been available since 2007. This provides detailed information to company level, facilitating partial consolidation by geographical location or business. In 2020, a thorough review of the requested information was carried out to adapt the system to the information requirements of the company’s different stakeholders and the recom-mendations of the external and internal auditors. The software used has enabled corporate management to gather quarterly information for management and internal reporting to Senior Management.
In 2020, the reporting system collected 643 quantitative and qualita-tive indicators, in 116 companies, thanks to the collaboration of more than 200 users.
REFORMULATION OF THE INFORMATION
There were a number of changes in the group in 2020 that may affect the comparability of the data contained in the Report, although they are not particularly relevant in comparison to the company as a whole. To guarantee the maximum transparency and comparability of the data, the body of the report shows when an indicator from previous years has been modified or shows significant changes that affect the comparability of the information. The Report takes into account most of the requirements regarding the Non-Financial Information State-ment carried out by the National Securities Market Commission..
STAKEHOLDERS
Ferrovial is committed to the transparency of the information it shares with the market, through the continuous improvement of communica-tion channels with all its stakeholders, based on innovative corporate information that, in addition to financial aspects, takes into account the environmental and social variables.
The company considers stakeholders to be individuals or social groups with a legitimate interest, who are affected by the company’s present or future actions. This definition includes both the stakeholders that form part of the company’s value chain (shareholders, employees, investors, customers and suppliers), considered as partners in the development of the business, as well as external stakeholders (Administrations, Governments, media, analysts, business sector, unions, third sector and society in general), starting with the local communities in which the company undertakes its activities.
This relationship is dynamic since the environment changes more and more rapidly. To a large extent, Ferrovial’s business depends on its relations with the Public Administrations of the countries in which it operates. Ferrovial holds decision-making positions in organizations that promote Corporate Responsibility at a national and international level, such as Fundación SERES, Forética, Spanish Network of the Global Compact, CEO CSR Committee and the Spanish Association for Quality (AEC). In 2020, Ferrovial held the Chair of the Spanish Group of Green Growth and the Chief Executive Officer of Ferrovial became a member of the Executive Committee of the SERES Foundation.
Ferrovial is characterized by absolute political neutrality, developing its activities for both Public Administrations and private clients in the countries where it operates. The company does not make economic or in-kind contributions to political parties or electoral candidates. However, Ferrovial forms part of business or foundation representation
REPORTING PRINCIPLES
ANNUAL INTEGRATED REPORT 2020MANAGEMENT REPORT
133
APPENDIXREPORTING PRINCIPLES
organizations for commercial exchange between countries asso-ciated with the development of its activity or to the geographical area in which it operates. Through its presence and collaboration with these organizations, the company aspires to contribute to the progress and development of all those fields of action in which it is present. In 2020 the economic contribution to these organiza-tions was around 0.93 million euros, which includes the Associa-tion of Construction Companies and Infrastructure Concessionaires (SEOPAN).
Ferrovial’s considerations of the principles related to the content of the report, are explained in the specific section on materiality. For more information on the AA1000, GRI and SASB standards, see page 148 of GRI indicators.
MATERIAL ISSUES
Ferrovial considers relevant issues to be all those that can exert a substantial influence on the assessments and decisions of the stakeholders, affecting the ability to meet their present needs without compromising future generations.
A new materiality study was conducted in 2020 as part of Ferro-vial’s biennial update of this analysis. Given the exceptional situation arising from COVID-19, some specific reports addressing this issue have also been considered.
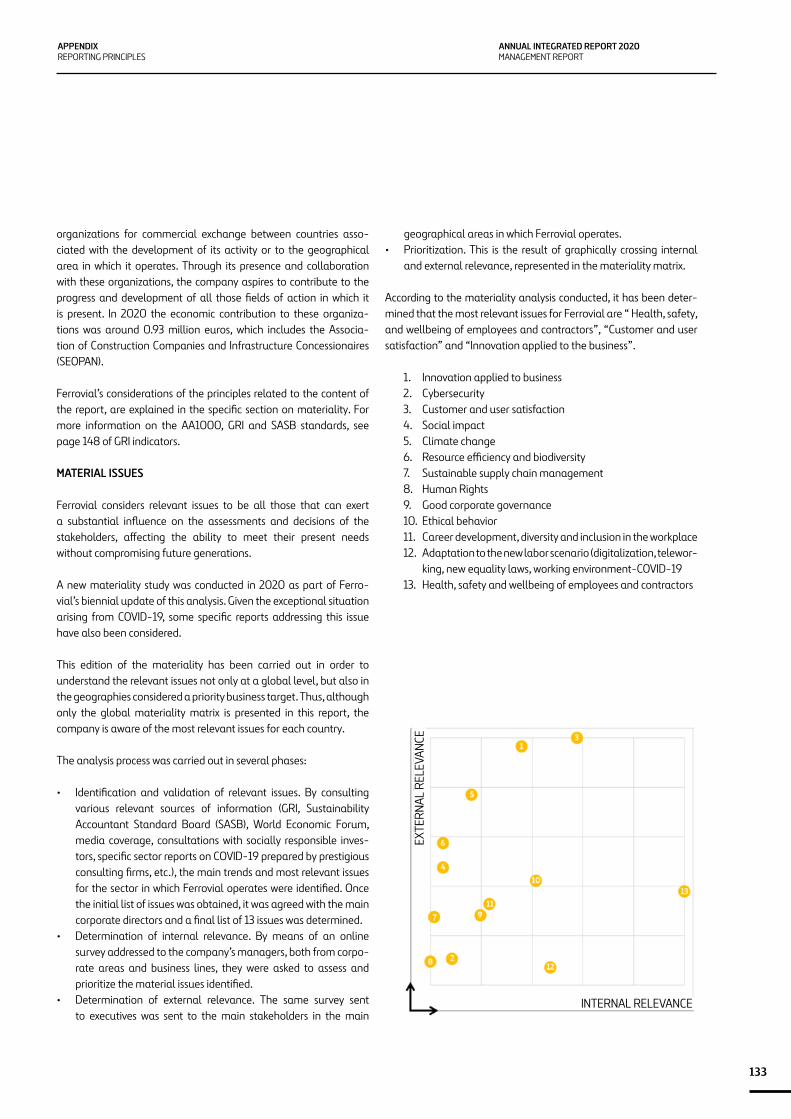
This edition of the materiality has been carried out in order to understand the relevant issues not only at a global level, but also in the geographies considered a priority business target. Thus, although only the global materiality matrix is presented in this report, the company is aware of the most relevant issues for each country.
The analysis process was carried out in several phases:
• Identification and validation of relevant issues. By consulting various relevant sources of information (GRI, Sustainability Accountant Standard Board (SASB), World Economic Forum, media coverage, consultations with socially responsible inves-tors, specific sector reports on COVID-19 prepared by prestigious consulting firms, etc.), the main trends and most relevant issues for the sector in which Ferrovial operates were identified. Once the initial list of issues was obtained, it was agreed with the main corporate directors and a final list of 13 issues was determined.
• Determination of internal relevance. By means of an online survey addressed to the company’s managers, both from corpo-rate areas and business lines, they were asked to assess and prioritize the material issues identified.
• Determination of external relevance. The same survey sent to executives was sent to the main stakeholders in the main
geographical areas in which Ferrovial operates.• Prioritization. This is the result of graphically crossing internal
and external relevance, represented in the materiality matrix. According to the materiality analysis conducted, it has been deter-mined that the most relevant issues for Ferrovial are “ Health, safety, and wellbeing of employees and contractors”, “Customer and user satisfaction” and “Innovation applied to the business”.
1. Innovation applied to business2. Cybersecurity3. Customer and user satisfaction4. Social impact5. Climate change6. Resource efficiency and biodiversity7. Sustainable supply chain management8. Human Rights9. Good corporate governance 10. Ethical behavior11. Career development, diversity and inclusion in the workplace12. Adaptation to the new labor scenario (digitalization, telewor-
king, new equality laws, working environment-COVID-1913. Health, safety and wellbeing of employees and contractors
INTERNAL RELEVANCE
EXTE
RNAL
REL
EVAN
CE
MANAGEMENT REPORT 2020FERROVIAL S.A. AND SUBSIDIARIES
134
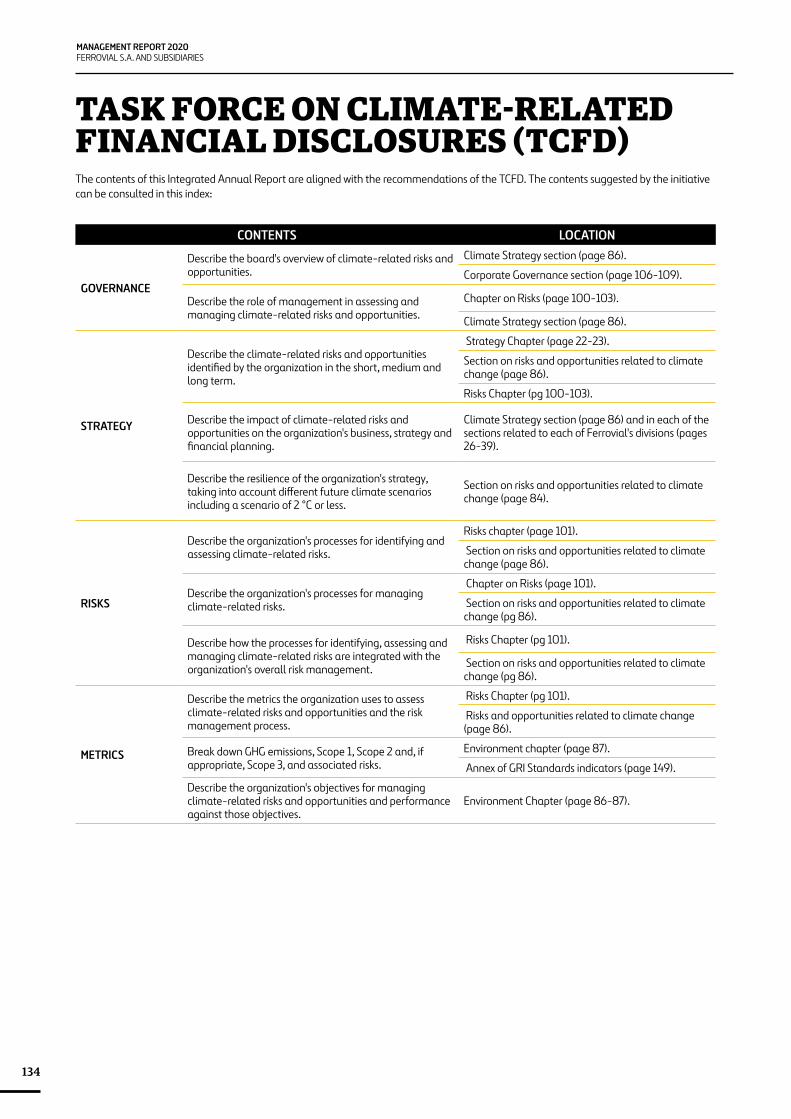
TASK FORCE ON CLIMATE-RELATED FINANCIAL DISCLOSURES (TCFD)The contents of this Integrated Annual Report are aligned with the recommendations of the TCFD. The contents suggested by the initiative can be consulted in this index:
CONTENTS LOCATION
GOVERNANCE
Describe the board's overview of climate-related risks and opportunities.
Climate Strategy section (page 86).
Corporate Governance section (page 106-109).
Describe the role of management in assessing and managing climate-related risks and opportunities.
Chapter on Risks (page 100-103).
Climate Strategy section (page 86).
STRATEGY
Describe the climate-related risks and opportunities identified by the organization in the short, medium and long term.
Strategy Chapter (page 22-23).
Section on risks and opportunities related to climate change (page 86).
Risks Chapter (pg 100-103).
Describe the impact of climate-related risks and opportunities on the organization's business, strategy and financial planning.
Climate Strategy section (page 86) and in each of the sections related to each of Ferrovial's divisions (pages 26-39).
Describe the resilience of the organization's strategy, taking into account different future climate scenarios including a scenario of 2 °C or less.
Section on risks and opportunities related to climate change (page 84).
RISKS
Describe the organization's processes for identifying and assessing climate-related risks.
Risks chapter (page 101).
Section on risks and opportunities related to climate change (page 86).
Describe the organization's processes for managing climate-related risks.
Chapter on Risks (page 101).
Section on risks and opportunities related to climate change (pg 86).
Describe how the processes for identifying, assessing and managing climate-related risks are integrated with the organization's overall risk management.
Risks Chapter (pg 101).
Section on risks and opportunities related to climate change (pg 86).
METRICS
Describe the metrics the organization uses to assess climate-related risks and opportunities and the risk management process.
Risks Chapter (pg 101).
Risks and opportunities related to climate change (page 86).
Break down GHG emissions, Scope 1, Scope 2 and, if appropriate, Scope 3, and associated risks.
Environment chapter (page 87).
Annex of GRI Standards indicators (page 149).
Describe the organization's objectives for managing climate-related risks and opportunities and performance against those objectives.
Environment Chapter (page 86-87).
ANNUAL INTEGRATED REPORT 2020MANAGEMENT REPORT
135
APPENDIXTCFD - SCOREBOARD
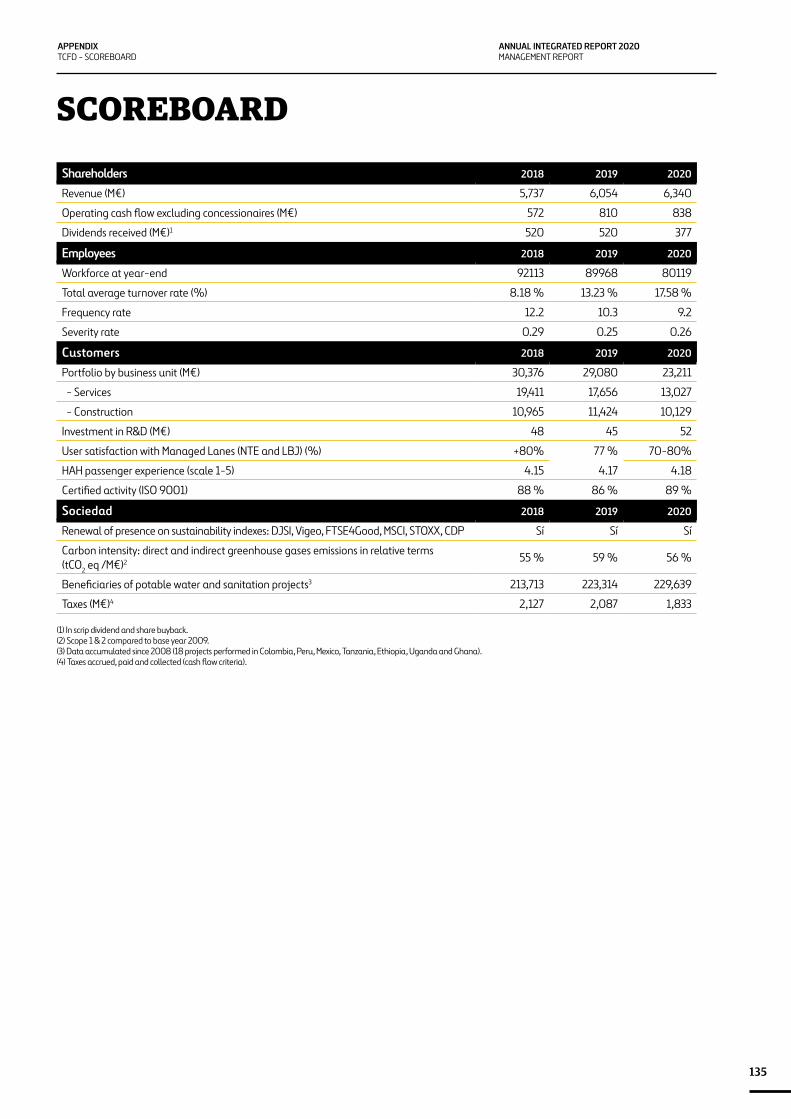
SCOREBOARD
(1) In scrip dividend and share buyback.(2) Scope 1 & 2 compared to base year 2009. (3) Data accumulated since 2008 (18 projects performed in Colombia, Peru, Mexico, Tanzania, Ethiopia, Uganda and Ghana).(4) Taxes accrued, paid and collected (cash flow criteria).
Shareholders 2018 2019 2020
Revenue (M€) 5,737 6,054 6,340
Operating cash flow excluding concessionaires (M€) 572 810 838
Dividends received (M€)1 520 520 377
Employees 2018 2019 2020
Workforce at year-end 92113 89968 80119
Total average turnover rate (%) 8.18 % 13.23 % 17.58 %
Frequency rate 12.2 10.3 9.2
Severity rate 0.29 0.25 0.26
Customers 2018 2019 2020
Portfolio by business unit (M€) 30,376 29,080 23,211
- Services 19,411 17,656 13,027
- Construction 10,965 11,424 10,129
Investment in R&D (M€) 48 45 52
User satisfaction with Managed Lanes (NTE and LBJ) (%) +80% 77 % 70-80%
HAH passenger experience (scale 1-5) 4.15 4.17 4.18
Certified activity (ISO 9001) 88 % 86 % 89 %
Sociedad 2018 2019 2020
Renewal of presence on sustainability indexes: DJSI, Vigeo, FTSE4Good, MSCI, STOXX, CDP Sí Sí Sí
Carbon intensity: direct and indirect greenhouse gases emissions in relative terms (tCO2 eq /M€)2 55 % 59 % 56 %
Beneficiaries of potable water and sanitation projects3 213,713 223,314 229,639
Taxes (M€)4 2,127 2,087 1,833
MANAGEMENT REPORT 2020FERROVIAL S.A. AND SUBSIDIARIES
136
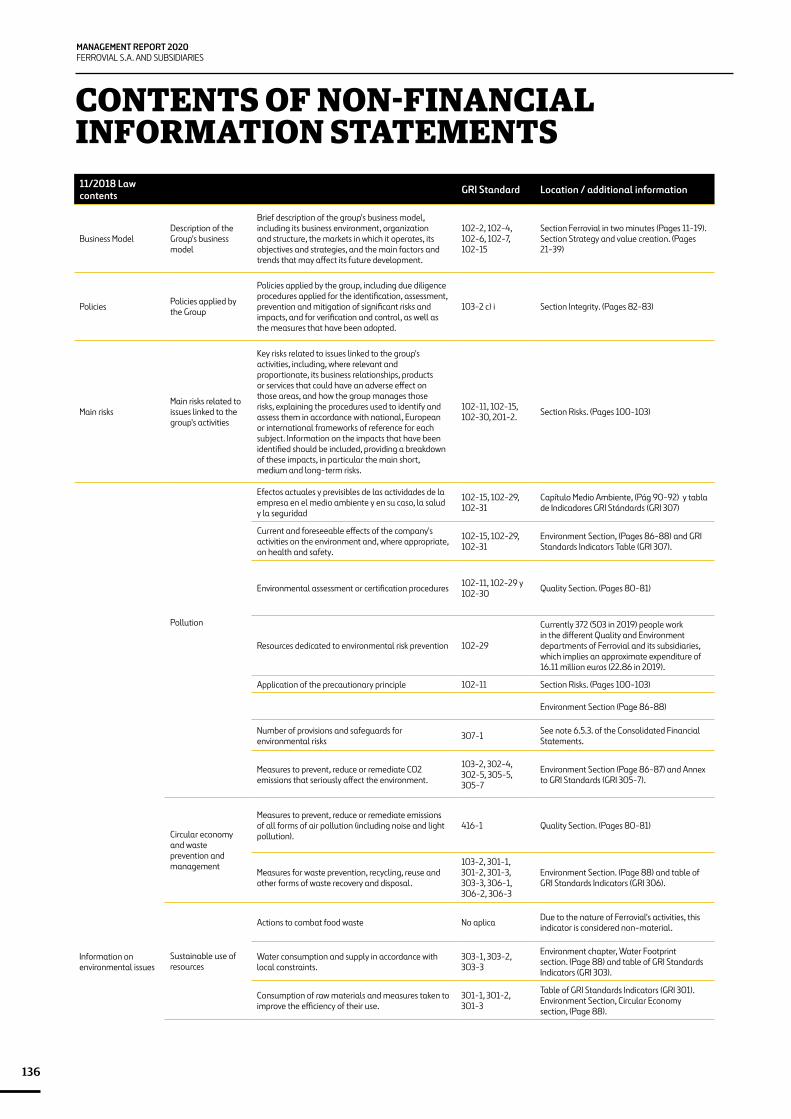
CONTENTS OF NON-FINANCIAL INFORMATION STATEMENTS11/2018 Law contents GRI Standard Location / additional information
Business ModelDescription of the Group's business model
Brief description of the group's business model, including its business environment, organization and structure, the markets in which it operates, its objectives and strategies, and the main factors and trends that may affect its future development.
102-2, 102-4, 102-6, 102-7, 102-15
Section Ferrovial in two minutes (Pages 11-19). Section Strategy and value creation. (Pages 21-39)
Policies Policies applied by the Group
Policies applied by the group, including due diligence procedures applied for the identification, assessment, prevention and mitigation of significant risks and impacts, and for verification and control, as well as the measures that have been adopted.
103-2 c) i Section Integrity. (Pages 82-83)
Main risksMain risks related to issues linked to the group's activities
Key risks related to issues linked to the group's activities, including, where relevant and proportionate, its business relationships, products or services that could have an adverse effect on those areas, and how the group manages those risks, explaining the procedures used to identify and assess them in accordance with national, European or international frameworks of reference for each subject. Information on the impacts that have been identified should be included, providing a breakdown of these impacts, in particular the main short, medium and long-term risks.
102-11, 102-15, 102-30, 201-2. Section Risks. (Pages 100-103)
Pollution
Efectos actuales y previsibles de las actividades de la empresa en el medio ambiente y en su caso, la salud y la seguridad
102-15, 102-29, 102-31
Capítulo Medio Ambiente, (Pág 90-92) y tabla de Indicadores GRI Stándards (GRI 307)
Current and foreseeable effects of the company's activities on the environment and, where appropriate, on health and safety.
102-15, 102-29, 102-31
Environment Section, (Pages 86-88) and GRI Standards Indicators Table (GRI 307).
Environmental assessment or certification procedures 102-11, 102-29 y 102-30 Quality Section. (Pages 80-81)
Resources dedicated to environmental risk prevention 102-29
Currently 372 (503 in 2019) people work in the different Quality and Environment departments of Ferrovial and its subsidiaries, which implies an approximate expenditure of 16.11 million euros (22.86 in 2019).
Application of the precautionary principle 102-11 Section Risks. (Pages 100-103)
Environment Section (Page 86-88)
Number of provisions and safeguards for environmental risks 307-1 See note 6.5.3. of the Consolidated Financial
Statements.
Measures to prevent, reduce or remediate CO2 emissions that seriously affect the environment.
103-2, 302-4, 302-5, 305-5, 305-7
Environment Section (Page 86-87) and Annex to GRI Standards (GRI 305-7).
Circular economy and waste prevention and management
Measures to prevent, reduce or remediate emissions of all forms of air pollution (including noise and light pollution).
416-1 Quality Section. (Pages 80-81)
Measures for waste prevention, recycling, reuse and other forms of waste recovery and disposal.
103-2, 301-1, 301-2, 301-3, 303-3, 306-1, 306-2, 306-3
Environment Section. (Page 88) and table of GRI Standards Indicators (GRI 306).
Sustainable use of resources
Actions to combat food waste No aplica Due to the nature of Ferrovial's activities, this indicator is considered non-material.
Information on environmental issues
Water consumption and supply in accordance with local constraints.
303-1, 303-2, 303-3
Environment chapter, Water Footprint section. (Page 88) and table of GRI Standards Indicators (GRI 303).
Consumption of raw materials and measures taken to improve the efficiency of their use.
301-1, 301-2, 301-3
Table of GRI Standards Indicators (GRI 301). Environment Section, Circular Economy section, (Page 88).
ANNUAL INTEGRATED REPORT 2020MANAGEMENT REPORT
137
APPENDIXCONTENTS OF NON-FINANCIAL INFORMATION STATEMENTS
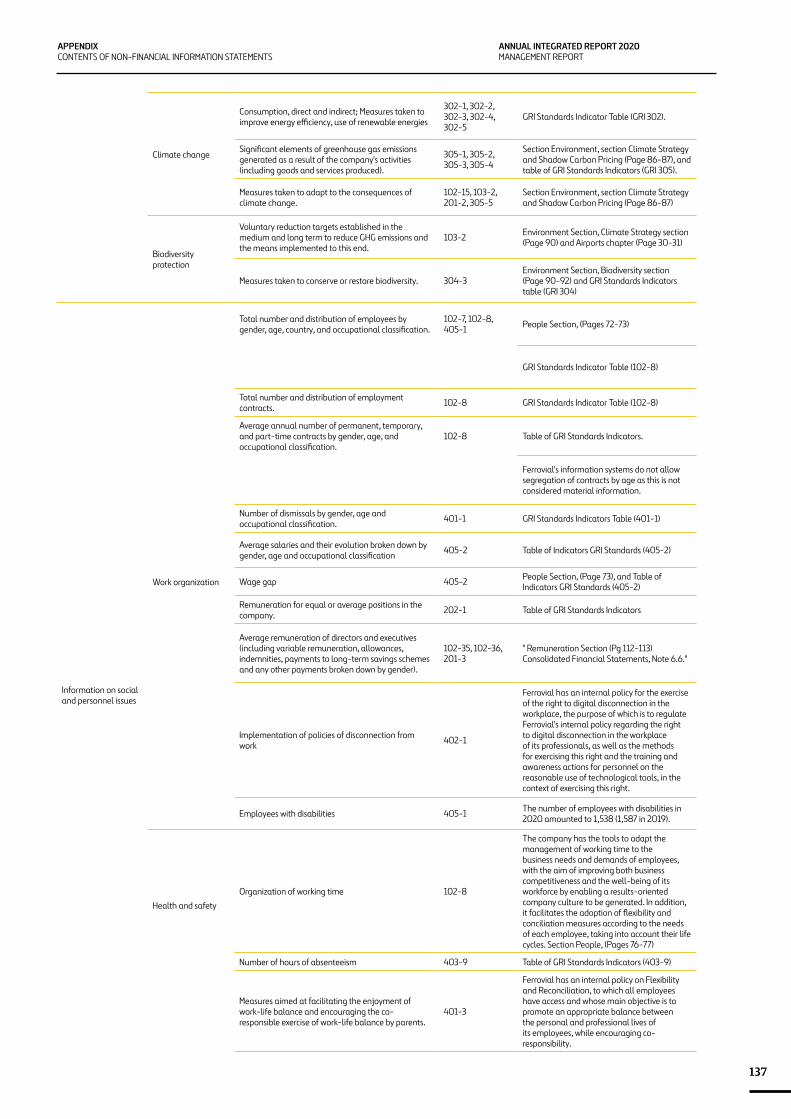
Climate change
Consumption, direct and indirect; Measures taken to improve energy efficiency, use of renewable energies
302-1, 302-2, 302-3, 302-4, 302-5
GRI Standards Indicator Table (GRI 302).
Significant elements of greenhouse gas emissions generated as a result of the company's activities (including goods and services produced).
305-1, 305-2, 305-3, 305-4
Section Environment, section Climate Strategy and Shadow Carbon Pricing (Page 86-87), and table of GRI Standards Indicators (GRI 305).
Measures taken to adapt to the consequences of climate change.
102-15, 103-2, 201-2, 305-5
Section Environment, section Climate Strategy and Shadow Carbon Pricing (Page 86-87)
Biodiversity protection
Voluntary reduction targets established in the medium and long term to reduce GHG emissions and the means implemented to this end.
103-2 Environment Section, Climate Strategy section (Page 90) and Airports chapter (Page 30-31)
Measures taken to conserve or restore biodiversity. 304-3 Environment Section, Biodiversity section (Page 90-92) and GRI Standards Indicators table (GRI 304)
Information on social and personnel issues
Work organization
Total number and distribution of employees by gender, age, country, and occupational classification.
102-7, 102-8, 405-1 People Section, (Pages 72-73)
GRI Standards Indicator Table (102-8)
Total number and distribution of employment contracts. 102-8 GRI Standards Indicator Table (102-8)
Average annual number of permanent, temporary, and part-time contracts by gender, age, and occupational classification.
102-8 Table of GRI Standards Indicators.
Ferrovial's information systems do not allow segregation of contracts by age as this is not considered material information.
Number of dismissals by gender, age and occupational classification. 401-1 GRI Standards Indicators Table (401-1)
Average salaries and their evolution broken down by gender, age and occupational classification 405-2 Table of Indicators GRI Standards (405-2)
Wage gap 405-2 People Section, (Page 73), and Table of Indicators GRI Standards (405-2)
Remuneration for equal or average positions in the company. 202-1 Table of GRI Standards Indicators
Average remuneration of directors and executives (including variable remuneration, allowances, indemnities, payments to long-term savings schemes and any other payments broken down by gender).
102-35, 102-36, 201-3
" Remuneration Section (Pg 112-113) Consolidated Financial Statements, Note 6.6."
Implementation of policies of disconnection from work 402-1
Ferrovial has an internal policy for the exercise of the right to digital disconnection in the workplace, the purpose of which is to regulate Ferrovial's internal policy regarding the right to digital disconnection in the workplace of its professionals, as well as the methods for exercising this right and the training and awareness actions for personnel on the reasonable use of technological tools, in the context of exercising this right.
Employees with disabilities 405-1 The number of employees with disabilities in 2020 amounted to 1,538 (1,587 in 2019).
Health and safety
Organization of working time 102-8
The company has the tools to adapt the management of working time to the business needs and demands of employees, with the aim of improving both business competitiveness and the well-being of its workforce by enabling a results-oriented company culture to be generated. In addition, it facilitates the adoption of flexibility and conciliation measures according to the needs of each employee, taking into account their life cycles. Section People, (Pages 76-77)
Number of hours of absenteeism 403-9 Table of GRI Standards Indicators (403-9)
Measures aimed at facilitating the enjoyment of work-life balance and encouraging the co-responsible exercise of work-life balance by parents.
401-3
Ferrovial has an internal policy on Flexibility and Reconciliation, to which all employees have access and whose main objective is to promote an appropriate balance between the personal and professional lives of its employees, while encouraging co-responsibility.
MANAGEMENT REPORT 2020FERROVIAL S.A. AND SUBSIDIARIES
138
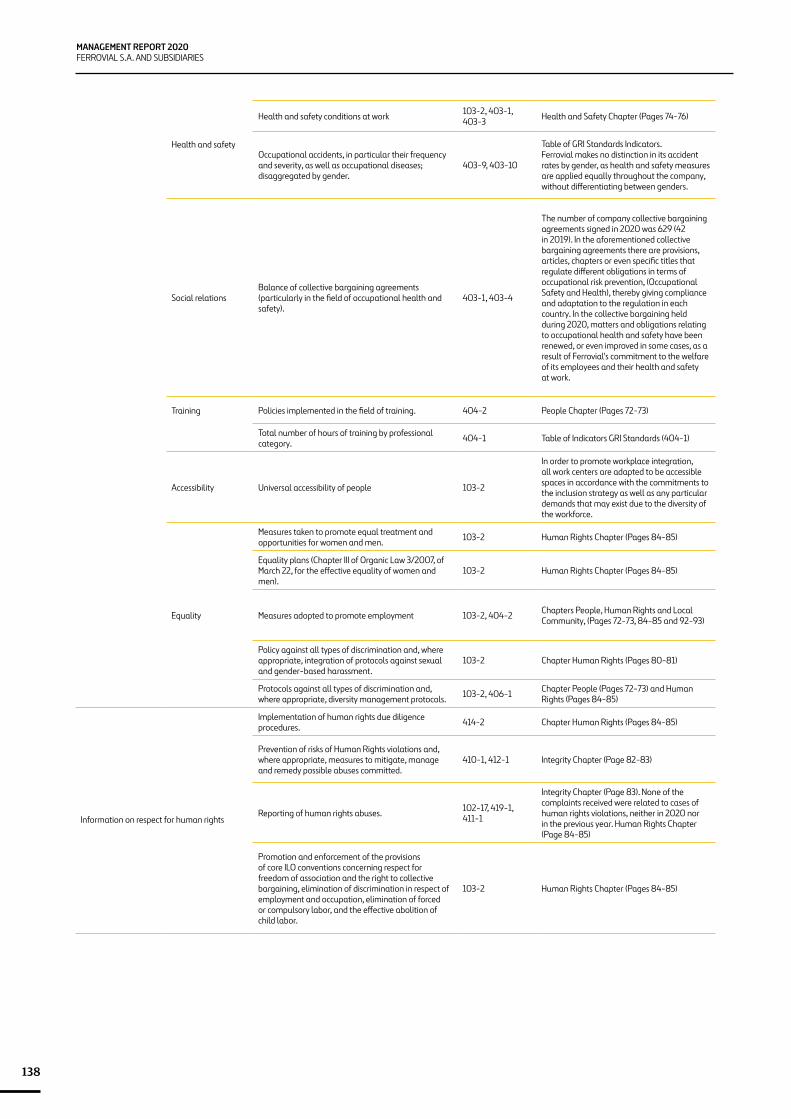
Health and safety
Health and safety conditions at work 103-2, 403-1, 403-3 Health and Safety Chapter (Pages 74-76)
Occupational accidents, in particular their frequency and severity, as well as occupational diseases; disaggregated by gender.
403-9, 403-10
Table of GRI Standards Indicators.Ferrovial makes no distinction in its accident rates by gender, as health and safety measures are applied equally throughout the company, without differentiating between genders.
Social relationsBalance of collective bargaining agreements (particularly in the field of occupational health and safety).
403-1, 403-4
The number of company collective bargaining agreements signed in 2020 was 629 (42 in 2019). In the aforementioned collective bargaining agreements there are provisions, articles, chapters or even specific titles that regulate different obligations in terms of occupational risk prevention, (Occupational Safety and Health), thereby giving compliance and adaptation to the regulation in each country. In the collective bargaining held during 2020, matters and obligations relating to occupational health and safety have been renewed, or even improved in some cases, as a result of Ferrovial's commitment to the welfare of its employees and their health and safety at work.
Training Policies implemented in the field of training. 404-2 People Chapter (Pages 72-73)
Total number of hours of training by professional category. 404-1 Table of Indicators GRI Standards (404-1)
Accessibility Universal accessibility of people 103-2
In order to promote workplace integration, all work centers are adapted to be accessible spaces in accordance with the commitments to the inclusion strategy as well as any particular demands that may exist due to the diversity of the workforce.
Equality
Measures taken to promote equal treatment and opportunities for women and men. 103-2 Human Rights Chapter (Pages 84-85)
Equality plans (Chapter III of Organic Law 3/2007, of March 22, for the effective equality of women and men).
103-2 Human Rights Chapter (Pages 84-85)
Measures adopted to promote employment 103-2, 404-2 Chapters People, Human Rights and Local Community, (Pages 72-73, 84-85 and 92-93)
Policy against all types of discrimination and, where appropriate, integration of protocols against sexual and gender-based harassment.
103-2 Chapter Human Rights (Pages 80-81)
Protocols against all types of discrimination and, where appropriate, diversity management protocols. 103-2, 406-1 Chapter People (Pages 72-73) and Human
Rights (Pages 84-85)
Information on respect for human rights
Implementation of human rights due diligence procedures. 414-2 Chapter Human Rights (Pages 84-85)
Prevention of risks of Human Rights violations and, where appropriate, measures to mitigate, manage and remedy possible abuses committed.
410-1, 412-1 Integrity Chapter (Page 82-83)
Reporting of human rights abuses. 102-17, 419-1, 411-1
Integrity Chapter (Page 83). None of the complaints received were related to cases of human rights violations, neither in 2020 nor in the previous year. Human Rights Chapter (Page 84-85)
Promotion and enforcement of the provisions of core ILO conventions concerning respect for freedom of association and the right to collective bargaining, elimination of discrimination in respect of employment and occupation, elimination of forced or compulsory labor, and the effective abolition of child labor.
103-2 Human Rights Chapter (Pages 84-85)
ANNUAL INTEGRATED REPORT 2020MANAGEMENT REPORT
139
APPENDIXCONTENTS OF NON-FINANCIAL INFORMATION STATEMENTSSUSTAINABILITY ACCOUNTING STANDARDS BOARD INDICATORS
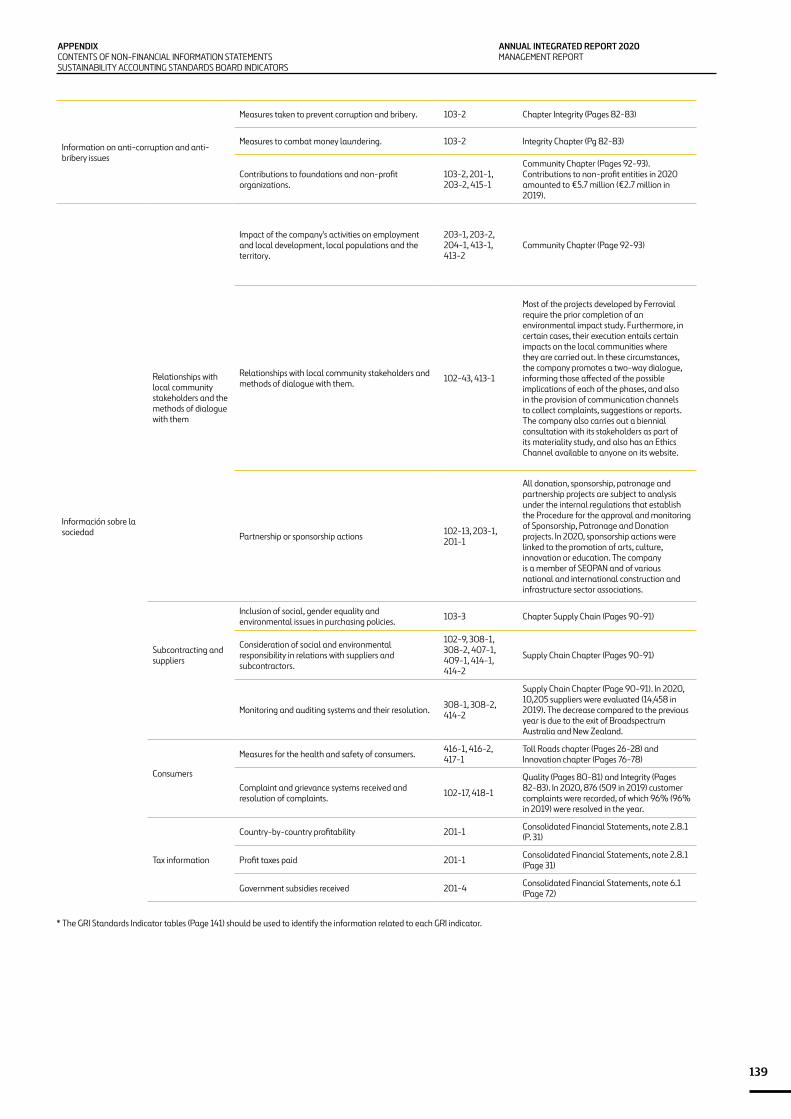
Information on anti-corruption and anti-bribery issues
Measures taken to prevent corruption and bribery. 103-2 Chapter Integrity (Pages 82-83)
Measures to combat money laundering. 103-2 Integrity Chapter (Pg 82-83)
Contributions to foundations and non-profit organizations.
103-2, 201-1, 203-2, 415-1
Community Chapter (Pages 92-93). Contributions to non-profit entities in 2020 amounted to €5.7 million (€2.7 million in 2019).
Información sobre la sociedad
Relationships with local community stakeholders and the methods of dialogue with them
Impact of the company's activities on employment and local development, local populations and the territory.
203-1, 203-2, 204-1, 413-1, 413-2
Community Chapter (Page 92-93)
Relationships with local community stakeholders and methods of dialogue with them. 102-43, 413-1
Most of the projects developed by Ferrovial require the prior completion of an environmental impact study. Furthermore, in certain cases, their execution entails certain impacts on the local communities where they are carried out. In these circumstances, the company promotes a two-way dialogue, informing those affected of the possible implications of each of the phases, and also in the provision of communication channels to collect complaints, suggestions or reports. The company also carries out a biennial consultation with its stakeholders as part of its materiality study, and also has an Ethics Channel available to anyone on its website.
Partnership or sponsorship actions 102-13, 203-1, 201-1
All donation, sponsorship, patronage and partnership projects are subject to analysis under the internal regulations that establish the Procedure for the approval and monitoring of Sponsorship, Patronage and Donation projects. In 2020, sponsorship actions were linked to the promotion of arts, culture, innovation or education. The company is a member of SEOPAN and of various national and international construction and infrastructure sector associations.
Inclusion of social, gender equality and environmental issues in purchasing policies. 103-3 Chapter Supply Chain (Pages 90-91)
Subcontracting and suppliers
Consideration of social and environmental responsibility in relations with suppliers and subcontractors.
102-9, 308-1, 308-2, 407-1, 409-1, 414-1, 414-2
Supply Chain Chapter (Pages 90-91)
Monitoring and auditing systems and their resolution. 308-1, 308-2, 414-2
Supply Chain Chapter (Page 90-91). In 2020, 10,205 suppliers were evaluated (14,458 in 2019). The decrease compared to the previous year is due to the exit of Broadspectrum Australia and New Zealand.
Consumers
Measures for the health and safety of consumers. 416-1, 416-2, 417-1
Toll Roads chapter (Pages 26-28) and Innovation chapter (Pages 76-78)
Complaint and grievance systems received and resolution of complaints. 102-17, 418-1
Quality (Pages 80-81) and Integrity (Pages 82-83). In 2020, 876 (509 in 2019) customer complaints were recorded, of which 96% (96% in 2019) were resolved in the year.
Country-by-country profitability 201-1 Consolidated Financial Statements, note 2.8.1 (P. 31)
Tax information Profit taxes paid 201-1 Consolidated Financial Statements, note 2.8.1 (Page 31)
Government subsidies received 201-4 Consolidated Financial Statements, note 6.1 (Page 72)
* The GRI Standards Indicator tables (Page 141) should be used to identify the information related to each GRI indicator.
MANAGEMENT REPORT 2020FERROVIAL S.A. AND SUBSIDIARIES
140
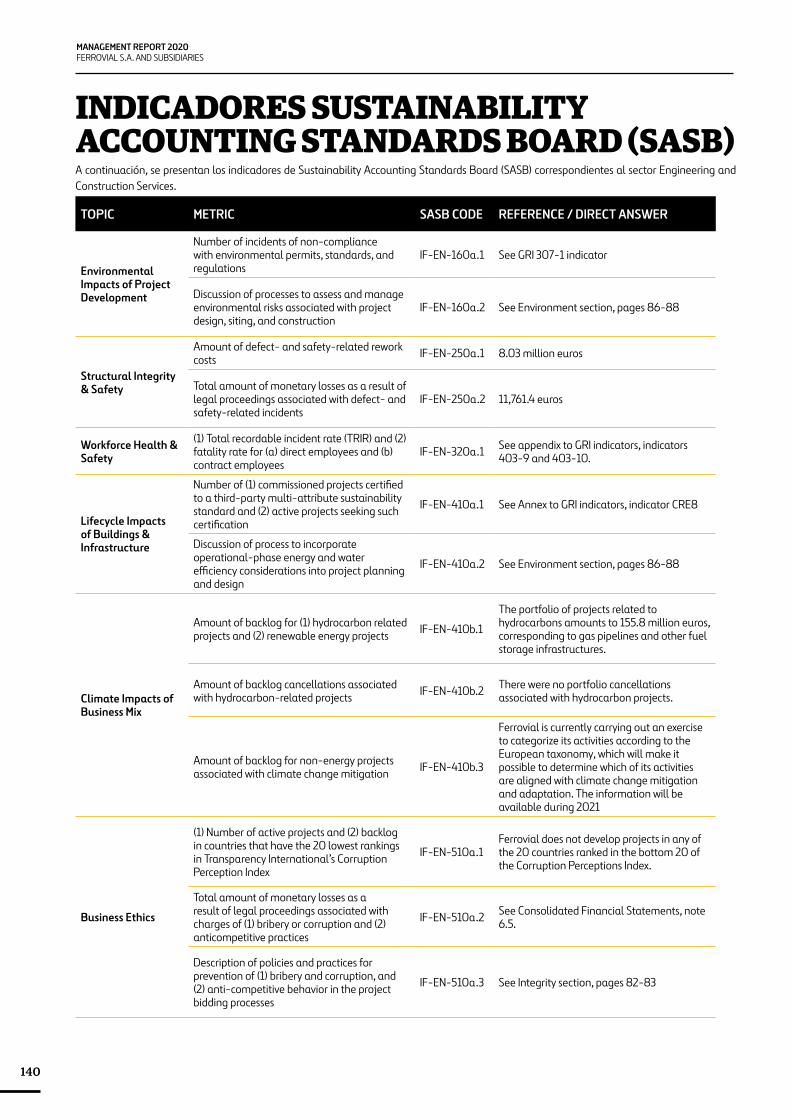
INDICADORES SUSTAINABILITY ACCOUNTING STANDARDS BOARD (SASB)A continuación, se presentan los indicadores de Sustainability Accounting Standards Board (SASB) correspondientes al sector Engineering and Construction Services.
TOPIC METRIC SASB CODE REFERENCE / DIRECT ANSWER
Environmental Impacts of Project Development
Number of incidents of non-compliance with environmental permits, standards, and regulations
IF-EN-160a.1 See GRI 307-1 indicator
Discussion of processes to assess and manage environmental risks associated with project design, siting, and construction
IF-EN-160a.2 See Environment section, pages 86-88
Structural Integrity & Safety
Amount of defect- and safety-related rework costs IF-EN-250a.1 8.03 million euros
Total amount of monetary losses as a result of legal proceedings associated with defect- and safety-related incidents
IF-EN-250a.2 11,761.4 euros
Workforce Health & Safety
(1) Total recordable incident rate (TRIR) and (2) fatality rate for (a) direct employees and (b) contract employees
IF-EN-320a.1 See appendix to GRI indicators, indicators 403-9 and 403-10.
Lifecycle Impacts of Buildings & Infrastructure
Number of (1) commissioned projects certified to a third-party multi-attribute sustainability standard and (2) active projects seeking such certification
IF-EN-410a.1 See Annex to GRI indicators, indicator CRE8
Discussion of process to incorporate operational-phase energy and water efficiency considerations into project planning and design
IF-EN-410a.2 See Environment section, pages 86-88
Climate Impacts of Business Mix
Amount of backlog for (1) hydrocarbon related projects and (2) renewable energy projects IF-EN-410b.1
The portfolio of projects related to hydrocarbons amounts to 155.8 million euros, corresponding to gas pipelines and other fuel storage infrastructures.
Amount of backlog cancellations associated with hydrocarbon-related projects IF-EN-410b.2 There were no portfolio cancellations
associated with hydrocarbon projects.
Amount of backlog for non-energy projects associated with climate change mitigation IF-EN-410b.3
Ferrovial is currently carrying out an exercise to categorize its activities according to the European taxonomy, which will make it possible to determine which of its activities are aligned with climate change mitigation and adaptation. The information will be available during 2021
Business Ethics
(1) Number of active projects and (2) backlog in countries that have the 20 lowest rankings in Transparency International’s Corruption Perception Index
IF-EN-510a.1Ferrovial does not develop projects in any of the 20 countries ranked in the bottom 20 of the Corruption Perceptions Index.
Total amount of monetary losses as a result of legal proceedings associated with charges of (1) bribery or corruption and (2) anticompetitive practices
IF-EN-510a.2 See Consolidated Financial Statements, note 6.5.
Description of policies and practices for prevention of (1) bribery and corruption, and (2) anti-competitive behavior in the project bidding processes
IF-EN-510a.3 See Integrity section, pages 82-83
ANNUAL INTEGRATED REPORT 2020MANAGEMENT REPORT
141
APPENDIXGRI STANDARDS INDICATORS
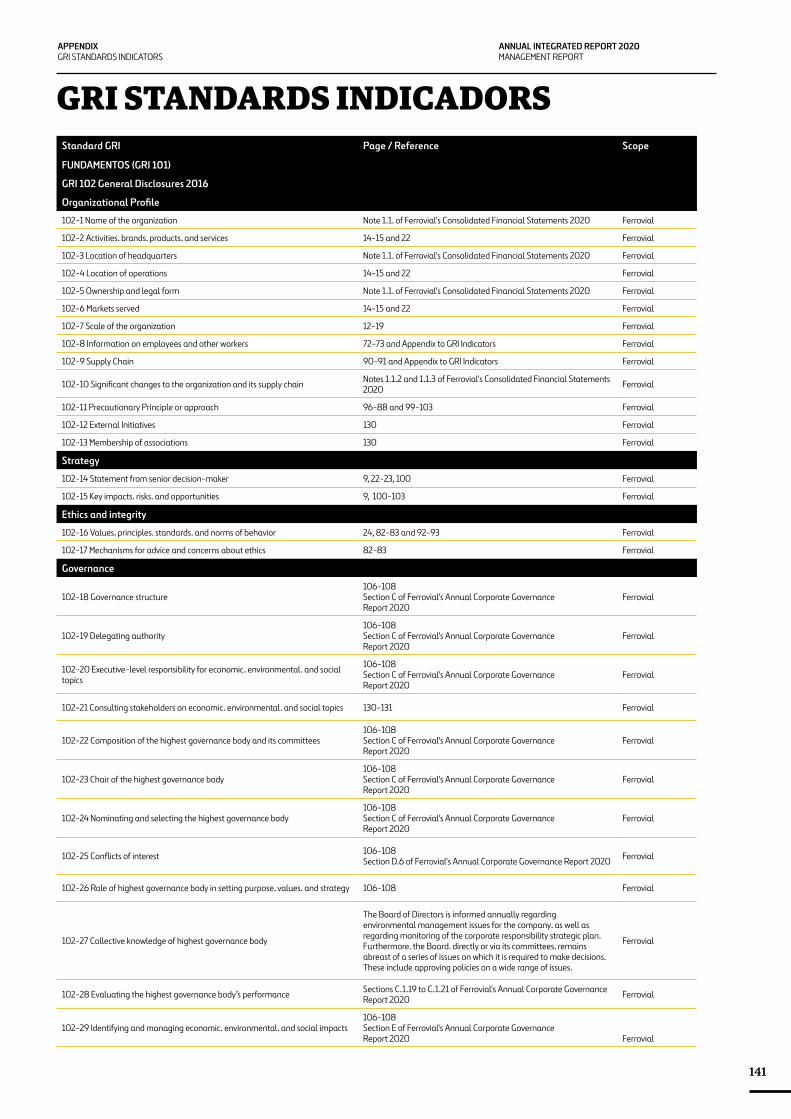
GRI STANDARDS INDICADORS
Standard GRI Page / Reference Scope
FUNDAMENTOS (GRI 101)
GRI 102 General Disclosures 2016
Organizational Profile
102-1 Name of the organization Note 1.1. of Ferrovial's Consolidated Financial Statements 2020 Ferrovial
102-2 Activities. brands. products. and services 14-15 and 22 Ferrovial
102-3 Location of headquarters Note 1.1. of Ferrovial's Consolidated Financial Statements 2020 Ferrovial
102-4 Location of operations 14-15 and 22 Ferrovial
102-5 Ownership and legal form Note 1.1. of Ferrovial's Consolidated Financial Statements 2020 Ferrovial
102-6 Markets served 14-15 and 22 Ferrovial
102-7 Scale of the organization 12-19 Ferrovial
102-8 Information on employees and other workers 72-73 and Appendix to GRI Indicators Ferrovial
102-9 Supply Chain 90-91 and Appendix to GRI Indicators Ferrovial
102-10 Significant changes to the organization and its supply chain Notes 1.1.2 and 1.1.3 of Ferrovial's Consolidated Financial Statements 2020 Ferrovial
102-11 Precautionary Principle or approach 96-88 and 99-103 Ferrovial
102-12 External Initiatives 130 Ferrovial
102-13 Membership of associations 130 Ferrovial
Strategy
102-14 Statement from senior decision-maker 9, 22-23, 100 Ferrovial
102-15 Key impacts. risks. and opportunities 9, 100-103 Ferrovial
Ethics and integrity
102-16 Values. principles. standards. and norms of behavior 24, 82-83 and 92-93 Ferrovial
102-17 Mechanisms for advice and concerns about ethics 82-83 Ferrovial
Governance
102-18 Governance structure 106-108 Section C of Ferrovial's Annual Corporate Governance Report 2020
Ferrovial
102-19 Delegating authority 106-108 Section C of Ferrovial's Annual Corporate Governance Report 2020
Ferrovial
102-20 Executive-level responsibility for economic. environmental. and social topics
106-108 Section C of Ferrovial's Annual Corporate Governance Report 2020
Ferrovial
102-21 Consulting stakeholders on economic. environmental. and social topics 130-131 Ferrovial
102-22 Composition of the highest governance body and its committees 106-108 Section C of Ferrovial's Annual Corporate Governance Report 2020
Ferrovial
102-23 Chair of the highest governance body 106-108 Section C of Ferrovial's Annual Corporate Governance Report 2020
Ferrovial
102-24 Nominating and selecting the highest governance body 106-108 Section C of Ferrovial's Annual Corporate Governance Report 2020
Ferrovial
102-25 Conflicts of interest 106-108 Section D.6 of Ferrovial's Annual Corporate Governance Report 2020 Ferrovial
102-26 Role of highest governance body in setting purpose. values. and strategy 106-108 Ferrovial
102-27 Collective knowledge of highest governance body
The Board of Directors is informed annually regarding environmental management issues for the company. as well as regarding monitoring of the corporate responsibility strategic plan. Furthermore. the Board. directly or via its committees. remains abreast of a series of issues on which it is required to make decisions. These include approving policies on a wide range of issues.
Ferrovial
102-28 Evaluating the highest governance body’s performance Sections C.1.19 to C.1.21 of Ferrovial's Annual Corporate Governance Report 2020 Ferrovial
102-29 Identifying and managing economic. environmental. and social impacts106-108 Section E of Ferrovial's Annual Corporate Governance Report 2020 Ferrovial
MANAGEMENT REPORT 2020FERROVIAL S.A. AND SUBSIDIARIES
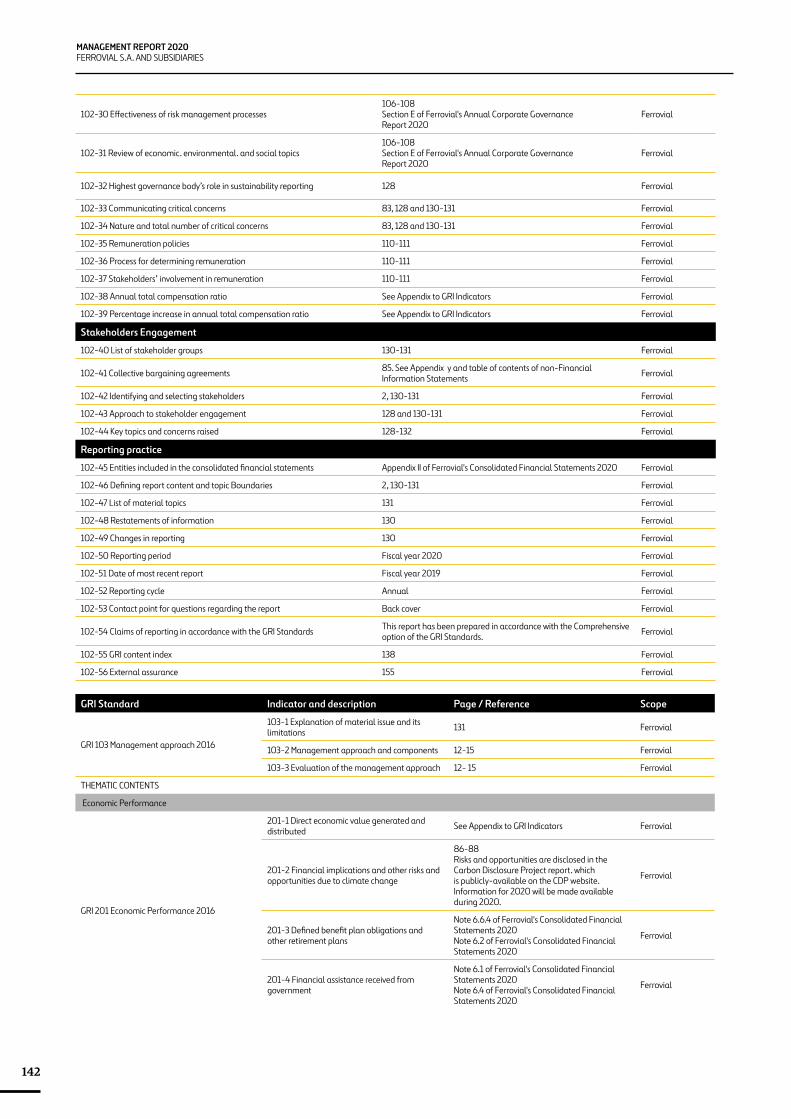
142
102-30 Effectiveness of risk management processes 106-108 Section E of Ferrovial's Annual Corporate Governance Report 2020
Ferrovial
102-31 Review of economic. environmental. and social topics106-108 Section E of Ferrovial's Annual Corporate Governance Report 2020
Ferrovial
102-32 Highest governance body’s role in sustainability reporting 128 Ferrovial
102-33 Communicating critical concerns 83, 128 and 130-131 Ferrovial
102-34 Nature and total number of critical concerns 83, 128 and 130-131 Ferrovial
102-35 Remuneration policies 110-111 Ferrovial
102-36 Process for determining remuneration 110-111 Ferrovial
102-37 Stakeholders’ involvement in remuneration 110-111 Ferrovial
102-38 Annual total compensation ratio See Appendix to GRI Indicators Ferrovial
102-39 Percentage increase in annual total compensation ratio See Appendix to GRI Indicators Ferrovial
Stakeholders Engagement
102-40 List of stakeholder groups 130-131 Ferrovial
102-41 Collective bargaining agreements 85. See Appendix y and table of contents of non-Financial Information Statements Ferrovial
102-42 Identifying and selecting stakeholders 2, 130-131 Ferrovial
102-43 Approach to stakeholder engagement 128 and 130-131 Ferrovial
102-44 Key topics and concerns raised 128-132 Ferrovial
Reporting practice
102-45 Entities included in the consolidated financial statements Appendix II of Ferrovial's Consolidated Financial Statements 2020 Ferrovial
102-46 Defining report content and topic Boundaries 2, 130-131 Ferrovial
102-47 List of material topics 131 Ferrovial
102-48 Restatements of information 130 Ferrovial
102-49 Changes in reporting 130 Ferrovial
102-50 Reporting period Fiscal year 2020 Ferrovial
102-51 Date of most recent report Fiscal year 2019 Ferrovial
102-52 Reporting cycle Annual Ferrovial
102-53 Contact point for questions regarding the report Back cover Ferrovial
102-54 Claims of reporting in accordance with the GRI Standards This report has been prepared in accordance with the Comprehensive option of the GRI Standards. Ferrovial
102-55 GRI content index 138 Ferrovial
102-56 External assurance 155 Ferrovial
GRI Standard Indicator and description Page / Reference Scope
GRI 103 Management approach 2016
103-1 Explanation of material issue and its limitations 131 Ferrovial
103-2 Management approach and components 12-15 Ferrovial
103-3 Evaluation of the management approach 12- 15 Ferrovial
THEMATIC CONTENTS
Economic Performance
GRI 201 Economic Performance 2016
201-1 Direct economic value generated and distributed See Appendix to GRI Indicators Ferrovial
201-2 Financial implications and other risks and opportunities due to climate change
86-88 Risks and opportunities are disclosed in the Carbon Disclosure Project report. which is publicly-available on the CDP website. Information for 2020 will be made available during 2020.
Ferrovial
201-3 Defined benefit plan obligations and other retirement plans
Note 6.6.4 of Ferrovial's Consolidated Financial Statements 2020 Note 6.2 of Ferrovial's Consolidated Financial Statements 2020
Ferrovial
201-4 Financial assistance received from government
Note 6.1 of Ferrovial's Consolidated Financial Statements 2020 Note 6.4 of Ferrovial's Consolidated Financial Statements 2020
Ferrovial
ANNUAL INTEGRATED REPORT 2020MANAGEMENT REPORT
143
APPENDIXGRI STANDARDS INDICATORS
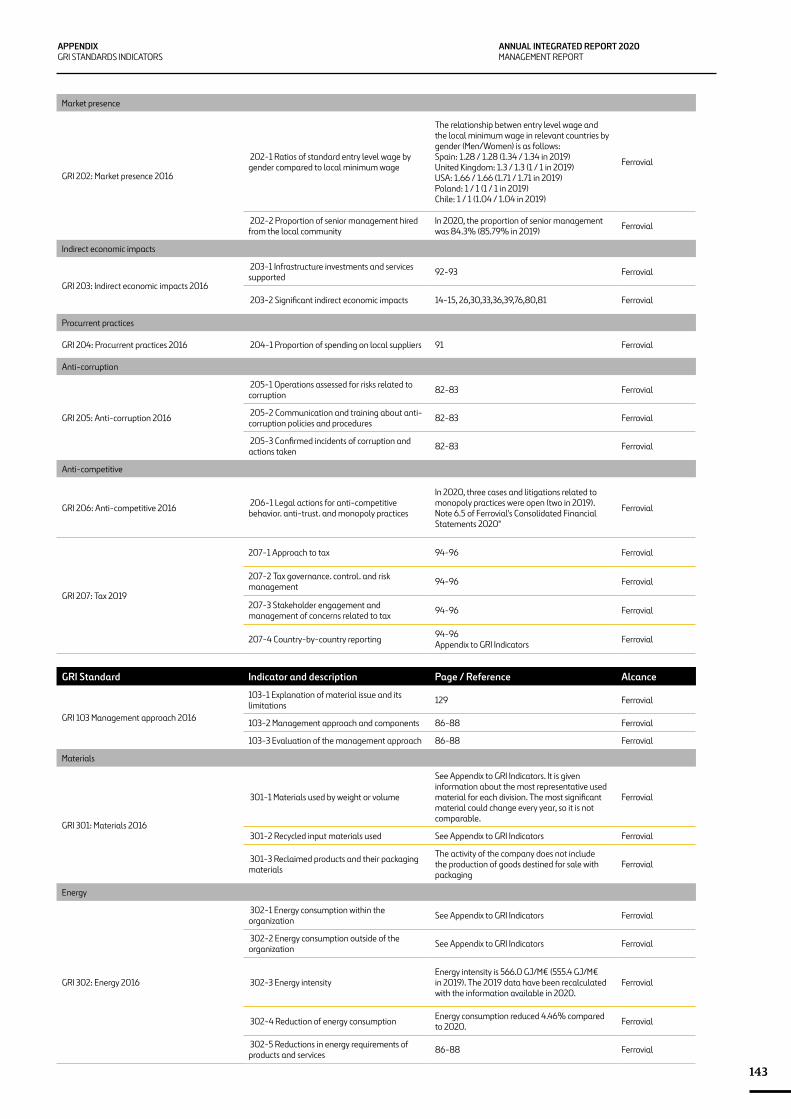
Market presence
GRI 202: Market presence 2016
202-1 Ratios of standard entry level wage by gender compared to local minimum wage
The relationship betwen entry level wage and the local minimum wage in relevant countries by gender (Men/Women) is as follows: Spain: 1.28 / 1.28 (1.34 / 1.34 in 2019) United Kingdom: 1.3 / 1.3 (1 / 1 in 2019) USA: 1.66 / 1.66 (1.71 / 1.71 in 2019) Poland: 1 / 1 (1 / 1 in 2019) Chile: 1 / 1 (1.04 / 1.04 in 2019)
Ferrovial
202-2 Proportion of senior management hired from the local community
In 2020, the proportion of senior management was 84.3% (85.79% in 2019) Ferrovial
Indirect economic impacts
GRI 203: Indirect economic impacts 2016
203-1 Infrastructure investments and services supported 92-93 Ferrovial
203-2 Significant indirect economic impacts 14-15, 26,30,33,36,39,76,80,81 Ferrovial
Procurrent practices
GRI 204: Procurrent practices 2016 204-1 Proportion of spending on local suppliers 91 Ferrovial
Anti-corruption
GRI 205: Anti-corruption 2016
205-1 Operations assessed for risks related to corruption 82-83 Ferrovial
205-2 Communication and training about anti-corruption policies and procedures 82-83 Ferrovial
205-3 Confirmed incidents of corruption and actions taken 82-83 Ferrovial
Anti-competitive
GRI 206: Anti-competitive 2016 206-1 Legal actions for anti-competitive behavior. anti-trust. and monopoly practices
In 2020, three cases and litigations related to monopoly practices were open (two in 2019). Note 6.5 of Ferrovial's Consolidated Financial Statements 2020"
Ferrovial
GRI 207: Tax 2019
207-1 Approach to tax 94-96 Ferrovial
207-2 Tax governance. control. and risk management 94-96 Ferrovial
207-3 Stakeholder engagement and management of concerns related to tax 94-96 Ferrovial
207-4 Country-by-country reporting 94-96 Appendix to GRI Indicators Ferrovial
GRI Standard Indicator and description Page / Reference Alcance
GRI 103 Management approach 2016
103-1 Explanation of material issue and its limitations 129 Ferrovial
103-2 Management approach and components 86-88 Ferrovial
103-3 Evaluation of the management approach 86-88 Ferrovial
Materials
GRI 301: Materials 2016
301-1 Materials used by weight or volume
See Appendix to GRI Indicators. It is given information about the most representative used material for each division. The most significant material could change every year, so it is not comparable.
Ferrovial
301-2 Recycled input materials used See Appendix to GRI Indicators Ferrovial
301-3 Reclaimed products and their packaging materials
The activity of the company does not include the production of goods destined for sale with packaging
Ferrovial
Energy
GRI 302: Energy 2016
302-1 Energy consumption within the organization See Appendix to GRI Indicators Ferrovial
302-2 Energy consumption outside of the organization See Appendix to GRI Indicators Ferrovial
302-3 Energy intensityEnergy intensity is 566.0 GJ/M€ (555.4 GJ/M€ in 2019). The 2019 data have been recalculated with the information available in 2020.
Ferrovial
302-4 Reduction of energy consumption Energy consumption reduced 4.46% compared to 2020. Ferrovial
302-5 Reductions in energy requirements of products and services 86-88 Ferrovial
MANAGEMENT REPORT 2020FERROVIAL S.A. AND SUBSIDIARIES
144
Water
GRI 303: Water 2016
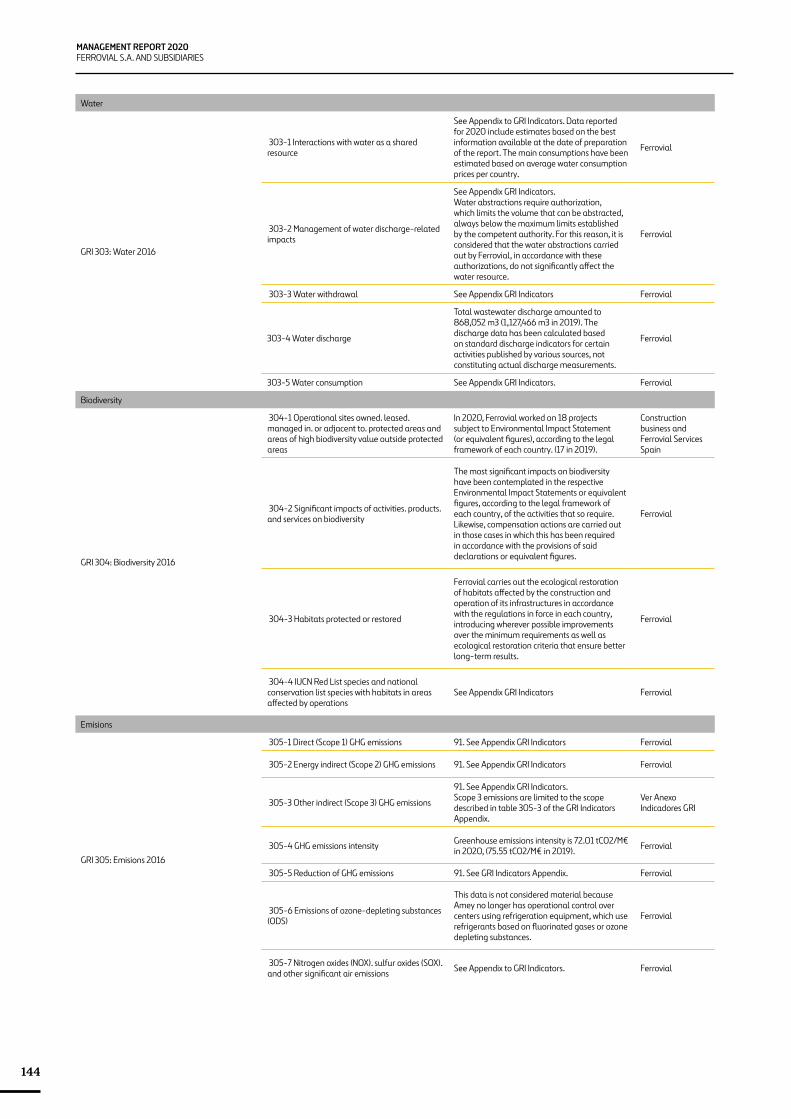
303-1 Interactions with water as a shared resource
See Appendix to GRI Indicators. Data reported for 2020 include estimates based on the best information available at the date of preparation of the report. The main consumptions have been estimated based on average water consumption prices per country.
Ferrovial
303-2 Management of water discharge-related impacts
See Appendix GRI Indicators.Water abstractions require authorization, which limits the volume that can be abstracted, always below the maximum limits established by the competent authority. For this reason, it is considered that the water abstractions carried out by Ferrovial, in accordance with these authorizations, do not significantly affect the water resource.
Ferrovial
303-3 Water withdrawal See Appendix GRI Indicators Ferrovial
303-4 Water discharge
Total wastewater discharge amounted to 868,052 m3 (1,127,466 m3 in 2019). The discharge data has been calculated based on standard discharge indicators for certain activities published by various sources, not constituting actual discharge measurements.
Ferrovial
303-5 Water consumption See Appendix GRI Indicators. Ferrovial
Biodiversity
GRI 304: Biodiversity 2016
304-1 Operational sites owned. leased. managed in. or adjacent to. protected areas and areas of high biodiversity value outside protected areas
In 2020, Ferrovial worked on 18 projects subject to Environmental Impact Statement (or equivalent figures), according to the legal framework of each country. (17 in 2019).
Construction business and Ferrovial Services Spain
304-2 Significant impacts of activities. products. and services on biodiversity
The most significant impacts on biodiversity have been contemplated in the respective Environmental Impact Statements or equivalent figures, according to the legal framework of each country, of the activities that so require. Likewise, compensation actions are carried out in those cases in which this has been required in accordance with the provisions of said declarations or equivalent figures.
Ferrovial
304-3 Habitats protected or restored
Ferrovial carries out the ecological restoration of habitats affected by the construction and operation of its infrastructures in accordance with the regulations in force in each country, introducing wherever possible improvements over the minimum requirements as well as ecological restoration criteria that ensure better long-term results.
Ferrovial
304-4 IUCN Red List species and national conservation list species with habitats in areas affected by operations
See Appendix GRI Indicators Ferrovial
Emisions
GRI 305: Emisions 2016
305-1 Direct (Scope 1) GHG emissions 91. See Appendix GRI Indicators Ferrovial
305-2 Energy indirect (Scope 2) GHG emissions 91. See Appendix GRI Indicators Ferrovial
305-3 Other indirect (Scope 3) GHG emissions
91. See Appendix GRI Indicators.Scope 3 emissions are limited to the scope described in table 305-3 of the GRI Indicators Appendix.
Ver Anexo Indicadores GRI
305-4 GHG emissions intensity Greenhouse emissions intensity is 72.01 tCO2/M€ in 2020, (75.55 tCO2/M€ in 2019). Ferrovial
305-5 Reduction of GHG emissions 91. See GRI Indicators Appendix. Ferrovial
305-6 Emissions of ozone-depleting substances (ODS)
This data is not considered material because Amey no longer has operational control over centers using refrigeration equipment, which use refrigerants based on fluorinated gases or ozone depleting substances.
Ferrovial
305-7 Nitrogen oxides (NOX). sulfur oxides (SOX). and other significant air emissions See Appendix to GRI Indicators. Ferrovial
ANNUAL INTEGRATED REPORT 2020MANAGEMENT REPORT
145
APPENDIXGRI STANDARDS INDICATORS
Effluents and Waste
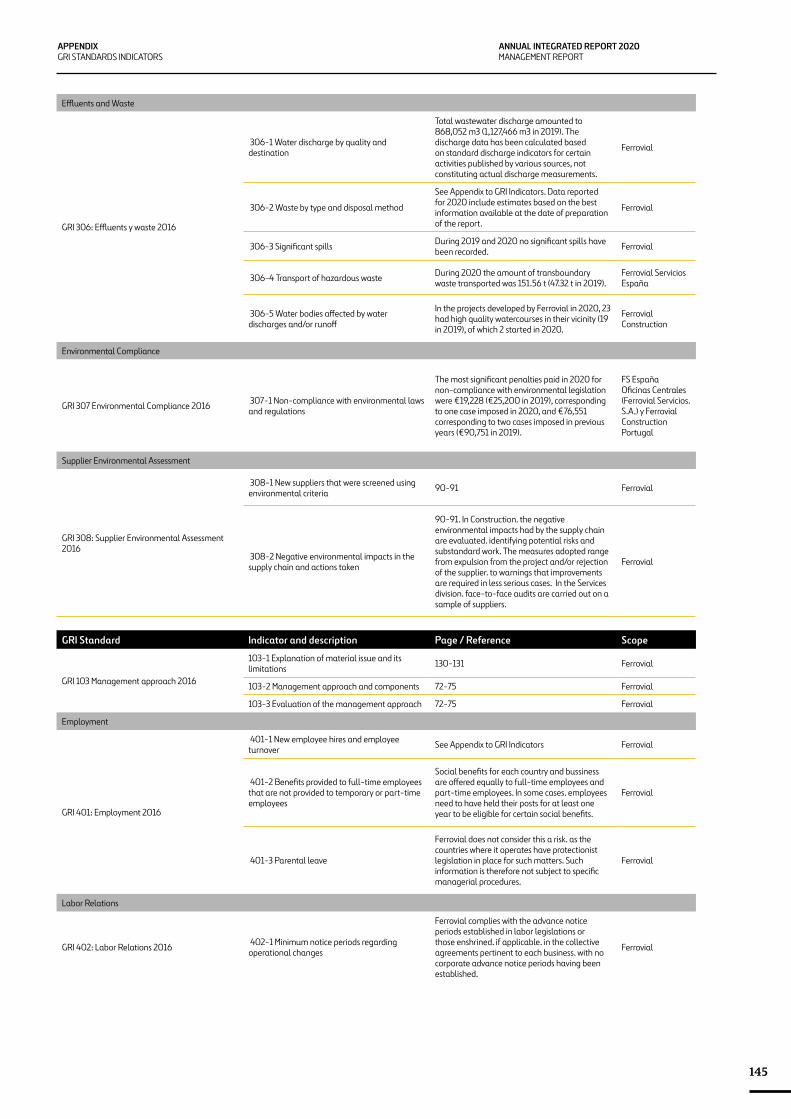
GRI 306: Effluents y waste 2016
306-1 Water discharge by quality and destination
Total wastewater discharge amounted to 868,052 m3 (1,127,466 m3 in 2019). The discharge data has been calculated based on standard discharge indicators for certain activities published by various sources, not constituting actual discharge measurements.
Ferrovial
306-2 Waste by type and disposal method
See Appendix to GRI Indicators. Data reported for 2020 include estimates based on the best information available at the date of preparation of the report.
Ferrovial
306-3 Significant spills During 2019 and 2020 no significant spills have been recorded. Ferrovial
306-4 Transport of hazardous waste During 2020 the amount of transboundary waste transported was 151.56 t (47.32 t in 2019).
Ferrovial Servicios España
306-5 Water bodies affected by water discharges and/or runoff
In the projects developed by Ferrovial in 2020, 23 had high quality watercourses in their vicinity (19 in 2019), of which 2 started in 2020.
Ferrovial Construction
Environmental Compliance
GRI 307 Environmental Compliance 2016 307-1 Non-compliance with environmental laws and regulations
The most significant penalties paid in 2020 for non-compliance with environmental legislation were €19,228 (€25,200 in 2019), corresponding to one case imposed in 2020, and €76,551 corresponding to two cases imposed in previous years (€90,751 in 2019).
FS España Oficinas Centrales (Ferrovial Servicios. S.A.) y Ferrovial Construction Portugal
Supplier Environmental Assessment
GRI 308: Supplier Environmental Assessment 2016
308-1 New suppliers that were screened using environmental criteria 90-91 Ferrovial
308-2 Negative environmental impacts in the supply chain and actions taken
90-91. In Construction. the negative environmental impacts had by the supply chain are evaluated. identifying potential risks and substandard work. The measures adopted range from expulsion from the project and/or rejection of the supplier. to warnings that improvements are required in less serious cases. In the Services division. face-to-face audits are carried out on a sample of suppliers.
Ferrovial
GRI Standard Indicator and description Page / Reference Scope
GRI 103 Management approach 2016
103-1 Explanation of material issue and its limitations 130-131 Ferrovial
103-2 Management approach and components 72-75 Ferrovial
103-3 Evaluation of the management approach 72-75 Ferrovial
Employment
GRI 401: Employment 2016
401-1 New employee hires and employee turnover See Appendix to GRI Indicators Ferrovial
401-2 Benefits provided to full-time employees that are not provided to temporary or part-time employees
Social benefits for each country and bussiness are offered equally to full-time employees and part-time employees. In some cases. employees need to have held their posts for at least one year to be eligible for certain social benefits.
Ferrovial
401-3 Parental leave
Ferrovial does not consider this a risk. as the countries where it operates have protectionist legislation in place for such matters. Such information is therefore not subject to specific managerial procedures.
Ferrovial
Labor Relations
GRI 402: Labor Relations 2016 402-1 Minimum notice periods regarding operational changes
Ferrovial complies with the advance notice periods established in labor legislations or those enshrined. if applicable. in the collective agreements pertinent to each business. with no corporate advance notice periods having been established.
Ferrovial
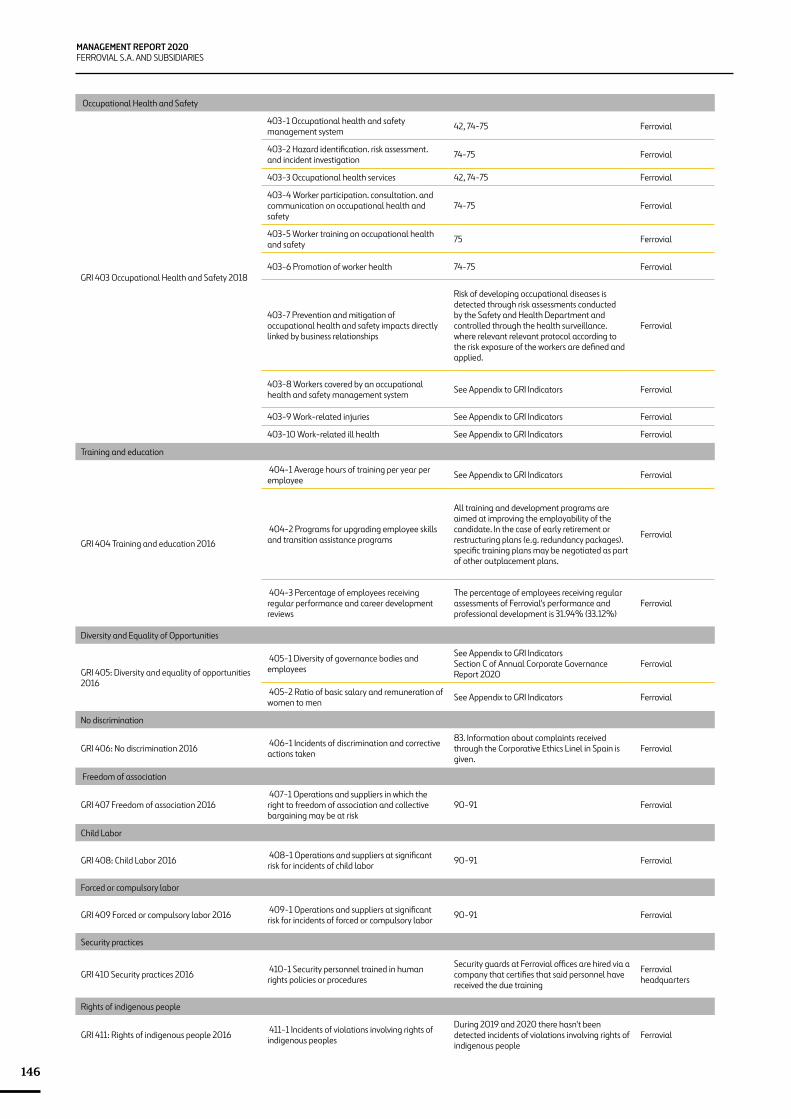
MANAGEMENT REPORT 2020FERROVIAL S.A. AND SUBSIDIARIES
146
Occupational Health and Safety
GRI 403 Occupational Health and Safety 2018
403-1 Occupational health and safety management system 42, 74-75 Ferrovial
403-2 Hazard identification. risk assessment. and incident investigation 74-75 Ferrovial
403-3 Occupational health services 42, 74-75 Ferrovial
403-4 Worker participation. consultation. and communication on occupational health and safety
74-75 Ferrovial
403-5 Worker training on occupational health and safety 75 Ferrovial
403-6 Promotion of worker health 74-75 Ferrovial
403-7 Prevention and mitigation of occupational health and safety impacts directly linked by business relationships
Risk of developing occupational diseases is detected through risk assessments conducted by the Safety and Health Department and controlled through the health surveillance. where relevant relevant protocol according to the risk exposure of the workers are defined and applied.
Ferrovial
403-8 Workers covered by an occupational health and safety management system See Appendix to GRI Indicators Ferrovial
403-9 Work-related injuries See Appendix to GRI Indicators Ferrovial
403-10 Work-related ill health See Appendix to GRI Indicators Ferrovial
Training and education
GRI 404 Training and education 2016
404-1 Average hours of training per year per employee See Appendix to GRI Indicators Ferrovial
404-2 Programs for upgrading employee skills and transition assistance programs
All training and development programs are aimed at improving the employability of the candidate. In the case of early retirement or restructuring plans (e.g. redundancy packages). specific training plans may be negotiated as part of other outplacement plans.
Ferrovial
404-3 Percentage of employees receiving regular performance and career development reviews
The percentage of employees receiving regular assessments of Ferrovial's performance and professional development is 31.94% (33.12%)
Ferrovial
Diversity and Equality of Opportunities
GRI 405: Diversity and equality of opportunities 2016
405-1 Diversity of governance bodies and employees
See Appendix to GRI Indicators Section C of Annual Corporate Governance Report 2020
Ferrovial
405-2 Ratio of basic salary and remuneration of women to men See Appendix to GRI Indicators Ferrovial
No discrimination
GRI 406: No discrimination 2016 406-1 Incidents of discrimination and corrective actions taken
83. Information about complaints received through the Corporative Ethics Linel in Spain is given.
Ferrovial
Freedom of association
GRI 407 Freedom of association 2016 407-1 Operations and suppliers in which the right to freedom of association and collective bargaining may be at risk
90-91 Ferrovial
Child Labor
GRI 408: Child Labor 2016 408-1 Operations and suppliers at significant risk for incidents of child labor 90-91 Ferrovial
Forced or compulsory labor
GRI 409 Forced or compulsory labor 2016 409-1 Operations and suppliers at significant risk for incidents of forced or compulsory labor 90-91 Ferrovial
Security practices
GRI 410 Security practices 2016 410-1 Security personnel trained in human rights policies or procedures
Security guards at Ferrovial offices are hired via a company that certifies that said personnel have received the due training
Ferrovial headquarters
Rights of indigenous people
GRI 411: Rights of indigenous people 2016 411-1 Incidents of violations involving rights of indigenous peoples
During 2019 and 2020 there hasn't been detected incidents of violations involving rights of indigenous people
Ferrovial
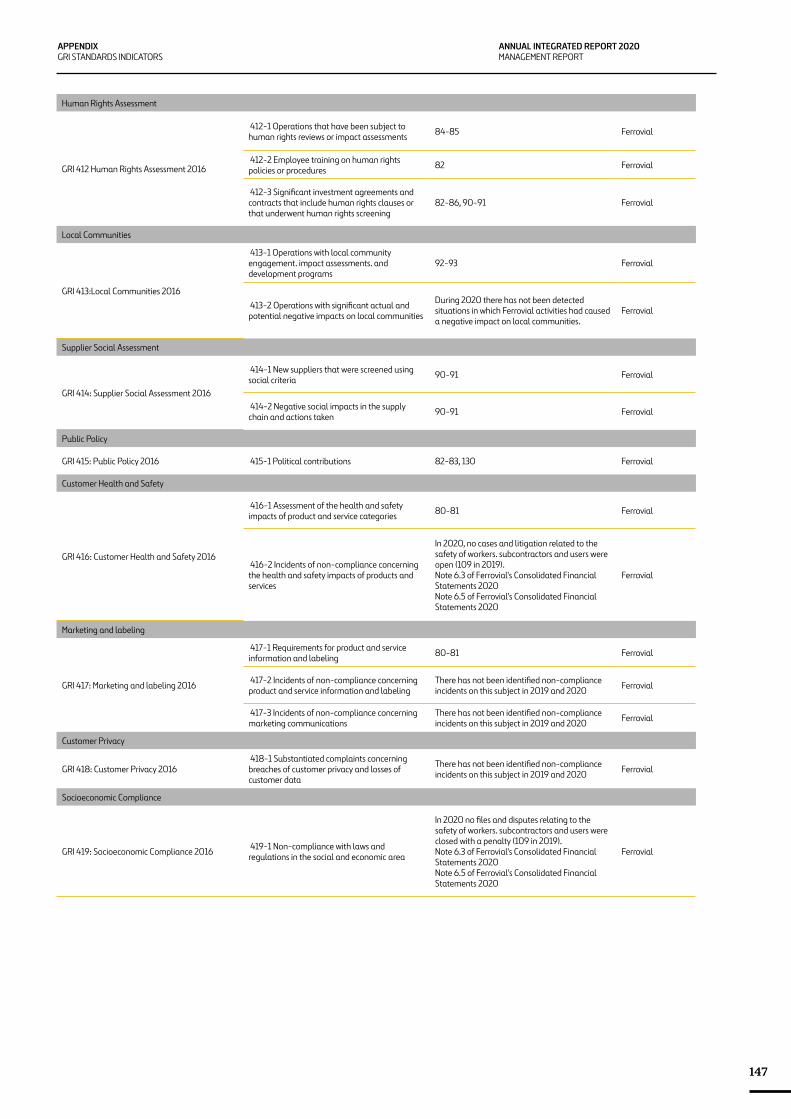
ANNUAL INTEGRATED REPORT 2020MANAGEMENT REPORT
147
APPENDIXGRI STANDARDS INDICATORS
Human Rights Assessment
GRI 412 Human Rights Assessment 2016
412-1 Operations that have been subject to human rights reviews or impact assessments 84-85 Ferrovial
412-2 Employee training on human rights policies or procedures 82 Ferrovial
412-3 Significant investment agreements and contracts that include human rights clauses or that underwent human rights screening
82-86, 90-91 Ferrovial
Local Communities
GRI 413:Local Communities 2016
413-1 Operations with local community engagement. impact assessments. and development programs
92-93 Ferrovial
413-2 Operations with significant actual and potential negative impacts on local communities
During 2020 there has not been detected situations in which Ferrovial activities had caused a negative impact on local communities.
Ferrovial
Supplier Social Assessment
GRI 414: Supplier Social Assessment 2016
414-1 New suppliers that were screened using social criteria 90-91 Ferrovial
414-2 Negative social impacts in the supply chain and actions taken 90-91 Ferrovial
Public Policy
GRI 415: Public Policy 2016 415-1 Political contributions 82-83, 130 Ferrovial
Customer Health and Safety
GRI 416: Customer Health and Safety 2016
416-1 Assessment of the health and safety impacts of product and service categories 80-81 Ferrovial
416-2 Incidents of non-compliance concerning the health and safety impacts of products and services
In 2020, no cases and litigation related to the safety of workers. subcontractors and users were open (109 in 2019). Note 6.3 of Ferrovial's Consolidated Financial Statements 2020 Note 6.5 of Ferrovial's Consolidated Financial Statements 2020
Ferrovial
Marketing and labeling
GRI 417: Marketing and labeling 2016
417-1 Requirements for product and service information and labeling 80-81 Ferrovial
417-2 Incidents of non-compliance concerning product and service information and labeling
There has not been identified non-compliance incidents on this subject in 2019 and 2020 Ferrovial
417-3 Incidents of non-compliance concerning marketing communications
There has not been identified non-compliance incidents on this subject in 2019 and 2020 Ferrovial
Customer Privacy
GRI 418: Customer Privacy 2016 418-1 Substantiated complaints concerning breaches of customer privacy and losses of customer data
There has not been identified non-compliance incidents on this subject in 2019 and 2020 Ferrovial
Socioeconomic Compliance
GRI 419: Socioeconomic Compliance 2016 419-1 Non-compliance with laws and regulations in the social and economic area
In 2020 no files and disputes relating to the safety of workers. subcontractors and users were closed with a penalty (109 in 2019). Note 6.3 of Ferrovial's Consolidated Financial Statements 2020 Note 6.5 of Ferrovial's Consolidated Financial Statements 2020
Ferrovial
MANAGEMENT REPORT 2020FERROVIAL S.A. AND SUBSIDIARIES
148
REPORTING PRINCIPLES
AA1000 APS2008 Standard
The standard is based on three fundamental principles:
• Inclusiveness: This principle analyzes whether the company has identified and understood the relevant aspects of its sustainable performance and presents sufficient information in terms of quality and quantity. For more information, please refer to the “Material Issues” section in this chapter.
• Materiality: The information must be the information required by the stakeholders. In other words, it ensures disclosure of all those material aspects whose omission or distortion could influence its stakeholders’ decisions or actions. For more information, please refer to the GRI Standards Indicators Table.
• Responsiveness: This report includes the information relating to Ferrovial’s response to stakeholder expectations.• Impact: the company monitors the impact of its activity on its surroundings, not only in economic terms but also from a social and
environmental point of view. It also evaluates the return on investment of its social action programs. For more information, see the sections In two minutes, environment and community
GRI STANDARDS GUIDELINES
The GRI Guidelines principles applied are:
Establishing report contents:
• Materiality: Aspects that reflect the significant social, environmental and economic impacts had by the organization or those that could have a substantial influence on stakeholder decisions.
• Stakeholder engagement: Identifying stakeholders and describing in the report how their expectations and interests have been addressed.• Sustainability context: Presenting the company’s performance within the broader context of sustainability.• Completeness: Coverage should enable stakeholders to assess the performance of the reporting organization
Establishing the quality of the report:
• Balance: The report must reflect both the positive and the negative aspects of the company’s performance.• Comparability: Stakeholders should be able to compare the information over time and with other companies.• Accuracy: The published information must be accurate and detailed.• Clarity: The information must be presented in a way that is clear and accessible to everyone.• Reliability: The information must be of high quality and it should establish the company’s materiality.
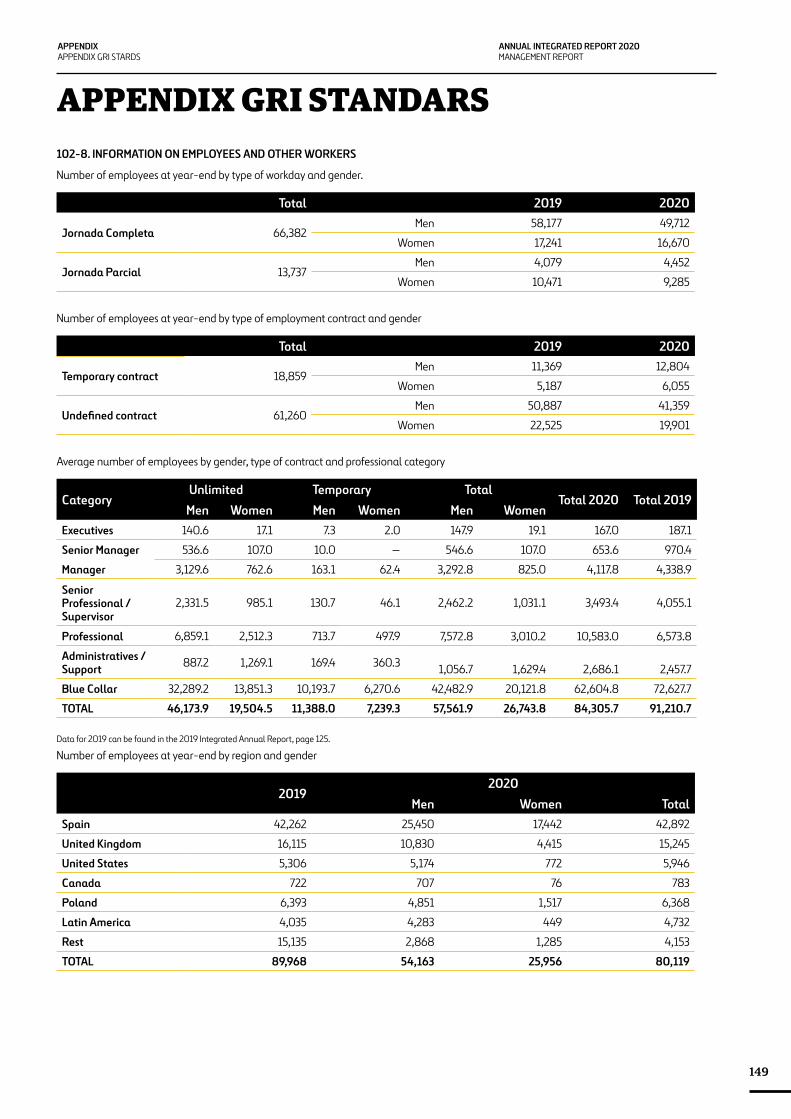
ANNUAL INTEGRATED REPORT 2020MANAGEMENT REPORT
149
APPENDIXAPPENDIX GRI STARDS
APPENDIX GRI STANDARS102-8. INFORMATION ON EMPLOYEES AND OTHER WORKERS
Number of employees at year-end by type of workday and gender.
Total 2019 2020
Jornada Completa 66,382Men 58,177 49,712
Women 17,241 16,670
Jornada Parcial 13,737Men 4,079 4,452
Women 10,471 9,285
Number of employees at year-end by type of employment contract and gender
Total 2019 2020
Temporary contract 18,859Men 11,369 12,804
Women 5,187 6,055
Undefined contract 61,260Men 50,887 41,359
Women 22,525 19,901
Average number of employees by gender, type of contract and professional category
CategoryUnlimited Temporary Total
Total 2020 Total 2019Men Women Men Women Men Women
Executives 140.6 17.1 7.3 2.0 147.9 19.1 167.0 187.1
Senior Manager 536.6 107.0 10.0 — 546.6 107.0 653.6 970.4
Manager 3,129.6 762.6 163.1 62.4 3,292.8 825.0 4,117.8 4,338.9
Senior Professional / Supervisor
2,331.5 985.1 130.7 46.1 2,462.2 1,031.1 3,493.4 4,055.1
Professional 6,859.1 2,512.3 713.7 497.9 7,572.8 3,010.2 10,583.0 6,573.8
Administratives / Support 887.2 1,269.1 169.4 360.3 1,056.7 1,629.4 2,686.1 2,457.7
Blue Collar 32,289.2 13,851.3 10,193.7 6,270.6 42,482.9 20,121.8 62,604.8 72,627.7
TOTAL 46,173.9 19,504.5 11,388.0 7,239.3 57,561.9 26,743.8 84,305.7 91,210.7
Data for 2019 can be found in the 2019 Integrated Annual Report, page 125. Number of employees at year-end by region and gender
20192020
Men Women TotalSpain 42,262 25,450 17,442 42,892
United Kingdom 16,115 10,830 4,415 15,245
United States 5,306 5,174 772 5,946
Canada 722 707 76 783
Poland 6,393 4,851 1,517 6,368
Latin America 4,035 4,283 449 4,732
Rest 15,135 2,868 1,285 4,153
TOTAL 89,968 54,163 25,956 80,119
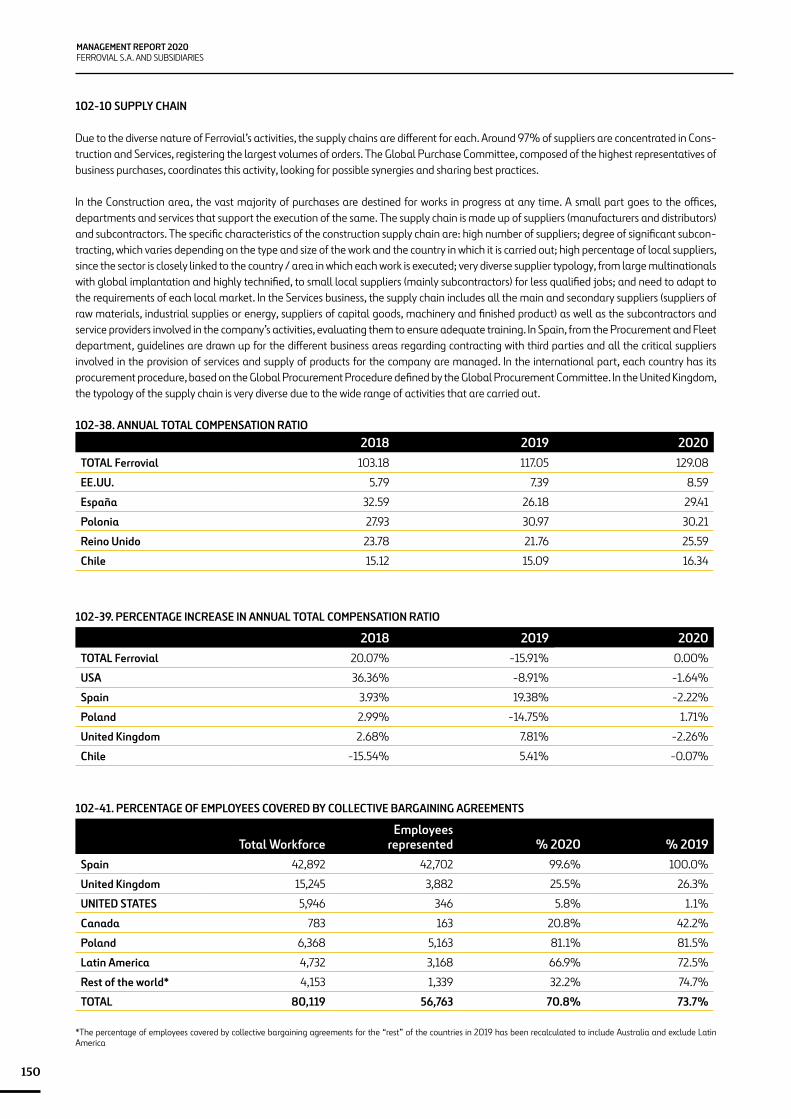
MANAGEMENT REPORT 2020FERROVIAL S.A. AND SUBSIDIARIES
150
102-10 SUPPLY CHAIN
Due to the diverse nature of Ferrovial’s activities, the supply chains are different for each. Around 97% of suppliers are concentrated in Cons-truction and Services, registering the largest volumes of orders. The Global Purchase Committee, composed of the highest representatives of business purchases, coordinates this activity, looking for possible synergies and sharing best practices.
In the Construction area, the vast majority of purchases are destined for works in progress at any time. A small part goes to the offices, departments and services that support the execution of the same. The supply chain is made up of suppliers (manufacturers and distributors) and subcontractors. The specific characteristics of the construction supply chain are: high number of suppliers; degree of significant subcon-tracting, which varies depending on the type and size of the work and the country in which it is carried out; high percentage of local suppliers, since the sector is closely linked to the country / area in which each work is executed; very diverse supplier typology, from large multinationals with global implantation and highly technified, to small local suppliers (mainly subcontractors) for less qualified jobs; and need to adapt to the requirements of each local market. In the Services business, the supply chain includes all the main and secondary suppliers (suppliers of raw materials, industrial supplies or energy, suppliers of capital goods, machinery and finished product) as well as the subcontractors and service providers involved in the company’s activities, evaluating them to ensure adequate training. In Spain, from the Procurement and Fleet department, guidelines are drawn up for the different business areas regarding contracting with third parties and all the critical suppliers involved in the provision of services and supply of products for the company are managed. In the international part, each country has its procurement procedure, based on the Global Procurement Procedure defined by the Global Procurement Committee. In the United Kingdom, the typology of the supply chain is very diverse due to the wide range of activities that are carried out.
102-38. ANNUAL TOTAL COMPENSATION RATIO 2018 2019 2020
TOTAL Ferrovial 103.18 117.05 129.08
EE.UU. 5.79 7.39 8.59
España 32.59 26.18 29.41
Polonia 27.93 30.97 30.21
Reino Unido 23.78 21.76 25.59
Chile 15.12 15.09 16.34
102-39. PERCENTAGE INCREASE IN ANNUAL TOTAL COMPENSATION RATIO
2018 2019 2020TOTAL Ferrovial 20.07% -15.91% 0.00%
USA 36.36% -8.91% -1.64%
Spain 3.93% 19.38% -2.22%
Poland 2.99% -14.75% 1.71%
United Kingdom 2.68% 7.81% -2.26%
Chile -15.54% 5.41% -0.07%
102-41. PERCENTAGE OF EMPLOYEES COVERED BY COLLECTIVE BARGAINING AGREEMENTS
Total WorkforceEmployees
represented % 2020 % 2019Spain 42,892 42,702 99.6% 100.0%
United Kingdom 15,245 3,882 25.5% 26.3%
UNITED STATES 5,946 346 5.8% 1.1%
Canada 783 163 20.8% 42.2%
Poland 6,368 5,163 81.1% 81.5%
Latin America 4,732 3,168 66.9% 72.5%
Rest of the world* 4,153 1,339 32.2% 74.7%
TOTAL 80,119 56,763 70.8% 73.7%
*The percentage of employees covered by collective bargaining agreements for the “rest” of the countries in 2019 has been recalculated to include Australia and exclude Latin America
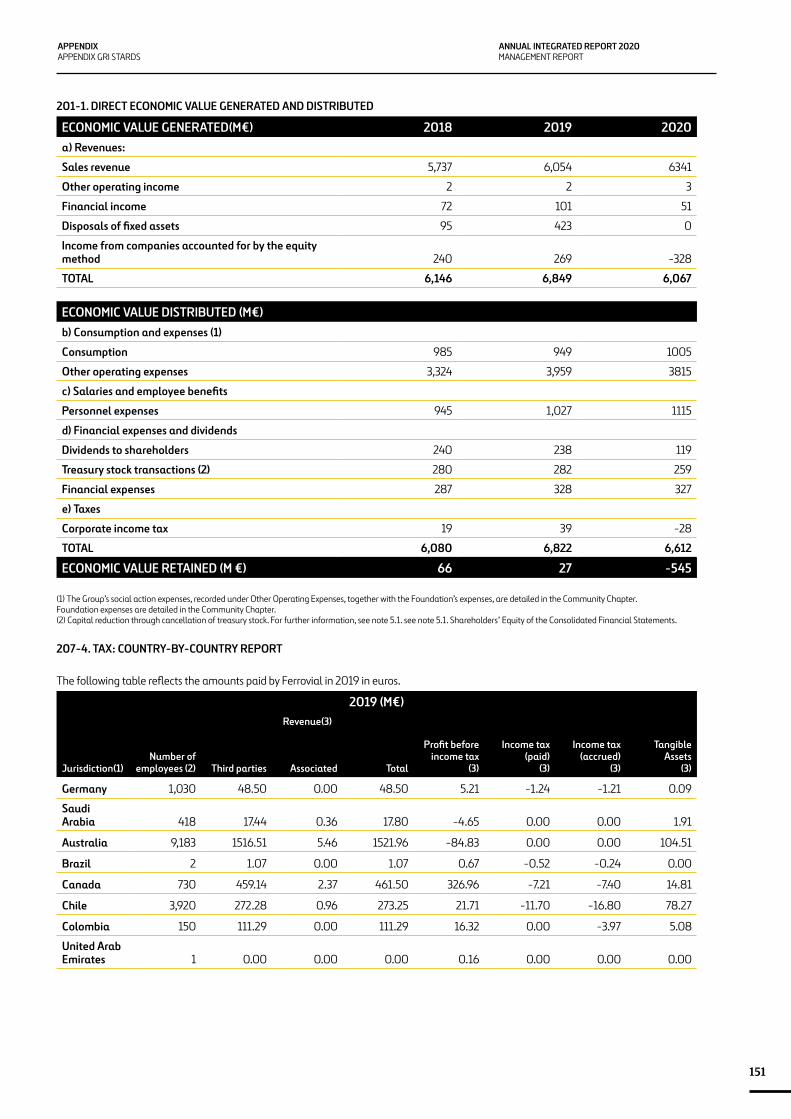
ANNUAL INTEGRATED REPORT 2020MANAGEMENT REPORT
151
APPENDIXAPPENDIX GRI STARDS
201-1. DIRECT ECONOMIC VALUE GENERATED AND DISTRIBUTED
ECONOMIC VALUE GENERATED(M€) 2018 2019 2020a) Revenues:
Sales revenue 5,737 6,054 6341
Other operating income 2 2 3
Financial income 72 101 51
Disposals of fixed assets 95 423 0
Income from companies accounted for by the equity method 240 269 -328
TOTAL 6,146 6,849 6,067
ECONOMIC VALUE DISTRIBUTED (M€) 2018 2019 2020
b) Consumption and expenses (1)
Consumption 985 949 1005
Other operating expenses 3,324 3,959 3815
c) Salaries and employee benefits
Personnel expenses 945 1,027 1115
d) Financial expenses and dividends
Dividends to shareholders 240 238 119
Treasury stock transactions (2) 280 282 259
Financial expenses 287 328 327
e) Taxes
Corporate income tax 19 39 -28
TOTAL 6,080 6,822 6,612
ECONOMIC VALUE RETAINED (M €) 66 27 -545
(1) The Group’s social action expenses, recorded under Other Operating Expenses, together with the Foundation’s expenses, are detailed in the Community Chapter.Foundation expenses are detailed in the Community Chapter.(2) Capital reduction through cancellation of treasury stock. For further information, see note 5.1. see note 5.1. Shareholders’ Equity of the Consolidated Financial Statements.
207-4. TAX: COUNTRY-BY-COUNTRY REPORT
The following table reflects the amounts paid by Ferrovial in 2019 in euros.
2019 (M€)
Jurisdiction(1)Number of
employees (2)
Revenue(3)
Profit before income tax
(3)
Income tax (paid)
(3)
Income tax (accrued)
(3)
Tangible Assets
(3)Third parties Associated Total
Germany 1,030 48.50 0.00 48.50 5.21 -1.24 -1.21 0.09
Saudi Arabia 418 17.44 0.36 17.80 -4.65 0.00 0.00 1.91
Australia 9,183 1516.51 5.46 1521.96 -84.83 0.00 0.00 104.51
Brazil 2 1.07 0.00 1.07 0.67 -0.52 -0.24 0.00
Canada 730 459.14 2.37 461.50 326.96 -7.21 -7.40 14.81
Chile 3,920 272.28 0.96 273.25 21.71 -11.70 -16.80 78.27
Colombia 150 111.29 0.00 111.29 16.32 0.00 -3.97 5.08
United Arab Emirates 1 0.00 0.00 0.00 0.16 0.00 0.00 0.00

MANAGEMENT REPORT 2020FERROVIAL S.A. AND SUBSIDIARIES
152
Slovakia 240 286.07 0.04 286.11 0.59 0.00 -0.69 10.22
Spain 36,732 3,520.11 248.91 3,769.02 647.29 -15.62 -19.80 1431.42
United States of America
5,465 2,328.22 9.52 2,337.74 -357.80 3.42 -10.15 6,008.13
France 46 67.60 0.00 67.60 10.06 -0.10 -3.09 0.53
Greece 0 0.00 0.00 0.00 0.00 0.00 0.00 0.01
India 0 0.01 0.00 0.01 -0.17 0.00 0.00 0.00
Ireland 4 0.09 20.28 20.36 18.18 -2.19 -1.54 0.00
Mauritius Islands 0 0.00 0.00 0.00 0.00 0.00 0.00 0.00
Italy 2 0.31 0.00 0.31 -0.08 0.00 0.00 0.00
Luxembourg 0 3.09 0.02 3.11 2.49 0.00 0.06 0.00
Lithuania 45 35.41 0.00 35.41 -17.95 0.00 0.00 2.43
Malaysia 0 0.00 0.00 0.00 0.00 0.00 0.00 0.00
Morocco 1 0.00 0.00 0.00 2.25 0.00 0.00 0.00
Mexico 0 0.00 0.00 0.00 0.00 0.00 0.00 0.00
New Zealand 1,436 257.67 0.00 257.67 -0.77 0.00 0.34 9.34
Oman 27 1.59 0.12 1.71 3.19 0.00 0.00 0.00
Netherlands 16 158.58 30.02 188.61 -265.12 -1.40 0.00 0.00
Peru 8 0.01 0.00 0.01 -2.80 -0.04 0.00 0.14
Poland 6,292 1,738.96 0.55 1,739.52 85.87 -13.60 -39.01 582.40
Portugal 1,810 145.31 1.37 146.69 -27.34 -0.47 -1.95 312.07
Puerto Rico 197 43.51 0.52 44.03 1.45 0.15 -0.32 2.75
Dominican Republic 0 0.00 0.00 0.00 0.00 0.00 0.00 0.00
Qatar 0 0.00 0.00 0.00 0.14 -0.04 0.03 0.00
United Kingdom 14,937 3,181.09 19.54 3,200.62 -934.25 1.67 -3.19 136.96
Singapore 0 0.00 0.00 0.00 0.00 0.00 0.00 0.00
Tunisia 1 0.00 0.00 0.00 -0.02 0.00 0.00 0.00
Total 82,693 14,193.86 340.04 14,533.90 -553.24 -48.88 -108.92 8,701.07
(1)In the Consolidated Financial Statements for the fiscal year 2019, Appendix II, the entities comprising the business group, their residence, as well as the activities they carry out are detailed.(2)Regarding the number of employees, an estimate of the total number of employees has been made on a full-time equivalent basis. The information is homogeneous across juris-dictions and does not change from year to year.(3) The average exchange rate for the year is used for revenues, income and taxes in foreign currencies and the year-end exchange rate for tangible assets.
Income Tax: legal vs. effective rate by jurisdiction.
The following table reflects the qualitative explanation of the differences between the legal and effective income tax rates with respect to the jurisdictions in which Ferrovial paid income tax in 2019. Unlike the previous table, the following table only reflects the amounts paid in income tax by fully consolidated companies.
2019
Jurisdiction
Income tax
Legal tax rate
Effective tax rate Difference Explanation
Germany 25% 23% 2% Effective and nominal rates are aligned.
Saudi Arabia 20% 0% 20% Country in which losses have been generated so no tax is payable.
Australia 30% 0% 30% Country in which losses have been generated so no tax is payable.
Brazil 34% 35% -1% Effective and nominal rate are aligned.
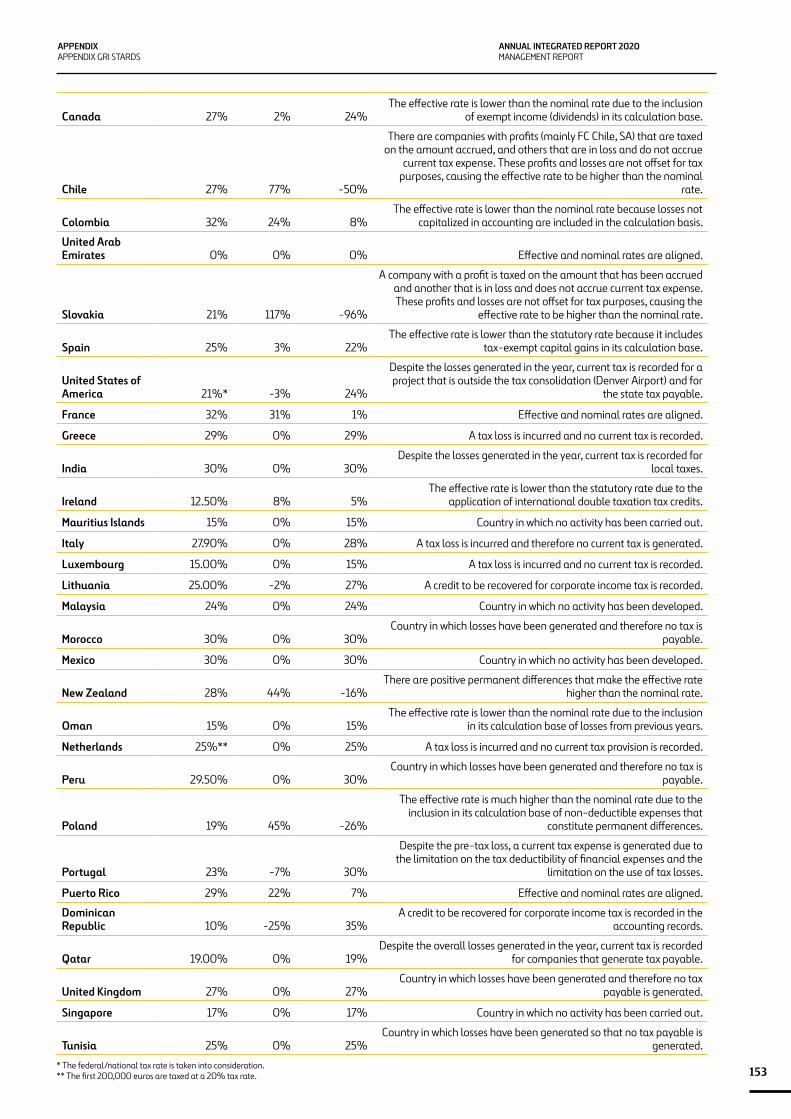
ANNUAL INTEGRATED REPORT 2020MANAGEMENT REPORT
153
APPENDIXAPPENDIX GRI STARDS
Canada 27% 2% 24%The effective rate is lower than the nominal rate due to the inclusion
of exempt income (dividends) in its calculation base.
Chile 27% 77% -50%
There are companies with profits (mainly FC Chile, SA) that are taxed on the amount accrued, and others that are in loss and do not accrue
current tax expense. These profits and losses are not offset for tax purposes, causing the effective rate to be higher than the nominal
rate.
Colombia 32% 24% 8%The effective rate is lower than the nominal rate because losses not
capitalized in accounting are included in the calculation basis.
United Arab Emirates 0% 0% 0% Effective and nominal rates are aligned.
Slovakia 21% 117% -96%
A company with a profit is taxed on the amount that has been accrued and another that is in loss and does not accrue current tax expense. These profits and losses are not offset for tax purposes, causing the
effective rate to be higher than the nominal rate.
Spain 25% 3% 22%The effective rate is lower than the statutory rate because it includes
tax-exempt capital gains in its calculation base.
United States of America 21%* -3% 24%
Despite the losses generated in the year, current tax is recorded for a project that is outside the tax consolidation (Denver Airport) and for
the state tax payable.
France 32% 31% 1% Effective and nominal rates are aligned.
Greece 29% 0% 29% A tax loss is incurred and no current tax is recorded.
India 30% 0% 30%Despite the losses generated in the year, current tax is recorded for
local taxes.
Ireland 12.50% 8% 5%The effective rate is lower than the statutory rate due to the
application of international double taxation tax credits.
Mauritius Islands 15% 0% 15% Country in which no activity has been carried out.
Italy 27.90% 0% 28% A tax loss is incurred and therefore no current tax is generated.
Luxembourg 15.00% 0% 15% A tax loss is incurred and no current tax is recorded.
Lithuania 25.00% -2% 27% A credit to be recovered for corporate income tax is recorded.
Malaysia 24% 0% 24% Country in which no activity has been developed.
Morocco 30% 0% 30%Country in which losses have been generated and therefore no tax is
payable.
Mexico 30% 0% 30% Country in which no activity has been developed.
New Zealand 28% 44% -16%There are positive permanent differences that make the effective rate
higher than the nominal rate.
Oman 15% 0% 15%The effective rate is lower than the nominal rate due to the inclusion
in its calculation base of losses from previous years.
Netherlands 25%** 0% 25% A tax loss is incurred and no current tax provision is recorded.
Peru 29.50% 0% 30%Country in which losses have been generated and therefore no tax is
payable.
Poland 19% 45% -26%
The effective rate is much higher than the nominal rate due to the inclusion in its calculation base of non-deductible expenses that
constitute permanent differences.
Portugal 23% -7% 30%
Despite the pre-tax loss, a current tax expense is generated due to the limitation on the tax deductibility of financial expenses and the
limitation on the use of tax losses.
Puerto Rico 29% 22% 7% Effective and nominal rates are aligned.
Dominican Republic 10% -25% 35%
A credit to be recovered for corporate income tax is recorded in the accounting records.
Qatar 19.00% 0% 19%Despite the overall losses generated in the year, current tax is recorded
for companies that generate tax payable.
United Kingdom 27% 0% 27%Country in which losses have been generated and therefore no tax
payable is generated.
Singapore 17% 0% 17% Country in which no activity has been carried out.
Tunisia 25% 0% 25%Country in which losses have been generated so that no tax payable is
generated.
* The federal/national tax rate is taken into consideration.** The first 200,000 euros are taxed at a 20% tax rate.
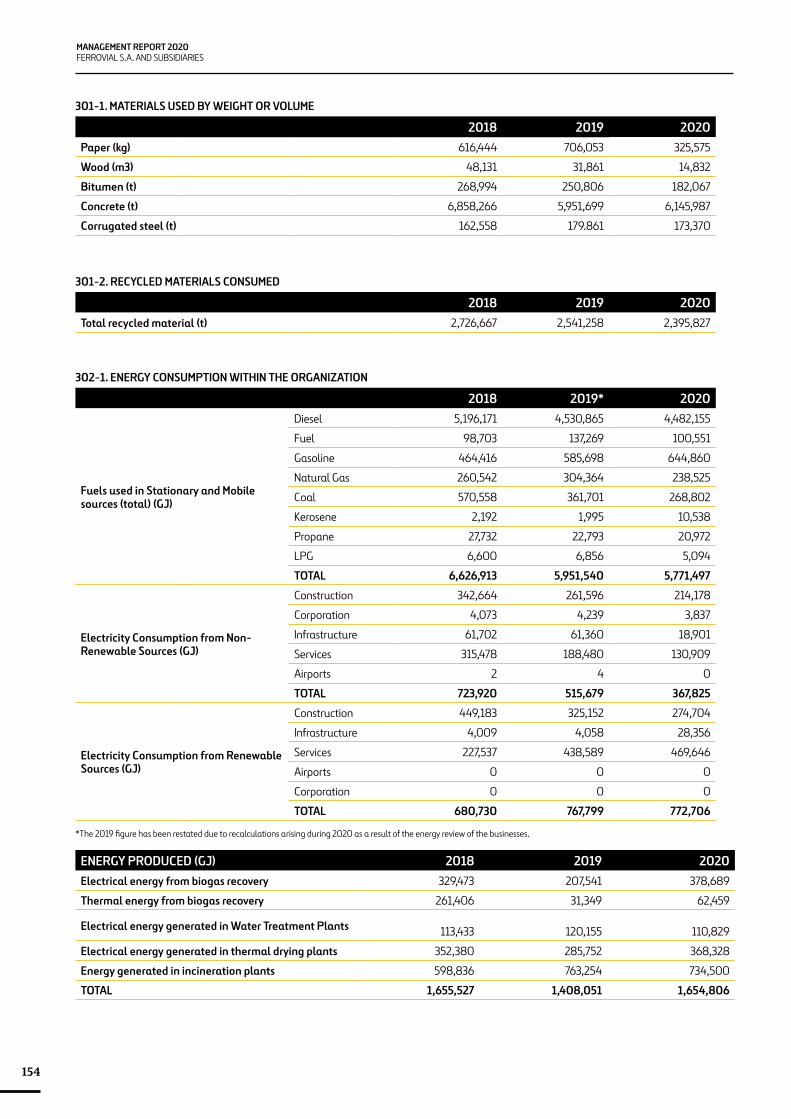
MANAGEMENT REPORT 2020FERROVIAL S.A. AND SUBSIDIARIES
154
301-1. MATERIALS USED BY WEIGHT OR VOLUME
2018 2019 2020Paper (kg) 616,444 706,053 325,575
Wood (m3) 48,131 31,861 14,832
Bitumen (t) 268,994 250,806 182,067
Concrete (t) 6,858,266 5,951,699 6,145,987
Corrugated steel (t) 162,558 179.861 173,370
301-2. RECYCLED MATERIALS CONSUMED
2018 2019 2020Total recycled material (t) 2,726,667 2,541,258 2,395,827
302-1. ENERGY CONSUMPTION WITHIN THE ORGANIZATION
2018 2019* 2020
Fuels used in Stationary and Mobile sources (total) (GJ)
Diesel 5,196,171 4,530,865 4,482,155
Fuel 98,703 137,269 100,551
Gasoline 464,416 585,698 644,860
Natural Gas 260,542 304,364 238,525
Coal 570,558 361,701 268,802
Kerosene 2,192 1,995 10,538
Propane 27,732 22,793 20,972
LPG 6,600 6,856 5,094
TOTAL 6,626,913 5,951,540 5,771,497
Electricity Consumption from Non-Renewable Sources (GJ)
Construction 342,664 261,596 214,178
Corporation 4,073 4,239 3,837
Infrastructure 61,702 61,360 18,901
Services 315,478 188,480 130,909
Airports 2 4 0
TOTAL 723,920 515,679 367,825
Electricity Consumption from Renewable Sources (GJ)
Construction 449,183 325,152 274,704
Infrastructure 4,009 4,058 28,356
Services 227,537 438,589 469,646
Airports 0 0 0
Corporation 0 0 0
TOTAL 680,730 767,799 772,706
*The 2019 figure has been restated due to recalculations arising during 2020 as a result of the energy review of the businesses.
ENERGY PRODUCED (GJ) 2018 2019 2020Electrical energy from biogas recovery 329,473 207,541 378,689
Thermal energy from biogas recovery 261,406 31,349 62,459
Electrical energy generated in Water Treatment Plants 113,433 120,155 110,829
Electrical energy generated in thermal drying plants 352,380 285,752 368,328
Energy generated in incineration plants 598,836 763,254 734,500
TOTAL 1,655,527 1,408,051 1,654,806
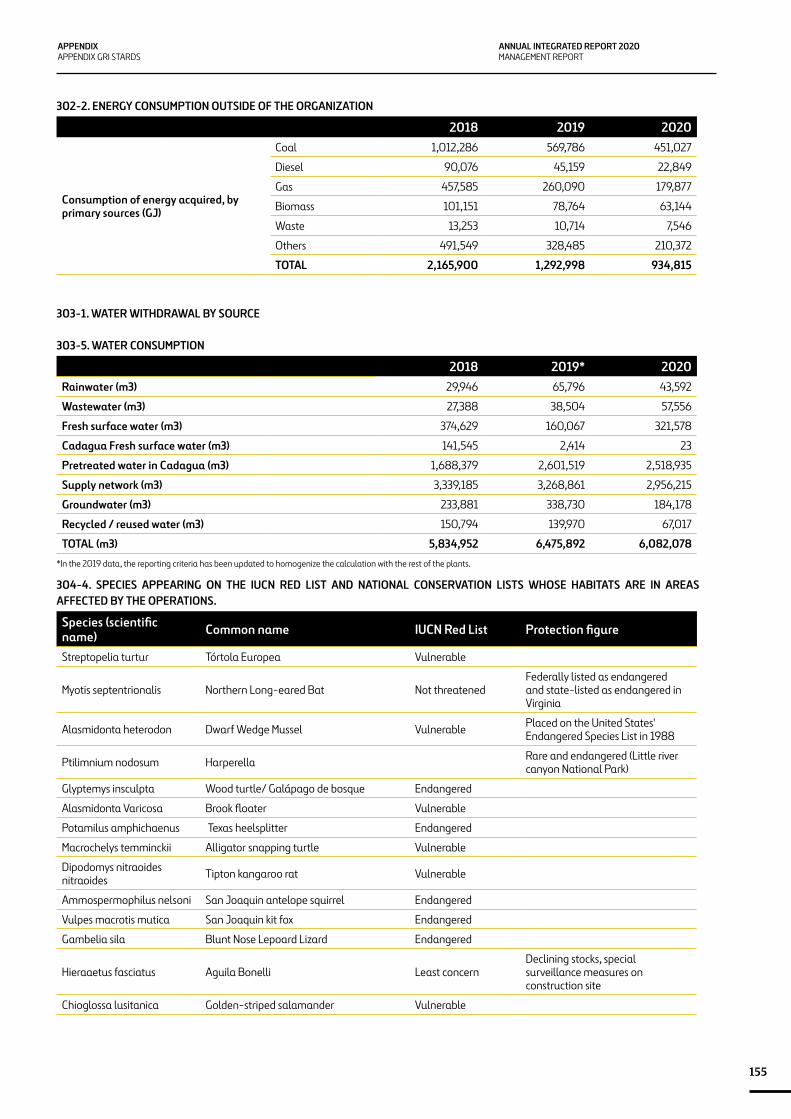
ANNUAL INTEGRATED REPORT 2020MANAGEMENT REPORT
155
APPENDIXAPPENDIX GRI STARDS
302-2. ENERGY CONSUMPTION OUTSIDE OF THE ORGANIZATION
2018 2019 2020
Consumption of energy acquired, by primary sources (GJ)
Coal 1,012,286 569,786 451,027
Diesel 90,076 45,159 22,849
Gas 457,585 260,090 179,877
Biomass 101,151 78,764 63,144
Waste 13,253 10,714 7,546
Others 491,549 328,485 210,372
TOTAL 2,165,900 1,292,998 934,815
303-1. WATER WITHDRAWAL BY SOURCE
303-5. WATER CONSUMPTION
2018 2019* 2020Rainwater (m3) 29,946 65,796 43,592
Wastewater (m3) 27,388 38,504 57,556
Fresh surface water (m3) 374,629 160,067 321,578
Cadagua Fresh surface water (m3) 141,545 2,414 23
Pretreated water in Cadagua (m3) 1,688,379 2,601,519 2,518,935
Supply network (m3) 3,339,185 3,268,861 2,956,215
Groundwater (m3) 233,881 338,730 184,178
Recycled / reused water (m3) 150,794 139,970 67,017
TOTAL (m3) 5,834,952 6,475,892 6,082,078
*In the 2019 data, the reporting criteria has been updated to homogenize the calculation with the rest of the plants.
304-4. SPECIES APPEARING ON THE IUCN RED LIST AND NATIONAL CONSERVATION LISTS WHOSE HABITATS ARE IN AREAS AFFECTED BY THE OPERATIONS.
Species (scientific name) Common name IUCN Red List Protection figure
Streptopelia turtur Tórtola Europea Vulnerable
Myotis septentrionalis Northern Long-eared Bat Not threatenedFederally listed as endangered and state-listed as endangered in Virginia
Alasmidonta heterodon Dwarf Wedge Mussel Vulnerable Placed on the United States' Endangered Species List in 1988
Ptilimnium nodosum Harperella Rare and endangered (Little river canyon National Park)
Glyptemys insculpta Wood turtle/ Galápago de bosque Endangered
Alasmidonta Varicosa Brook floater Vulnerable
Potamilus amphichaenus Texas heelsplitter Endangered
Macrochelys temminckii Alligator snapping turtle Vulnerable
Dipodomys nitraoides nitraoides Tipton kangaroo rat Vulnerable
Ammospermophilus nelsoni San Joaquin antelope squirrel Endangered
Vulpes macrotis mutica San Joaquin kit fox Endangered
Gambelia sila Blunt Nose Lepoard Lizard Endangered
Hieraaetus fasciatus Aguila Bonelli Least concernDeclining stocks, special surveillance measures on construction site
Chioglossa lusitanica Golden-striped salamander Vulnerable
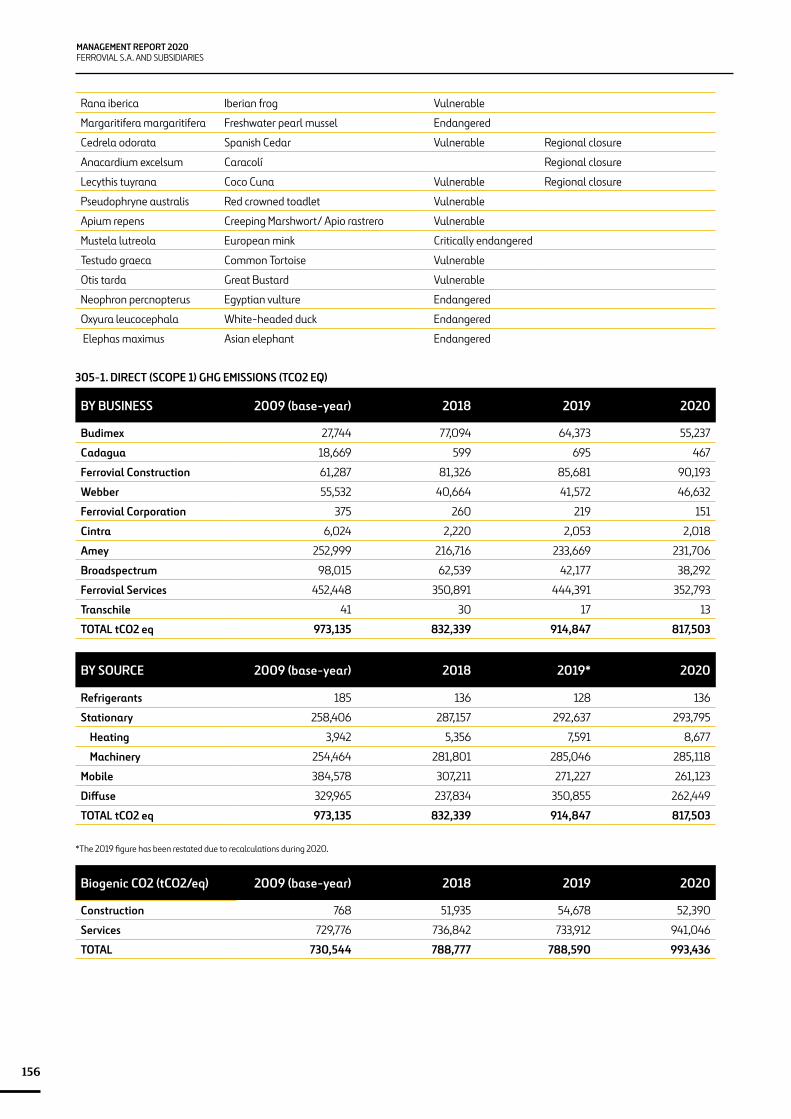
MANAGEMENT REPORT 2020FERROVIAL S.A. AND SUBSIDIARIES
156
Rana iberica Iberian frog Vulnerable
Margaritifera margaritifera Freshwater pearl mussel Endangered
Cedrela odorata Spanish Cedar Vulnerable Regional closure
Anacardium excelsum Caracolí Regional closure
Lecythis tuyrana Coco Cuna Vulnerable Regional closure
Pseudophryne australis Red crowned toadlet Vulnerable
Apium repens Creeping Marshwort/ Apio rastrero Vulnerable
Mustela lutreola European mink Critically endangered
Testudo graeca Common Tortoise Vulnerable
Otis tarda Great Bustard Vulnerable
Neophron percnopterus Egyptian vulture Endangered
Oxyura leucocephala White-headed duck Endangered
Elephas maximus Asian elephant Endangered
305-1. DIRECT (SCOPE 1) GHG EMISSIONS (TCO2 EQ)
BY BUSINESS 2009 (base-year) 2018 2019 2020
Budimex 27,744 77,094 64,373 55,237
Cadagua 18,669 599 695 467
Ferrovial Construction 61,287 81,326 85,681 90,193
Webber 55,532 40,664 41,572 46,632
Ferrovial Corporation 375 260 219 151
Cintra 6,024 2,220 2,053 2,018
Amey 252,999 216,716 233,669 231,706
Broadspectrum 98,015 62,539 42,177 38,292
Ferrovial Services 452,448 350,891 444,391 352,793
Transchile 41 30 17 13
TOTAL tCO2 eq 973,135 832,339 914,847 817,503
BY SOURCE 2009 (base-year) 2018 2019* 2020
Refrigerants 185 136 128 136
Stationary 258,406 287,157 292,637 293,795
Heating 3,942 5,356 7,591 8,677
Machinery 254,464 281,801 285,046 285,118
Mobile 384,578 307,211 271,227 261,123
Diffuse 329,965 237,834 350,855 262,449
TOTAL tCO2 eq 973,135 832,339 914,847 817,503
*The 2019 figure has been restated due to recalculations during 2020.
Biogenic CO2 (tCO2/eq) 2009 (base-year) 2018 2019 2020
Construction 768 51,935 54,678 52,390
Services 729,776 736,842 733,912 941,046
TOTAL 730,544 788,777 788,590 993,436
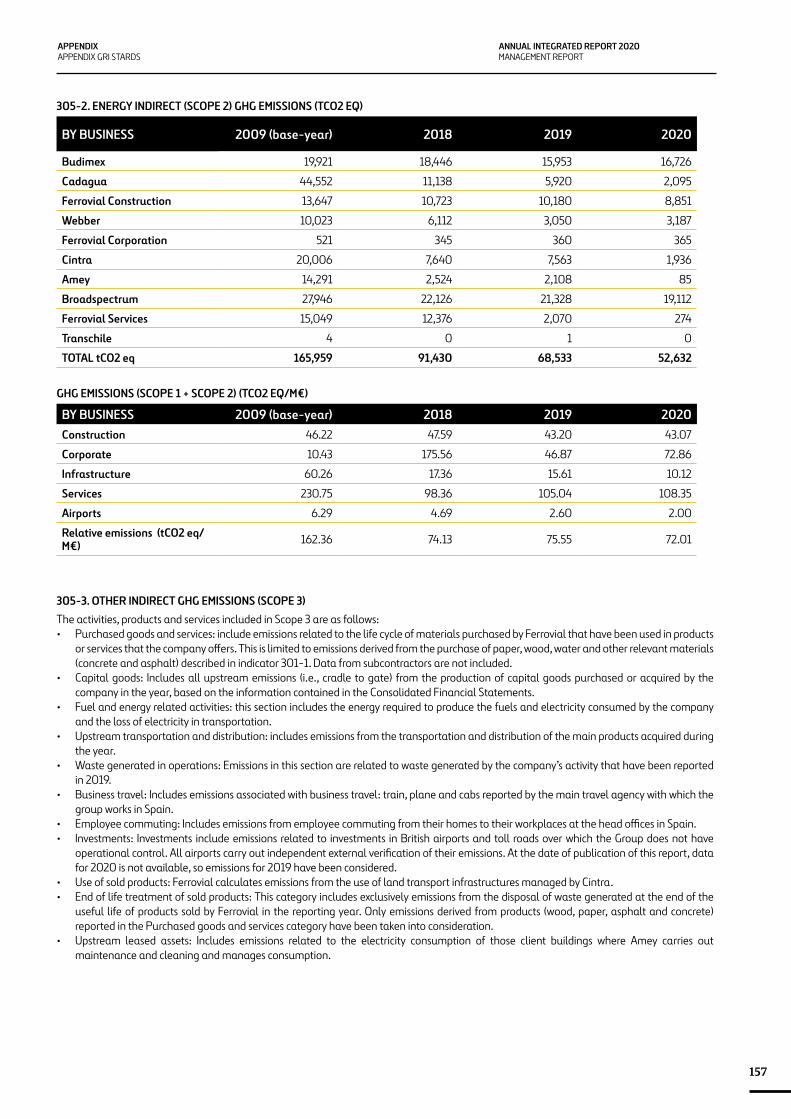
ANNUAL INTEGRATED REPORT 2020MANAGEMENT REPORT
157
APPENDIXAPPENDIX GRI STARDS
305-2. ENERGY INDIRECT (SCOPE 2) GHG EMISSIONS (TCO2 EQ)
BY BUSINESS 2009 (base-year) 2018 2019 2020
Budimex 19,921 18,446 15,953 16,726
Cadagua 44,552 11,138 5,920 2,095
Ferrovial Construction 13,647 10,723 10,180 8,851
Webber 10,023 6,112 3,050 3,187
Ferrovial Corporation 521 345 360 365
Cintra 20,006 7,640 7,563 1,936
Amey 14,291 2,524 2,108 85
Broadspectrum 27,946 22,126 21,328 19,112
Ferrovial Services 15,049 12,376 2,070 274
Transchile 4 0 1 0
TOTAL tCO2 eq 165,959 91,430 68,533 52,632
GHG EMISSIONS (SCOPE 1 + SCOPE 2) (TCO2 EQ/M€)
BY BUSINESS 2009 (base-year) 2018 2019 2020Construction 46.22 47.59 43.20 43.07
Corporate 10.43 175.56 46.87 72.86
Infrastructure 60.26 17.36 15.61 10.12
Services 230.75 98.36 105.04 108.35
Airports 6.29 4.69 2.60 2.00
Relative emissions (tCO2 eq/M€) 162.36 74.13 75.55 72.01
305-3. OTHER INDIRECT GHG EMISSIONS (SCOPE 3) The activities, products and services included in Scope 3 are as follows:• Purchased goods and services: include emissions related to the life cycle of materials purchased by Ferrovial that have been used in products
or services that the company offers. This is limited to emissions derived from the purchase of paper, wood, water and other relevant materials (concrete and asphalt) described in indicator 301-1. Data from subcontractors are not included.
• Capital goods: Includes all upstream emissions (i.e., cradle to gate) from the production of capital goods purchased or acquired by the company in the year, based on the information contained in the Consolidated Financial Statements.
• Fuel and energy related activities: this section includes the energy required to produce the fuels and electricity consumed by the company and the loss of electricity in transportation.
• Upstream transportation and distribution: includes emissions from the transportation and distribution of the main products acquired during the year.
• Waste generated in operations: Emissions in this section are related to waste generated by the company’s activity that have been reported in 2019.
• Business travel: Includes emissions associated with business travel: train, plane and cabs reported by the main travel agency with which the group works in Spain.
• Employee commuting: Includes emissions from employee commuting from their homes to their workplaces at the head offices in Spain.• Investments: Investments include emissions related to investments in British airports and toll roads over which the Group does not have
operational control. All airports carry out independent external verification of their emissions. At the date of publication of this report, data for 2020 is not available, so emissions for 2019 have been considered.
• Use of sold products: Ferrovial calculates emissions from the use of land transport infrastructures managed by Cintra.• End of life treatment of sold products: This category includes exclusively emissions from the disposal of waste generated at the end of the
useful life of products sold by Ferrovial in the reporting year. Only emissions derived from products (wood, paper, asphalt and concrete) reported in the Purchased goods and services category have been taken into consideration.
• Upstream leased assets: Includes emissions related to the electricity consumption of those client buildings where Amey carries out maintenance and cleaning and manages consumption.
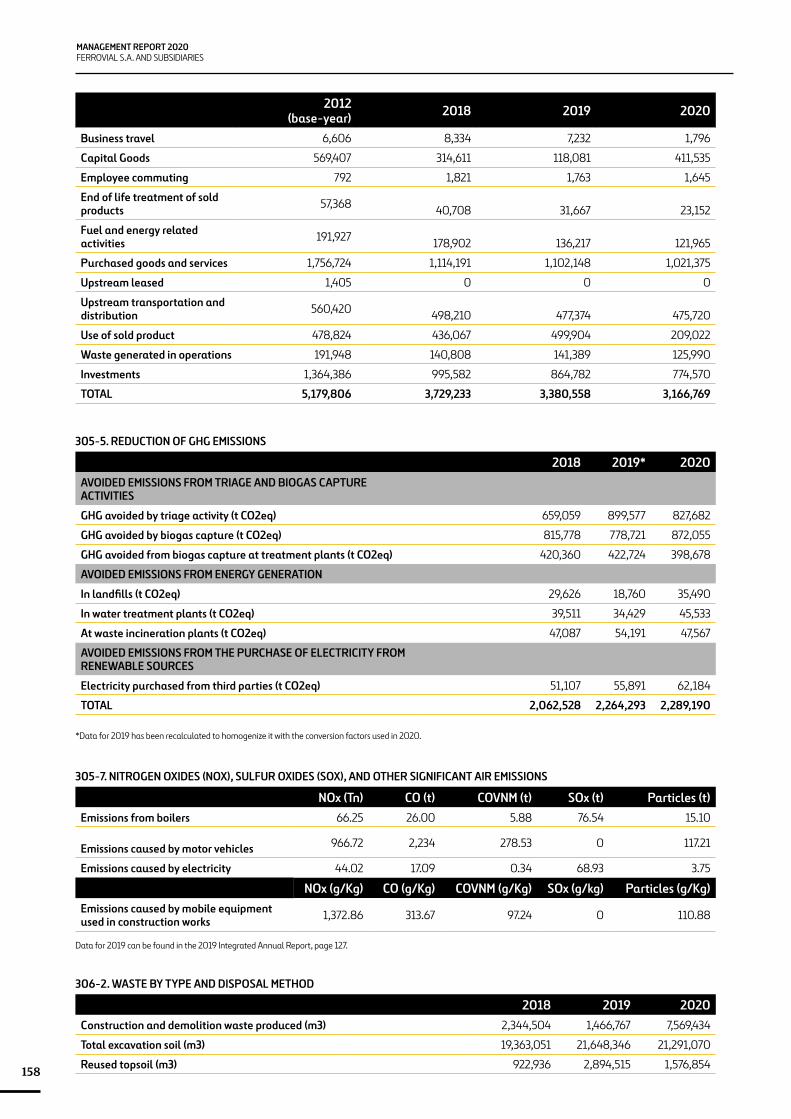
MANAGEMENT REPORT 2020FERROVIAL S.A. AND SUBSIDIARIES
158
2012 (base-year) 2018 2019 2020
Business travel 6,606 8,334 7,232 1,796
Capital Goods 569,407 314,611 118,081 411,535
Employee commuting 792 1,821 1,763 1,645
End of life treatment of sold products 57,368 40,708 31,667 23,152
Fuel and energy related activities 191,927 178,902 136,217 121,965
Purchased goods and services 1,756,724 1,114,191 1,102,148 1,021,375
Upstream leased 1,405 0 0 0
Upstream transportation and distribution 560,420 498,210 477,374 475,720
Use of sold product 478,824 436,067 499,904 209,022
Waste generated in operations 191,948 140,808 141,389 125,990
Investments 1,364,386 995,582 864,782 774,570
TOTAL 5,179,806 3,729,233 3,380,558 3,166,769
305-5. REDUCTION OF GHG EMISSIONS
2018 2019* 2020AVOIDED EMISSIONS FROM TRIAGE AND BIOGAS CAPTURE ACTIVITIES
GHG avoided by triage activity (t CO2eq) 659,059 899,577 827,682
GHG avoided by biogas capture (t CO2eq) 815,778 778,721 872,055
GHG avoided from biogas capture at treatment plants (t CO2eq) 420,360 422,724 398,678
AVOIDED EMISSIONS FROM ENERGY GENERATION
In landfills (t CO2eq) 29,626 18,760 35,490
In water treatment plants (t CO2eq) 39,511 34,429 45,533
At waste incineration plants (t CO2eq) 47,087 54,191 47,567
AVOIDED EMISSIONS FROM THE PURCHASE OF ELECTRICITY FROM RENEWABLE SOURCES
Electricity purchased from third parties (t CO2eq) 51,107 55,891 62,184
TOTAL 2,062,528 2,264,293 2,289,190
*Data for 2019 has been recalculated to homogenize it with the conversion factors used in 2020.
305-7. NITROGEN OXIDES (NOX), SULFUR OXIDES (SOX), AND OTHER SIGNIFICANT AIR EMISSIONS
NOx (Tn) CO (t) COVNM (t) SOx (t) Particles (t)Emissions from boilers 66.25 26.00 5.88 76.54 15.10
Emissions caused by motor vehicles 966.72 2,234 278.53 0 117.21
Emissions caused by electricity 44.02 17.09 0.34 68.93 3.75
NOx (g/Kg) CO (g/Kg) COVNM (g/Kg) SOx (g/kg) Particles (g/Kg)Emissions caused by mobile equipment used in construction works 1,372.86 313.67 97.24 0 110.88
Data for 2019 can be found in the 2019 Integrated Annual Report, page 127.
306-2. WASTE BY TYPE AND DISPOSAL METHOD
2018 2019 2020Construction and demolition waste produced (m3) 2,344,504 1,466,767 7,569,434
Total excavation soil (m3) 19,363,051 21,648,346 21,291,070
Reused topsoil (m3) 922,936 2,894,515 1,576,854
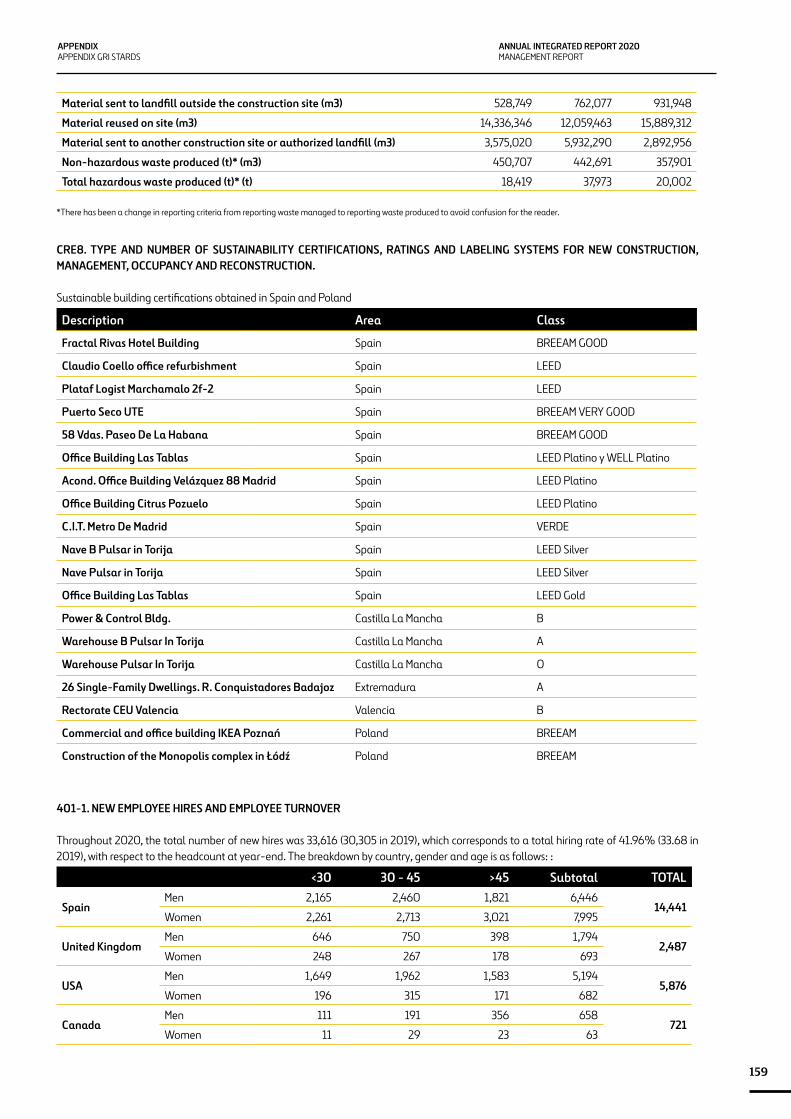
ANNUAL INTEGRATED REPORT 2020MANAGEMENT REPORT
159
APPENDIXAPPENDIX GRI STARDS
Material sent to landfill outside the construction site (m3) 528,749 762,077 931,948
Material reused on site (m3) 14,336,346 12,059,463 15,889,312
Material sent to another construction site or authorized landfill (m3) 3,575,020 5,932,290 2,892,956
Non-hazardous waste produced (t)* (m3) 450,707 442,691 357,901
Total hazardous waste produced (t)* (t) 18,419 37,973 20,002
*There has been a change in reporting criteria from reporting waste managed to reporting waste produced to avoid confusion for the reader.
CRE8. TYPE AND NUMBER OF SUSTAINABILITY CERTIFICATIONS, RATINGS AND LABELING SYSTEMS FOR NEW CONSTRUCTION, MANAGEMENT, OCCUPANCY AND RECONSTRUCTION.
Sustainable building certifications obtained in Spain and Poland
Description Area Class
Fractal Rivas Hotel Building Spain BREEAM GOOD
Claudio Coello office refurbishment Spain LEED
Plataf Logist Marchamalo 2f-2 Spain LEED
Puerto Seco UTE Spain BREEAM VERY GOOD
58 Vdas. Paseo De La Habana Spain BREEAM GOOD
Office Building Las Tablas Spain LEED Platino y WELL Platino
Acond. Office Building Velázquez 88 Madrid Spain LEED Platino
Office Building Citrus Pozuelo Spain LEED Platino
C.I.T. Metro De Madrid Spain VERDE
Nave B Pulsar in Torija Spain LEED Silver
Nave Pulsar in Torija Spain LEED Silver
Office Building Las Tablas Spain LEED Gold
Power & Control Bldg. Castilla La Mancha B
Warehouse B Pulsar In Torija Castilla La Mancha A
Warehouse Pulsar In Torija Castilla La Mancha O
26 Single-Family Dwellings. R. Conquistadores Badajoz Extremadura A
Rectorate CEU Valencia Valencia B
Commercial and office building IKEA Poznań Poland BREEAM
Construction of the Monopolis complex in Łódź Poland BREEAM
401-1. NEW EMPLOYEE HIRES AND EMPLOYEE TURNOVER
Throughout 2020, the total number of new hires was 33,616 (30,305 in 2019), which corresponds to a total hiring rate of 41.96% (33.68 in 2019), with respect to the headcount at year-end. The breakdown by country, gender and age is as follows: :
<30 30 - 45 >45 Subtotal TOTAL
SpainMen 2,165 2,460 1,821 6,446
14,441Women 2,261 2,713 3,021 7,995
United KingdomMen 646 750 398 1,794
2,487Women 248 267 178 693
USAMen 1,649 1,962 1,583 5,194
5,876Women 196 315 171 682
CanadaMen 111 191 356 658
721Women 11 29 23 63
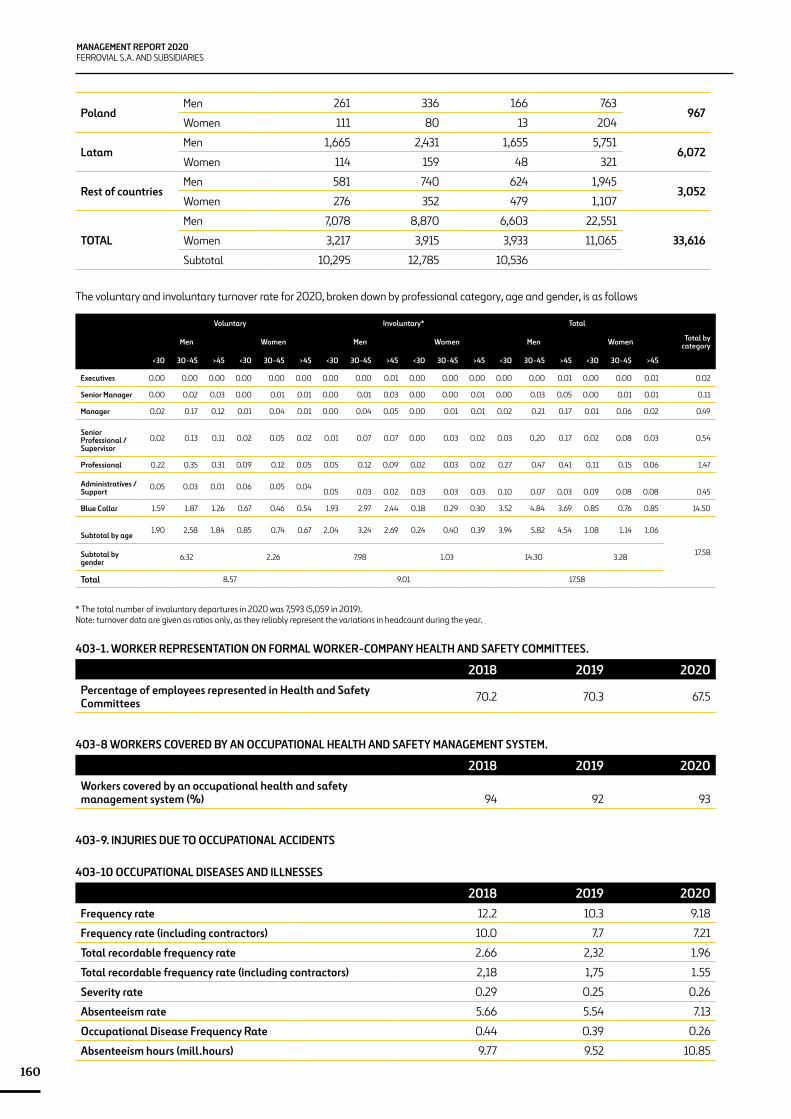
MANAGEMENT REPORT 2020FERROVIAL S.A. AND SUBSIDIARIES
160
PolandMen 261 336 166 763
967Women 111 80 13 204
LatamMen 1,665 2,431 1,655 5,751
6,072Women 114 159 48 321
Rest of countriesMen 581 740 624 1,945
3,052Women 276 352 479 1,107
TOTAL
Men 7,078 8,870 6,603 22,551
33,616 Women 3,217 3,915 3,933 11,065
Subtotal 10,295 12,785 10,536
The voluntary and involuntary turnover rate for 2020, broken down by professional category, age and gender, is as follows
Voluntary Involuntary* Total
Total by categoryMen Women Men Women Men Women
<30 30-45 >45 <30 30-45 >45 <30 30-45 >45 <30 30-45 >45 <30 30-45 >45 <30 30-45 >45
Executives 0.00 0.00 0.00 0.00 0.00 0.00 0.00 0.00 0.01 0.00 0.00 0.00 0.00 0.00 0.01 0.00 0.00 0.01 0.02
Senior Manager 0.00 0.02 0.03 0.00 0.01 0.01 0.00 0.01 0.03 0.00 0.00 0.01 0.00 0.03 0.05 0.00 0.01 0.01 0.11
Manager 0.02 0.17 0.12 0.01 0.04 0.01 0.00 0.04 0.05 0.00 0.01 0.01 0.02 0.21 0.17 0.01 0.06 0.02 0.49
Senior Professional / Supervisor
0.02 0.13 0.11 0.02 0.05 0.02 0.01 0.07 0.07 0.00 0.03 0.02 0.03 0.20 0.17 0.02 0.08 0.03 0.54
Professional 0.22 0.35 0.31 0.09 0.12 0.05 0.05 0.12 0.09 0.02 0.03 0.02 0.27 0.47 0.41 0.11 0.15 0.06 1.47
Administratives / Support
0.05 0.03 0.01 0.06 0.05 0.040.05 0.03 0.02 0.03 0.03 0.03 0.10 0.07 0.03 0.09 0.08 0.08 0.45
Blue Collar 1.59 1.87 1.26 0.67 0.46 0.54 1.93 2.97 2.44 0.18 0.29 0.30 3.52 4.84 3.69 0.85 0.76 0.85 14.50
Subtotal by age1.90 2.58 1.84 0.85 0.74 0.67 2.04 3.24 2.69 0.24 0.40 0.39 3.94 5.82 4.54 1.08 1.14 1.06
17.58Subtotal by gender
6.32 2.26 7.98 1.03 14.30 3.28
Total 8.57 9.01 17.58
* The total number of involuntary departures in 2020 was 7,593 (5,059 in 2019). Note: turnover data are given as ratios only, as they reliably represent the variations in headcount during the year.
403-1. WORKER REPRESENTATION ON FORMAL WORKER-COMPANY HEALTH AND SAFETY COMMITTEES.
2018 2019 2020Percentage of employees represented in Health and Safety Committees 70.2 70.3 67.5
403-8 WORKERS COVERED BY AN OCCUPATIONAL HEALTH AND SAFETY MANAGEMENT SYSTEM.
2018 2019 2020Workers covered by an occupational health and safety management system (%) 94 92 93
403-9. INJURIES DUE TO OCCUPATIONAL ACCIDENTS
403-10 OCCUPATIONAL DISEASES AND ILLNESSES
2018 2019 2020Frequency rate 12.2 10.3 9.18
Frequency rate (including contractors) 10.0 7.7 7.21
Total recordable frequency rate 2.66 2,32 1.96
Total recordable frequency rate (including contractors) 2,18 1,75 1.55
Severity rate 0.29 0.25 0.26
Absenteeism rate 5.66 5.54 7.13
Occupational Disease Frequency Rate 0.44 0.39 0.26
Absenteeism hours (mill.hours) 9.77 9.52 10.85
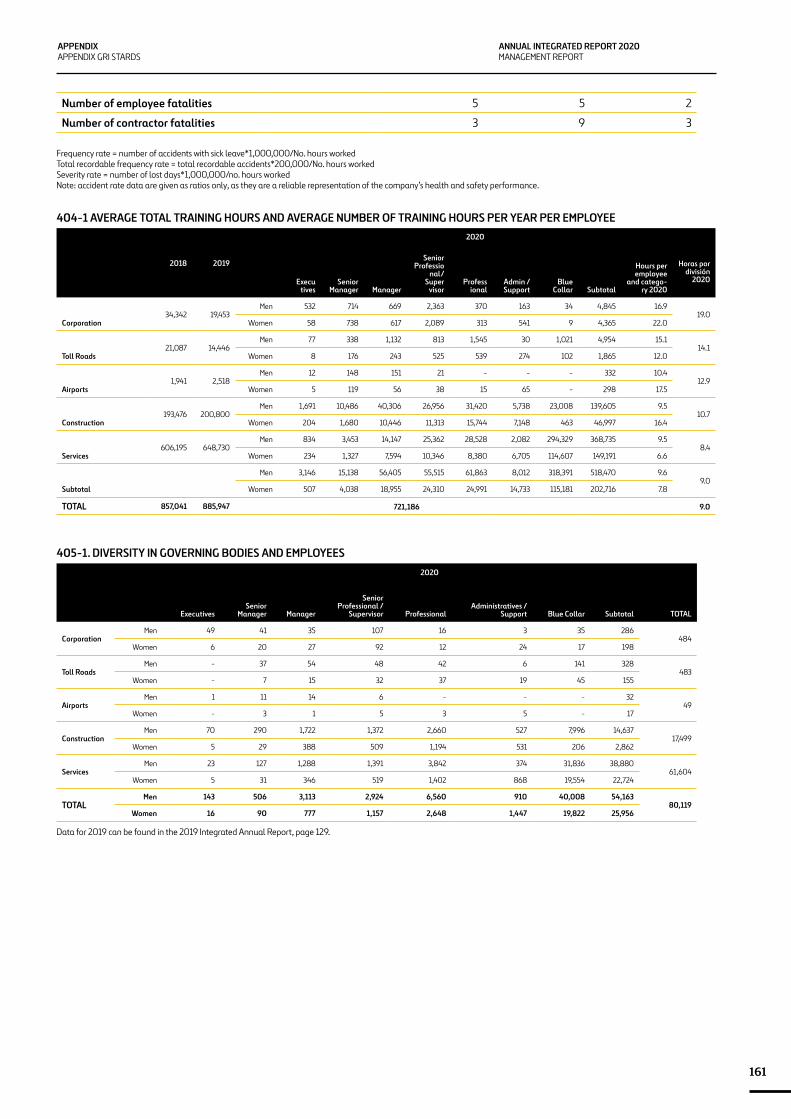
ANNUAL INTEGRATED REPORT 2020MANAGEMENT REPORT
161
APPENDIXAPPENDIX GRI STARDS
Number of employee fatalities 5 5 2
Number of contractor fatalities 3 9 3
Frequency rate = number of accidents with sick leave*1,000,000/No. hours workedTotal recordable frequency rate = total recordable accidents*200,000/No. hours workedSeverity rate = number of lost days*1,000,000/no. hours workedNote: accident rate data are given as ratios only, as they are a reliable representation of the company’s health and safety performance.
404-1 AVERAGE TOTAL TRAINING HOURS AND AVERAGE NUMBER OF TRAINING HOURS PER YEAR PER EMPLOYEE
2018 2019
2020
Execu tives
Senior Manager Manager
Senior Professio
nal/ Super
visorProfess
ionalAdmin /
SupportBlue
Collar Subtotal
Hours per employee
and catego-ry 2020
Horas por división
2020
Corporation34,342 19,453
Men 532 714 669 2,363 370 163 34 4,845 16.919.0
Women 58 738 617 2,089 313 541 9 4,365 22.0
Toll Roads21,087 14,446
Men 77 338 1,132 813 1,545 30 1,021 4,954 15.114.1
Women 8 176 243 525 539 274 102 1,865 12.0
Airports1,941 2,518
Men 12 148 151 21 - - - 332 10.412.9
Women 5 119 56 38 15 65 - 298 17.5
Construction193,476 200,800
Men 1,691 10,486 40,306 26,956 31,420 5,738 23,008 139,605 9.510.7
Women 204 1,680 10,446 11,313 15,744 7,148 463 46,997 16.4
Services606,195 648,730
Men 834 3,453 14,147 25,362 28,528 2,082 294,329 368,735 9.58.4
Women 234 1,327 7,594 10,346 8,380 6,705 114,607 149,191 6.6
Subtotal
Men 3,146 15,138 56,405 55,515 61,863 8,012 318,391 518,470 9.69.0
Women 507 4,038 18,955 24,310 24,991 14,733 115,181 202,716 7.8
TOTAL 857,041 885,947 721,186 9.0
405-1. DIVERSITY IN GOVERNING BODIES AND EMPLOYEES2020
ExecutivesSenior
Manager Manager
Senior Professional /
Supervisor ProfessionalAdministratives /
Support Blue Collar Subtotal TOTAL
CorporationMen 49 41 35 107 16 3 35 286
484 Women 6 20 27 92 12 24 17 198
Toll RoadsMen - 37 54 48 42 6 141 328
483 Women - 7 15 32 37 19 45 155
AirportsMen 1 11 14 6 - - - 32
49 Women - 3 1 5 3 5 - 17
ConstructionMen 70 290 1,722 1,372 2,660 527 7,996 14,637
17,499 Women 5 29 388 509 1,194 531 206 2,862
ServicesMen 23 127 1,288 1,391 3,842 374 31,836 38,880
61,604 Women 5 31 346 519 1,402 868 19,554 22,724
TOTALMen 143 506 3,113 2,924 6,560 910 40,008 54,163
80,119 Women 16 90 777 1,157 2,648 1,447 19,822 25,956
Data for 2019 can be found in the 2019 Integrated Annual Report, page 129.
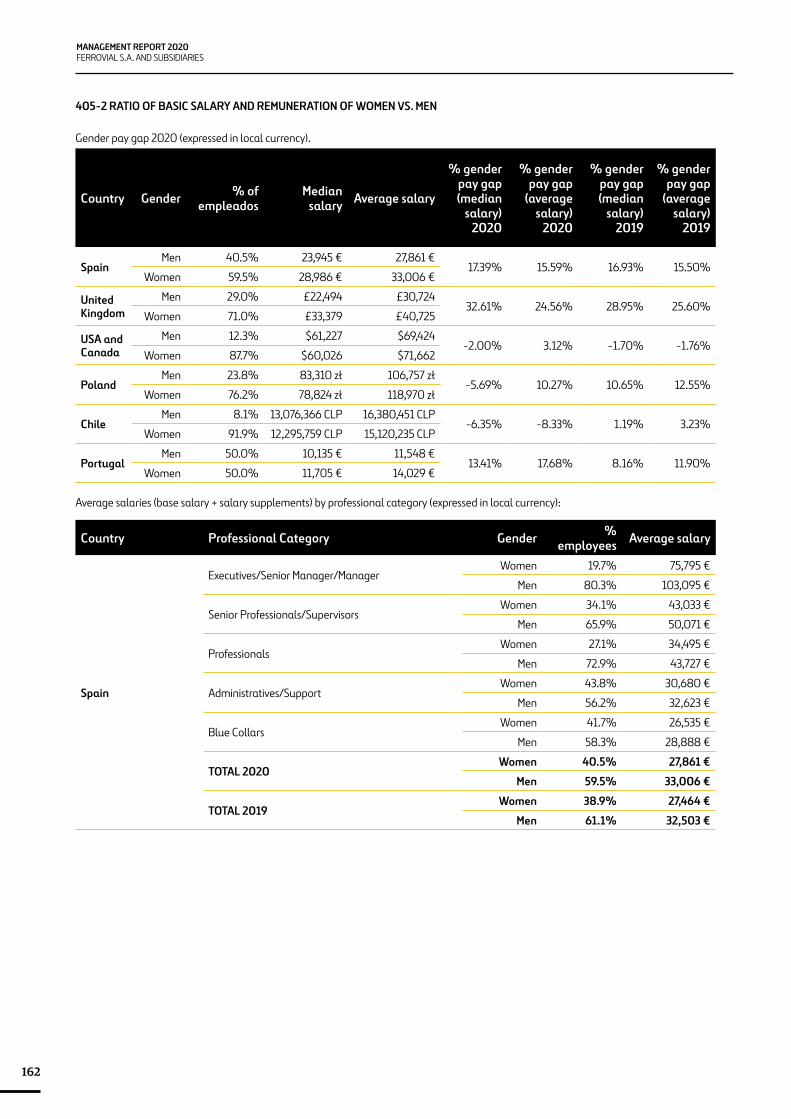
MANAGEMENT REPORT 2020FERROVIAL S.A. AND SUBSIDIARIES
162
405-2 RATIO OF BASIC SALARY AND REMUNERATION OF WOMEN VS. MEN
Gender pay gap 2020 (expressed in local currency).
Country Gender % of empleados
Median salary Average salary
% gender pay gap (median
salary) 2020
% gender pay gap
(average salary)
2020
% gender pay gap (median
salary) 2019
% gender pay gap
(average salary)
2019
SpainMen 40.5% 23,945 € 27,861 €
17.39% 15.59% 16.93% 15.50%Women 59.5% 28,986 € 33,006 €
United Kingdom
Men 29.0% £22,494 £30,72432.61% 24.56% 28.95% 25.60%
Women 71.0% £33,379 £40,725
USA and Canada
Men 12.3% $61,227 $69,424-2.00% 3.12% -1.70% -1.76%
Women 87.7% $60,026 $71,662
PolandMen 23.8% 83,310 zł 106,757 zł
-5.69% 10.27% 10.65% 12.55%Women 76.2% 78,824 zł 118,970 zł
ChileMen 8.1% 13,076,366 CLP 16,380,451 CLP
-6.35% -8.33% 1.19% 3.23%Women 91.9% 12,295,759 CLP 15,120,235 CLP
PortugalMen 50.0% 10,135 € 11,548 €
13.41% 17.68% 8.16% 11.90%Women 50.0% 11,705 € 14,029 €
Average salaries (base salary + salary supplements) by professional category (expressed in local currency):
Country Professional Category Gender % employees Average salary
Spain
Executives/Senior Manager/ManagerWomen 19.7% 75,795 €
Men 80.3% 103,095 €
Senior Professionals/SupervisorsWomen 34.1% 43,033 €
Men 65.9% 50,071 €
ProfessionalsWomen 27.1% 34,495 €
Men 72.9% 43,727 €
Administratives/SupportWomen 43.8% 30,680 €
Men 56.2% 32,623 €
Blue CollarsWomen 41.7% 26,535 €
Men 58.3% 28,888 €
TOTAL 2020Women 40.5% 27,861 €
Men 59.5% 33,006 €
TOTAL 2019Women 38.9% 27,464 €
Men 61.1% 32,503 €
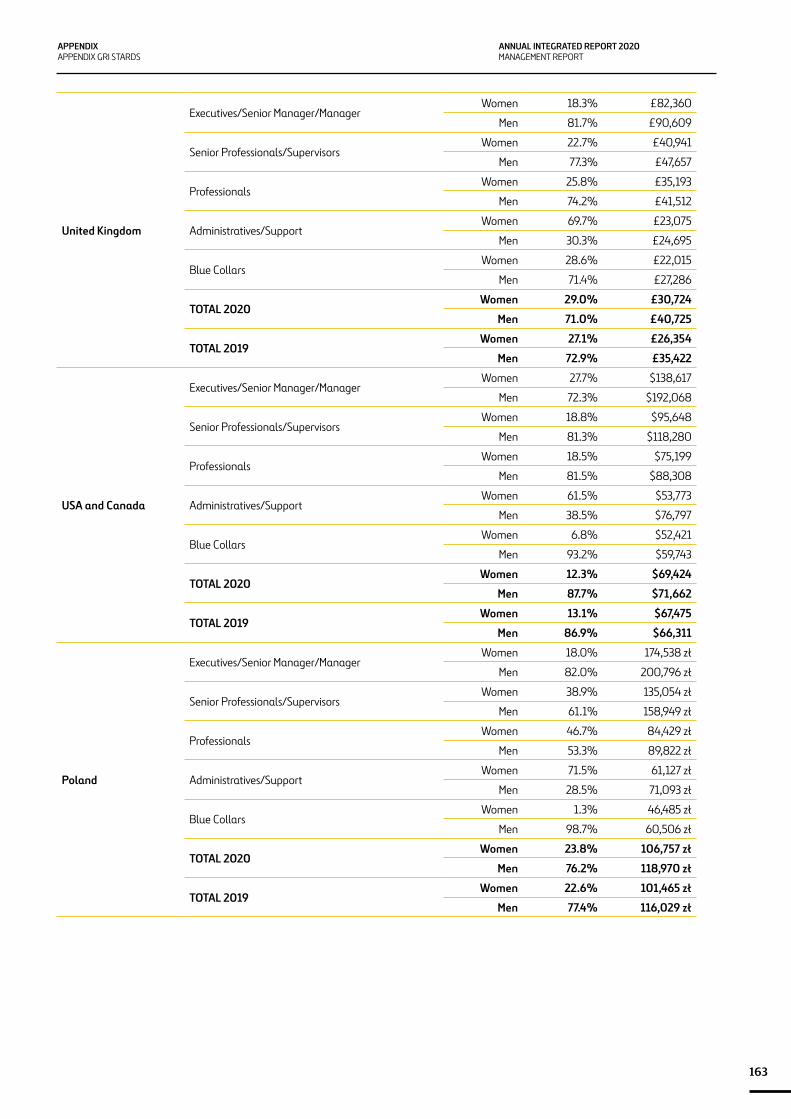
ANNUAL INTEGRATED REPORT 2020MANAGEMENT REPORT
163
APPENDIXAPPENDIX GRI STARDS
United Kingdom
Executives/Senior Manager/ManagerWomen 18.3% £82,360
Men 81.7% £90,609
Senior Professionals/SupervisorsWomen 22.7% £40,941
Men 77.3% £47,657
ProfessionalsWomen 25.8% £35,193
Men 74.2% £41,512
Administratives/SupportWomen 69.7% £23,075
Men 30.3% £24,695
Blue CollarsWomen 28.6% £22,015
Men 71.4% £27,286
TOTAL 2020Women 29.0% £30,724
Men 71.0% £40,725
TOTAL 2019Women 27.1% £26,354
Men 72.9% £35,422
USA and Canada
Executives/Senior Manager/ManagerWomen 27.7% $138,617
Men 72.3% $192,068
Senior Professionals/SupervisorsWomen 18.8% $95,648
Men 81.3% $118,280
ProfessionalsWomen 18.5% $75,199
Men 81.5% $88,308
Administratives/SupportWomen 61.5% $53,773
Men 38.5% $76,797
Blue CollarsWomen 6.8% $52,421
Men 93.2% $59,743
TOTAL 2020Women 12.3% $69,424
Men 87.7% $71,662
TOTAL 2019Women 13.1% $67,475
Men 86.9% $66,311
Poland
Executives/Senior Manager/ManagerWomen 18.0% 174,538 zł
Men 82.0% 200,796 zł
Senior Professionals/SupervisorsWomen 38.9% 135,054 zł
Men 61.1% 158,949 zł
ProfessionalsWomen 46.7% 84,429 zł
Men 53.3% 89,822 zł
Administratives/SupportWomen 71.5% 61,127 zł
Men 28.5% 71,093 zł
Blue CollarsWomen 1.3% 46,485 zł
Men 98.7% 60,506 zł
TOTAL 2020Women 23.8% 106,757 zł
Men 76.2% 118,970 zł
TOTAL 2019Women 22.6% 101,465 zł
Men 77.4% 116,029 zł
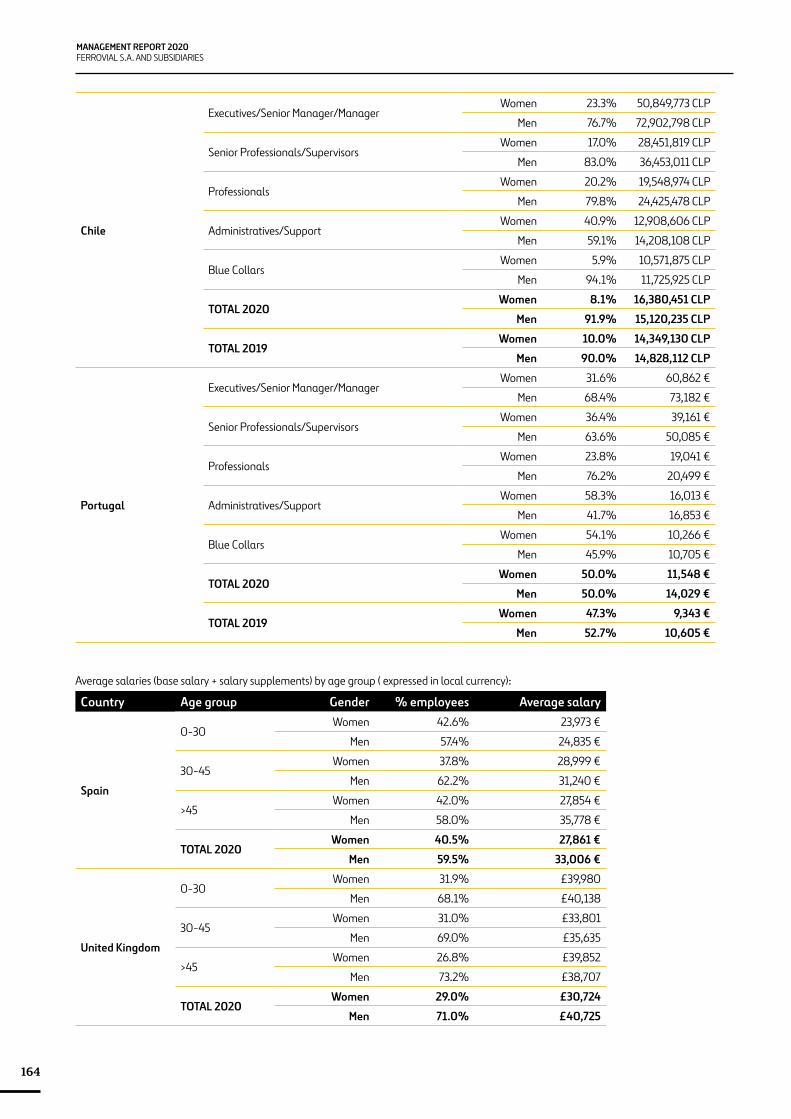
MANAGEMENT REPORT 2020FERROVIAL S.A. AND SUBSIDIARIES
164
Chile
Executives/Senior Manager/ManagerWomen 23.3% 50,849,773 CLP
Men 76.7% 72,902,798 CLP
Senior Professionals/SupervisorsWomen 17.0% 28,451,819 CLP
Men 83.0% 36,453,011 CLP
ProfessionalsWomen 20.2% 19,548,974 CLP
Men 79.8% 24,425,478 CLP
Administratives/SupportWomen 40.9% 12,908,606 CLP
Men 59.1% 14,208,108 CLP
Blue CollarsWomen 5.9% 10,571,875 CLP
Men 94.1% 11,725,925 CLP
TOTAL 2020Women 8.1% 16,380,451 CLP
Men 91.9% 15,120,235 CLP
TOTAL 2019Women 10.0% 14,349,130 CLP
Men 90.0% 14,828,112 CLP
Portugal
Executives/Senior Manager/ManagerWomen 31.6% 60,862 €
Men 68.4% 73,182 €
Senior Professionals/SupervisorsWomen 36.4% 39,161 €
Men 63.6% 50,085 €
ProfessionalsWomen 23.8% 19,041 €
Men 76.2% 20,499 €
Administratives/SupportWomen 58.3% 16,013 €
Men 41.7% 16,853 €
Blue CollarsWomen 54.1% 10,266 €
Men 45.9% 10,705 €
TOTAL 2020Women 50.0% 11,548 €
Men 50.0% 14,029 €
TOTAL 2019Women 47.3% 9,343 €
Men 52.7% 10,605 €
Average salaries (base salary + salary supplements) by age group ( expressed in local currency):
Country Age group Gender % employees Average salary
Spain
0-30Women 42.6% 23,973 €
Men 57.4% 24,835 €
30-45Women 37.8% 28,999 €
Men 62.2% 31,240 €
>45Women 42.0% 27,854 €
Men 58.0% 35,778 €
TOTAL 2020Women 40.5% 27,861 €
Men 59.5% 33,006 €
United Kingdom
0-30Women 31.9% £39,980
Men 68.1% £40,138
30-45Women 31.0% £33,801
Men 69.0% £35,635
>45Women 26.8% £39,852
Men 73.2% £38,707
TOTAL 2020Women 29.0% £30,724
Men 71.0% £40,725
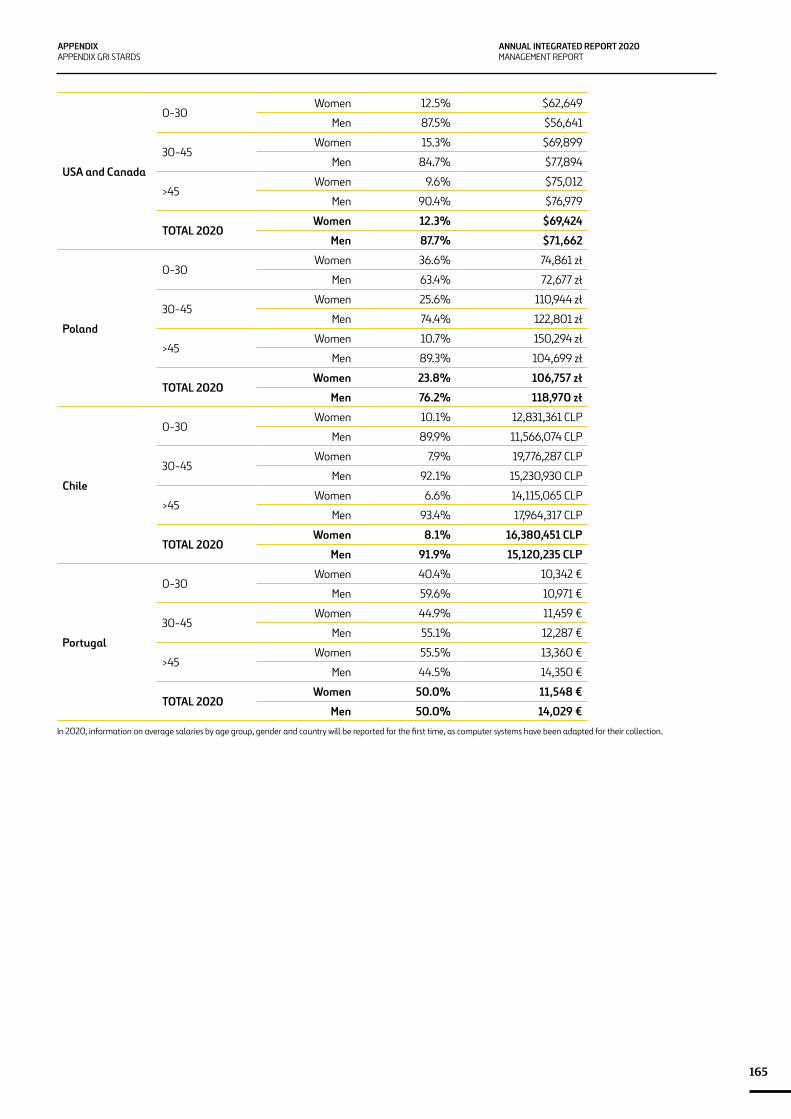
ANNUAL INTEGRATED REPORT 2020MANAGEMENT REPORT
165
APPENDIXAPPENDIX GRI STARDS
USA and Canada
0-30Women 12.5% $62,649
Men 87.5% $56,641
30-45Women 15.3% $69,899
Men 84.7% $77,894
>45Women 9.6% $75,012
Men 90.4% $76,979
TOTAL 2020Women 12.3% $69,424
Men 87.7% $71,662
Poland
0-30Women 36.6% 74,861 zł
Men 63.4% 72,677 zł
30-45Women 25.6% 110,944 zł
Men 74.4% 122,801 zł
>45Women 10.7% 150,294 zł
Men 89.3% 104,699 zł
TOTAL 2020Women 23.8% 106,757 zł
Men 76.2% 118,970 zł
Chile
0-30Women 10.1% 12,831,361 CLP
Men 89.9% 11,566,074 CLP
30-45Women 7.9% 19,776,287 CLP
Men 92.1% 15,230,930 CLP
>45Women 6.6% 14,115,065 CLP
Men 93.4% 17,964,317 CLP
TOTAL 2020Women 8.1% 16,380,451 CLP
Men 91.9% 15,120,235 CLP
Portugal
0-30Women 40.4% 10,342 €
Men 59.6% 10,971 €
30-45Women 44.9% 11,459 €
Men 55.1% 12,287 €
>45Women 55.5% 13,360 €
Men 44.5% 14,350 €
TOTAL 2020Women 50.0% 11,548 €
Men 50.0% 14,029 €
In 2020, information on average salaries by age group, gender and country will be reported for the first time, as computer systems have been adapted for their collection.
MANAGEMENT REPORT 2020FERROVIAL S.A. AND SUBSIDIARIES
166
GLOSSARY OF TERMS
ACI: Airports Council International (ACI) is the only global trade repre-sentative of the world’s airports. Established in 1991, ACI represents airport’s interests with Governments and international organizations such as ICAO; develops standards, policies and recommends practices for airports, and provides information and training opportunities to raise standards around the world. This section provides you with infor-mation on the structure and background of ACI.
AGS: Aberdeen, Glasgow and Southampton. AGS Airports is the United Kingdom-based owner of Aberdeen, Glasgow and Southampton Airports. The company was formed in September 2014 by Ferrovial and Macquire Group. The company acquired Aberdeen, Glasgow and South-ampton Airports in December 2014 from Heathrow Airport Holdings.
ASQ: Airport Service Quality Survey. The Airport Service Quality is the world-renowned and globally established global benchmarking programme measuring passengers’ satisfaction whilst they are travel-ling through an airport. The programme provides the research tools and management information to better understand passengers’ views and what they want from an airport’s products and services.
BAME: acronym in English of black, asian and minority ethnic.
BIM: It is a collaborative work methodology for the creation and management of a construction project (both building and infrastruc-ture). Its objective is to centralize all project information in a digital information model created by all its agents. The use of BIM goes beyond the design phases, encompassing the execution of the project and extending throughout the life cycle of the building, allowing its management and reducing operating costs.
BWI: Business Water Index. Business Water Index is related to the consumption of water and its discharge carried out in activities devel-oped by Ferrovial.
CAA: Civil Aviation Authority. The Civil Aviation Authority is the stat-utory corporation which oversees and regulates all aspects of civil aviations in the United Kingdom. The CAA is a public corporation of the Department for Transport establishd by the British Parliament in 1972 and an independent aviation regulator.
CAC: Audit and Control Committee. The Audit and Control Committee is composed of two independent directors and one external director. It is responsible for the supervision of accounts, internal audit, financial information and risk control.
DBFOM: Design, Building, Finance, Operation and Maintenance.
CDP: Carbon Disclosure Project. CDP is an organisation based in the United Kingdom which supports companies and cities to disclose the
environmental impact of major corporations. It aims to make environ-mental reporting and risk management a business norm, and drive disclosure, insight and action towards a sustainable economy.
CIIO: Chief Information and Innovation Officer. A chief innovation officer (CINO) or chief technology innovation officer (CTIO) is a person in a company who is primarily responsible for managing the process of innovation and change management in an organization, as well as being in some cases the person who originates new ideas but also recognizes innovative ideas generated by other people.
CNMV: Comisión Nacional del Mercado de Valores. The National Secu-rities Market Commission (CNMV) is the body responsible for the super-vision and inspection of Spanish securities markets and the activity of all those involved in them. The aim of the CNMV is to ensure the trans-parency of Spanish securities markets and the correct formation of prices, as well as the protection of investors.
CPS: Current Policies Scenario. Consider the impact of the policies and measures that are firmly established at present. This scenario would mean an increase in the global temperature of +3-4°C in 2100.
CRM: Customer Relationship Management. It is an information industry term that applies to methodologies, software and, in general, to the capabilities of the Internet that help a company manage relationships with its customers in an organized manner.
CSIC: Consejo Superior de Investigaciones Científicas. The Spanish National Research Council (CSIC) is the largest public institution dedi-cated to research in Spain and the third largest in Europe. Belonging to the Spanish Ministry of Economy and Competitiveness through the Secretary of State for Research, Development and Innovation, its main objective is to develop and promote research that will help bring about scientific and technological progress, and it is prepared to collaborate with Spanish and foreign entities in order to achieve this aim.
DJSI: The Dow Jones Sustainability Indices (DJSI) launched in 1999, are a family of indices evaluating the sustainability performance of thou-sands of companies trading publicly and a strategic partner of the S&P Dow Jones Indices. They are the longest-running global sustainability benchmarks worldwide and have become the key reference point in sustainability investing for investors and companies alike. The DJSI is based on an analysis of corporate economic, environmental and social performance, assessing issues such as corporate governance, risk management, branding, climate change mitigation, supply chain standards and labor practices.
FTSE4Good: The FTSE4Good Index Series is designed to measure the performance of companies demonstrating strong Environmental, Social and Governance (ESG) practices.
ANNUAL INTEGRATED REPORT 2020MANAGEMENT REPORT
167
APPENDIXGLOSSARY TERMS
EBITDA: Earnings Before Interest, Taxes, Depreciation, and Amortiza-tion. The Earnings Before Interest, Taxes, Depreciation, and Amortiza-tion (EBITDA) is an accounting measure calculated using a company’s net earnings, before interest expenses, taxes, depreciation, and amor-tization are subtracted, as a proxy for a company’s current operating profitability (i.e., how much profit it makes with its present assets and its operations on the products it produces and sells, as well as providing a proxy for cash flow).
EPD: Environmental Product Declaration. An EPD provides a reli-able, relevant, transparent, comparable and verifiable environmental profile that highlights an environmentally friendly product, based on life cycle information (LCA) according to international standards and quantified environmental data.
FRM: Ferrovial Risk Management. The Ferrovial Risk Management (FRM) is and identification and assesment process, supervised by the Board of Directors and the Management Committee, which is imple-mented in all business areas. This process makes it possible to fore-stall risks; once they have been analyzed and assessed based on their potential impact and likelihood, the most appropriate management and protection measures are taken, depending on the risk nature and location.
GECV: Grupo Español de Crecimiento Verde. The Spanish Group of Green Growth is a business association whose objective is to transfer to society and to public administration its vision of a model of economic growth which is compatible with the efficient use of natural resources.
GHG: Greenhouse Gas. A greenhouse gas is a gas in an atmosphere that absorbs and emits radiant energy within the thermal infrared range.
GRI: Global Reporting Initiative. GRI helps businesses and govern-ments worldwide understand and communicate their impact on crit-ical sustainability issues such as climate change, human rights, gover-nance and social well-being. This enables real action to create social, environmental and economic benefits for everyone. The GRI Sustain-ability Reporting Standards are developed with true multi-stakeholder contributions and rooted in the public interest.
GWT: Global Water Tool. The Global Water Tool (GWT) is a free, publicly available resource for identifying corporate water risks and opportunities which provides easy access to and analysis of critical data. It includes a workbook (data input, inventory by site, key reporting indicators, metrics calculations), a mapping function to plot sites with datasets, and a Google Earth interface for spatial viewing.
GOP: Gross Operating Profit (RBE): See EBITDA.
HAH: Heathrow Airport Holdings. Heathrow Airport Holdings Limited, formerly BAA is the United Kingdom-based operator of Heathrow Airport. It was formed by the privatisation of the British Airports Authority as BAA plc as part of Margaret Thatcher’s moves to privatise government-owned assets. BAA plc was bought in 2006 by a consor-tium led by Ferrovial.
IAGC: Informe Anual de Gobierno Corporativo.
IFRS: NIIF. International Financial Reporting Standards, usually called the IFRS Standards, are standards issued by the IFRS Foundation and the International Accounting Standards Board (IASB) to provide a common global language for business affairs so that company accounts are understandable and comparable across international boundaries.
IRR: Internal Rate of Return. Internal Rate of Return (IRR) is a metric used in capital budgeting to estimate the profitability of potential investments. Internal rate of return is a discount rate that makes the net present value (NPV) of all cash flows from a particular project equal to zero.
IoT: Internet of Things. The Internet of things (IoT) is the network of phys-ical devices, vehicles, home appliances and other items embedded with electronics, software, sensors, actuators, and network connectivity which enables these objects to connect and exchange data.
ILO: International Labour Organization. The International Labour Organization (ILO) is a United Nations agency dealing with labour problems, particularly international labour standards, social protec-tion, and work opportunities for all.
ISO: International Organization for Standardization. ISO is an indepen-dent, non-governmental international organization with a member-ship of 162 national standards bodies. Through its members, it brings together experts to share knowledge and develop voluntary, consen-sus-based, market relevant International Standards that support innovation and provide solutions to global challenges.
Managed Lanes: assets developed by Ferrovial in the United States, consisting of a lane or toll lanes in addition to those already existing, in which a minimum speed is guaranteed to its users. The rates are adjusted to the traffic conditions, thereby regulating access levels.
MBA: The Master of Business Administration (MBA or M.B.A.) is a master’s degree in business administration (management).
MIT: Massachusetts Institute of Technology is an educational institution focused on excellence and research and founded in Boston, Massa-
168
MANAGEMENT REPORT 2020FERROVIAL S.A. AND SUBSIDIARIES
chusetts (USA), in 1861. The mission of the Massachusetts Institute of Technology is to advance knowledge and educate students in science, technology, and other areas of scholarship. The Institute is an inde-pendent, coeducational, privately endowed university, organized into five Schools (architecture and planning; engineering; humanities, arts, and social sciences; management; and science). It has some 1,000 faculty members, more than 11,000 undergraduate and graduate students, and more than 130,000 living alumni.
NPS: New Policies Scenario. This not only incorporates the announce-ment of policies and measures but also the effects of their implemen-tation. This scenario would mean an increase in the global tempera-ture of +2-3°C in 2100.
OMEGA: Optimization of Equipment Maintenance and Asset Management.
P3: Public-Private Partnership. A public–private partnership (P3, 3P or P3) is a cooperative arrangement between two or more public and private sectors, typically of a long-term nature. Governments have used such a mix of public and private endeavors throughout history, for instance, in order to develop infrastructure projects.
PAB: Private Activity Bonds. Tax-exempt bonds issued by or on behalf of local or state government for the purpose of providing special financing benefits for qualified projects. The financing is most often for projects of a private user, and the government generally does not pledge its credit. These bonds are used to attract private investment for projects that have some public benefit. There are strict rules as to which projects qualify. This type of a bond results in reduced financing costs because of the exception of federal tax.
RCE: Risk Control Effectiveness.
SASB: Sustainability Accounting Standards Board. Is a nonprofit organi-zation that sets financial reporting standards. SASB was founded in 2011 to develop and disseminate sustainability accounting standards.
SBTi: Science Based Targets. Science-based targets provide compa-nies with a clearly defined pathway to future-proof growth by speci-fying how much and how quickly they need to reduce their greenhouse gas emissions.
SDG: Sustainable Development Goals. The Sustainable Develop-ment Goals (SDGs) are a collection of 17 global goals set by the United Nations. The SDGs cover a broad range of social and economic devel-opment issues. These include poverty, hunger, health, education, climate change, gender equality, water, sanitation, energy, environ-ment and social justice.
SDS: Sustainable Development Scenario. This scenario is consistent with the decarbonisation of the economy needed in order to achieve the Paris Agreement. It includes a peak in emissions that will be reached as soon as possible followed by a decrease. An increase in temperatures with respect to pre-industrial levels of 2°C or less is expected.
STEM: Science, Technology, Engineering and Maths. This term is typically used when addressing education policy and curriculum choices in schools to improve competitiveness in science and technology development.
TCFD: Task Force on Climate-related Financial Disclosures. The FSB Task Force on Climate-related Financial Disclosures (TCFD) develops voluntary, consistent climate-related financial risk disclosures for use by companies in providing information to investors, lenders, insurers, and other stakeholders. The Task Force considers the physical, liability and transition risks associated with climate change and what consti-tutes effective financial disclosures across industries.
TSR (RTA): Total Shareholder Return. Total shareholder return (TSR) (or simply total return) is a measure of the performance of different companies’ stocks and shares over time. It combines share price appre-ciation and dividends paid to show the total return to the shareholder expressed as an annualized percentage.
USPP: US Private Placement. The US Private Placement (“USPP”) market is a US private bond market which is available to both US and non US companies. The principle attraction of this market is that it provides an alternative source of liquidity from the traditional bank market without the need for a formal credit rating and reporting requirements which are a pre-requisite of the public bond markets.
UTE: Unión Temporal de Empresas.
WAI: Water Access Index. The Water Access Index (WAI) , related to water supply projects within the Social Action Program.
WBCSD: World Business Council For Sustainable Development. WBCSD is a global, CEO-led organization of over 200 leading businesses working together to accelerate the transition to a sustainable world.
WFM: Water Footprint Assessment Manual. The manual covers a comprehensive set of definitions and methods for water footprint accounting. It shows how water footprints are calculated for individual processes and products, as well as for consumers, nations and busi-nesses. It includes methods for water footprint sustainability assess-ment and a library of water footprint response options.
WRI: World Resources Institute. The World Resources Institute (WRI) is a global research non-profit organization that was established in 1982. The organization’s mission is to promote environmental sustainability, economic opportunity, and human health and well-being. WRI partners with local and national governments, private companies, publicly-held corporations, and other non-profits, and offers services including global climate change issues, sustainable markets, ecosystem protection, and environmental responsible governance services.
WTI: Water Treatment Index. The Water Treatment Index is related to the impact of the water treatment activity on resources (WWTP, Wastewater Treatment Plant, iWWT, Industrial Wastewater Treatment Plant, PWTP, Potable Water Treatment Plant, and SWDF, Seawater Desalination Facilities).
169
ANNUAL INTEGRATED REPORT 2020MANAGEMENT REPORT
APPENDIXGLOSSARY TERMS - VERIFICATION REPORT
VERIFICATION REPORT
170
MANAGEMENT REPORT 2020FERROVIAL S.A. AND SUBSIDIARIES
171
ANNUAL INTEGRATED REPORT 2020MANAGEMENT REPORT
APPENDIXVERIFICATION REPORT
172
MANAGEMENT REPORT 2020FERROVIAL S.A. AND SUBSIDIARIES
173
ANNUAL INTEGRATED REPORT 2020MANAGEMENT REPORT
APPENDIXVERIFICATION REPORT