Fauquier County Farmers’ Market Feasibility Study
51
1 May 2021 911 Greenbag Road Morgantown, WV 26508 downstreamstrategies.com Fauquier County Farmers’ Market Feasibility Study Evan Fedorko Sara Cottingham Completed for the Fauquier County Agricultural Development Department
Transcript of Fauquier County Farmers’ Market Feasibility Study

1
May 2021
911 Greenbag Road Morgantown, WV 26508
downstreamstrategies.com
Fauquier County Farmers’ Market Feasibility Study
Evan Fedorko
Sara Cottingham
Completed for the Fauquier County Agricultural Development Department

2
Fauquier County Farmers’ Market Feasibility Study
EXECUTIVE SUMMARY
Like many parts of the country, Fauquier County, Virginia, has seen growing interest in and support for public farmers’ markets in recent years. The Fauquier County Agricultural Development Department commissioned Downstream Strategies to develop this feasibility study to explore the viability of three potential enhancements to farmers’ markets programming in Fauquier County:
• new traditional, public farmers’ markets, • a year-round, in-person farmers’ market, and • an online farmers’ market sales platform.
From November 2020 through April 2021, Downstream Strategies conducted comprehensive market research into the dynamics and trends of farmers’ markets regionally and nationally. The project team designed and disseminated surveys to both local producers and county residents and interviewed key stakeholders within the county’s local foods arena. This report presents the findings of this study.
Key findings
• Fauquier County’s three existing public farmers’ markets are popular and reasonably successful. None of these markets is at or near its maximum sales capacity. Managers from each of the three markets noted that these markets could grow considerably if they had additional resources (mainly staffing, marketing, and funding).
• Satisfaction is high among those who currently shop at Fauquier County’s existing public farmers’ markets. Most current customers live close to the existing markets.
• A significant number of consumers in the county are not being reached and are not aware of farmers’ markets.
• Interest in a new market is high among both consumers and producers. However, that interest is fairly limited to farmers’ markets held on weekends, which are already a highly utilized time for markets.
• The current geographic layout of markets in and around the county is such that new markets within Fauquier County are likely to cannibalize customers from existing markets.
• Despite high interest from consumers and producers, there appears to be little to no existing coordination or collaboration between existing farmers’ markets and other County entities. This is especially important for more substantive changes such as an online market and/or a permanent indoor market as these efforts would require significant coordination, leadership, and investment.
Recommendations
Fauquier County would be best served by increasing coordination, support, and resources dedicated to its existing public farmers’ markets rather than focusing on creating new markets. It should also move forward with next-level planning efforts for 1) coordinating an online market platform across the county’s existing markets, and 2) starting with a permanent, covered pavilion for the Warrenton Farmers’ Market.

3
TABLE OF CONTENTS
1. Introduction ............................................................................................................................ 5 1.1 METHODS ........................................................................................................................ 5
1.1.1 Market research ........................................................................................................... 6 1.1.2 Surveys ....................................................................................................................... 7 1.1.3 Interviews .................................................................................................................... 8
2. About Fauquier County ........................................................................................................... 9 2.1 FAUQUIER COUNTY DEMOGRAPHICS ..................................................................................... 10
3. Farmers’ market trends ........................................................................................................ 12 3.1 REGIONAL AND NATIONAL TRENDS ....................................................................................... 12 3.2 EXISTING FARMERS’ MARKETS IN FAUQUIER COUNTY ............................................................... 13 3.3 MARKET AUDIENCE ........................................................................................................... 15
3.3.1 Geography of farmers’ market shoppers ........................................................................ 16 3.4 MANAGEMENT CONSIDERATIONS ......................................................................................... 20
3.4.1 Traditional farmers’ markets ........................................................................................ 20 3.4.2 Indoor, year-round markets .......................................................................................... 21 3.4.3 Online market platforms .............................................................................................. 22
4. Supply .................................................................................................................................. 24 4.1 OVERALL ASSESSMENT: SUPPLY ....................................................................................... 28
5. Demand ................................................................................................................................ 29 5.1 OVERALL ASSESSMENT: DEMAND ...................................................................................... 34
6. Capacity ............................................................................................................................... 35 6.1 OVERALL ASSESSMENT: CAPACITY..................................................................................... 37
7. Feasibility determination and recommendations .................................................................. 38 7.1 NEW TRADITIONAL FARMERS’ MARKETS ................................................................................. 38 7.2 A YEAR-ROUND, INDOOR, IN-PERSON FARMERS’ MARKET ........................................................... 38 7.3 AN ONLINE FARMERS’ MARKET SALES PLATFORM ..................................................................... 41
References ................................................................................................................................ 42
Appendices: Survey instruments ............................................................................................... 43
TABLE OF FIGURES
Figure 1 Disposable income in Fauquier County ........................................................................... 11 Figure 2 National count of farmers' markets................................................................................. 12 Figure 3 Remington Farmers’ Market shoppers ............................................................................ 17 Figure 4 Warrenton Farmers’ Market shoppers ............................................................................. 18 Figure 5 Archwood Green Barns Farmers’ Market shoppers .......................................................... 19 Figure 6 Fauquier County farmers' market vendors by category .................................................... 24 Figure 7 Fauquier County farmers’ market vendors ...................................................................... 25 Figure 8 Producer preference when picking a new market ............................................................. 28 Figure 9 Consumers shopping at existing farmers' markets .......................................................... 29 Figure 10 Survey respondents seeking farmers’ markets closer to home ....................................... 32 Figure 11 Consumer preference for market locations .................................................................... 33

4
TABLE OF TABLES
Table 1 Data analyzed ................................................................................................................. 7 Table 2 Summary of existing farmers' markets ............................................................................. 14 Table 3 Comparison of existing markets ...................................................................................... 30

5
1. INTRODUCTION Fauquier County is currently served by several existing farmers’ markets:
• The Warrenton Farmers’ Market, organized by the Town of Warrenton, offers Saturday markets from April through November annually.
• The Archwood Green Barns Farmers’ Market, organized by The Plains Redevelopment Corporation, offers Sunday markets from May through November annually.
• The Remington Farmers’ Market, organized by the Remington Community Garden, offers an evening market event once monthly from July through December at the Remington United Methodist Church. (Currently on hold due to the pandemic.)
Like many farmers’ markets around the nation, these markets have seen a slow-but-steady increase in attendance and sales in recent years, followed by a dramatic increase in sales in 2020 due to the COVID-19 pandemic.
• The Warrenton market observed a spike in 2020 visitation and sales, with some vendors reportedly doubling their sales in 2020 from 2019 (Ortiz, 2020).
• Archwood Green Barns saw a nearly 25% increase in total sales in 2020 versus 2019 (Melson, 2021).
This increase in demand coupled with the unforeseen impacts of the pandemic have prompted the Fauquier County Agricultural Development Department to explore ways to enhance sales opportunities for local foods in both familiar and potentially new ways.
As a result, Fauquier County Agricultural Development Department hired Downstream Strategies to conduct a feasibility study to determine:
• whether there is sufficient farmer interest and commitment as well as support from citizens to develop new farmers’ markets in the county, and
• whether other enhancements such as a year-round market and/or virtual market platforms would be viable as alternatives or supplements to traditional markets given the rising demand for local foods.
To this end, this feasibility study explores the viability of three potential enhancements to farmers’ markets programming in Fauquier County:
1. additional seasonal farmers’ markets, 2. a year-round, in-person farmers’ market, and 3. an online farmers’ market sales platform.
1.1 Methods
Farmers’ markets have seen a dramatic rise in popularity nationwide in the last two decades. As markets become increasingly visible and sought-after, many places around the country are seeking
As of April 2021, two new farmers’ markets are reportedly planned to open in Marshall and Upperville in summer 2021. Given the recent announcement, these proposed markets were not included in this study’s analysis and do not change this report’s findings.

6
to start new farmers’ markets as a way to help farmers, consumers, and local economies at the same time.
Yet not all areas can support a farmers’ market, and not all farmers’ markets are successful. There is no set formula or exact science for determining whether a community can support a farmers’ market. Farmers’ markets are not necessarily tied to any particular demographic group. The matter is further complicated when one or more farmers’ markets already exist in an area, since starting new markets can hurt existing markets by siphoning off their existing customer base. In fact, a growing body of data shows that farmers’ markets are in fact declining in overall impact as new markets “cannibalize” older, existing markets (Biasillo et al., 2018; Northeast SARE, 2021; Wood, 2019).
As a result, determining the feasibility of new markets requires understanding three key dynamics within the local area as they relate to each other: demand, supply, and capacity.
• Supply: Do local producers have adequate supply, availability, and interest in selling through additional markets and sales venues?
• Demand: Is there enough consumer demand to support additional in-person and/or online market venues without undercutting existing markets’ consumer base and thus detracting from their sales?
• Capacity: Are there existing entities in the county, such as local government entities or nonprofit organizations, with both the interest and capacity to take on a new market?
Tasked with providing feasibility determinations for several potential farmers’ market opportunities, Downstream Strategies spent six months thoroughly exploring and analyzing the dynamics of demand, supply, and capacity as they pertain to farmers’ markets in Fauquier County.
Through this work, the project team collected and reviewed data from three main sources—market research, surveys, and interviews—and mapped the data to spatially analyze patterns and trends in relation to each other. Viewed in concert, the data will allow our team to evaluate whether the local market can effectively support one or more new farmers’ markets, as well as whether year-round and/or online sales platforms would be viable additions—or alternatives—to new markets.
1.1.1 Market research
First, the project team conducted comprehensive market research on county demographics, socio-economic data, population density, and consumer spending using a wide range of available data from local entities, government agencies, and data clearinghouses, as summarized below.
Warrenton Farmers' Market Facebook
7
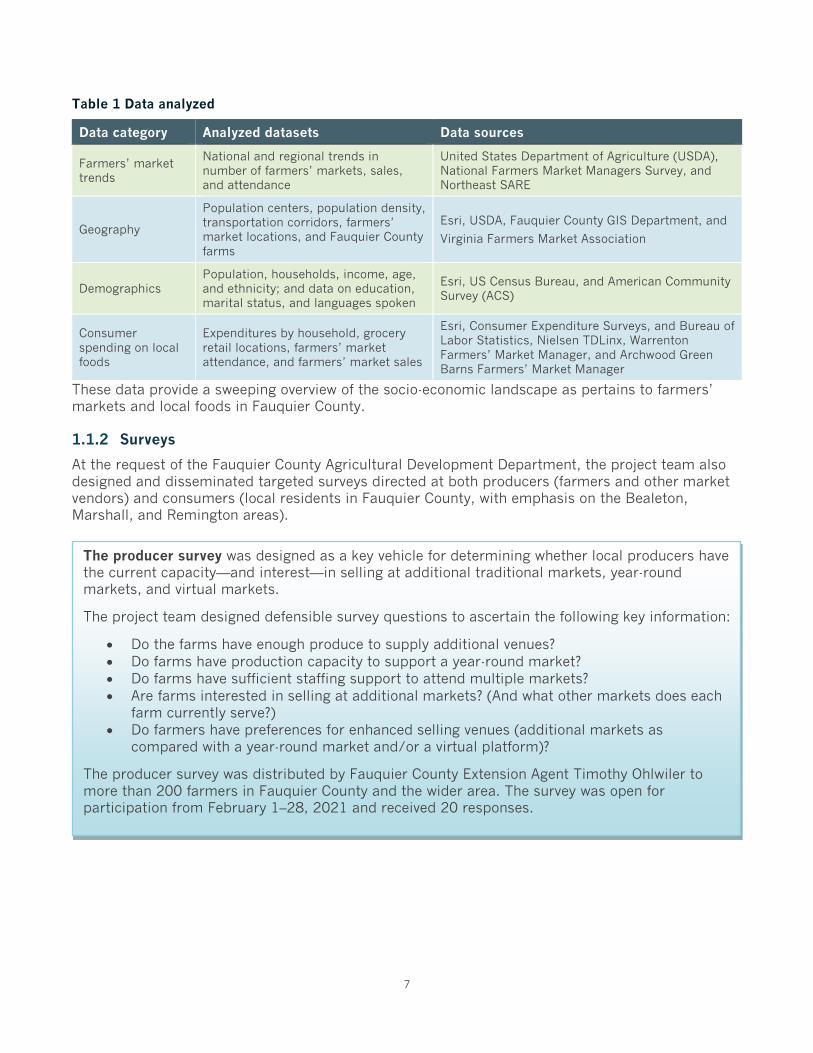
Table 1 Data analyzed
Data category Analyzed datasets Data sources
Farmers’ market trends
National and regional trends in number of farmers’ markets, sales, and attendance
United States Department of Agriculture (USDA), National Farmers Market Managers Survey, and Northeast SARE
Geography Population centers, population density, transportation corridors, farmers’ market locations, and Fauquier County farms
Esri, USDA, Fauquier County GIS Department, and Virginia Farmers Market Association
Demographics Population, households, income, age, and ethnicity; and data on education, marital status, and languages spoken
Esri, US Census Bureau, and American Community Survey (ACS)
Consumer spending on local foods
Expenditures by household, grocery retail locations, farmers’ market attendance, and farmers’ market sales
Esri, Consumer Expenditure Surveys, and Bureau of Labor Statistics, Nielsen TDLinx, Warrenton Farmers’ Market Manager, and Archwood Green Barns Farmers’ Market Manager
These data provide a sweeping overview of the socio-economic landscape as pertains to farmers’ markets and local foods in Fauquier County.
1.1.2 Surveys
At the request of the Fauquier County Agricultural Development Department, the project team also designed and disseminated targeted surveys directed at both producers (farmers and other market vendors) and consumers (local residents in Fauquier County, with emphasis on the Bealeton, Marshall, and Remington areas).
The producer survey was designed as a key vehicle for determining whether local producers have the current capacity—and interest—in selling at additional traditional markets, year-round markets, and virtual markets.
The project team designed defensible survey questions to ascertain the following key information:
• Do the farms have enough produce to supply additional venues? • Do farms have production capacity to support a year-round market? • Do farms have sufficient staffing support to attend multiple markets? • Are farms interested in selling at additional markets? (And what other markets does each
farm currently serve?) • Do farmers have preferences for enhanced selling venues (additional markets as
compared with a year-round market and/or a virtual platform)?
The producer survey was distributed by Fauquier County Extension Agent Timothy Ohlwiler to more than 200 farmers in Fauquier County and the wider area. The survey was open for participation from February 1–28, 2021 and received 20 responses.

8
To incentivize survey participation, the project team awarded $50 gift certificates to Culpeper Farmers’ Cooperative to two randomly selected participants of each survey. These were awarded to the winners in March 2021.
In total, the project team received 325 responses to the consumer survey and 20 responses to the producer survey. The results of these surveys are discussed and analyzed in the supply and demand chapters of this report. Both survey instruments are included in the Appendices.
1.1.3 Interviews
In addition, the project team conducted phone interviews with select stakeholders including:
• managers of the Warrenton, Remington, and Archwood Green Barns markets; • key local producers and vendors at these markets; • local and regional agricultural extension officials; and • the agricultural program officer at the PATH Foundation.
These interviews allowed our team to gain a nuanced understanding of the dynamics currently at play within the county’s existing markets and overall local foods arena and to fully understand the mechanisms by which current markets are supported, staffed, and funded.
The consumer survey was designed to shed light on consumer demand for various forms of additional farmers’ markets, including in-person, online, and year-round formats. The consumer surveys were used to supplement and ground truth the results of the project team’s market assessment by documenting consumer preferences from a small, targeted segment of the local population.
Specific questions were designed to target responses on the following information:
• Determine the approximate number of current shoppers at existing markets. • Estimate the number of new shoppers who would attend new markets in Bealeton,
Marshall, Remington, or another location. • Document interest and/or preference for virtual shopping opportunities. • Document interest and/or preference for a year-round market. • Document or estimate the geographic area of influence of the current markets. • Document or estimate areas within the county that may be home to underserved
consumers.
The consumer survey was open for public participation from February 1–28, 2021. It was shared online with the general public through their social media by the Fauquier County Agricultural Development Department and received 325 responses.

9
2. ABOUT FAUQUIER COUNTY Fauquier County is situated in the northeastern portion of Virginia, directly adjacent to, but just outside of, the urbanized area surrounding Washington, D.C. The county is slowly becoming a bedroom community for workers commuting to the greater D.C. metropolitan area and is growing very quickly. Like several neighboring counties, Fauquier County has experienced greater than 10% population growth since 2010, putting it among the fastest growing counties in the United States. Yet overall Fauquier County has a much lower population density than neighboring counties, especially compared to Prince William County. (U.S. Census Bureau, 2021)
Fauquier County has a strong agricultural tradition and is home to 1,154 farms which cover 216,962 acres. Unlike many parts of the nation where farms and farmland are disappearing, the total number of farms remained fairly constant in the county between the 2012 and 2017 U.S. Census of Agriculture. This is reflective of the county’s long-standing and clearly successful efforts to preserve farmland in the county. In 2017, 52% of the county’s acres were in farms, making Fauquier County a regional leader in this category, alongside Clarke (59.2%), Culpeper (51.3%), and Madison counties (52.1%). (USDA NASS, 2017)
Livestock production is the basis of agriculture in the county. According to Tim Ohlwiler, Fauquier County’s horticulture extension agent, Fauquier County maintains diverse livestock operations including cow-calf cattle farms, several beef finishing operations, and a large equine industry (Ohlwiler, 2021). The county’s equine industry is substantial: Fauquier County and neighboring Loudoun County have the top two concentrations of horses in Virginia. Fauquier County is 13th among Virginia’s 95 counties in terms of number of cattle operations with inventory and ranks below only one other county in the northern Virginia area (as defined by USDA) in that regard. The dairy industry has historically been a significant component of the county’s landscape but has experienced both local and national declines in recent years. The county is still home to the fifth-largest number of operations with milk sales in the state (18 total in the 2017 Census of Agriculture), but that number nearly halved from 31 in the 2012 Census. (USDA NASS, 2017)
Source: Raymond Whitacre

10
Commodity crop production related to the livestock industry continues to be central (the county is 17th and sixth in the state for acres of corn harvested for grain and silage, respectively), as does grazing, often via lease arrangements between operators and large landowners (Ohlwiler, 2021). With the exception of the equine industry, much of this activity is focused in the southern region of Fauquier County (USDA NASS, 2017).
In addition to the equine industry, northern Fauquier County is home to many of the county’s remaining orchards, a very old and important element of Fauquier County’s agricultural legacy. While conventional wisdom holds that many orchards in the county have folded, the number of apple orchards recorded by the USDA’s Census of Agriculture in the county has held steady from 2002 to 2017 (USDA NASS, 2017). Many of the county’s orchards date back to the very earliest days of the nation (Ohlwiler, 2021). The northern part of the county also features many grape growers and wineries, reinforcing agritourism as a key component of this part of the county’s agricultural landscape.
The county at large has seen noticeable increases in vegetable farming and other production types generally associated with surging interest in local food, such as pasture-raised chickens and locally made value-added goods (Ohlwiler, 2021). Many of these operations are quite small and focused on community-supported agriculture operations (CSAs), direct sales, and/or farmers’ markets. Growth is tangible: Per the Census of Agriculture, a mere 19 acres of fresh vegetables were harvested in 2002, but that number increased by a factor of 17 to 331 acres in 2017. (USDA NASS, 2017)
On the consumer side, Fauquier County offers a number of avenues through which residents and producers interact, including three traditional public farmers’ markets (located in Warrenton, The Plains, and Remington), numerous farm stands and “pick your own” operations, as well as a number of privately owned and operated farm stores which sell products from Fauquier County producers. The county experienced a boom cycle of interest in CSA programs, but those are now reportedly on the decline (Ohlwiler, 2021). Direct sales by producers to consumers, too, has also been pursued by producers of many stripes, including dairy farmers.
2.1 Fauquier County demographics
Fauquier County is among the wealthiest counties in the U.S., ranking 32nd out of the nation’s 3,000+ counties and county equivalents in median household income and 40th in median family income. By both measures, Fauquier County is well within the top 1% of U.S. counties and county equivalents. Fauquier County also ranks sixth in median household income among Virginia counties, but all six of those counties or county equivalents (Loudon, Fairfax, Arlington, Prince William, Stafford, and Fauquier) border one another in northeastern Virginia, adjacent to Washington, D.C. Fauquier County is the least populated county of this group, home to just over half the number of people of Stafford County, the next most populous county. (U.S. Census Bureau, 2021)
Compared to the rest of Virginia and the United States, Fauquier County is home to an older population. The largest decadal group in the county is adults aged 50–59, who make up approximately 16% of the county’s 73,383 residents. The county’s median age (42.9) is higher than the median age of Virginia as a whole (38.4) (ESRI, 2020). Like the rest of the country, the median age in Fauquier County is increasing, albeit at a slower rate than the rest of Virginia or the United States.
These demographics combine to form a population with much more disposable income than is typical across the rest of the United States, especially in the $100,000–149,000/year bracket, as shown in Figure 1 (ESRI, 2020).

11
Figure 1 Disposable income in Fauquier County
Source: ESRI Business Analyst
12
3. FARMERS’ MARKET TRENDS
3.1 Regional and national trends
Farmers’ markets are one of the most common—and visible—sales outlets for local foods, and they have become prominent fixtures in communities throughout the nation.
While farmers’ markets date back to the nation’s earliest days, their presence in American communities waned significantly in the 20th century. In 1994, fewer than 1,800 public farmers’ markets operated in the U.S. (USDA AMS, 2020)
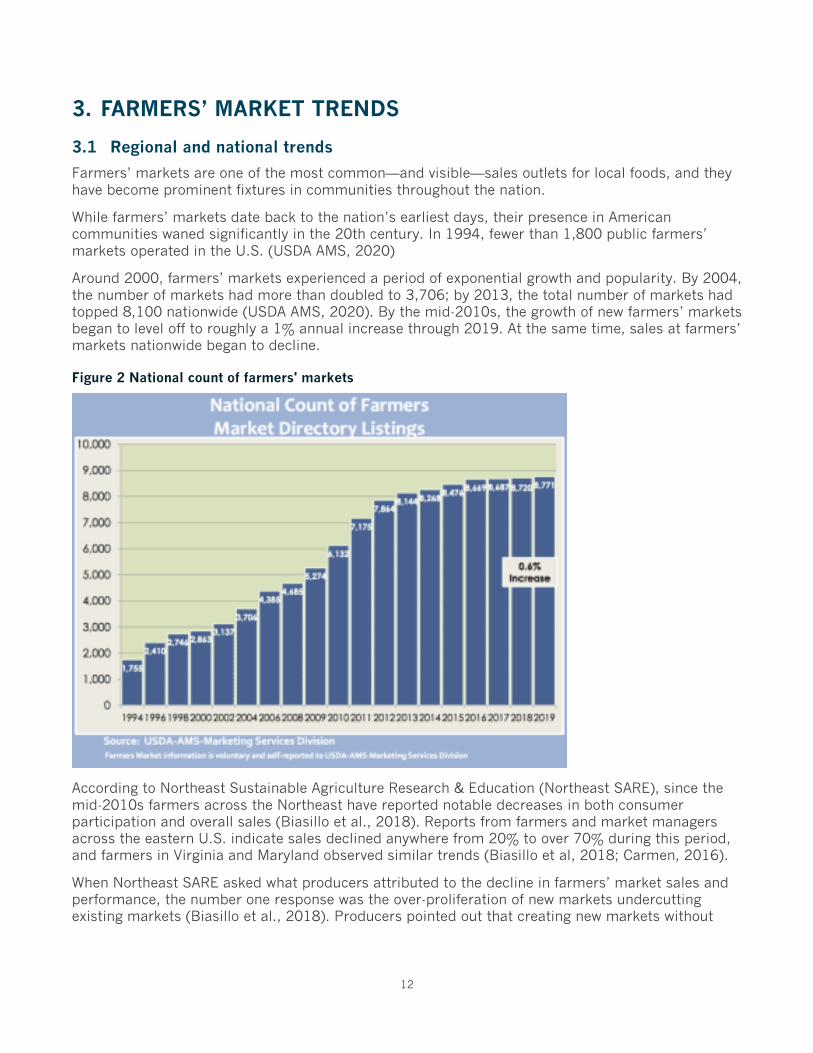
Around 2000, farmers’ markets experienced a period of exponential growth and popularity. By 2004, the number of markets had more than doubled to 3,706; by 2013, the total number of markets had topped 8,100 nationwide (USDA AMS, 2020). By the mid-2010s, the growth of new farmers’ markets began to level off to roughly a 1% annual increase through 2019. At the same time, sales at farmers’ markets nationwide began to decline.
Figure 2 National count of farmers' markets
According to Northeast Sustainable Agriculture Research & Education (Northeast SARE), since the mid-2010s farmers across the Northeast have reported notable decreases in both consumer participation and overall sales (Biasillo et al., 2018). Reports from farmers and market managers across the eastern U.S. indicate sales declined anywhere from 20% to over 70% during this period, and farmers in Virginia and Maryland observed similar trends (Biasillo et al, 2018; Carmen, 2016).
When Northeast SARE asked what producers attributed to the decline in farmers’ market sales and performance, the number one response was the over-proliferation of new markets undercutting existing markets (Biasillo et al., 2018). Producers pointed out that creating new markets without

13
adequate consideration for local supply and demand was in fact hurting the existing farmers’ markets and limiting the overall sales potential for farmers’ markets in the greater area.
This is not to say that farmers’ markets are no longer successful: In fact, the average daily spending at farmers’ markets in the United States ($14,547 per market in 2019) is indeed significant and incredibly important for many local producers nationwide (USDA NASS, 2020). However, the data underscores that:
1. farmers’ markets were trending down through the end of 2019, and 2. the exponential growth of new farmers’ markets was unsustainable.
Despite this, in 2020, the COVID-19 pandemic radically altered the demand for farmers’ markets and local food in general. As many across the nation sought to avoid traditional grocery stores (and weaknesses in global supply chains were revealed), interest in obtaining food from local producers once again skyrocketed, and reports from across the country indicate surging demand for CSA shares and farmers’ market produce.
As of early 2021, however, much of the data on the pandemic’s impacts to farmers’ markets remains anecdotal. The USDA is currently gathering data for its 2020 National Farmers Market Manager Survey, which will be released in November of this year. Many farmers’ markets across the nation—particularly those with systems for online ordering and scheduling pickup—saw a dramatic uptick in market attendance and sales in 2020. Yet many other markets without such systems were forced to close in 2020 in order to meet public health and safety guidelines during the pandemic. The experience of Fauquier County’s three public farmers’ markets matched both of these reported trends, as detailed in the following section.
3.2 Existing farmers’ markets in Fauquier County
Fauquier County is currently served by several existing farmers’ markets.1
The Warrenton Farmers’ Market is an open-air, outdoor farmers’ market organized by the Town of Warrenton. Located in a parking lot in downtown Warrenton, the market is open Saturday mornings and Wednesday evenings from April through November annually. It also piloted a winter market in January, February, and March 2021.
The oldest and largest of Fauquier County’s public farmers’ markets, the Warrenton market features around 34 vendors/producers (approximately half from Fauquier County and half from other counties) and pulls 300–500 people per market day, who come from the local community and other parts of the county. While the market has only been formally tracking performance for the last two years, manager Natalie Ortiz reported steady increases over time until 2020, when attendance surged as more people were compelled to shop locally (Ortiz, 2020).
1 As of April 2021, when this report was finalized, two additional markets had been proposed in Upperville and Marshall. These proposed markets fell outside this study’s analysis.

14
The Archwood Green Barns Farmers’ Market is organized by The Plains Redevelopment Corporation, which offers Sunday markets from May through November annually. The defining characteristic of this market is its location: Unlike Warrenton and Remington, Archwood Green Barns is a drive-up market located away from residential areas, directly adjacent to a major highway (Interstate 66). For this reason, approximately half of the market’s 400 visitors per week are tourists.
The Remington Farmers’ Market is organized by the Remington Community Garden, which offers an evening market event once monthly from July through December at the Remington United Methodist Church. Located near the center Remington, this market is Fauquier County’s newest and smallest, yet it has seen an incredible rise in popularity within a short period of time. Founded in 2019, this market sees roughly 250 visitors per market day, most of whom come from the local area. The market was strategically scheduled for Saturday afternoons after the Warrenton market closes in order to provide vendors with an opportunity to move unsold goods. The Remington market closed temporarily in 2020 due to the pandemic.
Table 2 Summary of existing farmers' markets
Category Warrenton Archwood Green Barns Remington
Sponsor Town of Warrenton The Plains Redevelopment Corporation
Remington Community Garden
Year founded 1975 1999 2019
Location A parking lot on Main Street in Warrenton
Archwood Green Barns (The Plains)
Remington United Methodist Church parking lot
Operating hours
Sat. 8–12 + Wed. 8–12
April–November
Sun. 10–2
May–November
1 Sat. per month, 4–7pm
July–December
Warrenton Farmers' Market (Facebook)

15
3.3 Market audience
Profiling shoppers most likely to purchase at farmers’ markets (or similar venues) is an inexact science and likely varies widely depending on geography. The only sure way to understand the demographic of a particular market is to survey or study the customers of that market. The 2019 National Farmers Market Managers Survey found that only 25% of markets surveyed or studied their customers, and very few (if any) of those studies involved demographic profiling of shoppers (USDA NASS, 2020). Nonetheless, some studies have attempted to answer this question and pairing those with demographic information for the regions surrounding Fauquier County’s markets yields broad conclusions about farmers’ market shoppers.
Byker et al. (2012) summarized findings of several farmers’ market consumer studies in order to identify commonalities. These findings are very broad and, not surprisingly, inconsistent. The strongest findings are that farmers’ market shoppers tend to be female and over 40 years of age on average. Several studies found an average household income of $50,000 for farmers’ market shoppers, but conclusions vary widely on this point with several studies suggesting that household income is a poor predictor. At least one study identified a positive relationship between per capita income and farmers’ market sales in a corresponding geography. One of the strongest findings of Byker’s study is that demographics may not be the strongest indicator of preference of farmers’ markets compared to more nebulous lifestyle preferences such as cooking at home, church attendance, or gardening. (Byker et al., 2012)
Overall, most studies have found that demographics of farmers’ market shoppers do not vary significantly from the demographics of supermarket shoppers in the same or similar geography. This suggests that in those areas where farmers’ markets are present or seeking to locate, the most important factors for success are more in line with standard business planning questions (location, for example) and operational issues such as advertising and management.
Archwood Green Barns Market (Facebook)

16
This feasibility study did endeavor to provide clarifying information about the audience of Fauquier County’s markets, and surveys and interviews built a more complete picture of the local market scene. Our survey instruments reveal little about the demographics of shoppers (nor was that the aim), but the results do allow some relevant observations about operational issues and where gaps and opportunities exist.
3.3.1 Geography of farmers’ market shoppers
According to survey results and data from the managers of Fauquier County’s three existing markets, attendance at these markets can broadly be categorized as follows:
• The Warrenton Farmers’ Market draws 300–500 people per market day, pulling people from across and outside the county. Most of these shoppers are very local, but the Warrenton market has the largest geographic reach, per survey results.
• The Archwood Green Barns Market averages 400 adults per market day. The market manager characterized these visitors as roughly half local and half non-local tourists; however, survey findings suggest that the core of this market’s local shoppers are from the Marshall area.
• The Remington Farmers’ Market draws 200–250 people per market day. The customer base is hyper-local, with many from Warrenton and Culpeper.
Both the Warrenton and Archwood Green Barns markets see a similar level of visitors per week, with the Remington market hosting roughly half that number. Impressions from the market managers provided a strong sense of where customers originate from (mostly very local except for Archwood’s tourism traffic), but the survey instrument collected other insights from customers. Significantly, survey responses and market manager insights aligned very well; in other words, Fauquier County’s market managers are doing a good job in understanding their customers.
The maps on the following pages depict shoppers’ areas of origin (by zip code) for each of the county’s three existing public farmers’ markets. The results show that a notable portion of each market’s shoppers live quite close to the market itself, though the two larger markets have correspondingly larger service areas. This aligns with broader research across farmers’ markets nationwide: Research from Pennsylvania State University’s Extension Service and others suggest that most farmers’ market shoppers live within five miles of the market (Moyer, 2021).
Interestingly, these three markets are, as the crow flies, nearly equidistant in a line from one another. (Remington is roughly 16 miles from Warrenton, and Warrenton is approximately 13 miles from The Plains.) Assuming each market’s core shoppers come from within a five-mile radius, these circles would cover much of Fauquier County’s most populous areas.

17
Figure 3 Remington Farmers’ Market shoppers

18
Figure 4 Warrenton Farmers’ Market shoppers

19
Figure 5 Archwood Green Barns Farmers’ Market shoppers

20
3.4 Management considerations
This feasibility assessment is broadly concerned with establishing a new farmers’ market of three possible types: a once-per-week traditional farmers’ market, an online farmers’ market, or a year-round, indoor farmers’ market. Each of these markets has its own structure, staffing and logistics requirements, needed investments, and important planning considerations.
Not surprisingly, no matter the style of farmers’ market being discussed, the similarities outweigh the differences. A number of planning and management considerations are common to all markets.
3.4.1 Traditional farmers’ markets
The tradition style of market is most familiar to Fauquier County as the county currently hosts three markets of this type. It is also the most common style of market in the United States.
Traditional farmers’ markets are typically open one-to-two days per week (most frequently on Saturdays) and generally for a short time window (four-to-six hours). In the United States, most markets are open May–October to take advantage of warmer weather. Vendors typically pay a small fee to the market to secure space, and the market may take some percentage of each vendor’s sales. Markets vary widely in management structure, but a traditional farmers’ market will generally have at least one person responsible for managing the market’s operation. In 2019, across all types of farmers’ markets, 92% of markets had a manager, and 57% of those markets had a paid manager position (USDA NASS, 2020).
Traditional farmers’ markets are often sponsored by an organization or entity that either directly serves farmers and producers (such as an agricultural extension service) or has goals that are well-aligned with those of a farmers’ market (such as a Main Street organization or municipal government). The host organization acts as a direct fiscal sponsor and often helps secure grants and other funding to support the market. The host entity also typically provides informal capital such as market-day volunteers, meeting space, and administrative overhead for handling low-level business that the market manager is likely to engage in, such as purchasing advertisements or supplies for the market day or implementing Supplemental Nutrition Assistance Program (SNAP) sales.
Location is the most important concern for a traditional farmers’ market. The location should be highly visible, accessible to both people who are driving and walking, and appropriately sized for the number of vendors and customers. More importantly, but more difficult to define, the market location itself should be aesthetically appealing; in other words, it should be a location where customers want to be.
While markets often locate in parking lots due to the ample space available, consumers often report that these locations are undesirable, especially in the summer when they can be much hotter than the surrounding area. Many respondents noted that the shifting location of the Warrenton Farmers’ Market was perceived as a downside of that market, which likely reduced foot traffic; this drives home the importance of a consistent marketing location (and operating hours), as well.
Beyond a pleasant, consistent, and accessible location, traditional farmers’ markets typically utilize small amounts of infrastructure, such as trash cans, recycling bins, and table rope barriers for marking off vendor locations. Tables and booth setups are usually provided by the vendors themselves. Markets that accept SNAP and Electronic Benefit Transfer (EBT) will also require a market-managed space and personnel to conduct those transactions. Optionally, markets may also own and use a small public address system for the purpose of hosting entertainment on market days.

21
In many cases when a traditional market has matured, it seeks a more permanent shelter to house the market long-term and extend the market’s operating season. This can take several forms:
• Some outdoor, seasonal markets find an indoor space to continue operations during the winter months.
• Some traditional markets opt to build or locate in a durable structure—often a covered, open-air pavilion or an actual building—to provide a permanent home for the market that shelters vendors and visitors from the elements.
• Still other markets take a hybrid approach in which they feature an indoor space for some vendors (often prepared food/restaurant vendors) along with outdoor, open-air space for other vendors. (The Archwood Green Barns Market follows this model.)
While these sheltered and hybrid markets come in a variety of shapes, sizes, and configurations, a few notable examples of such markets stand out:
• Harrisonburg Farmers Market (Harrisonburg, VA, harrisonburgfarmersmarket.com/about) The Harrisonburg Farmers Market is a traditional farmers’ market housed in a pavilion built in 2008 as a permanent home for the market. Open Tuesday and Saturday mornings from April through December, its covered, open-air structure lends itself to both sunny- and rainy-day shopping.
• Ithaca Farmers Market (Ithaca, NY, ithacamarket.com) The Ithaca Farmers Market is a member-run cooperative of vendors located within 30 miles of Ithaca, New York. On Saturdays and Sundays from April through December, the market is held in a covered, lakefront pavilion that doubles as a special event venue. Then, from January through March, the market is held in an indoor space.
3.4.2 Indoor, year-round markets
If traditional outdoor, seasonal markets fall on one end of the infrastructure spectrum, indoor farmers’ markets fall at the opposite end. Such markets are generally open year-round and operate on a more frequent basis (often daily) than a once-weekly traditional market.
In addition to many of the requirements for traditional farmers’ markets, a fixed building brings with it extra management needs such as building maintenance, janitorial and custodial services, and, depending on the built interior infrastructure, other, more specialized services. These needs may necessitate a facilities manager as a full-time employee of the market.
Notable indoor markets include:
• Lancaster Central Market (Lancaster, PA, centralmarketlancaster.com) Known as the oldest continuously operated farmers’ market in the country, the Lancaster Central Market was established in 1730. Located in the historic, City-owned Market House, the market is open from 6am to 3pm three days per week (Tuesdays, Fridays, and Saturdays) and features more than 60 local vendors. It has become a destination whose visitors come for the food, history, architecture, and the Amish culture.
• Reading Terminal Market (Philadelphia, PA, https://readingterminalmarket.org/) Founded in 1893, the Reading Terminal Market is one of the nation’s most successful public markets. Open seven days per week in downtown Philadelphia, this indoor market features more than 75 independent small businesses that offer an array of fresh and prepared foods, lunch counters, and places to eat and shop.

22
3.4.3 Online market platforms
A third category of farmers’ markets explored in this feasibility study are online markets. In light of the COVID-19 pandemic, most existing farmers’ markets are seeking online sales platforms through which customers can purchase goods online which will then be prepared for pickup at a designated time and location.
For the purpose of this assessment, “online farmers’ markets” refers to a market model that repeats the following process on a weekly basis:
• Market vendors list products for sale via a shared web platform. • Consumers select and pay for those goods via a web-based storefront over a two-to-three-day
period. • Producers package and label those products and deliver them to a predetermined location. • At each pickup location, farmers’ market staff assemble the final orders. • Customers pick up those products. • The market manager(s) pay out to the producers, generally retaining a 20–30% markup on
each sale.
This process implies a number of important logistic requirements, many of which would typically fall under the purview of a market manager. The first and most obvious distinct need of an online is a software platform. Numerous commercial software packages exist for just this purpose.
Prominent platforms for online farmers’ markets include:
• Lulus Local Food (luluslocalfood.net) is an e-commerce platform for farms, farmers’ markets, food hubs, and CSAs. The Lulus Local Food platform is supported by the Virginia Foundation for Agriculture, Innovation, and Rural Sustainability (VA FAIRS) in partnership with the Virginia Farm Bureau Federation and is supported by the USDA. It is also now used by the Loudoun Valley Homegrown Market Cooperative.
• Food4All (food4all.com/sell-food-online-csa-software) offers a number of products, including an online marketplace platform specifically designed for farmers’ markets. Food4All offers farmers accounts that expedite direct sales and utilize place-based searching to match customers with nearby producers, and, unique among offerings mentioned here, these accounts can be easily integrated into their farmers’ market interface. In this way, the Food4All platform offers a wider slate of services for users.
• Local Food Marketplace (LFM) (home.localfoodmarketplace.com) is a web-based software platform for online farmers’ markets and food hubs. LFM offers multiple tiers of services and addon packages, starting from a basic farmers’ market sales system that allows producers to log in and manage their own inventory. LFM also offers integration with many point-of-sale (POS) systems and relatively advanced back end logistics for managing aggregation and distribution of products. The web front end for an online farmers’ market can be branded and customized, and LFM offers various capabilities for promotion through tools such as email marketing, upselling, gift certificates, and discount codes.
The second distinct category of needs for online farmers’ markets includes various logistical elements such as drop-off locations that are at least temperature-controlled to room temperature, as well as a system for assembling final orders and organizing them in such a way that pickup is expedited. Temperature-controlled space may extend beyond room temperature into cold storage and/or freezer space if products require it.
Lastly, this type of market has several other implied logistical needs, most of which would be embodied by a standards and practices guide for vendors of the market. A guide of this type is vital for consistent labeling, consistent packaging, clear and well-coordinated schedules, and other

23
logistical elements unique to an online farmers’ market. Most software packages will include tools to aid in implementing these standards, but ultimately a market manager will be responsible for enforcing them.

24
4. SUPPLY A key component of this feasibility study is to understand the opinions and preferences of Fauquier County’s producers about current and future farmers’ markets. The following sections summarize answers to key questions undergirding producer supply and interest in expanding farmers’ market opportunities.
Who are the producers?
As noted earlier, Fauquier County has a strong agricultural tradition and is home to 1,154 farms, though the majority of these are not farm operations with sales (USDA NASS, 2017). The Fauquier County Agricultural Development Department maintains a list of more than 200 producers with commercial operations in Fauquier County, yet only seven of those producers currently sell at the county’s public farmers’ markets.
Fauquier County’s three existing farmers’ markets currently feature a total of 64 vendors. Twenty-four of those vendors are located within Fauquier County; the remaining 40 (62%) are located outside of the county.
Figure 6 Fauquier County farmers' market vendors by category
The project team disseminated the producer survey to more than 200 producers in and around Fauquier County. Twenty producers responded to the survey, and of those, 10 currently sell at Fauquier County farmers’ markets (2 producers sell at farmers’ markets outside the county).

25
Figure 7 Fauquier County farmers’ market vendors
While these vendors sell a wide range of product offerings, as shown in Figure 7, the total spread skews towards those selling value-added and health and beauty products. Of the 24 vendors located within Fauquier County, 17 are non-farm entities that sell product categories other than fresh produce, meats, and honey. This means the bulk of farm-direct products sold at Fauquier County markets originate from outside the county.
The spread of vendors indicates a good diversity of products sold, though market managers should frequently check in with their customer base to ensure that the slate of products is meeting customer needs.

26
Are vendors looking for more sales outlets?
All sources indicate that producers and farmers’ market vendors in particular hope to expand into more and/or additional sales outlets.
In surveys and interviews, producers are almost unanimously interested in new market opportunities, no matter the form, and they view the county as fertile ground for expansion. According to the producer survey, 55% of respondents plan to expand into new farmers’ markets or other direct-to-consumer venues in 2021. An additional 30% were unsure, whereas only 15% replied that they would not expand into new outlets in the coming year.
One interesting finding from both interviews and surveys is that very few of the farmers’ market sellers interact with the county’s private markets (Messick’s Farm Market and Buckland Farm Market), indicating that, as far as direct retail sales, the county’s farmers’ markets are filling a vital niche for these producers. Thirteen of the 20 producers surveyed do engage in some form of direct-to-consumer sales (business website, pick your own, CSA, etc.), but all these producers sell at farmers’ markets, again underscoring the vital role that the markets play in the economy for producers.
Not surprisingly, producers across the board are interested in increasing sales. Interviews with the managers of the county’s existing farmers’ markets also indicated that current vendors have the capacity for increased sales and are generally interested in new opportunities to sell their products (Melson, 2020; Ortiz, 2020). Survey responses on the question of new sales outlets (indoor market, traditional outdoor market, and online sales platform) were strongly positive, with a new traditional market and online sales platform both checking in at 70% “yes” and a new indoor market receiving a “yes” from 60% of respondents.
How do vendors view and perform at farmers’ markets?
Overall, Fauquier County producers feel positive about the county and its markets. Nearly three-quarters (74%) of producer survey respondents thought Fauquier County is a good location for a new farmers’ market or other retail opportunity. Over 61% saw the overall demand for their products increase in 2020 as compared to 2019. And, of surveyed producers who sell at farmers’ markets, two-thirds reported revenue increases in 2020.
The producer survey results indicate that producers strongly favor the Warrenton Farmers’ Market and view Warrenton as the best location for future expansion. However, given the producer survey’s relatively low response rate, it is difficult to say whether this is the result of sampling error/bias, or whether Warrenton is truly viewed in this way by producers. Warrenton is, of course, the county’s largest town and is likely the most popular destination for commuters traveling in or to the county. That said, both the Archwood Green Barns and Remington markets have fairly comparable visitor numbers, suggesting that producers are undervaluing these markets as potential outlets.
However, managers of the Warrenton and Archwood Green Barns markets both confirmed that their producers very rarely sell to capacity at their markets. According to Warrenton manager Natalie Ortiz, the only vendors at the Warrenton market who come close to selling out are smaller vendors with limited resources and production capacity. “When I see vendors leaving [the market] with empty tables, I’ll know they’re nearing capacity,” said Ortiz. “And we’re not there yet.” (Ortiz, 2020)
Anecdotally, there is a belief within the county that some significant portion of farmers’ market–focused producers are opting to pursue market opportunities within the greater Washington, D.C. area. Quantifying the degree that this occurs in the county is beyond the scope of this study, but data and interviews do suggest that this is a valid observation and that a deeper examination of this phenomenon is merited. Just over half of producer survey respondents (10 of 19) sell at one or more

27
Fauquier County farmers’ markets. Six respondents (five of whom also sell within Fauquier County) reported selling at other markets located outside of the county, naming 10 unique markets in the process. A key strategy going forward will be to 1) better understand to what extent Fauquier County producers are leaving the county to sell, and 2) work to actively recruit those producers into their home markets.
Do vendors support the idea of more farmers’ market opportunities?
Though few vendors are selling at capacity at existing farmers’ markets, the concept of new market opportunities is strongly favorable among existing farmers’ market vendors.
Vendors at the Warrenton market advocated strongly for a winter farmers’ market, which the market undertook in early 2021 for the first time (Ortiz, 2020). Archwood Green Barns’ manager Elizabeth Melson reports that her vendors often ask for expanded market opportunities at the venue, either in the form of a second market day or a year-round market (Melson, 2020). Similarly, many vendors at the Remington market have expressed interest in coming twice instead of once per month (Waldeck, 2020).
Melson cautions that while some vendors are very vocal in their desire to attend additional markets, not all vendors have the ability or desire to produce year-round; in fact, some enjoy having the winter months off (Melson, 2020). Yet by and large, both the Warrenton and Archwood Green Barns managers agree that their vendors would like to see more farmers’ market opportunities.
What do vendors look for in a market?
The producer survey and interviews revealed some important takeaways about the county’s markets from the perspective of producers, including perceptions that will inform future planning.
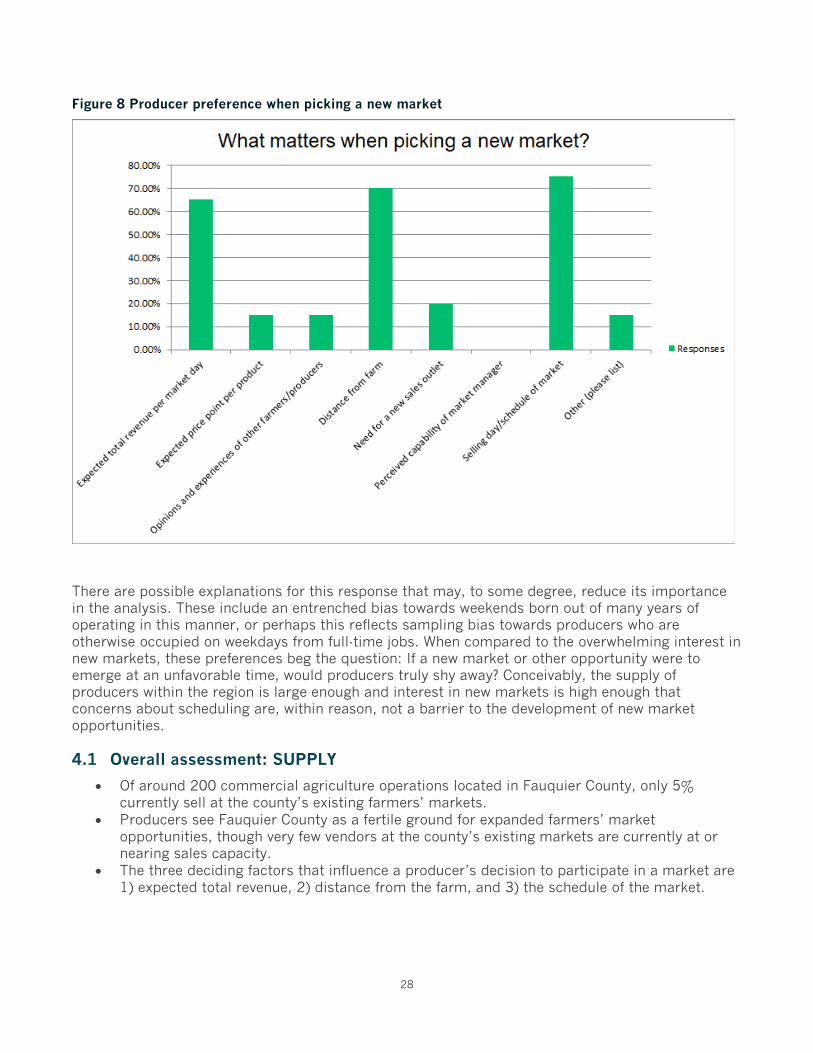
As Figure 8 makes clear, producers favor three things above all others when choosing a new market: expected total revenue, distance from farm, and the schedule of the market. Given the density of producers in and around the county, Fauquier County is well positioned to recruit producers based on proximity, which leaves revenue expectations and schedules as proverbial nuts to crack with the goal of expanding the county’s markets.
When surveyed on preference for day and time of farmers’ markets, weekends were the most popular timeslots chosen by producers. The survey asked producers to rank times and the top four times chosen are all weekends (Saturday 9am to 12pm, Saturday 12pm to 4pm, Sunday 9am to 12pm, Sunday 12pm to 4pm). The most popular weekday choice was Weekdays 10am to 1pm, but popularity of subsequent choices falls off beyond this point, with time slots from 4pm to 7pm being particularly unpopular. This response generally reflects the operating patterns of farmers’ markets nationally: 63% of markets are open on Saturday or Sunday in the United States. This preference, however, does present an obvious conflict with existing markets, all of which are open on Saturday or Sunday.
28
Figure 8 Producer preference when picking a new market
There are possible explanations for this response that may, to some degree, reduce its importance in the analysis. These include an entrenched bias towards weekends born out of many years of operating in this manner, or perhaps this reflects sampling bias towards producers who are otherwise occupied on weekdays from full-time jobs. When compared to the overwhelming interest in new markets, these preferences beg the question: If a new market or other opportunity were to emerge at an unfavorable time, would producers truly shy away? Conceivably, the supply of producers within the region is large enough and interest in new markets is high enough that concerns about scheduling are, within reason, not a barrier to the development of new market opportunities.
4.1 Overall assessment: SUPPLY
• Of around 200 commercial agriculture operations located in Fauquier County, only 5% currently sell at the county’s existing farmers’ markets.
• Producers see Fauquier County as a fertile ground for expanded farmers’ market opportunities, though very few vendors at the county’s existing markets are currently at or nearing sales capacity.
• The three deciding factors that influence a producer’s decision to participate in a market are 1) expected total revenue, 2) distance from the farm, and 3) the schedule of the market.
29
5. DEMAND Is there enough consumer demand to support additional in-person and/or online market venues without undercutting existing markets’ consumer base and thus detracting from their sales? The following section examines key aspects of consumer demand and support for farmers’ market programming.
Are consumers interested in farmers’ markets and local foods?
All sources indicate that Fauquier County has a strong market for local foods. Fauquier County’s existing farmers’ markets are all well attended and well received. During the peak farmers’ market season (typically August and September), more than one thousand people visit the Warrenton and Archwood Green Barns markets each week, with another 350 visiting Remington’s once-monthly market.
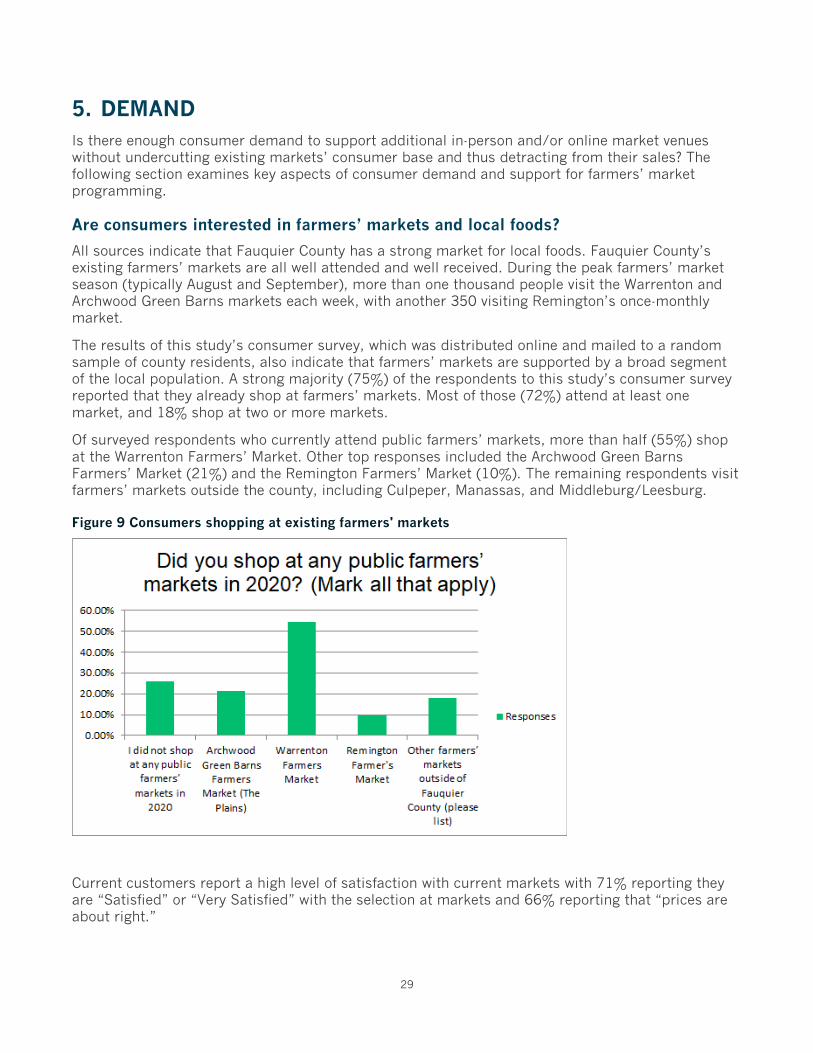
The results of this study’s consumer survey, which was distributed online and mailed to a random sample of county residents, also indicate that farmers’ markets are supported by a broad segment of the local population. A strong majority (75%) of the respondents to this study’s consumer survey reported that they already shop at farmers’ markets. Most of those (72%) attend at least one market, and 18% shop at two or more markets.
Of surveyed respondents who currently attend public farmers’ markets, more than half (55%) shop at the Warrenton Farmers’ Market. Other top responses included the Archwood Green Barns Farmers’ Market (21%) and the Remington Farmers’ Market (10%). The remaining respondents visit farmers’ markets outside the county, including Culpeper, Manassas, and Middleburg/Leesburg.
Figure 9 Consumers shopping at existing farmers' markets
Current customers report a high level of satisfaction with current markets with 71% reporting they are “Satisfied” or “Very Satisfied” with the selection at markets and 66% reporting that “prices are about right.”

30
How have Fauquier County farmers’ markets performed in recent years?
The county’s two long-standing farmers’ markets, Warrenton and Archwood Green Barns, have seen steady increases in overall visitation and sales over the last few years, followed by an exponential surge in 2020. This tracks with regional and national trends of increased farmers’ market sales during the pandemic and with surveyed reports of increased producer earnings in 2020.
Table 3 Comparison of existing markets
Category Warrenton Archwood Green Barns Remington
Sponsor Town of Warrenton The Plains Redevelopment Corporation
Remington Community Garden
Year founded 1975 1999 2019
Location A parking lot on Main Street in Warrenton
Archwood Green Barns (The Plains)
Remington United Methodist Church parking lot
Operating hours
Saturdays 8–12 and Wednesdays 8–12, April–November
Sundays 10–2pm, May–November One Saturday per month, 4–7pm, July–December
Visitors 300–500 per day. Mostly Warrenton, with some from other parts of the county
400 adults per day (525 peak). 50% local, 50% tourists
200–250 per day. Southern end of the county, between Warrenton and Culpeper
Vendors 34 vendors. 50% from Fauquier, 50% other counties
19–29 vendors. 75% from Fauquier and surrounding counties
10–35 vendors (20 on average). Mostly very local
Avg sales 2 biggest producers: $2,600–3,000/week. Next biggest: $1,800/week
2020 total season sales: $368,900 (Peak sales: $18,000 on 9/20/20)
Unknown
Trends
Steady increase over last few years, then an explosive increase in 2020 due to COVID-19
Steady growth, but 2020 saw 25% in total sales, attributed to both COVID-19 and to increased marketing
Relatively new market. Grew very fast, but then had to close down temporarily
Are vendors selling out?
No. Most are not leaving with empty tables. (Only the very small ones are)
No. They also have space for many more vendors
Unclear
Is the market at capacity?
No. It could grow with additional resources and support
No. It could grow with additional resources and support
No. It could grow with additional resources and support
According to Warrenton manager Natalie Ortiz, “Warrenton has seen a steady increase over the last few years. Then [in 2020] there was an explosion as people were forced to shop locally.” For example, Starstead Farm, the Warrenton market’s smallest organic produce vendor, nearly doubled their per-market sales in 2020. (Ortiz, 2020)
A clear majority of consumer survey respondents spent the same (28%) or more (44%) money at farmers’ markets in 2020 as compared to 2019.

31
Likewise, Archwood manager Elizabeth Melson noted that the market’s sales had been trending upward in recent years, though 2020 brought the market’s best sales performance ever. Archwood vendors saw a nearly 25% increase in total sales in 2020 versus 2019. While the pandemic played an undeniable role in this increase, Melson also pointed out that the Archwood market doubled its marketing budget in 2020, which helped boost the market’s visibility and attendance. (Melson, 2020)
As noted in Section 4, however, even amidst a record-setting sales year, the Warrenton and Archwood managers reported that current demand is still significantly below the capacity of their respective vendors, and that these existing markets still have significant room to grow. According to Elizabeth Melson, the Archwood Green Barns market broke even for the first time in 2019 and still “has huge untapped potential” (Melson, 2020).
What about those who do not currently shop at farmers’ markets?
Of the 25% of survey respondents who do not shop at farmers’ markets, most indicated that they already get their local food needs met elsewhere: 61% of survey respondents purchase local products directly from farms, and another 28% shop at private markets that sell local products.
In addition, 40 of the 77 respondents who did not shop at farmers’ markets in 2020 listed the COVID-19 pandemic as their primary reason. This indicates that a high percentage of respondents shopped at farmers’ markets before the pandemic.
Interestingly, 74% of consumer survey respondents said that they would be more likely to shop at a public farmers’ market in Fauquier County if one was located closer to their home. However, as shown in Figure 10, the majority of those respondents already live within close proximity to one of the county’s three existing markets. This suggests that consumers remain largely unaware of nearby markets, or that existing markets have accessibility issues.
Unlike the Warrenton and Archwood Green Barns markets, each of which has operated for several decades, the Remington Farmers’ Market formed in 2019 and has only operated for two complete seasons. In that short time, the Remington market has seen dramatic growth in attendance and popularity. Before it closed temporarily due to the pandemic, the Remington market was attracting 200–250 people per market day, which is strong performance for such a new market. (By comparison, the Warrenton and Archwood markets, which have operated since 1975 and 1999, respectively, and have paid staff coordination, attract around 500 people per market day at peak season.) (Waldeck, 2020).

32
Figure 10 Survey respondents seeking farmers’ markets closer to home

33
What locations do consumers prefer for farmers’ market locations?
When asked to select the locations that would be most convenient for shopping at a public farmers’ market, the top locations chosen by consumers were Warrenton (33%), Marshall (24%), Bealeton (19%), and Remington (13%).
Warrenton and Remington are already served by existing farmers’ markets. Marshall is located five miles west of The Plains, and Bealeton is located five miles northeast of Remington. As noted in Section 3.1, most farmers’ markets pull customers heavily from a five-mile radius. This suggests the county’s three existing farmers’ markets are located in the most desirable parts of the county, and that each of consumers’ top locations is already served by existing farmers’ markets.
Figure 11 Consumer preference for market locations
In addition, several key stakeholders interviewed in this study shared opinions on optimum locations for farmers’ markets in Fauquier County. The southern end of the county (particularly the fast-growing Bealeton area) was the most frequently cited area in interviews as ideal for additional farmers’ market opportunities. Others mentioned Marshall and the other higher-density areas in the northern end of the county as good locations given the strong potential customer base and existing food access issues.
Yet as noted in Section 3.1, cannibalizing of customers and dilution of market traffic are key issues that often arise when new markets form too close to existing markets. Since Fauquier County already has good farmers’ market coverage in the most desirable areas, local leaders should proceed with caution in forming new markets, as those have strong potential to undercut the county’s existing markets.
How do consumers view online farmers’ markets/ordering platforms?
Reception for an online farmers’ market was less enthusiastic from consumers than from producers (48% of consumers saying “yes,” compared to 70% of producers), but did include a sizable number of respondents who are “not sure” about an online market (28%). That said, one of the primary challenges to new market opportunities in the county appears to be temporal in nature, as interest

34
in farmers’ markets among both producers and consumers is highly weekend centric. An online farmers’ market is unique in that “shopping” for products has a much lower time requirement than visiting an in-person market, while receipt of those products can still take place during weekend hours, if desired. A market of this type has the potential to expand the customer base, as well; among survey respondents who noted they do not shop at farmers’ markets, 38% reported they would be interested in an online farmers’ market.
5.1 Overall assessment: DEMAND
• Existing markets are very popular, and demand for farmers’ markets is strong. • Despite this popularity, none of the existing markets is currently selling to their capacity. • The locations of the county’s existing markets match consumer preferences and provide good
coverage to the county. • Creating new markets, particularly in areas already served by markets, is an exercise that
should be taken with great care in order to minimize overlap in service areas as farmers’ market saturation tends to have a litany of negative impacts.
• An online farmers’ market has the potential to mitigate issues associated with new markets intruding on one another while still expanding the customer base.

35
6. CAPACITY The final analysis section of this study examines organizational capacity—that of Fauquier County’s existing farmers’ markets and of other entities with the interest and ability to organize and manage new farmers’ market opportunities.
Are the county’s existing markets at operating capacity?
Interviews with the managers of each of the three existing Fauquier County farmers’ markets revealed that, from an organizational standpoint, each market has grown about as big as it can given existing resources. According to Natalie Ortiz of the Warrenton market, “As a community partner, we’re probably at capacity for the number of opportunities and events we can manage [without additional funding/resources]” (Ortiz, 2020).
However, each market said they could significantly expand their operations if they had more staff, funding, marketing support, and overall resources. Each of the market managers listed off additional things they would like to undertake at the market if they had additional resources. For example, Archwood Green Barns’ Elizabeth Melson cited strong interest in holding events in conjunction with their market days; however, she simply could not manage such a programming expansion without additional staff and/or support (Melson, 2020).
While the Remington market has exploded in popularity in its short time of operation, it has tremendous opportunity for expansion. According to John and Marybeth Waldeck, key organizers of the Remington Farmers’ Market and Community Garden, their existing space can accommodate 30–35 vendors, and their adjacent parking lot could accommodate an additional 20–25 vendors—all while maintaining adequate parking for visitors. However, the Remington market is run exclusively by volunteers who are at the limits of what they can manage without additional resources and assistance. As a result, the Waldecks cautioned that their interest in expanding the Remington market would have to be predicated on a corresponding increase in resources such as funding, staffing, and/or other support (Waldeck, 2021).
What bottlenecks and other factors currently limit the expansion or improvement of the county’s existing markets?
The first factor limiting Fauquier County’s existing farmers’ markets is the lack of coordination between growers, local governments, public agencies, and philanthropy. This lack of coordinated public support for local foods was highlighted by officials from the PATH Foundation and echoed by the three market managers and nearly all other stakeholders interviewed for this study (Dueck, 2021).
Counties that invest in coordination of public farmers’ markets and other local foods programming generally benefit from more successful—and resilient—local food systems. Fauquier County lags behind neighboring counties in terms of such coordinated public support. According to Kirsten Dueck, Senior Program Officer at the PATH Foundation, neighboring counties (most of whom are not as agricultural as Fauquier County) have a coordinated public agency that has led the charge and organized a formal response to the pandemic. “Those other counties invested in coordination services,” said Dueck (Dueck, 2021). While there are various players within Fauquier County’s local foods arena, no formal coordination and/or collaboration is taking place between the county’s public farmers’ markets. “Funding alone won’t take care of it,” said Dueck, “and a small farmer alone can’t fix that'' (Dueck, 2021).
Coordinated marketing was the most cited need that could bolster the county’s existing markets. This sentiment was shared by the market managers as well as current market vendors interviewed.

36
Vendors stressed the need for more marketing of existing markets, and for collaborative promotion of all the county’s farmers’ markets.
The Archwood Green Barns Market sees lack of support and collaboration from wider county entities as a major limiting factor. The Archwood market does not currently receive any support from the County or other government entities, likely due to the fact that the market is sponsored by a private entity (The Plains Redevelopment Corporation) (Melson, 2020).
In addition to collaborative marketing and coordination, additional funding for staffing and market development would allow the county’s existing markets to flourish well beyond their current limitations. The Warrenton and Archwood markets have dedicated, paid market managers, and “the return on investment on their modest salaries has been almost incalculable,” according to senior officials at the PATH Foundation (Dueck, 2021). As a result, staffing or simply organized support for the Remington market could result in incredible advancement for this up-and-coming market. Similarly, funds for additional staff at the county’s two larger markets could yield comparable returns.
Another need that has emerged, particularly in light of the COVID-19 pandemic, is for online ordering platforms. The pandemic has radically changed the way people shop, and farmers’ markets scrambled in 2020 to shift their market ordering and sales online in order to accommodate consumer demand and public health and safety restrictions.
None of Fauquier County’s three public markets was able to institute a market-wide ordering system in 2020. Some individual market vendors (such as Gonzales Farm and Starstead Farm) were able to institute online ordering in 2020. According to Warrenton’s Natalie Ortiz, vendors who did not shift their sales online suffered as most customers preferred to preorder from vendors with online platforms (Ortiz, 2020).
As a volunteer-run market, the Remington Farmers’ Market lacked the resources and capacity to effectively shift their operations in response to the pandemic. A volunteer helped post to the market’s Facebook page to direct customers to their vendors with websites. Ultimately, the limited technical abilities and capacity of the volunteers combined with the event-based nature of the market resulted in the decision to temporarily close the Remington Farmers’ Market during the pandemic.
Vendors and customers alike have indicated that having an online system for preordering would be a valuable addition to Fauquier County’s farmers’ markets, even after the pandemic when public gatherings can occur as usual. Natalie Ortiz mentioned that the Warrenton market’s next big undertaking would likely be a centralized, market-wide platform for online purchases.
Implementing an online platform in a county-wide/multi-market fashion, however, would have numerous benefits, most notably the ability to share costs and organizational capacity. Each market could act as an aggregation and pickup point for consumers, and a shared online platform can help introduce customers of one market to vendors that only sell at other markets. More importantly, such an effort is likely to expand the customer base at each market and convert “sometimes” shoppers into “frequent” shoppers.
What entities have the capacity and/or interest in managing new markets?
Research shows that farmers’ markets require organizational backing (Dueck, 2020). Markets can be spearheaded by an individual, but ultimately there needs to be an organization—typically a nonprofit or a government entity—that has firm backing and adequate resources to coordinate the effort.

37
As of April 2021, several organizations have plans to open new farmers’ markets in Fauquier County.
• Upperville market: scheduled to open on May 12, 2021, which will operate Wednesdays from 4pm to 8pm. This market is sponsored by Citizens for Fauquier County (CFFC) and Bluewater Kitchen.
• Marshall market: scheduled to open May 14, 2021, which will operate on the second Friday of every month from 4pm to 7pm located and be located in the parking lot at 8382 Main Street, Marshall. This market is sponsored by Marshall Moving Forward.
How do the county’s existing farmers’ market managers and stakeholders view the expansion of farmers’ markets in Fauquier County?
Managers of existing markets indicate that, while there may be need for markets in other areas, there is plenty of room (and need) to expand their existing markets. According to Archwood Green Barns’ Elizabeth Melson, “I would like to see more regional support efforts for existing markets, while also exploring options for new ways to reach people” through additional markets, new programming, etc. (Melson, 2020).
However, over the course of interviews with market managers and key stakeholders, a common theme emerged: Several cited interest in establishing a permanent, covered location—either as a covered pavilion or an actual building—for a year-round market, as opposed to new, additional traditional farmers’ markets.
Given Warrenton’s position as the longest-running and most popular market, the Warrenton market makes the most logical sense for such an investment. Warrenton manager Natalie Ortiz cites that her customers and vendors are already asking for a year-round, indoor market along the lines of the renowned markets in Lancaster, Pennsylvania (featured in Section 3.5.2).
6.1 Overall assessment: CAPACITY
• Each of the county’s three existing farmers’ markets has ample room to grow and improve, but they need additional support and resources to do so.
• Lack of county-wide coordination and collaboration are major factors limiting the expansion and improvement of the county’s existing markets.
Citizens for Fauquier County (CFFC) has been the guardian of Fauquier’s controlled growth and rural agricultural character. Founded in 1968, CFFC is a non-partisan, nonprofit organization representing hundreds of families active in local conservation efforts.
Bluewater Kitchen is a full-service farm-to-table catering and event company based in Upperville. Working hand in hand with farmers & ranchers, Bluewater Kitchen creates customized catering menus that strive to renew appreciation for hyper-local farm-to-table cuisine.
Marshall Moving Forward is a newly created nonprofit and has recently become affiliated with the Virginia Main Street program. Marshall Moving Forward seeks to promote and assist with economic development projects that benefit the Marshall community.
38
7. FEASIBILITY DETERMINATION AND RECOMMENDATIONS In conclusion, this study presents the following feasibility determinations and recommendations for each of the proposed enhancements to farmers’ markets programming in Fauquier County.
7.1 New traditional farmers’ markets
While Fauquier County’s existing public farmers’ markets are performing well, the market managers agree that their markets are nowhere near their maximum selling capacity. Likewise, the managers already know what they need to expand and enhance their operations; they simply need additional funds and resources to implement these measures.
As outlined in Section 3.1, national trends show that starting new markets can, and often does, undercut existing markets—especially when the existing markets are not totally at or beyond their selling capacity. Given that all three of the county’s existing public farmers’ markets have ample room to grow, Fauquier County would be best served by focusing resources towards enhancing existing markets rather than on developing new ones.
Recommendation: Improve coordination and communication between the county’s farmers’ markets and other key stakeholders.
Each of the county’s three public farmers’ markets would benefit greatly from collaborative marketing, coordination, and improved access to resources and funding. Yet there is currently no central coordinating entity for local food markets in Fauquier County.
A logical starting place would be to organize a Fauquier County Farmers’ Market committee, which would include officials from each of the county’s existing public farmers’ markets, the Fauquier County Agricultural Development Department, and other key stakeholders such as officials from the County, Towns, and the PATH Foundation. This committee could start informally, scheduling periodic meetings to discuss planned markets, programming, marketing, staffing, and other needs across the county’s markets. Ideally it would grow into a mechanism for securing and distributing additional funds and resources to the farmers’ markets.
In building out this committee, the County should seek guidance from local partners such as program officers at the PATH Foundation, who already have a good understanding of how other neighboring counties coordinate such systems.
7.2 A year-round, indoor, in-person farmers’ market
Moving the Warrenton Farmers’ Market into a permanent building or covered pavilion presents a rational next step in that market’s evolution. To be clear, having a covered or indoor space is not required for a farmers’ market to succeed; however, having a fixed, permanent location would enhance the market’s visibility, enable it to extend its operation longer into the year, and provide a stable launching point for expanded programming.
Given the Warrenton market’s current capacity, market leaders should seriously explore the possibility of starting with a permanent, covered pavilion for the Warrenton Farmers’ Market. Pavilions represent an intermediate step forward for a market. They allow the market to maintain its basic functionality as an outdoor, traditional farmers’ market, only with enhanced, permanent infrastructure. Pavilions provide shelter from the elements, which protect vendors and customers alike in all seasons, and power, which allows vendors to run freezers and gives market managers enhanced options for operating computers, cash registers, and other electronic items during market days. Some pavilions also include onsite public restrooms.

39
While both a pavilion and a building represent a significant capital investment, a pavilion offers the benefits of a lower overall startup cost and would allow the farmers’ market to grow incrementally over time. On top of the hefty construction price tag, transitioning to a year-round, indoor market would require the market to significantly increase its administrative and operating budgets in order to be open more days per week. In contrast, with a pavilion, the Warrenton market could continue operating one-to-two days per week for most of the year in a better space.
Finally, pavilions offer flexibility and can accommodate additional public uses beyond hosting the weekly farmers’ market. For example, the Ithaca Farmers Market built a stunning multi-purpose pavilion on the banks of Cayuga Lake in Ithaca, New York. The pavilion serves as the permanent home for the farmers’ market, but it also generates significant earned revenue for the farmers’ market as a special event venue.
Similarly, the Morgantown Farmers’ Market in Morgantown, West Virginia, is held in a permanent pavilion. During the week, it is known as Lot A by the Morgantown Parking Authority, providing residents with permit parking during the day and metered parking at night. Funding for the pavilion was secured by Main Street Morgantown and the City of Morgantown, who secured federal and state grants and led a fundraising campaign. The partnership continues to raise money for an outdoor Culinary Station, which will feature programming at each farmers’ market, showcasing what can be done with the variety and array of produce, goods, and services that local farms, craftsmen, and business owners offer the greater Morgantown area. The pavilion is also occasionally used for other
Ithaca Farmers' Market pavilion (Trip Advisor)

40
outdoor markets and events. Prior to COVID-19, City leaders had discussed using the pavilion on Friday and Saturday evenings as a food truck vendor space.
Recommendation: Begin planning for a permanent, covered market space.
The Warrenton Farmers’ Market, along with Town leaders and other key stakeholders, should begin exploring potential locations and options for a permanent pavilion in downtown Warrenton.
The first task at hand will be to find an accessible location, preferably in downtown Warrenton. Local leaders should work with Town officials, property owners, and real estate agents to identify suitable locations close to downtown that are walkable to nearby businesses and attractions, have parking, and are (or could be developed into) pleasant public spaces for a public farmers’ market. Following the model of the Ithaca Farmers’ Market, such a pavilion could be located at Eva Walker Park, close to downtown Warrenton. It could be an existing downtown parking lot over which a pavilion could be erected. Once potential properties have been identified, the team should ascertain the ownership of the parcel and enter discussions to determine whether the owners would consider selling or be open to the idea of enhancing the site for the farmers’ market.
Morgantown Farmers' Market pavilion (Smith Meadows)

41
Develop a location-specific project plan. Once a property has been identified as a top candidate, the project team should develop a basic project plan similar to a business plan. This plan should outline key logistics such as: current ownership, which entity would ideally own the property, which entity would manage the property, possible models for earned income on the property, etc. The project team should work with an architect to develop basic plans, develop cost estimates, and produce some concept drawings for the proposed space
Next, the team should develop a fundraising strategy it will follow to raise the necessary capital to complete the project. Key elements of this strategy will likely include a mix of donations from individuals (potentially a capital campaign), county and/or town appropriations, and grants from state and federal agencies as well as private philanthropic institutions such as the PATH Foundation, the Northern Piedmont Community Foundation, and others. (Note: Senior PATH Foundation program officers interviewed through this study indicated that an investment in a permanent home for the Warrenton Farmers’ Market would likely be well received by the PATH Foundation and other charitable foundations in the area.)
7.3 An online farmers’ market sales platform
Across the board, there is interest in expanding opportunities to sell and purchase local agriculture products within Fauquier County. Thanks in no small part to the potential issue of walk-up market saturation and the congested weekend schedule for farmers’ markets, an online farmers’ market sales platform is a sensible way to expand opportunities for producers and consumers without the risk of interrupting the sustainable growth of existing in-person markets.
Building an online sales platform designed to serve a large audience of producers and consumers is no small undertaking. As a result, the county’s existing markets would be well served to pool their resources and partner a common platform shared across all three markets. Using existing markets as pickup points for online sales will increase foot traffic to those markets, and, as market environments continue to improve, new walk-up customers will be enticed to visit.
Online sales platforms typically include a markup (20–30%) over the product prices set by individual producers. This revenue will help offset the cost of operating the online market and, with proper management and growth of the market, will provide important additional funding for the participating markets.
Recommendation: Begin discussing a coordinated, multi-market online sales platform that leverages existing market days and times to aggregate, organize, and distribute orders placed and paid for earlier in the week.
Important factors to consider as part of initial discussions include clearly defining the expected process, clearly defining logistics needs, understanding the scope of management requirements of an online marketplace platform, and engaging in a business planning process to define costs and revenues (for both the markets and producers).

42
REFERENCES
Biasillo, Laura et al. 2018. Reversing the Downward Trend: Toolkit for Adapting Farmers Markets to Match Consumer Trends. http://adirondackfarmersmarket.com/wp-content/uploads/2020/03/SARE-Farmers-Market-Toolkit-2020.pdf
Byker Shanks et al. 2012. “Characterizing Farmers' Market Shoppers: A Literature Review.” Published in the Journal of Hunger & Environmental Nutrition in January 2012.
Dueck, Kirsten. 2021. Personal communication. January 25, 2021.
ESRI. 2020. ESRI Business Analyst.
Love, Hanna and Storring, Nate. 2020. “Farmers markets are vital during COVID-19, but they need more support.” Published by the Brookings Institution on April 8, 2020. https://www.brookings.edu/blog/the-avenue/2020/04/08/farmers-markets-are-vital-during-covid-19-but-they-need-more-support/
Melson, Elizabeth. 2021. Personal communication. January 8, 2021.
Moyer, Brian. 2021. Personal communication. January 27, 2021.
Northeast Sustainable Agriculture Research and Education (SARE). 2021. Reversing a Downward Trend in Customer Participation and Farmer Sales at Farmers’ Markets. https://projects.sare.org/sare_project/ene18-150/
Ohlwiler, Tim. 2021. Personal communication. January 22, 2021.
Ortiz, Natalie. 2020. Personal communication. December 22, 2020.
U.S. Census Bureau. 2021. https://www.census.gov/data.html
USDA Agricultural Marketing Service (AMS). 2020. Local Food Directories: National Farmers Market Directory. https://www.ams.usda.gov/local-food-directories/farmersmarkets
USDA National Agricultural Statistics Service (NASS). 2017. Census of Agriculture. https://quickstats.nass.usda.gov/
___________________. 2020. National Farmers Market Managers Survey. https://usda.library.cornell.edu/concern/publications/pz50hd694?locale=en
Waldeck, John and Waldeck, Marybeth. 2021. Personal communication. January 11 and January 26, 2021.
Wood, Daniel. 2019. “Why Are So Many Farmers Markets Failing? Because the Market Is Saturated.” Published by WABE on March 17, 2019. https://www.wabe.org/why-are-so-many-farmers-markets-failing-because-the-market-is-saturated/

43
APPENDICES: SURVEY INSTRUMENTS

1
FAUQUIER COUNTY FARMERS’ MARKET SURVEY
Dear resident,
The Fauquier County Agricultural Development Department seeks your input to help us improve farmers’ market programming in Fauquier County. By completing this survey, your feedback will help the County better understand consumer use and preference for public farmers’ markets and assess the feasibility of opening a new farmers’ market (or similar retail services) in Fauquier County.
This survey focuses on Fauquier County’s three public farmers’ markets: the Archwood Green Barns Farmers Market in The Plains, the Warrenton Farmers Market in Warrenton, and the Remington Farmer’s Market in Remington.
This survey will take 5–10 minutes to complete. It is entirely voluntary, and you may leave any questions blank. All responses will be confidential.
This survey is also available online at: https://www.surveymonkey.com/r/MMMQXGZ If at all possible, we ask that you please fill out the online version so that your feedback can be processed more quickly. Otherwise, please fill out this paper form and return to the Fauquier County Agricultural Development Department via the enclosed return envelope. All responses must be received by February 28, 2021.
Thank you for your participation in this survey!
Please direct any questions to Ray Pickering at [email protected] or (540) 422-8280.
We'll randomly select two survey participants for $50 gift certificates to CFC Farm & Home Center. To be entered in the drawing, please provide your phone number or email address: _________________________________
0. If you received a mailed invitation to complete this survey, please enter the code provided in the address block on the envelope: __________
0. Please list your zip code: __________

2
1) Did you shop at any public farmers’ markets in 2020? (Mark all that apply)
a. Archwood Green Barns Farmers Market (The Plains) b. Warrenton Farmers Market c. Remington Farmer’s Market d. Other farmers’ markets outside of Fauquier County (please list) e. I did not shop at any public farmers’ markets in 2020.
2) If you DID shop at Fauquier County farmers’ markets in 2020, how much did you
spend at farmers’ markets in 2020 as compared to 2019? a. I spent more at farmers’ markets in 2020. b. I spent less at farmers’ markets in 2020. c. I spent about the same.
3) If you did NOT shop at a Fauquier County farmers’ market in 2020, what factors
influenced your decision? (Mark all that apply) a. I shop at a farmers’ market outside of Fauquier County. b. Fauquier County farmers’ markets are too far from my home. c. Farmers’ markets are too expensive. d. I am a member of a CSA or other local farm subscription service. e. I buy directly from local farmers. f. I prefer to shop at other retail grocery establishments. g. I do not know about Fauquier County farmers’ markets. h. The selection of goods at farmers’ markets is insufficient. i. I cannot attend the farmers’ market during their business hours. j. I'm not interested in buying products sold at farmers' markets. k. Other (please list): _____________________________________________ l. Other (please list): _____________________________________________ m. Other (please list): _____________________________________________
4) Did you purchase local farm products from any of the following private retail
businesses in Fauquier County in 2020? (Mark all that apply) a. Messick’s Farm Market b. Buckland Farm Market c. 4P Foods d. Other (please list): _____________________________________________ e. I did not shop at any of the private retail businesses listed above in 2020.

3
5) Did you purchase directly from any Fauquier County farmers in 2020? (Mark all that apply) a. Farm stands b. Pick your own c. CSAs or subscription services d. Other (please list) e. I did not purchase directly from any farmers in 2020.
6) Would you be more likely to shop at a public farmers’ market in Fauquier County if
one was located closer to your home? a. Yes b. No c. I’m not sure
7) Which of the following locations would be most convenient for you to shop at a
public farmers’ market? a. Warrenton b. The Plains c. Remington d. Bealeton e. Marshall f. Other town (please list): _____________________________________________
8) Rank the days and times that you would most likely shop at a public farmers’ market.
[Rank choices] a. Weekdays from 10am–1pm ______ b. Weekdays from 4pm–7pm ______ c. Saturday from 9am–12pm ______ d. Saturday from 12pm–4pm ______ e. Saturday from 4pm–7pm ______ f. Sunday from 9am–12pm ______ g. Sunday from 2pm–4pm ______ h. Sunday from 4pm–7pm ______
9) Would you be interested in purchasing products from an online farmers’ market
(where you order local products online and pick up once per week)? a. Yes b. No c. I’m not sure

4
10) Approximately how much did you spend per visit to Fauquier County farmers’ markets in 2020? a. Less than $25 b. $26–$50 c. $51–$75 d. $76–$100 e. Over $100
11) How satisfied were you with the price of products at Fauquier County farmers’
markets in 2020? a. Prices are too high b. Prices are about right c. Prices are too low d. I’m not sure e. Other (please list): _____________________________________________
12) How satisfied were you with product selection at Fauquier County farmers’ markets
in 2020? a. Very satisfied b. Satisfied c. Neutral
d. Dissatisfied e. Very dissatisfied f. I’m not sure
13) Which of the following product categories do you like to purchase at farmers’ markets?
a. Fresh produce b. Eggs c. Meats d. Pickles e. Baked goods f. Ready-to-eat hot foods g. Live plants h. Cut flowers
i. Honey j. Soaps and beauty products k. Other value-added edible goods (oils,
sauces, jams/jellies, beverages, etc.) n. Other (please list):
___________________ l. None
14) Overall, how satisfied are you with the range of options available to you to purchase local
farm products within Fauquier County? a. Very satisfied b. Satisfied c. Neutral
d. Dissatisfied e. Very dissatisfied f. I’m not sure
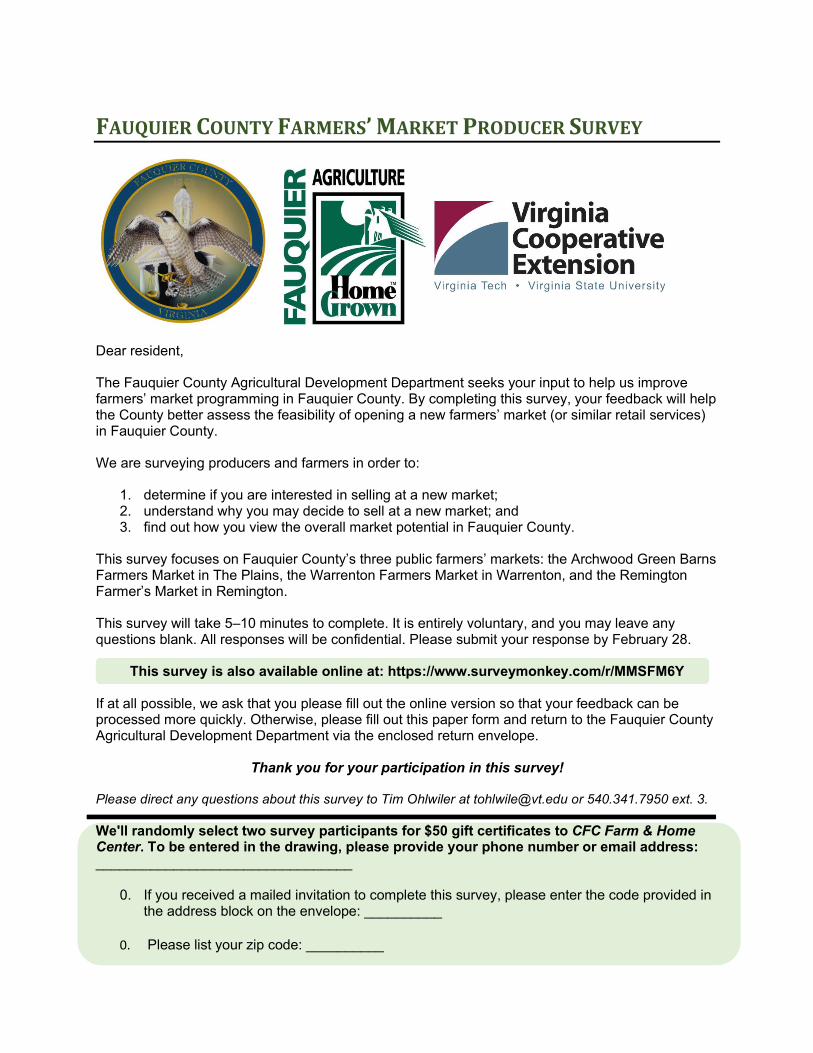
FAUQUIER COUNTY FARMERS’ MARKET PRODUCER SURVEY
Dear resident,
The Fauquier County Agricultural Development Department seeks your input to help us improve farmers’ market programming in Fauquier County. By completing this survey, your feedback will help the County better assess the feasibility of opening a new farmers’ market (or similar retail services) in Fauquier County.
We are surveying producers and farmers in order to:
1. determine if you are interested in selling at a new market; 2. understand why you may decide to sell at a new market; and 3. find out how you view the overall market potential in Fauquier County.
This survey focuses on Fauquier County’s three public farmers’ markets: the Archwood Green Barns Farmers Market in The Plains, the Warrenton Farmers Market in Warrenton, and the Remington Farmer’s Market in Remington.
This survey will take 5–10 minutes to complete. It is entirely voluntary, and you may leave any questions blank. All responses will be confidential. Please submit your response by February 28.
This survey is also available online at: https://www.surveymonkey.com/r/MMSFM6Y If at all possible, we ask that you please fill out the online version so that your feedback can be processed more quickly. Otherwise, please fill out this paper form and return to the Fauquier County Agricultural Development Department via the enclosed return envelope.
Thank you for your participation in this survey!
Please direct any questions about this survey to Tim Ohlwiler at [email protected] or 540.341.7950 ext. 3.
We'll randomly select two survey participants for $50 gift certificates to CFC Farm & Home Center. To be entered in the drawing, please provide your phone number or email address: _________________________________
0. If you received a mailed invitation to complete this survey, please enter the code provided in the address block on the envelope: __________
0. Please list your zip code: __________

1) Did you sell at any of the following public farmers’ markets in 2020? (Mark all that apply)
a. Archwood Green Barns Farmers Market (The Plains) b. Warrenton Farmers Market c. Remington Farmer’s Market d. Other farmers’ markets (please list) e. I did not sell at any public farmers’ markets in 2020
2) If you sold at any public farmers’ markets in 2020, please estimate your average sales
per market day. a. Archwood Green Barns Farmers Market (The Plains): $_____ b. Warrenton Farmers Market: $______ c. Remington Farmer’s Market: $______ d. Other counties (please name): $______
3) In general, do you feel that Fauquier County is a good location for a new farmers’
market or other retail opportunity? a. Yes b. No c. I’m not sure
4) Which locations would be most convenient for you to sell at a public farmers’
market? (Mark all that apply) a. Remington b. Bealeton c. Marshall d. Other town (please list) e. None f. I’m not sure
5) Rank your preferred days and times for selling at public farmers’ markets. [Rank
choices] a. Weekdays from 10am–1pm ____ b. Weekdays from 4pm–7pm ____ c. Saturday from 9am–12pm ____ d. Saturday from 12pm–4pm ____ e. Saturday from 4pm–7pm ____ f. Sunday from 9am–12pm ____ g. Sunday from 2pm–4pm ____ h. Sunday from 4pm–7pm ____

6) Fauquier County is assessing the feasibility of a few different types of markets. Would you be interested in selling at any of the following types of markets? (Mark all that apply)
a. A new traditional farmers’ market (one day per week, seasonally) b. A new indoor farmers’ market (at least one day per week, year-round) c. A new online farmers’ market (one day per week, year-round, where producers list
products for sale, pack products, and deliver them to a central location to be distributed to consumers)
7) Did you sell at any of the following private retail businesses in Fauquier County in
2020? (Mark all that apply) a. Messick’s Farm Market b. Buckland Farm Market c. 4P Foods d. Other (please list) e. I did not sell at any of the private retail businesses listed above in 2020
8) Did you sell directly to any Fauquier County consumers in 2020? (Mark all that apply)
a. Farm stands b. Pick your own c. CSAs or subscription services
d. Other (please list) e. I did not sell directly to consumers
in 2020 9) Do you plan to sell at any of the following public farmers’ markets in 2021? (Mark all
that apply) a. Archwood Green Barns Farmers
Market (The Plains) b. Warrenton Farmers Market c. Remington Farmer’s Market
d. Other farmers’ markets (please list)
e. I did not plan to sell at any public farmers’ markets in 2021
10) If you do not plan to sell at any Fauquier County farmers’ markets in 2021, what
influences your decision? (Mark all that apply) a. Expected total revenue per market day is insufficient b. Expected price point per product is too low c. I have heard negative opinions and experiences from other farmers/producers d. I have had previous negative experiences at these markets e. These markets are too far from my farm f. I do not need a new sales outlet g. The schedule of market(s) does not work for me h. Other: _________

11) When deciding whether to sell at a new farmers’ market, what are the three most important factors that influence this decision? [Check up to three]
a. Expected total revenue per market day b. Expected price point per product c. Opinions and experiences of other farmers/producers d. Distance from farm e. Need for a new sales outlet f. Perceived capability of market manager g. Selling day/schedule of market h. Other: _________
12) How did the overall demand for your products change in 2020 as compared to 2019?
a. Demand increased in 2020 b. Demand decreased in 2020 c. Demand stayed roughly the same
13) How did your sales revenue change in 2020 as compared to 2019?
a. Revenue increased in 2020 b. Revenue decreased in 2020 c. Revenue stayed roughly the same
14) Do you plan to expand into new farmers’ markets or other direct to consumer venues
in 2021? a. Yes b. No c. I’m not sure
15) If you are interested in further discussions about Fauquier County farmers’ markets
or other pertinent topics, please provide you contact information: _______________