Agriculture in Fauquier County: Characteristics, Trends ... 2014/fauquier Impact Ag... · Fauquier...
49
Agriculture in Fauquier County: Characteristics, Trends, and Economic Impacts Terance J. Rephann May 2014
Transcript of Agriculture in Fauquier County: Characteristics, Trends ... 2014/fauquier Impact Ag... · Fauquier...

Agriculture in Fauquier County: Characteristics, Trends, and Economic Impacts
Terance J. RephannMay 2014

2

AGRICULTURE IN FAUQUIER COUNTY: CHARACTERISTICS, TRENDS,
AND ECONOMIC IMPACTS
Terance J. Rephann, Ph. D. Center for Economic and Policy Studies
May 2014

ii
Copyright © 2014 by the Rector and Visitors of the University of Virginia
PP.O. Box 400206Charlottesville, VA 22904(434) 982-5522 • FAX: (434) 982-5524 • TDD: (434) 982-HEARWebsite: www.coopercenter.org/ Richmond11 South 12th Street, Suite 225Richmond, VA 23219-4035(804) 371-0202 • FAX: (804) 371-0234 • TDD: (804) 982-HEAR
SouthwestOne College AvenueWise, VA 24293(276) 328-0133 • FAX: (276) 328-0233 • TDD (540) 328-0191

iii
TABLE OF CONTENTS
List of Boxes ..................................................................................................................................... ivList of Tables ...................................................................................................................................... vList of Figures ..................................................................................................................................... viIntroduction ...................................................................................................................................... 1Section 1. The Fauquier County Economy .............................................................................................. 3Section 2. Agriculture in Fauquier County .............................................................................................. 9Section 3. Data and Methodology .......................................................................................................... 19Section 4. Economic Impacts ................................................................................................................. 23Section 5. Other Economic Contributions ............................................................................................. 27References .................................................................................................................................... 29Appendix A. Agriculture Definition ....................................................................................................... 31Appendix B. Data Sources ..................................................................................................................... 35

iv
LIST OF BOXES
Box 1.1 Land Conservation and Preservation .......................................................................................... 7Box 2.1 County Agricultural Development Support ............................................................................... 9Box 2.2 Agriculture Education and Training ......................................................................................... 11Box 2.3 Fauquier County Horse Industry .............................................................................................. 15Box 2.4 Agriculture-related Industry Targets for Fauquier County ....................................................... 16

v
LIST OF TABLES
Table 1.1 Economic, Social and Demographic Characteristics, Fauquier County, Virginia, and United States, 2008-2012 .............................................................................................................................. 6Table 4.1 Fauquier County Agriculture Economic impacts, Employment, Value-added, and Total Industrial Output ................................................................................................................... 23Table 4.2 Fauquier County Agriculture Economic Impacts by Industry, Employment, Value-added, and Total Industrial Output ............................................................................................................. 24Table 4.3 Fauquier County Agriculture Economic Impacts by Component, Employment, Value-added, and Total Industrial Output ............................................................................................................. 26Table A.1 Data Sources and IMPLAN Assignments by Component ...................................................... 32Table B.1 Fauquier County Agriculture Direct and Total Economic Impacts by Component and Industry, Employment .............................................................................................................. 35Table B.2 Fauquier County Agriculture Direct and Total Economic Impacts by Component and Industry, Value-added ...................................................................................................................... 37Table B.3 Fauquier County Agriculture Direct and Total Economic Impacts by Component and Industry, Total Industrial Output .............................................................................................. 39

vi
LIST OF FIGURES
Figure 1.1 Fauquier County Location ....................................................................................................... 3Figure 1.2 Annual Population Growth Rate, Fauquier County, Virginia, and United States, 1970-2012 ...................................................................................................................................... 4Figure 1.3 Size of Sector, Change in Employment 1990-2012, and Average Annual Wages 1990, Fauquier County ................................................................................................................................ 4Figure 1.4 Unemployment Rate, Fauquier County, Virginia, and United States, 1990-2013 ................... 5Figure 1.5 Fauquier County Per Capita Income as Percentage of Virginia and United States, 1969-2012 ...................................................................................................................................... 5Figure 2.1 Fauquier County Farm Acreage, 1978-2012 ........................................................................... 9Figure 2.2 Fauquier County Farm Employment and Cash Receipts from Marketings, 1969-2012 ....... 10Figure 2.3 Fauquier County Cash Receipts by Source, Percentage of Total, 1969-2012 ....................... 12Figure 2.4 Fauquier County Cattle and Calf Inventory, 1975-2013 ....................................................... 12Figure 2.5 Fauquier County Grain Production, 1990-2013 .................................................................... 13Figure 2.6 Number of Fauquier County Farms by Industry Category, 1997-2012 ................................. 13Figure 2.7 Employment in Equine Production and Wineries, 1990-2012 .............................................. 17Figure 3.1 Economic Impact Diagram .................................................................................................... 20
1
INTRODUCTION
The Fauquier County agricultural landscape has undergone many changes throughout its history. In the early part of the 20th Century, the area transitioned from apple and peach orchards and field crops to livestock and pasture and forage crops. Sheep and hogs were succeeded by beef and dairy cattle (Brown, Nicklin, and Toler 2008). Throughout the period, the horse industry has grown to play an increasingly important role, building on the area’s venerable fox hunt, horse show and race heritage, including the nation’s first hunt club (Piedmont Foxhounds), first horse show (Upperville Colt and Horse Show), and one of the largest steeplechase races (Virginia Gold Cup Race). In recent years, the county has seen a marked increase in value-added and specialty products such as wine and mushrooms.
In 1969 farm employment was 2,475 and made up approximately 21 percent of total employment. Livestock sales represented over 86 percent of total farm income. By 1987, farm employment had decreased to around 1,600 farmers and began to stabilize. Livestock continue to be the largest source of sales in 2012, but represented just 54 percent of total farm income. Sales of crops and farm-related income such as equine and agritourism related income were increasingly important. In 2012, Fauquier County’s farms generated an estimated average $54 million in agricultural commodity sales. $1.4 million of this amount was sold directly to consumers.
The purpose of this study is to describe the agricultural sector in Fauquier County and gauge the contribution that it makes to the county economy. This study takes a comprehensive approach to measuring the economic contribution of agriculture. Not only does it gauge the economic impact of agriculture sales, but also it looks at the role of closely related value-added industries such as wine
and animal slaughtering and processing. In addition, the economic impacts of visitor expenditures connected to farms, wineries and horse shows and competitions are counted. These economic impacts are broken out by source so that the reader can evaluate the relative importance of each component. In addition, the study discusses other economic benefits that result from Fauquier County agriculture.
To analyze economic impacts, the study uses a methodology (input-output analysis) and a software tool (IMPLAN) that have been applied often in agribusiness impact analysis, including recent economic impact studies of Virginia’s agricultural and forest industries (Rephann 2013) and the horse industry (Rephann 2011). The methodology accounts not only for the direct spending attributable to agriculture but also for indirect spending attributable to backward linkages in the supply chain. As a result of these linkages, the original expenditures cause a “ripple effect” or “multiplier effect” when money is re-spent in Fauquier County. The study presents economic impacts in terms of employment, total industrial output, and value-added. Impacts are presented for agriculture-related industries in terms of farm production, closely related primary manufacturing such as wineries and animal slaughtering, the horse industry, and agritourism.
The study is divided into five sections. The first section describes the Fauquier County economy and trends in key economic and demographic data. The second section discusses features and changes in the area’s agriculture sector. The third section describes the input-output methodology. The fourth section presents the economic contribution of agriculture to the county economy. The fifth section describes briefly other economic benefits of agriculture for the area.

2

3
SECTION ONETHE FAUQUIER COUNTY ECONOMY
Fauquier County is located in northern Virginia (see Figure 1.1) and forms part of the southwestern boundary of the Washington–Arlington–Alexandria, DC–VA–MD–WV metropolitan statistical area. The county’s population was an estimated 66,542 in 2012, which is up 20 percent from a level of 55,470 in 2000. Population growth patterns reflect, in part, residential decentralization from the inner ring metropolitan counties (see Box 1.1) that tends to track above the statewide average growth rate during periods of economic expansion and lag during recession (see Figure 1.2). The county seat of Warrenton is the largest incorporated town in the county, with an estimated 9,802 residents in 2012, up from 6,670 in 2000 for a growth rate of 47 percent.
As an outer-ring metropolitan county, the county experiences a significant net outflow of workers each day. Approximately 56 percent of local residents or 18,198 workers commuted outside the county to employment during the period 2006-2010, mostly to Fairfax County (5,542), Prince William County (4,038), and Loudoun County (1,726).1 The county also experienced an inflow of 9,149 in-commuters
for a net outflow of 9,049 workers during the period, which highlights the county’s continued role as a bedroom community for the DC metropolitan area.
Fauquier County has a diversified economy built on numerous small businesses. Unlike many localities, the county is not highly dependent on a handful of large private or public employers. Non-farm proprietors, including the self-employed, make up a relatively large share of total employment, 37.8 percent in 2012 compared to just 18.6 percent statewide.2 The farm, construction, and arts, entertainment, and amusement sectors form a relatively larger share of local employment than they do statewide. Figure 1.3 shows the size and change in wage and salary employment of the major sectors in the region from 1990-2012. The health care and educational services industries experienced the highest absolute growth during this period. Among higher paying sectors, employment in professional, scientific, and technical services expanded by more than 1,000 jobs. Numerous other sectors have also increased employment in the region. Only the public administration, agriculture, forestry, fishing, and hunting, and finance and
Fauquier County
Figure 1.1. Fauquier County Location
1 U.S. Census Bureau, 2006-2010 American Community Survey, Table 1. Residence County to Workplace County Flows for the United States and Puerto Rico Sorted by Residence Geography: 2006-2010.
2 Bureau of Economic Analysis, Local Area Personal Income, 2011, CA25N Table. http://www.bea.gov/regional/histdata/releases/1112lapi/index.cfm

4
Figure 1.2. Annual Population Growth Rate, Fauquier County, Virginia, and United States, 1970-2012
-1
0
1
2
3
4
5
6
7 19
70
1972
19
74
1976
19
78
1980
19
82
1984
19
86
1988
19
90
1992
19
94
1996
19
98
2000
20
02
2004
20
06
2008
20
10
2012
Ann
ual G
row
th R
ate
Fauquier Co.
Virginia
United States
Source: Bureau of Economic Analysis, Local Area Personal Income
Figure 1.3. Size of Sector, Change in Employment 1990-2012, and Average Annual Wages 2012, Fauquier County
Source: Virginia Employment Commission, Quarterly Census of Employment and Wages.Note: Size of sphere is proportional to 2012 employment.
$0
$10,000
$20,000
$30,000
$40,000
$50,000
$60,000
$70,000
$80,000
$90,000
$100,000
-1,000 -500 0 500 1,000 1,500 2,000
Aver
age
Ear
ning
s, 2
012
Employment Change, 1990-2012
Health Care
Accomodation and Food Services
Educational Services
Public Administration
Wholesale Trade
Administrative and Support Services
Construction
Finance and Insurance
Retail Trade Other Services
Manufacturing
Transportation and Warehousing
Professional, Scientific, and Technical Services
Arts, Entertainment, and Recreation
Information
Real Estate
Management of Companies and Enterprises
Ag, Forestry, Fishing, and Hunting
5
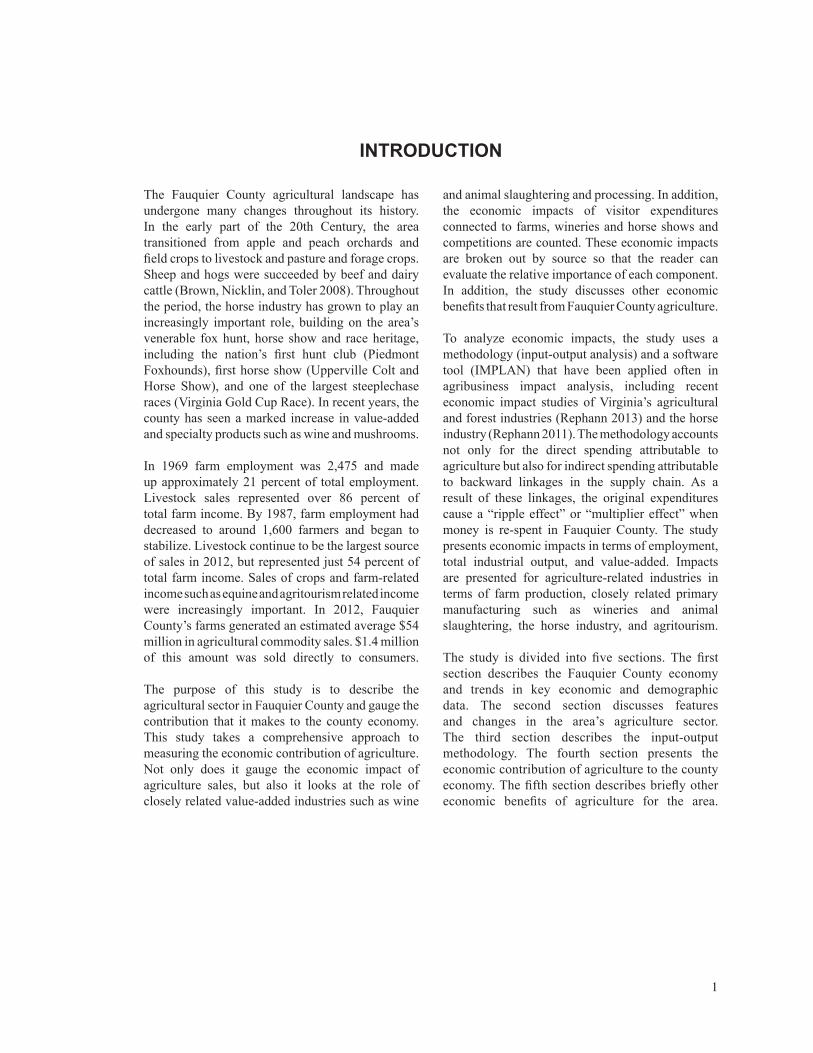
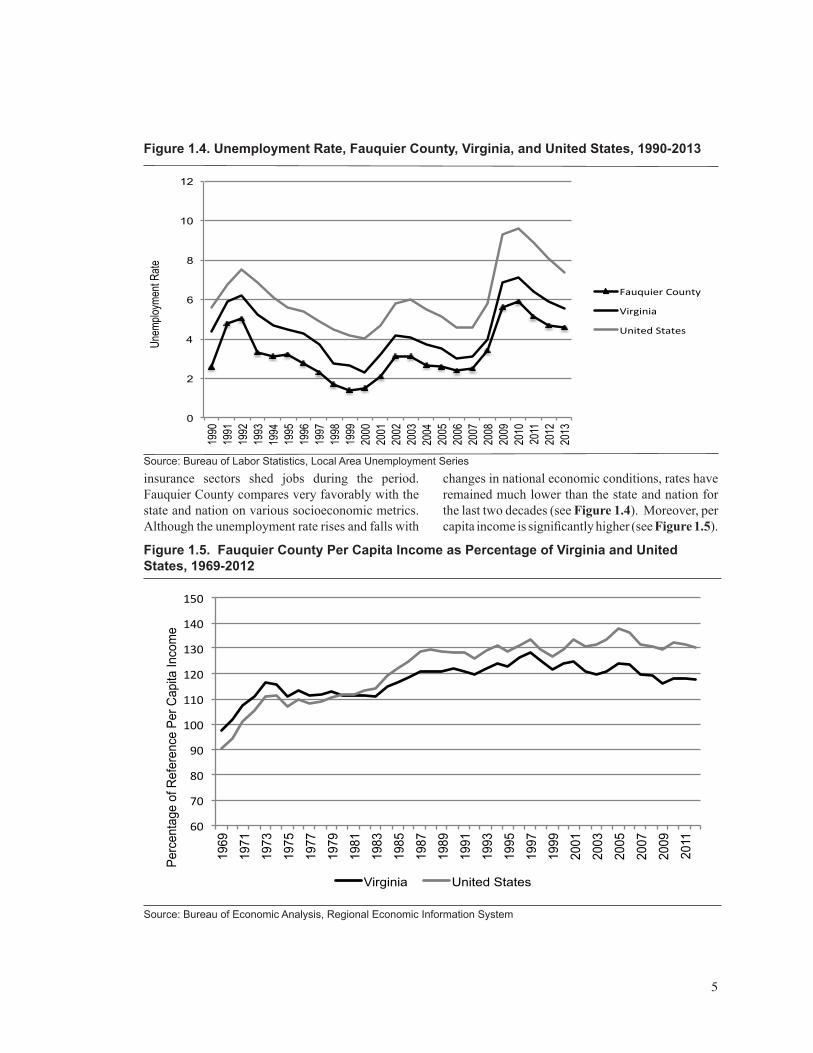
insurance sectors shed jobs during the period. Fauquier County compares very favorably with the state and nation on various socioeconomic metrics. Although the unemployment rate rises and falls with
changes in national economic conditions, rates have remained much lower than the state and nation for the last two decades (see Figure 1.4). Moreover, per capita income is significantly higher (see Figure 1.5).
Figure 1.4. Unemployment Rate, Fauquier County, Virginia, and United States, 1990-2013
Source: Bureau of Labor Statistics, Local Area Unemployment Series
0
2
4
6
8
10
12
1990
19
91
1992
19
93
1994
19
95
1996
19
97
1998
19
99
2000
20
01
2002
20
03
2004
20
05
2006
20
07
2008
20
09
2010
20
11
2012
20
13
Unem
ploym
ent R
ate
Fauquier County
Virginia
United States
Figure 1.5. Fauquier County Per Capita Income as Percentage of Virginia and United States, 1969-2012
Source: Bureau of Economic Analysis, Regional Economic Information System
60
70
80
90
100
110
120
130
140
150
1969
1971
1973
1975
1977
1979
1981
1983
1985
1987
1989
1991
1993
1995
1997
1999
2001
2003
2005
2007
2009
2011
Perc
enta
ge o
f Ref
eren
ce P
er C
apita
Inco
me
Virginia United States

6
Table 1.1 Economic, Social and Demographic Characteristics, Fauquier County, Virginia, and United States, 2008-2012
Median Household Income
Poverty Rate
High school degree
or greater
College degree
or greater % Minority% 65 Years and Older
United States $53,046 14.9% 85.7% 28.5% 36.3% 13.2%Virginia $63,636 11.1% 86.9% 34.7% 35.2% 12.3% Fauquier County $88,687 5.3% 91.0% 32.0% 18.3% 12.9% Source: U.S. Census Bureau, American Community Survey
Table 1.1 compares several demographic and economic characteristics of the region with that of state and the nation. Fauquier County has a significantly higher median household income than both Virginia and the United States at $88,687 and less than half the poverty rate at 5.3 percent. Educational achievement levels are comparable to the state and nation. The county has a significantly
higher percentage of high school graduates than these benchmarks, but the percentage of the population with a college degree lies midway between the state and nation. The county is similar to the state and nation in terms of age demographics but has a smaller minority population. Racial/ethnic minorities make up 18.3% of the population, though the county has experienced a recent influx of Hispanic/Latino residents of whom some are employed by local farms and farm-related businesses.
7
Fauquier County Horse Farm
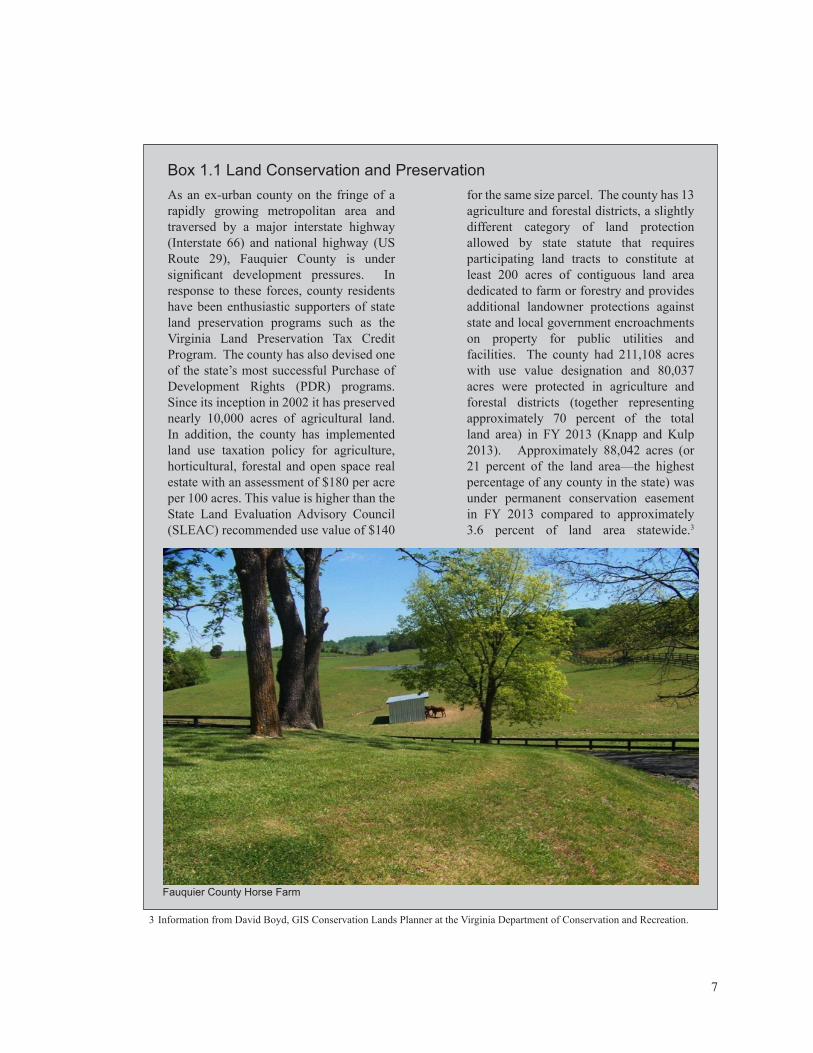
As an ex-urban county on the fringe of a rapidly growing metropolitan area and traversed by a major interstate highway (Interstate 66) and national highway (US Route 29), Fauquier County is under significant development pressures. In response to these forces, county residents have been enthusiastic supporters of state land preservation programs such as the Virginia Land Preservation Tax Credit Program. The county has also devised one of the state’s most successful Purchase of Development Rights (PDR) programs. Since its inception in 2002 it has preserved nearly 10,000 acres of agricultural land. In addition, the county has implemented land use taxation policy for agriculture, horticultural, forestal and open space real estate with an assessment of $180 per acre per 100 acres. This value is higher than the State Land Evaluation Advisory Council (SLEAC) recommended use value of $140
for the same size parcel. The county has 13 agriculture and forestal districts, a slightly different category of land protection allowed by state statute that requires participating land tracts to constitute at least 200 acres of contiguous land area dedicated to farm or forestry and provides additional landowner protections against state and local government encroachments on property for public utilities and facilities. The county had 211,108 acres with use value designation and 80,037 acres were protected in agriculture and forestal districts (together representing approximately 70 percent of the total land area) in FY 2013 (Knapp and Kulp 2013). Approximately 88,042 acres (or 21 percent of the land area—the highest percentage of any county in the state) was under permanent conservation easement in FY 2013 compared to approximately 3.6 percent of land area statewide.3
Box 1.1 Land Conservation and Preservation
3 Information from David Boyd, GIS Conservation Lands Planner at the Virginia Department of Conservation and Recreation.

8

9
SECTION 2AGRICULTURE IN FAUQUIER COUNTY
Fauquier County has a strong agricultural heritage and the farm sector continues to play an important role in the local economy. It is supported by an abundant supply of relatively level, fertile, arable land. Its topography consists of level and rolling terrain in the southern and eastern portions with mountain ridges in the far western portion. Despite continued urbanization pressures from the north, the agriculture natural resource base remains largely intact. Approximately 54 percent of county land area is farmland. Figure 2.1 shows that total farm acreage actually increased 2.6 percent between 2007 and 2012, a slightly faster rate of increase than the 2.4 percent for the state at large. Agricultural preservation programs adopted by the state and county have no doubt played a key role—large contiguous tracts of preserved farmland in the north of the county have served as an effective bulwark against the sprawling development that characterizes parts of adjacent counties such as Prince William and Loudoun. The county has also supported the continued growth and viability of local agriculture by providing funding to the Fauquier County Department of Agricultural Development (see Box 2.1).
Although farm employment has shrunk in both absolute size and relative to total employment in recent decades from 2,475 farmers and laborers and 21 percent of total employment in 1969 to 1,407 and Figure 2.1 Fauquier County Farm Acreage, 1978-2012
Source: U.S. Department of Agriculture, National Agri-cultural Statistics Service, Census of Agriculture, Various Years; Note: 1992 and earlier years are not adjusted for survey nonresponse error
205,000
210,000
215,000
220,000
225,000
230,000
235,000
240,000
245,000
250,000
1978 1982 1987 1992 1997 2002 2007 2012
Acre
age
Year
Box 2.1 County Agricultural Development SupportFauquier County has a department dedicated to agricultural development. The department is charged with “promoting county agriculture industry, increasing the economic viability of farming, and advising the County Board of Supervisors on agricultural economic development issues.” Among its duties are administering the county’s purchase of development rights program, promoting area products by publishing a farm product and services directory, maintaining the Fauquier Agriculture HomeGrown program, coordinating the annual Fall Farm Tour, and serving as a county liaison for agricultural advocacy and business groups. It is only one of only five Virginia localities (the others being Pittsylvania, Halifax, and Loudoun counties, and the City of Virginia Beach) with an office dedicated to agriculture.
Moo Thru in Remington Aided by Farmer Partici-pation in County PDR Program

10
4 percent in 2012, the rate of decline decelerated rapidly in the 1980s (see Figure 2.2). As elsewhere in the state and nation, rising productivity made possible by farm consolidation and improved economies of scale, increased use of capital and adoption of new technology and improved education and training have enabled area farmers to produce comparable amounts of output with fewer workers. Also in line with national trends, farm operators are more likely to spend some time employed off farm than in earlier decades. On the downside, the local farm operators continue to become more aged. The average age of principal operators in the county increased from 53.3 to 60.2 between 1978 and 2012, and now thirty-seven percent of Fauquier County farmers have reached retirement age (65 years or older).4 This situation creates a farm succession problem moving forward, an issue that the county government and partner organizations have tackled by redoubling efforts to train and infuse new farmers into the region (see Box 2.2) Fauquier County’s agricultural product mix and
geography is increasingly diverse. Farm cash receipts sources have shifted during the last 40 years (see Figure 2.3) with the percentage of farm income from livestock and related product sales dropping from 85 percent of total income in 1969 to 54 percent in 2012 while crop sales and miscellaneous income (e.g., home consumption, sales of forest products, and other farm related income such as agritourism sales) shares have expanded over that period. This picture is consistent with data that show county cattle herds have decreased in the last 15 years (see Figure 2.4) while major feed crops and grains have been stable or growing in recent years (see Figure 2.5). Whereas over half of farms were centered on beef and dairy cattle in 1997, they constitute just 35 percent of all farms in 2012 (see Figure 2.6). Area farmers have diversified into a variety of different crops, including fruits, vegetables, forage crops and specialty crops such as mushrooms, herbs, and flowers, and sod, and livestock such as horses, goats, sheep, alpacas, emus and other animal products such as honey. Local farms also account for a large share of local timber sales. Geographically, two distinct agricultural regions have emerged:
Figure 2.2 Fauquier County Farm Employment and Cash Receipts from Marketings, 1969-2012
Source: Bureau of Economic Analysis, Local Area Personal Income
0
10
20
30
40
50
60
70
80
0
500
1,000
1,500
2,000
2,500
3,000
1969
1971
1973
1975
1977
1979
1981
1983
1985
1987
1989
1991
1993
1995
1997
1999
2001
2003
2005
2007
2009
2011
Cas
h R
ecei
pts
(Mill
ions
$)
Em
ploy
men
t
Employment
Cash Receipts
4 National Agricultural Statistical Service, Census of Agriculture, Various Years.
11
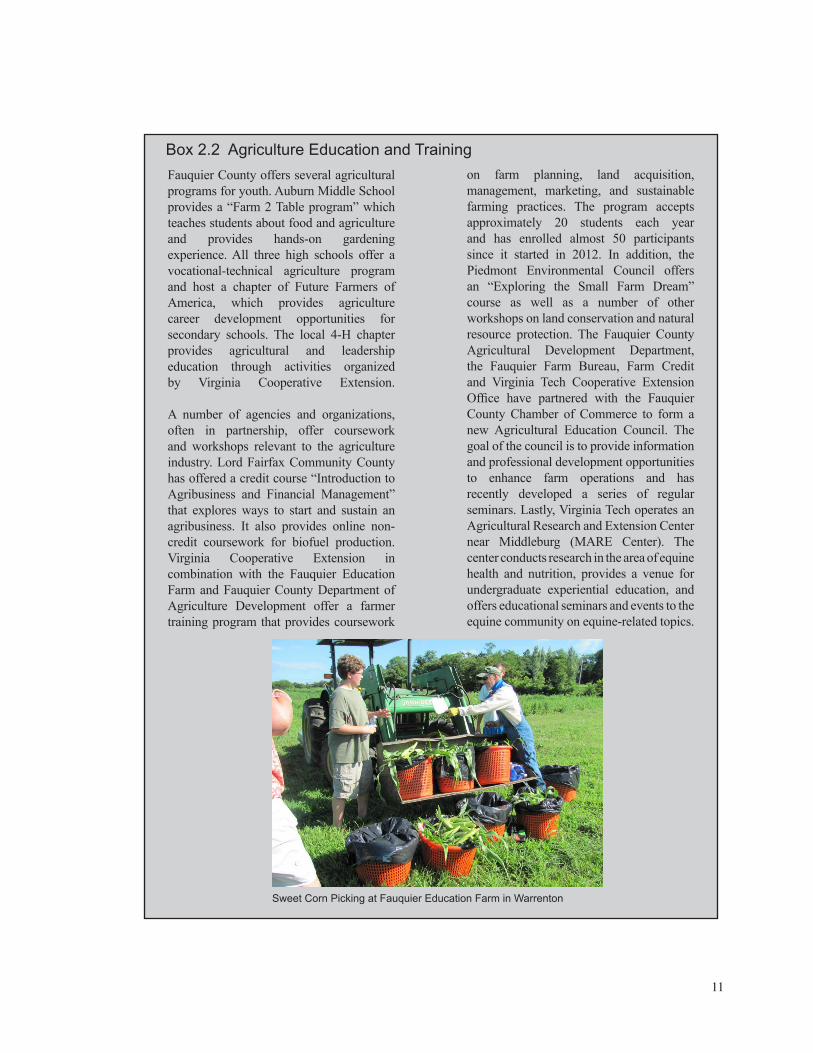
Fauquier County offers several agricultural programs for youth. Auburn Middle School provides a “Farm 2 Table program” which teaches students about food and agriculture and provides hands-on gardening experience. All three high schools offer a vocational-technical agriculture program and host a chapter of Future Farmers of America, which provides agriculture career development opportunities for secondary schools. The local 4-H chapter provides agricultural and leadership education through activities organized by Virginia Cooperative Extension.
A number of agencies and organizations, often in partnership, offer coursework and workshops relevant to the agriculture industry. Lord Fairfax Community County has offered a credit course “Introduction to Agribusiness and Financial Management” that explores ways to start and sustain an agribusiness. It also provides online non-credit coursework for biofuel production. Virginia Cooperative Extension in combination with the Fauquier Education Farm and Fauquier County Department of Agriculture Development offer a farmer training program that provides coursework
on farm planning, land acquisition, management, marketing, and sustainable farming practices. The program accepts approximately 20 students each year and has enrolled almost 50 participants since it started in 2012. In addition, the Piedmont Environmental Council offers an “Exploring the Small Farm Dream” course as well as a number of other workshops on land conservation and natural resource protection. The Fauquier County Agricultural Development Department, the Fauquier Farm Bureau, Farm Credit and Virginia Tech Cooperative Extension Office have partnered with the Fauquier County Chamber of Commerce to form a new Agricultural Education Council. The goal of the council is to provide information and professional development opportunities to enhance farm operations and has recently developed a series of regular seminars. Lastly, Virginia Tech operates an Agricultural Research and Extension Center near Middleburg (MARE Center). The center conducts research in the area of equine health and nutrition, provides a venue for undergraduate experiential education, and offers educational seminars and events to the equine community on equine-related topics.
Box 2.2 Agriculture Education and Training
Sweet Corn Picking at Fauquier Education Farm in Warrenton

12
0
10
20
30
40
50
60
70
80
90
100 19
69
1971
19
73
1975
19
77
1979
19
81
1983
19
85
1987
19
89
1991
19
93
1995
19
97
1999
20
01
2003
20
05
2007
20
09
2011
Per
cent
age
of T
otal
Cas
h R
ecei
pts
Year
Miscelleneous income
Government payments
Crops
Livestock and products
Figure 2.3 Fauquier County Cash Receipts by Source, Percentage of Total, 1969-2012
Source: Bureau of Economic Analysis, Local Area Personal Income
Figure 2.4 Fauquier County Cattle and Calf Inventory, 1975-2013
Source: U.S. Department of Agriculture, National Agricultural Statistics Service, Quickstats
0
10,000
20,000
30,000
40,000
50,000
60,000
70,000
80,000
1975
1977
1979
1981
1983
1985
1987
1989
1991
1993
1995
1997
1999
2001
2003
2005
2007
2009
2011
2013
Hea
d of
Cat
tle a
nd C
alve
s

13
Source: U.S. Department of Agriculture, National Agricultural Statistics Service, Census of Agriculture, Various Years
Figure 2.5 Fauquier County Grain Production, 1990-2013
0
0.2
0.4
0.6
0.8
1
1.2
1.4
1.6
1990
1992
1994
1996
1998
2000
2002
2004
2006
2008
2010
2012
Milli
ons o
f Bus
hels
Corn
Soybeans
Wheat
Barley
0 100 200 300 400 500 600
Olseed and grain farming
Vegetable and melon farming
Fruit and tree nut farming
Greenhouse, nursery, and floriculture
Other crop farming
Beef cattle ranching and farming
Cattle feedlots
Dairy catttle and milk production
Hog and pig farming
Poultry and egg production
Sheep and goat farming
Animal aquaculture and other animal production
Number of Farms
1997
2002
2007
2012
Source: U.S. Department of Agriculture, National Agricultural Statistics Service, Census of Agriculture, Various Years
Figure 2.6 Number of Fauquier County Farms by Industry Category, 1997-2012

14
traditional farms producing livestock and field crops are more common in the southern part of the county while a consumer and residential oriented non-traditional agriculture focusing on the horse industry, specialty agriculture, and agritourism is more prominent in the north in closer proximity to the major population centers, although many large livestock farms can be found there as well.
More Fauquier County farmers are also selling their products directly consumers and retailers. One-hundred and forty-three farms reported sales directly to consumers in 2012, up from 95 farms in 2007. Direct sales to consumers were $1.387 million in 2012, the fourth highest among Virginia counties but down from $1.748 million reported in 2007. In addition, 67 farms sold products directly to retail outlets. Local direct sales are supported by marketing and technical assistance initiatives such as the Fauquier Agriculture Development Department‘s HomeGrown program, the County’s “Buy Local” program, the Virginia Department of Agriculture and Consumer Services’ Virginia Grown program, the Piedmont Environmental Council’s “Buy Fresh, Buy Local” campaign, and the Virginia Cooperative Extension’s Community Food Systems program. The area also benefits from favorable conditions for local food sales such as close proximity to the burgeoning Washington, DC area, farmland availability, access to distribution systems, and favorable demographics.
Fauquier County offers a number of local food marketing venues. The county hosts three regular farmers markets that cover the northern, central, and southern regions. The Town of Warrenton sponsors the Warrenton Farmers Market on Saturdays from April to November in the Old Town section and a Wednesday Market from May through October near the Fauquier Hospital. The Archwood Green Barns Farmers Market is held is held indoors in a historic horse barn from April through November. The Southern Fauquier Farmers Market is held from May through October at the Liberty Station Center in Bealeton. Area farms utilize other distributional
channels as well. The Buckland Farm Market and Messick’s Farm Market are large, privately owned indoor stores that sell their own and area farm produce and products. Several area farms offer U-pick opportunities. Twelve farms use Community Supported Agriculture (CSA) to distribute their products according to the 2012 Census of Agriculture. CSAs offer fresh locally grown farm product allotments to consumers on a subscription basis.
Three additional industries are also closely connected with Fauquier County agriculture. A large local horse industry features numerous horse boarding, riding and training, and show and competition venues (see Box 2.3). But, less than half of the local horse population is located on a farm. Two primary processing industries, wineries (employing 122 in 2012) and animal slaughtering and processing (employing 23 in 2012) would likely not exist without area vineyards and livestock herds. Fauquier County has no other sizeable agricultural value-added activities. However, the potential exists to recruit or grow such industries based on favorable national growth trends and area needs (see Box 2.4).
The winery and horse industries have followed divergent paths in recent years. The most complete horse inventory surveys showed that the Fauquier equine population increased from 13,700 to 14,800 from 2001 to 2006. However, the most recent agriculture census indicated that the farm equine population contracted by 11.1% from 2007 to 2012 (from 6,060 to 5,457 equine).5
This pattern is supported further by employment data from the Virginia Employment Commission which reflects wages paid to employees covered by unemployment insurance (see Figure 2.7). It shows that horse and other equine farm production employment dropped precipitously in 2009 and had recovered little by 2012. On the other hand, winery employment more than tripled over the same period from 36 to 122 employees. 5 The Virginia Equine Survey (USDA, NASS 2008) measures
the entire county equine population while the Agriculture Census (USDA, NASS 2014) measures only the county farm-based equine population.
15
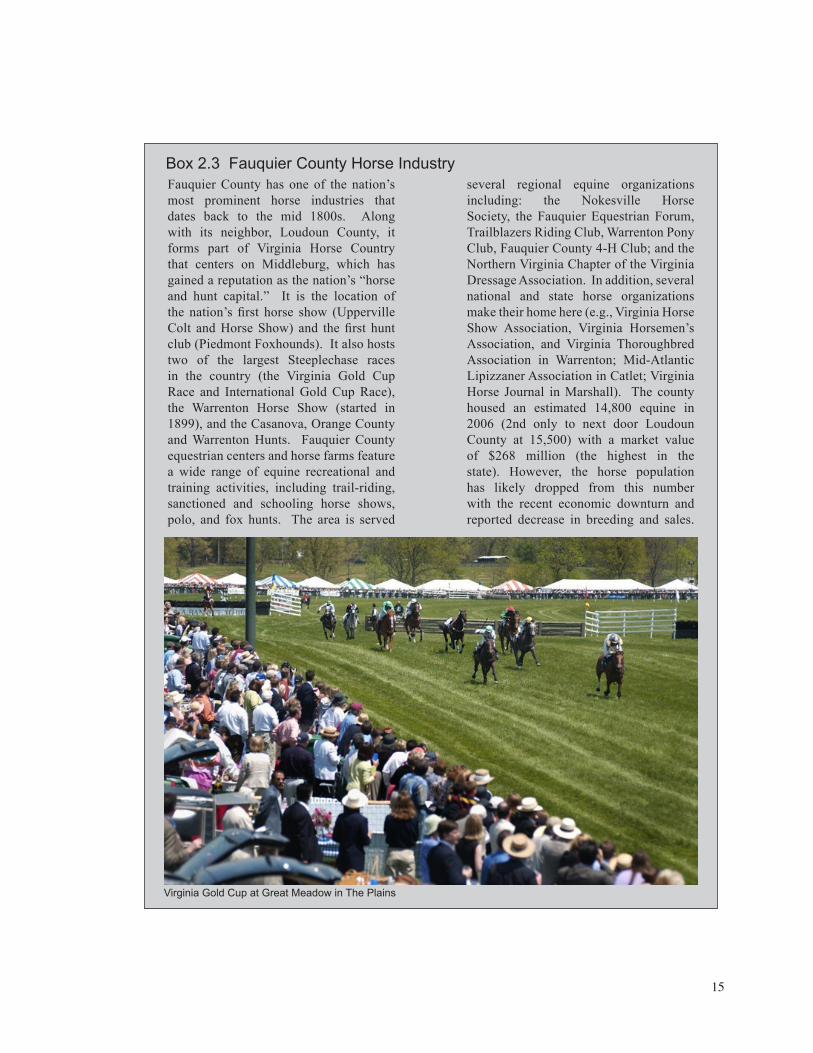
Fauquier County has one of the nation’s most prominent horse industries that dates back to the mid 1800s. Along with its neighbor, Loudoun County, it forms part of Virginia Horse Country that centers on Middleburg, which has gained a reputation as the nation’s “horse and hunt capital.” It is the location of the nation’s first horse show (Upperville Colt and Horse Show) and the first hunt club (Piedmont Foxhounds). It also hosts two of the largest Steeplechase races in the country (the Virginia Gold Cup Race and International Gold Cup Race), the Warrenton Horse Show (started in 1899), and the Casanova, Orange County and Warrenton Hunts. Fauquier County equestrian centers and horse farms feature a wide range of equine recreational and training activities, including trail-riding, sanctioned and schooling horse shows, polo, and fox hunts. The area is served
Box 2.3 Fauquier County Horse Industryseveral regional equine organizations including: the Nokesville Horse Society, the Fauquier Equestrian Forum, Trailblazers Riding Club, Warrenton Pony Club, Fauquier County 4-H Club; and the Northern Virginia Chapter of the Virginia Dressage Association. In addition, several national and state horse organizations make their home here (e.g., Virginia Horse Show Association, Virginia Horsemen’s Association, and Virginia Thoroughbred Association in Warrenton; Mid-Atlantic Lipizzaner Association in Catlet; Virginia Horse Journal in Marshall). The county housed an estimated 14,800 equine in 2006 (2nd only to next door Loudoun County at 15,500) with a market value of $268 million (the highest in the state). However, the horse population has likely dropped from this number with the recent economic downturn and reported decrease in breeding and sales.
Virginia Gold Cup at Great Meadow in The Plains

16
Industry targeting methods attempt to identify types of firms that would be good fits for a particular region based on industry characteristics and needs and that would also assist local economic development by offering favorable growth prospects and higher wages. Using screening criteria developed by Barkley and Henry (2009) and Deller (2009), we identified agriculture-related industries that met three of four conditions using IMPLAN data for Fauquier County: (1) industry employment grew over the period of 2008 to 2011, (2) industry employee compensation was above the average level of $47,793 found in Fauquier County, (3) the county demonstrates an advantage in the industry by having by a higher percentage of local employment in the industry as a share of total local employment than the share of the industry in the U.S. compared to total U.S. employment (also known as having a location quotient greater than one) and (4) the county imports at least $5 million in industry output from elsewhere. The rationale for using these criteria was to identify industries that grew in the face of
Industry
Employment Growth,
2008-2011
Average Compensation,
2011 ($)Location Quotient
Imports (Millions $)
Dog and cat food manufacturing 12.7 70,861 0.00 5.748Other animal food manufacturing 2.1 55,228 0.00 11.449Snack food manufacturing 9.8 53,750 0.00 7.352Breweries 7.8 84,370 0.00 7.324Wineries 18.0 52,736 9.31 8.172Environmental and other technical consulting services 24.0 55,082 2.19 0.0152Source: IMPLAN
recent economic headwinds, are relatively high paying, and which might find Fauquier County attractive because of pre-existing competitiveness or gaps in the local supply chain. Using these criteria, the following five agriculture-related industries were identified of which only wineries and environmental and other technical services were present in the county.
This list does not reflect the most recent year’s data or other local planning considerations. For example, Fauquier County now has a brewery called Old Bus Head Brewery at Vint Hill that opened this year. Also, the animal slaughtering and processing industry did not make the target list because of slightly lower average wages ($43,398) than the county average and a lower level of industry concentration in the county. However, the Fauquier County Agricultural Survey (Fauquier County Agricultural Development, 2013) showed strong farmer support for additional animal processing facilities in the county as farmers attempt to capture more direct to consumer or retailer markets for meat products.
Box 2.4 Agriculture-related Industry Targets for Fauquier County

17
Source: Virginia Employment Commission, Quarterly Census of Employment and Wages
Figure 2.7. Employment in Equine Production and Wineries
0
50
100
150
200
250
300
350
1990
1991
1992
1993
1994
1995
1996
1997
1998
1999
2000
2001
2002
2003
2004
2005
2006
2007
2008
2009
2010
2011
2012
Em
ploy
men
t
Horses and Other Equine Production
Wineries

18

19
SECTION 3DATA AND METHODOLOGY
This section describes how agriculture is defined for this study and the economic impact methodology used. We divide the Fauquier County agricultural economy into five different components that represent either farm production or activities closely identified and supported by area farms. These components include: (a) farm production, (b) vineyards and wineries, (c) animal slaughtering and processing, (d) the equine industry, and (e) agritourism. Farm production consists largely of traditional farm production, including livestock and crop production. To this we add timber sales, since a large portion of such sales originate from farms, and agricultural support services. Vineyards and wineries include grape as well as winery production. The equine industry is defined by the expenditures of equine owners on the care and use of their equine. The equine may be based on or off farms. Agritourism is defined by the expenditures of non-resident visitors on local goods and services when they visit local agriculture-related venues such as farms, horse shows and competitions, and wineries. Eighty-four farm respondents to the Fauquier County Agricultural Survey reported offering agritourism activities including farm tours, hayrides, petting zoos, corn mazes, pumpkin patches, events and festivals, camping, fishing, hunting, and horse riding, training and boarding (Fauquier County Agricultural Development 2013). Horse shows and competitions are held at 15 sites. Furthermore, there are 24 wineries in Fauquier County.
This study examines the economic impact of Fauquier County agriculture using input-output analysis, a research tool that allows one to quantify the impact of an economic activity or expenditure in a region.5 For this study, area agriculture-related
spending made on local goods and services are counted as direct injections into the local economy. Linkages with other industries in the area mean that this initial injection has further stimulative effects that result from the purchases of goods and services and payments to employees. The stimulus causes a “multiplier effect” that results when money is re-spent in the local economy.
This study uses IMPLAN (IMpact analysis for PLANning), an industry standard input-output model that has been utilized in many economic impact studies including similar studies of agriculture in other Virginia localities such as the City of Virginia Beach, the Danville Metropolitan Area, and Clarke County (Rephann et al. 2013; Rephann 2012; Lamie, Benson, and Pease 2005). Input output models are based on input-output tables, which show flows of purchases and sales among sectors of the economy (Miller and Blair 2009). Economic multipliers are derived from these tables. These multipliers allow one to measure the total impact of changes in agricultural and forestry activity on the local economy.
The total impact of this activity consists of three parts, a “direct effect,” “an indirect effect,” and an “induced effect” (see Figure 3.1). The “direct effect” consists of the injection of economic activity or expenditure into the region. For example, agricultural product sales in Fauquier County would count as the direct effect. This direct expenditure then causes a “ripple effect” on the local economy when money is re-spent. For instance, local businesses provide supplies and services to farms such as seeds, fertilizer, veterinarian services, utilities and insurance. These businesses spend a portion of their sales revenues on their supplies and services from other local firms who, in turn, purchase a portion of their supplies and services from other local firms. This cascading sequence of spending continues until the subsequent rounds of spending dissipate due to leakages in the form of spending outside the area. The cumulative effect of these cascading rounds of inter-industry purchases
5 Like most studies of this type, this one is called an economic impact study. From a technical standpoint the phrase “economic contribution” or “economic footprint” would better describe results of the analysis (Watson et al. 2007). An “economic contribution” analysis traces the gross economic activity that results from a given expenditure. It does not consider whether the expenditure used to generate the economic activity might have been used elsewhere in the economy to generate economic activity and gauge the comparative effect of that alternative activity.

20
is referred to as the “indirect effect.” The final component of total impact (the “induced effect” or “induced impact”) is attributable to the spending of households and other economic agents. For instance, businesses pay households for their labor services. These households and governments then purchase goods and services from area firms who in turn receive a portion of their labor, material and public service inputs from within the region. Again leakages occur at each round due to purchases of goods and services outside the area. The “induced effect” is the sum of the impacts associated with these household purchases.The first stage of estimating the economic impacts of agribusiness is to convert economic activity as measured by industry employment, sales, or consumer spending into local final demand. These conversions are performed with
IMPLAN. A more detailed description of the input data, including data sources and how the various components were mapped onto IMPLAN sectors is provided in Appendix A. In the second stage, adjustments are made to the model to ensure that inputs and outputs are not double counted.6 The third stage involves running the IMPLAN model and generating the results.
Figure 3.1 Economic Impact Diagram
Demand for Local Area Goods and Services
Total Economic Impact
Final Demand
Production of Goods and Services
Production of Inputs in Local Area Required
for Production
Iterative Production Requirements for
Production
EarningsReceipts
IncreaseEmployment
Production of Local AreaGoods and Services
Increased Consumption
Iterative Production Requirements for
Production
Direct Effect Induced Effect
Indirect Effect
6 Double counting occurs when you include the impact of a sector as a direct effect and then count it again as the indirect effect of another sector because it serves as an input to that sector. Double counting was avoided by suppressing interindustry purchases for the farm production and agricultural manufacturing sectors included. This suppression was accomplished by setting regional purchase coefficients (RPCs), which represent the portion of local demand purchased from local producers, to zero for each farm production and agricultural manufacturing sector in the model. This approach is recommend by Miller and Blair (2009), pp. 621-625.

21
Results are presented for three different economic measures (a) total sales or total industrial output, (b) value-added, and (c) employment. Total sales or industry output is the total value of industry production. It measures sales of intermediate inputs for use in production as well as sales of products to final consumers. Value added is a subset of total industrial output. It reflects only sales to final consumers and therefore avoids the
double counting that occurs when intermediate inputs are included. It is the most commonly used measure of economic activity. Value-added is the concept behind gross domestic product (GDP) and can be compared to the GDP numbers provided by the Bureau of Economic Analysis for states and metropolitan areas. Employment includes full-time and part-time. All dollar values reported are denominated in terms of 2014 dollars.

22
23
SECTION 4ECONOMIC IMPACTS
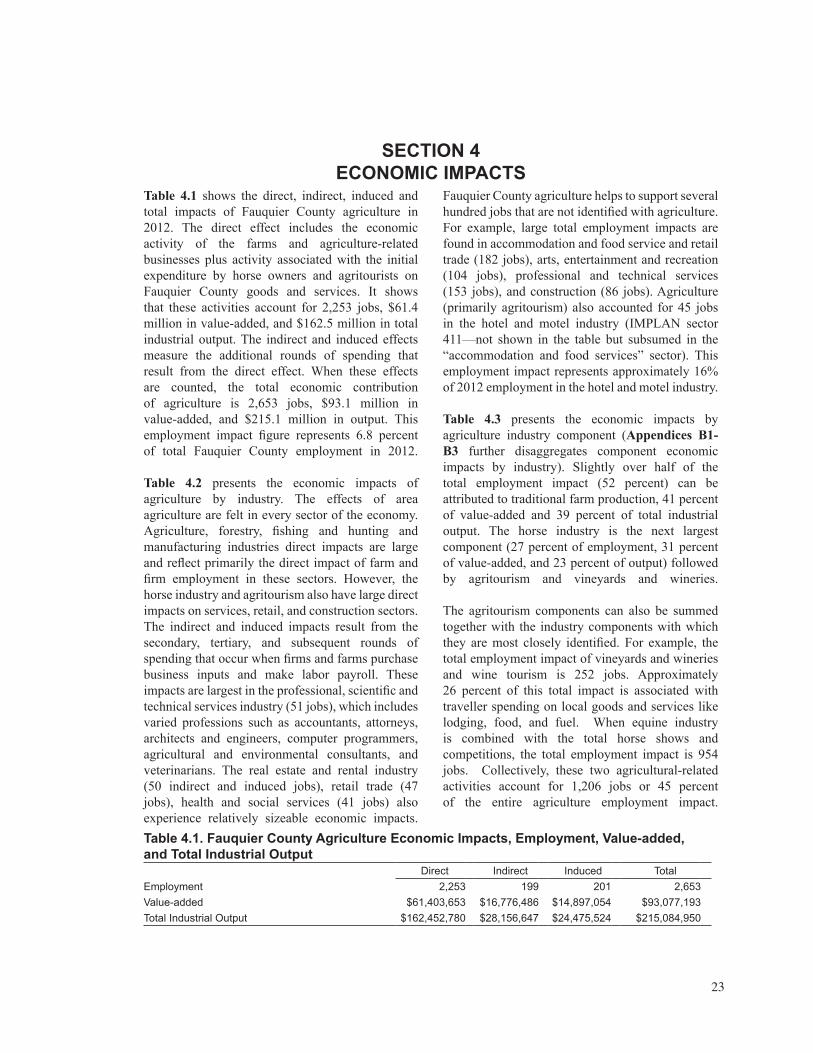
Table 4.1 shows the direct, indirect, induced and total impacts of Fauquier County agriculture in 2012. The direct effect includes the economic activity of the farms and agriculture-related businesses plus activity associated with the initial expenditure by horse owners and agritourists on Fauquier County goods and services. It shows that these activities account for 2,253 jobs, $61.4 million in value-added, and $162.5 million in total industrial output. The indirect and induced effects measure the additional rounds of spending that result from the direct effect. When these effects are counted, the total economic contribution of agriculture is 2,653 jobs, $93.1 million in value-added, and $215.1 million in output. This employment impact figure represents 6.8 percent of total Fauquier County employment in 2012.
Table 4.2 presents the economic impacts of agriculture by industry. The effects of area agriculture are felt in every sector of the economy. Agriculture, forestry, fishing and hunting and manufacturing industries direct impacts are large and reflect primarily the direct impact of farm and firm employment in these sectors. However, the horse industry and agritourism also have large direct impacts on services, retail, and construction sectors. The indirect and induced impacts result from the secondary, tertiary, and subsequent rounds of spending that occur when firms and farms purchase business inputs and make labor payroll. These impacts are largest in the professional, scientific and technical services industry (51 jobs), which includes varied professions such as accountants, attorneys, architects and engineers, computer programmers, agricultural and environmental consultants, and veterinarians. The real estate and rental industry (50 indirect and induced jobs), retail trade (47 jobs), health and social services (41 jobs) also experience relatively sizeable economic impacts.Table 4.1. Fauquier County Agriculture Economic Impacts, Employment, Value-added, and Total Industrial Output Direct Indirect Induced TotalEmployment 2,253 199 201 2,653Value-added $61,403,653 $16,776,486 $14,897,054 $93,077,193Total Industrial Output $162,452,780 $28,156,647 $24,475,524 $215,084,950
Fauquier County agriculture helps to support several hundred jobs that are not identified with agriculture. For example, large total employment impacts are found in accommodation and food service and retail trade (182 jobs), arts, entertainment and recreation (104 jobs), professional and technical services (153 jobs), and construction (86 jobs). Agriculture (primarily agritourism) also accounted for 45 jobs in the hotel and motel industry (IMPLAN sector 411—not shown in the table but subsumed in the “accommodation and food services” sector). This employment impact represents approximately 16% of 2012 employment in the hotel and motel industry.
Table 4.3 presents the economic impacts by agriculture industry component (Appendices B1-B3 further disaggregates component economic impacts by industry). Slightly over half of the total employment impact (52 percent) can be attributed to traditional farm production, 41 percent of value-added and 39 percent of total industrial output. The horse industry is the next largest component (27 percent of employment, 31 percent of value-added, and 23 percent of output) followed by agritourism and vineyards and wineries.
The agritourism components can also be summed together with the industry components with which they are most closely identified. For example, the total employment impact of vineyards and wineries and wine tourism is 252 jobs. Approximately 26 percent of this total impact is associated with traveller spending on local goods and services like lodging, food, and fuel. When equine industry is combined with the total horse shows and competitions, the total employment impact is 954 jobs. Collectively, these two agricultural-related activities account for 1,206 jobs or 45 percent of the entire agriculture employment impact.

24
Table 4.2 Fauquier County Agriculture Economic Impacts by Industry, Employment, Value-added, and Total Industrial Output Sector Direct Indirect Induced TotalEmploymentTotal 2,253 199 201 2,653Agriculture, forestry, fishing & hunting 1,520 0 0 1,520Mining 0 0 0 0Utilities 0 1 0 2Construction 75 9 2 86Manufacturing 145 2 0 147Wholesale trade 10 9 3 23Retail trade 135 5 42 182Transportation & warehousing 10 17 3 30Information 0 4 1 5Finance & insurance 9 21 15 44Real estate & rental 3 37 14 53Professional, scientific & technical services 102 39 12 153Management of companies 0 2 0 3Administrative & waste services 0 24 8 32Educational services 0 1 8 8Health & social services 0 0 41 41Arts, entertainment & recreation 88 8 8 104Accommodation & food services 149 9 23 182Other services 6 7 17 29Government & other 0 6 3 9 Value-added Total $61,403,653 $16,776,486 $14,897,054 $93,077,193Agriculture, forestry, fishing & hunting $29,371,355 $499 $2,449 $29,374,303Mining $0 $50,992 $2,009 $53,001Utilities $37,894 $692,084 $240,836 $970,814Construction $4,558,058 $549,382 $194,236 $5,301,676Manufacturing $5,574,666 $144,350 $13,051 $5,732,067Wholesale trade $1,307,649 $1,095,481 $417,216 $2,820,346Retail trade $8,566,754 $239,759 $2,022,470 $10,828,983Transportation & warehousing $329,085 $886,607 $160,654 $1,376,346Information $39,938 $559,817 $247,393 $847,148Finance & insurance $814,554 $2,813,604 $1,399,526 $5,027,684Real estate & rental $375,725 $4,632,904 $4,487,978 $9,496,607Professional, scientific & technical services $3,000,080 $2,767,234 $835,034 $6,602,347Management of companies $0 $262,943 $15,426 $278,370Administrative & waste services $0 $800,295 $290,013 $1,090,308Educational services $0 $14,592 $177,978 $192,570Health & social services $0 $13,330 $2,427,628 $2,440,958Arts, entertainment & recreation $1,139,160 $190,180 $191,576 $1,520,916Accommodation & food services $6,001,433 $302,707 $728,013 $7,032,153Other services $287,300 $343,452 $738,362 $1,369,114Government & other $0 $416,274 $305,207 $721,481

25
Table 4.2 (Continued)Sector Direct Indirect Induced TotalOutput Total $162,452,780 $28,156,647 $24,475,524 $215,084,950Agriculture, forestry, fishing & hunting $69,680,277 $1,200 $8,669 $69,690,146Mining $0 $74,008 $2,930 $76,938Utilities $61,105 $1,115,996 $388,352 $1,565,453Construction $7,748,463 $928,340 $293,431 $8,970,234Manufacturing $47,290,278 $975,288 $37,797 $48,303,363Wholesale trade $1,785,892 $1,496,128 $569,803 $3,851,822Retail trade $11,999,655 $338,597 $2,852,677 $15,190,928Transportation & warehousing $498,161 $2,035,030 $345,923 $2,879,114Information $70,336 $1,080,056 $460,505 $1,610,898Finance & insurance $1,255,607 $4,909,092 $3,088,751 $9,253,449Real estate & rental $577,756 $6,396,518 $6,610,538 $13,584,812Professional, scientific & technical services $5,672,807 $4,384,935 $1,289,012 $11,346,753Management of companies $0 $480,321 $28,179 $508,501Administrative & waste services $0 $1,529,342 $554,998 $2,084,339Educational services $0 $26,518 $288,847 $315,365Health & social services $0 $19,830 $4,071,178 $4,091,008Arts, entertainment & recreation $3,580,791 $438,796 $411,619 $4,431,206Accommodation & food services $11,606,292 $570,924 $1,370,245 $13,547,461Other services $625,361 $530,979 $1,187,139 $2,343,479Government & other $0 $824,750 $614,932 $1,439,682* Table direct, indirect, and induced columns may not sum exactly to total column due to rounding error

26
Table 4.3 Fauquier County Agriculture Economic Impacts by Component, Employment, Value-added, and Total Industrial OutputSector Direct Indirect Induced TotalEmploymentTotal 2253 199 201 2653Farm production 1232 60 78 1370Animal slaughtering and processing 23 6 4 33Vineyards and wineries 126 41 19 186Equine 593 45 73 711Agritourism 279 47 28 354 Wine tourism 54 7 5 66 Horse shows and competitions 188 35 20 243 Farm tourism 36 5 3 45 Value AddedTotal $61,403,653 $16,776,486 $14,897,054 $93,077,193Farm production $26,351,611 $6,300,066 $5,744,098 $38,395,775Animal slaughtering and processing $490,577 $440,164 $279,118 $1,209,858Vineyards and wineries $5,364,279 $3,490,993 $1,400,336 $10,255,608Equine $20,372,300 $3,386,355 $5,386,113 $29,144,769Agritourism $8,824,885 $3,158,908 $2,087,390 $14,071,183 Wine tourism $1,560,037 $477,744 $367,299 $2,405,080 Horse shows and competitions $6,203,291 $2,356,942 $1,470,128 $10,030,361 Farm tourism $1,061,558 $324,222 $249,963 $1,635,742 OutputTotal $162,452,780 $28,156,647 $24,475,524 $215,084,950Farm production $63,842,973 $10,626,087 $9,436,193 $83,905,253Animal slaughtering and processing $6,928,612 $778,415 $458,815 $8,165,843Vineyards and wineries $40,865,389 $5,871,000 $2,300,555 $49,036,943Equine $32,980,551 $5,546,238 $8,849,866 $47,376,654Agritourism $17,835,254 $5,334,906 $3,430,097 $26,600,257 Wine tourism $2,970,802 $794,133 $603,551 $4,368,485 Horse shows and competitions $12,846,714 $4,001,914 $2,415,805 $19,264,433 Farm tourism $2,017,738 $538,860 $410,741 $2,967,339

27
SECTION 5OTHER ECONOMIC CONTRIBUTIONS
Fauquier County agriculture’s effects on the community extend well beyond the economic impacts reported in this study. These other contributions are briefly discussed in the areas of “other economic impacts,” economic diversification, health, environment, education, and community engagement. We also address social costs that are sometimes connected to agricultural activities.
Other Economic Impacts
The economic impacts reported in the previous section did not fully capture some economic activities often identified with agriculture and related spin-off economic impacts. For instance, Fauquier County farmers derive some income from farm-related activities such as value-added products, renewable energy production, and federal and state government payments. According to the 2012 Agricultural Census, 119 Fauquier County farms produced value-added products and farms received $865,000 in federal government payments. The economic activity resulting from the spending of this income was not reported in the previous results. Also not included were parts of the “green industry” which has much in common with commercial agriculture. The green industry includes activities such as landscaping, golf course and sport facility turf grass maintenance services, and retail/wholesale trade and distribution of horticultural products such as garden centers and florists (Hughes and Hinson 2000). We also did not capture the full impact of agritourism in the local economy. Tourism associated with agriculturally themed events and festivals held at non-farm venues such as the Delaplane Strawberry Festival and Fall Farm Fest at Sky Meadows State Park and the Fauquier County Fair was not counted. Nor was tourism connected with fox hunting.
Fauquier County agriculture also likely creates some “synergistic” economic effects that are difficult to measure. While many visitors do not come to Fauquier County for the primary purpose of agritourism, the availability of agritourism venues likely boosts the attractiveness of the region for
general tourism and contributes toward the critical mass of activities needed to encourage longer stays and additional local spending. In a similar manner, farmer markets contribute to the buzz or ambience that supports other local businesses. Downtown farmers markets offer diverse vendors, unique specialty products, and entertainment options that attract additional customers to shopping districts. Some studies estimate that farmers markets generate sales for nearby businesses that are equal or more than the farmers market sales (Hughes et al. 2008).
Economic Diversification
Fauquier County agriculture helps to diversify the local economy. Such economic diversification can have a countercyclical employment effect. For instance, during the recent recession, Virginia agriculture was buoyed by increased international demand for food and fiber and higher prices brought on by drought elsewhere in the country. While Fauquier County total employment decreased from 37,654 in 2008 to 37,104 in 2010, farm employment actually increased from 1,383 to 1,531 during the same time period.
Health
A vibrant local farm sector can have a positive effect on local health and wellbeing of the community. Local food production can improve local food security and the availability of fresh, nutritious and high quality farm products. (Denckla Cobb 2011) Agricultural open space also provides accessible venues for outdoor recreation. The availability of these venues can possibly boost levels of household physical activity participation (Rephann 2011). For example, Rephann (2014) shows that the number of local equestrian and other horse competition events available is positively associated with the rate of local household participation in horse riding. Increased involvement in horse riding and other outdoor activities by local residents in turn could produce various physical, psychological, and other therapeutic benefits.

28
Environment
Fauquier County’s agriculture and forested landscape provides important environmental services to the community. These environmental benefits include improved water quality and flood control, air quality, conservation of wildlife habitat, and containment of urban sprawl. The more orderly development patterns resulting form open space preservation can help lower costs of development such as the provision of public utilities and reduce the costs associated with urbanization such as pollution and traffic congestion. Farm protection helps to preserve the scenic beauty of the region sustain agrarian and historic landscapes, and maintain a sense of place. Evidence suggests that farmland creates amenities for non-farm dwellers that support higher property values (Ready, Berger and Blomquist 1997).
Education
Fauquier County agriculture provides learning, experiential and recreational opportunities that promote educational, physical, and social benefits for children. For example, the Fauquier County 4-H program offers workshops, shows and competitions and camping activities for area youth. Involvement in 4-H can have a positive effect on youth including improved school performance, leadership skill development and enhanced self-esteem (Kress n.d.). Natural areas are also an important resource for children. The term “nature deficit disorder” was coined to describe the increasing alienation of children from nature due to the lack of “free play” opportunities in natural areas, partly attributable to the loss of nearby green space for exploration due to urban sprawl and poor urban planning (Louv 2005). As a result of the detachment from nature, children
have fewer experiential learning opportunities that build knowledge about science and environmental stewardship and may be more prone to physical and psychological disabilities and ailments such as attention deficit hyperactivity disorder (ADHD) and obesity. The preservation of natural landscapes may be important to child development.
Community Engagement
Many agriculture-related organizations help raise funds for worthwhile charitable causes. For instance, the Upperville Colt and Horse Show is a 501(c)(3) organization that donates its proceeds to local charities. Agricultural festivals and events also promote community social capital by building “community pride, sense of place, or identity, volunteerism, and the general benefit of pulling people together” (Marcoiller 1995).
Costs
We would not be complete without acknowledging social costs that can arise from unregulated farm activities or poor planning. For instance, agritourism visits, events, and festivals can increase automobile road volumes and traffic congestion and place higher demands on public safety personnel during peak activity periods (Crompton 2006). With increasing juxtaposition of farming and housing, more residents may complain about negative externalities such as smoke, odors, and chemical use. Poorly managed farmland can also contribute to water pollution. The adoption of Best Management Practices for crops and livestock can alleviate nutrient and sediment runoff that contributes to surface water and groundwater pollution.

29
REFERENCES
A Frank, Rimerman and Co., LLP. 2012. The economic impact of wine and wine grapes on the state of Virginia: 2010. Study for the Virginia Wine Board.
Barkley, David L. and Mark S. Henry. 2009. Targeting industry clusters for regional economic development: The REDRL approach. In Targeting regional economic development. Edited by Stephan J. Goetz, Steven Deller, and Tom Harris. New York: Routledge. pp. 183-197.
Brown, Kathi Ann, Walter Nicklin, and John T. Toler. 2008. 250 years in Fauquier County: A Virginia Story. Fairfax, VA: GMU Press
Crompton, John L. 2006. Economic impact studies: Instruments for political shenanigans? Journal of Travel Research 45, 1: 67-82.
Deller, Steven C. 2009. Import substitution and the analysis of gaps and disconnects. In Targeting regional economic development. Edited by Stephan J. Goetz, Steven Deller, and Tom Harris. New York: Routledge. pp. 365-388.
Denckla Cobb, Tanya. 2011. Virginia an emerging leader in nation’s local food movement. The Virginia News Letter 87, 6: 1-6.
Deloitte Consulting, LLP. 2005. The economic impact of the horse industry on the United States. American Horse Council.
Evans, Michael, Carol Pollard, and Grant Holder. 2008. Discover North Carolina wine: A wine tourism visitor profile study.
Fauquier County Agricultural Development. 2013. Fauquier County Agricultural Survey, Spring 2013.
Gamrat, Frank A. and Raymond D. Sauer. 2000. The utility of sport and returns to ownership: Evidence from the thoroughbred market. Journal of Sports Economics 1, 3: 219-235.
Hughes, David W. and Roger A. Hinson. 2000. Estimating the value of the green industry to Louisiana’s economy. Journal of Agribusiness 18, 2: 207-220.
Hughes, David W., Cheryl Brown, Stacy Miller, and Tom McConnell. 2008. Evaluating the economic impact of farmers’ markets using an opportunity cost framework. Journal of Agricultural and Applied Economics 40, 1: 253-265.
Kress, Cathann A. n.d. Does participation in a 4-H club make a difference in a young person’s life? http://www.umes.edu/cms300uploadedFiles/4-H-YES.pdf
Lamie, R. David, Matt Benson, and Jim Pease. 2005. The economic impact of the agriculture sector in Clarke County, Virginia.
Louv, Richard. 2005. Last child in the woods. Chapel Hill, NC: Algonquin Books of Chapel Hill.
30
Marcoulier, David. 1995. The community impacts of festivals and events. Community Economics Newsletter. https://www.aae.wisc.edu/pubs/cenews/docs/ce222.txt
Miller, Ronald E. and Peter D. Blair. 2009. Input-output analysis: Foundations and Extensions. 2nd Edition. New York: Cambridge University Press.
Minnesota Implan Group, Inc. 2004. Implan professional version 2.0: User’s guide, analysis guide, and data guide. Stillwater, MN.
Ready, Richard C., Mark C. Berger and Glenn C. Blomquist. 1998. Measuring amenity benefits from farmland: Hedonic pricing vs. contingent valuation. Growth and Change 28, 4: 438-458.
Rephann, Terance J. 2014. Appalachian Agricultural Exposition Center economic impact study. Charlottesville, VA: University of Virginia, Weldon Cooper Center for Public Service.
Rephann, Terance. J. 2013. The economic impacts of agriculture and forest industries in Virginia. Charlottesville, VA: University of Virginia, Weldon Cooper Center for Public Service.
Rephann, Terance J., James Ellis, Deborah Rexrode, and Casey Eggleston. 2013. Growing agribusiness: The contribution and development potential of agriculture and forest industry in the Danville Metropolitan Area. Charlottesville, VA: University of Virginia, Weldon Cooper Center for Public Service.
Rephann, Terance J. 2012. Agriculture in Virginia Beach: Impact on the City economy. Charlottesville, VA: University of Virginia, Weldon Cooper Center for Public Service.
Rephann, Terance J. 2011. The economic impact of the horse industry in Virginia. Charlottesville, VA: University of Virginia, Weldon Cooper Center for Public Service.
Swinker, Ann M., Peter R. Tozer, Martin L. Shields and Emily R. Landis. 2003. Pennsylvania’s equine industry inventory, basic economic and demographic characteristics. University Park, PA: Department of Dairy and Animal Science, College of Agricultural Sciences, Pennsylvania State University.
Thorvaldson, Jennifer, Dough Olson, and Greg Alward. 2011. Updating and enhancing IMPLAN’s econometric regional coefficients. Proceedings of the 2011 Mid-Continent Regional Science Association.
U.S. Department of Agriculture (USDA), National Agricultural Statistics Service (NASS). 2008. Virginia equine survey report: 2006.
U.S. Department of Agriculture (USDA), National Agricultural Statistics Service (NASS). 2014. 2012 census of agriculture. United States summary and state data. Volume 1, Geographic Area Series, Part 46. AC-12-A-46
Virginia Tourism Corporation. 2013. Travel data and profiles. http://www.vatc.org/research/travel-data/ (Accessed January 7, 2013).
Watson, Philip, Joshua Wilson, Dawn Thiemann, and Susan Winter. 2007. Determining economic contributions and impacts: What is the difference and why do we care? Journal of Regional Analysis and Policy 37, 2: 140-146.

31
APPENDIX ADATA SOURCES
We divide the Fauquier County agricultural economy into five components: (a) farm production, (b) vineyards and wineries, (c) animal slaughtering and processing, (d) the equine industry, and (e) agritourism. Farm production consists largely of traditional farm production, including livestock and crop production. To this we add agricultural support services and timber sales. The latter is included because a large portion of area sales originate from farms and silviculture is closely related to agriculture. Vineyards and wineries include grape as well as winery production. The equine industry is defined by the expenditures of equine owners on the care and use of their equine. The equine may be based on or off farms. Agritourism is defined by the expenditures of non-resident visitors on local goods and services (excluding agricultural goods to avoid double counting) when they visit local agriculture-related venues such as farms, horse shows and competitions, and wineries. The data sources for each component and IMPLAN sector mapping for each component is summarized in Table A.1. The manner in which the data was used to construct IMPLAN data inputs is described in greater detail further below.
For the farm production component, market values of agricultural products sold in 2012 from Table 2. (Market Value of Agricultural Products Sold Including Direct Sales) of the Census of Agriculture were assigned to the corresponding IMPLAN sectors. Sales for IMPLAN sector 15 (Forestry nurseries, forest products, and timber tracts) were estimated using tax data from the Virginia Department of Forestry for the value of standing timber, also known as forest stumpage. Finally, Virginia Employment Commission Quarterly Census of Employment and Wages (QCEW) employment file was used to identify employment in business establishments providing support activities for animal and crop production. These figures were adjusted by a proportionality factor using IMPLAN and QCEW data to estimate proprietors not counted in the employment security records.
For the vineyards and winery component, the Virginia Employment Commission Quarterly Census of Employment and Wages (QCEW) employment file was used to identify employment in wineries. The Census of Agriculture does not report grape sales by county, but it does report statewide sales of $9,466,000 and grape crop acreage by county. Therefore, we estimated the value of Fauquier County vineyard grape sales based on its share of state grape bearing acres (5.25 percent or $497,009). QCEW employment data was also used to identify employment in animal slaughtering and processing establishments.
Horse operations and households owning horses are another important component of Fauquier County agriculture. This equine industry component is treated differently from the agricultural product sector. It captures all expenditures involved in maintaining and supporting horses, donkeys, mules, and burros. Most horse owners value horses beyond their income producing value as evidenced by studies that show that owners incur significant net operating losses on average (Deloitte Consulting 2005; Swinker et al. 2003; Gamrat and Sauer 2000). Therefore, expenditures on horses are used as the basis for estimating economic impact rather than horse sales. However, since horse and other equine sales are considered part of IMPLAN Sector 14 (Animal production, except cattle and poultry), they were backed out of Sector 14 sales for the farm production component using data on equine sales in 2012 from Table 18 (Equine—Inventory and Sales: 2012 and 2007) of the Census of Agriculture so as not to double-count.
Equine sales were, however, used to estimate the direct output of Sector 14 for the equine industry. In order to make the farm sales representative of all county-wide sales, we extrapolated farm-based sales based on the farm based equine inventory to total county inventory. The indirect and induced impacts of the equine industry, on the other hand, were estimated using a method called “Analysis-by-parts” (ABP). This method separates the economic

32
impact modeling into two tasks: modeling the purchase of goods and services from local firms as an expenditure for IMPLAN industries and the payment of wages and salaries as an increase in labor income. We estimated county equine expenditures
using data from the National Agricultural Statistics Service. Average expenditures per equine were obtained from the 2006 Virginia Equine Survey (U.S. Department of Agriculture, National Agricultural Statistics Service 2008). The same survey estimated
Table A.1 Data Sources and IMPLAN Assignments by ComponentComponent Data Sources IMPLAN Assignment
Farm production
National Agricultural Statistics Service, 2012 Census of Agriculture; Virginia Employment Commission, Quarterly Census of Employment and Wages (QCEW), 2012; Virginia Department of Forestry (VDAF), 2012
Agriculture Census sales data was used for IM-PLAN Sectors 1 (Oilseed farming), 2 (Grain farm-ing), 3 (Vegetable and melon farming), 4 (Fruit farming), 6 (Greenhouse, nursery, and floriculture production), 10 (All other crop farming), 11 (Cattle ranching and farming), 12 (Dairy cattle and milk production), 13 (Poultry and egg production) and 14 (Animal production, except cattle and poultry and eggs). VDAF tax data was used to estimate output for IMPLAN Sector 15 (Forest nurser-ies, forest products, and timber tracts); QCEW employment data was used to estimate employ-ment IMPLAN Sector 19 (Support activities for agriculture and forestry).
Vineyards and Wineries
Virginia Employment Commission, QCEW, 2012; National Agricultural Statistics Service, 2012 Census of Agriculture
QCEW employment data was used for IMPLAN sector 72 (Wineries) and sales estimates based on agriculture census information was used for IMPLAN sector 4 (Fruit farming)
Animal Slaughtering and Processing
Virginia Employment Commission, QCEW, 2012
IMPLAN sector: 59 (Animal, except poultry, slaughtering, rendering, and processing)
Equine
National Agricultural Statistics Service, 2006 Virginia Equine Survey Report expenditures adjusted for inflation and 2006 Virginia Equine Survey Report estimated horse inventory adjusted downward to reflect 11.1% 2007-2012 drop in county farm-based equine population according to 2012 Census of Agriculture
Expenditures were mapped to IMPLAN catego-ries using equine budget information and other information as explained on page 28 of Rephann (2011).
Agritourism
Fauquier County Agricultural Survey (2013); Telephone contacts with horse show and competition venues; Rephann (2011) horse show and competition expenditures adjusted for inflation; A. Frank, Rimerman an Co. LLP (2012); Virginia Tourism Corporation (2013)
Visitor figures estimated from Fauquier County Agricultural Survey, information obtained from Fauquier County horse show and competition venues, and estimation of winery visitors based on A, Frank, Rimerman and Co., LLP (2012); Visitor expenditure patterns were based on data from Virginia Tourism Corporation (2013) and Rephann (2011). Expenditure patterns were mapped onto the following IMPLAN sectors: 323, 326-330 (retail stores), 335 (transport by truck), 362 (automotive equipment rental and leasing), 379 (veterinary ser-vices), 402-410 (amusement and recreation), 411 (hotels and motels), 412 (other accommodations), 413 (food services and drinking places)

33
the Fauquier County horse inventory at 14,600 in 2006. This inventory figure was decreased by 11.1% based on the drop in Fauquier County farm-based equine from the 2012 and 2007 Censuses of Agriculture. This inventory of 13,158 equine was then multiplied by an average expenditure pattern adjusted for inflation to obtain total equine expenditures. The expenditures by category of were then assigned to IMPLAN industries using the same crosswalk as used in Rephann (2011). Since, the equine survey did not reported the proportion of expenditures made in Virginia but not locally, we estimated these proportions using IMPLAN Regional Purchase Coefficients (RPCs). RPCs represent the share of industry demand that is provided by area producers and are estimated within IMPLAN using a trade flow method described in Thorvaldson, Olson, and Alward (2011).
Agritourism is a particularly important and growing feature of Fauquier County agriculture. Agritourism as defined here included non-resident farm visitors (e.g., hunting, tours, pumpkin patches, petting zoos, trail riding, horse boarding and training), horse shows and competition attendees (e.g., hunters, jumpers, dressage, steeplechase) and winery visitors. We estimate these different facets with varying degrees of precision. Since this category is the least satisfactory in terms of quality of data, we strived to provide conservative estimates. Farm agritourism estimates (102,735) are computed based on non-winery and horse show/competition venue responses to the Fauquier County Agriculture Survey conducted by the Fauquier County Agriculture Department. No effort was made to impute the visitation figures for incomplete surveys or non-responding farms. Therefore, the visitor figures provide a conservative estimate of actual county farm visitors. Winery visitations are based on the average number of winery visitations per Virginia winery (8,383) from a recent statewide winery economic impact study (A Frank, Rimerman and Co., LLP. 2012) and average residential visitor patterns reported by two wineries that responded to the Fauquier County Agriculture Survey. Since visitors can be expected to visit more than one local winery as part of a local winery tour, each visitor was assumed to attend an average 1.79 county
wineries based on a survey of North Carolina winery visitors (Evans, Pollard, and Holder 2008). Therefore, the total visitor headcount was divided by 1.79 to producing an unduplicated visitor estimate of 112,398 to the county’s 24 wineries. For horse shows and competitions, we obtained attendance headcounts and/or 2013 event calendars from 15 Fauquier County venues that totaled 90 events. We obtained attendance headcounts for the largest events such as the Upperville Horse and Colt Show, the Virginia Gold and International Cups, and Warrenton Horse Show as well as all polo and hunter/jumper events hosted at the Great Meadow. For smaller venues we obtained calendar events and estimated their size based on average attendance at similar venues from The Economic Impact of the Horse Industry in Virginia (Rephann 2011). Residential visitor patterns were also drawn from that study. We estimate that there were 110,846 horse show and competition non-resident attendees, including 3,652 horse show and competition participants and 107,194 spectators. Therefore, in total, we estimate approximately 326 thousand non-resident visitors roughly evenly divided among the three types of venues.
Not all agritourism visitors to Fauquier County are there for the primary purpose of agritourism. There are likely numerous other reasons for visiting such as conducting business, attending a trade show or convention, visiting a state park, attending a high school reunion or visiting family members. We heed the advise of Crompton (2006) to not include such “casual” visitors) when computing the non-resident agritourism visitor headcount. Therefore, we incorporate an additional adjustment to count only those who likely visited the area for the specific purpose of attending the agritourism event or venue. We based the percentage of such visitors on figures obtained from survey data of horse shows and competitions derived from The Economic Impact of the Horse Industry in Virginia (Rephann 2011). According to that survey, 78.15% of in-state, out-of-county and 90.32% of out-of-state participants were in the show host area specifically to attend the event and 72.04% of in-state, out-of-county and 96.43% of out-of-state spectators were in the show host area specifically to attend the event.
34
We used these percentages to trim the tourism estimates. For horse shows and competitions, we applied these percentages to the participant and spectator estimates by residence. For winery tourism and farm tourism, we applied the spectator percentages to the visitor estimates by residence.
To estimate agritourism expenditures, we used the adjusted estimates for in-state and out-of-state visitors combined with expenditure patterns for non-resident agritourists. Estimates of average trip expenditures for Fauquier County agritourists were not available. For winery and farm visitors, we used 2013 leisure traveller expenditure estimates provided by market research firm TNS to the Virginia Tourism Corporation (Virginia Tourism Corporation 2013). These estimates are based on survey data for households that travelled at least 50 miles to arrive at a destination in Virginia. These TNS traveller spending estimates are often used in tourism economic impact studies when tailor made survey results are not available. Since the estimates do not disaggregate spending by residence or identify
the location of spending, this information was estimated for the purposes of this analysis. The average daily spending for a travel party averaging 2.6 individuals was $82.68. We assumed that in-state visitors spent an average 1.2 days in the local area and out-of-state visitors an average 2.3 days.
For horse shows and competitions, attendee expenditures were estimated based on residency and whether they attended as a participant and spectators. Estimates of average participant and attendee spending at equestrian events were obtained from a horse event attendance survey conducted as a part of the Virginia horse industry economic impact study (Rephann 2011). It consisted of surveys of 365 horse show and competition attendees conducted by on-site interviews at eight randomly sampled horse shows and competitions around the state. We account for the fact that spending is generally much higher for participants in equestrian activities than spectators because of the additional costs associated with showing, transporting, sheltering, feeding, and caring for the horses.

35
App
endi
x B
.1 F
auqu
ier C
ount
y A
gric
ultu
re D
irect
and
Tot
al E
cono
mic
Impa
cts
by C
ompo
nent
and
Indu
stry
Des
crip
tion
Farm
pr
oduc
tion
Ani
mal
sl
augh
terin
g an
d pr
oces
sing
Vine
yard
s an
d w
iner
ies
Equ
ine
Win
e to
uris
m
Hor
se s
how
s an
d co
mpe
titio
nsFa
rm
tour
ism
Tota
l
Dire
ct E
mpl
oym
ent I
mpa
ctTo
tal
1,23
223
126
593
5418
836
2,25
3A
gric
ultu
re, f
ores
try, fi
shin
g &
hun
ting
1,23
20
428
40
00
1,52
0M
inin
g0
00
00
00
0U
tiliti
es0
00
00
00
0C
onst
ruct
ion
00
075
00
075
Man
ufac
turin
g0
2312
20
00
014
5W
hole
sale
trad
e0
00
100
00
10R
etai
l tra
de0
00
105
619
413
5Tr
ansp
orta
tion
& w
areh
ousi
ng0
00
06
04
10In
form
atio
n0
00
00
00
0Fi
nanc
e &
insu
ranc
e0
00
90
00
9R
eal e
stat
e &
rent
al0
00
30
00
3P
rofe
ssio
nal,
scie
ntifi
c &
tech
nica
l ser
vice
s0
00
970
50
102
Man
agem
ent o
f com
pani
es0
00
00
00
0A
dmin
istra
tive
& w
aste
ser
vice
s0
00
00
00
0E
duca
tiona
l ser
vice
s0
00
00
00
0H
ealth
& s
ocia
l ser
vice
s0
00
00
00
0A
rts, e
nter
tain
men
t & re
crea
tion
00
01
1758
1288
Acc
omm
odat
ion
& fo
od s
ervi
ces
00
08
2110
614
149
Oth
er s
ervi
ces
00
00
40
26
Gov
ernm
ent &
oth
er0
00
00
00
0

36
App
endi
x B
.1 (C
ontin
ued)
Des
crip
tion
Farm
pr
oduc
tion
Ani
mal
sl
augh
terin
g
and
proc
essi
ngVi
neya
rds
and
win
erie
sE
quin
eW
ine
tour
ism
Hor
se s
how
s an
d co
mpe
titio
nsFa
rm
tour
ism
Tota
l
Tota
l Em
ploy
men
t Im
pact
Tota
l1,
370
3318
671
166
243
452,
653
Agr
icul
ture
, for
estry
, fish
ing
& h
untin
g1,
233
04
284
00
01,
520
Min
ing
00
00
00
00
Util
ities
10
00
00
02
Con
stru
ctio
n4
02
770
20
86M
anuf
actu
ring
123
122
00
00
147
Who
lesa
le tr
ade
30
612
01
023
Ret
ail t
rade
171
512
47
245
182
Tran
spor
tatio
n &
war
ehou
sing
61
73
62
430
Info
rmat
ion
10
22
01
05
Fina
nce
& in
sura
nce
161
319
15
044
Rea
l est
ate
& re
ntal
261
514
15
153
Pro
fess
iona
l, sc
ient
ific
& te
chni
cal s
ervi
ces
121
1111
32
131
153
Man
agem
ent o
f com
pani
es0
02
00
00
3A
dmin
istra
tive
& w
aste
ser
vice
s7
15
91
71
32E
duca
tiona
l ser
vice
s3
01
30
10
8H
ealth
& s
ocia
l ser
vice
s16
14
151
41
41A
rts, e
nter
tain
men
t & re
crea
tion
40
26
1862
1210
4A
ccom
mod
atio
n &
food
ser
vice
s10
13
1922
111
1518
2O
ther
ser
vice
s8
13
84
33
29G
over
nmen
t & o
ther
30
12
02
09
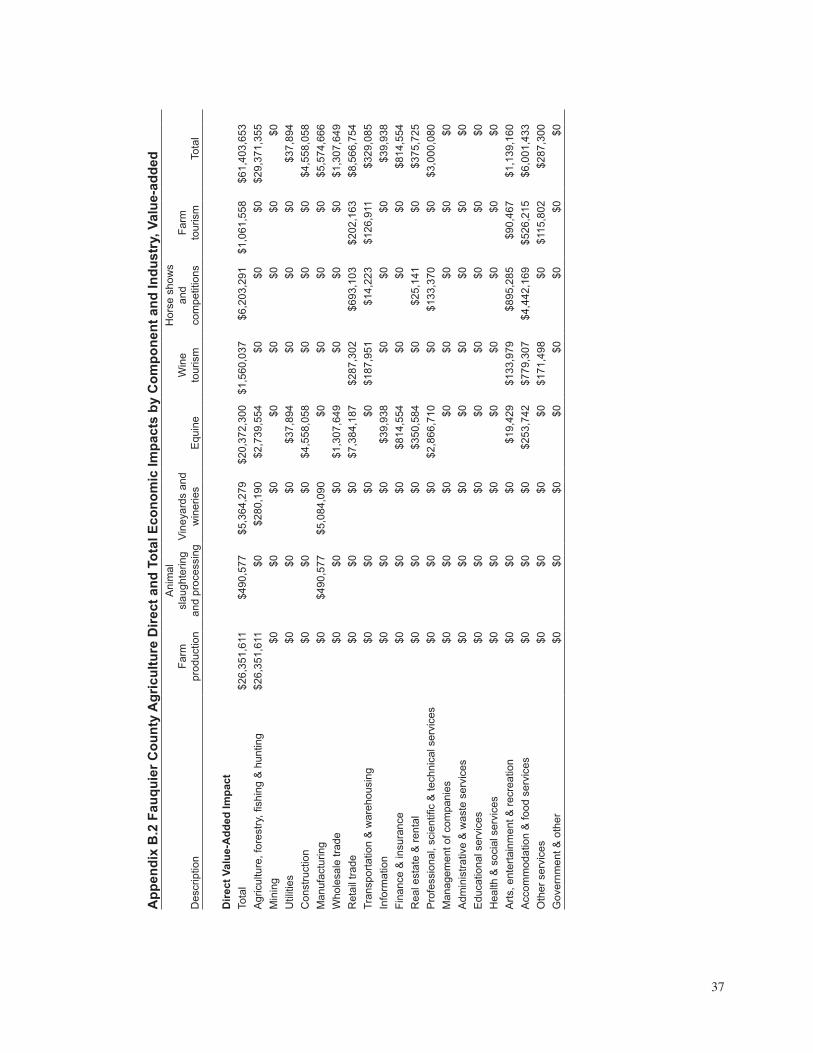
37
App
endi
x B
.2 F
auqu
ier C
ount
y A
gric
ultu
re D
irect
and
Tot
al E
cono
mic
Impa
cts
by C
ompo
nent
and
Indu
stry
, Val
ue-a
dded
Des
crip
tion
Farm
pr
oduc
tion
Ani
mal
sl
augh
terin
g
and
proc
essi
ngVi
neya
rds
and
win
erie
sE
quin
eW
ine
tour
ism
Hor
se s
how
s an
d co
mpe
titio
nsFa
rm
tour
ism
Tota
l
Dire
ct V
alue
-Add
ed Im
pact
Tota
l$2
6,35
1,61
1$4
90,5
77$5
,364
,279
$20,
372,
300
$1,5
60,0
37$6
,203
,291
$1,0
61,5
58$6
1,40
3,65
3A
gric
ultu
re, f
ores
try, fi
shin
g &
hun
ting
$26,
351,
611
$0$2
80,1
90$2
,739
,554
$0$0
$0$2
9,37
1,35
5M
inin
g$0
$0$0
$0$0
$0$0
$0U
tiliti
es$0
$0$0
$37,
894
$0$0
$0$3
7,89
4C
onst
ruct
ion
$0$0
$0$4
,558
,058
$0$0
$0$4
,558
,058
Man
ufac
turin
g$0
$490
,577
$5,0
84,0
90$0
$0$0
$0$5
,574
,666
Who
lesa
le tr
ade
$0$0
$0$1
,307
,649
$0$0
$0$1
,307
,649
Ret
ail t
rade
$0$0
$0$7
,384
,187
$287
,302
$693
,103
$202
,163
$8,5
66,7
54Tr
ansp
orta
tion
& w
areh
ousi
ng$0
$0$0
$0$1
87,9
51$1
4,22
3$1
26,9
11$3
29,0
85In
form
atio
n$0
$0$0
$39,
938
$0$0
$0$3
9,93
8Fi
nanc
e &
insu
ranc
e$0
$0$0
$814
,554
$0$0
$0$8
14,5
54R
eal e
stat
e &
rent
al$0
$0$0
$350
,584
$0$2
5,14
1$0
$375
,725
Pro
fess
iona
l, sc
ient
ific
& te
chni
cal s
ervi
ces
$0$0
$0$2
,866
,710
$0$1
33,3
70$0
$3,0
00,0
80M
anag
emen
t of c
ompa
nies
$0$0
$0$0
$0$0
$0$0
Adm
inis
trativ
e &
was
te s
ervi
ces
$0$0
$0$0
$0$0
$0$0
Edu
catio
nal s
ervi
ces
$0$0
$0$0
$0$0
$0$0
Hea
lth &
soc
ial s
ervi
ces
$0$0
$0$0
$0$0
$0$0
Arts
, ent
erta
inm
ent &
recr
eatio
n$0
$0$0
$19,
429
$133
,979
$895
,285
$90,
467
$1,1
39,1
60A
ccom
mod
atio
n &
food
ser
vice
s$0
$0$0
$253
,742
$779
,307
$4,4
42,1
69$5
26,2
15$6
,001
,433
Oth
er s
ervi
ces
$0$0
$0$0
$171
,498
$0$1
15,8
02$2
87,3
00G
over
nmen
t & o
ther
$0$0
$0$0
$0$0
$0$0

38
App
endi
x B
.2 (C
ontin
ued)
Des
crip
tion
Farm
pr
oduc
tion
Ani
mal
sla
ught
erin
g an
d pr
oces
sing
Vine
yard
s an
d w
iner
ies
Equ
ine
Win
e to
uris
m
Hor
se s
how
s an
d co
mpe
titio
nsFa
rm to
uris
mTo
tal
Tota
l Val
ue-A
dded
Impa
ct
To
tal
$38,
395,
775
$1,2
09,8
58$1
0,25
5,60
8$2
9,14
4,76
9$2
,405
,080
$10,
030,
361
$1,6
35,7
42$9
3,07
7,19
3A
gric
ultu
re, f
ores
try, fi
shin
g &
hun
ting
$26,
352,
706
$63
$280
,475
$2,7
40,6
13$7
5$3
20$5
1$2
9,37
4,30
3M
inin
g$2
1,73
9$1
88$1
,132
$28,
765
$170
$891
$116
$53,
001
Util
ities
$383
,526
$28,
778
$180
,124
$200
,585
$25,
446
$135
,081
$17,
274
$970
,814
Con
stru
ctio
n$2
81,3
98$2
5,69
2$1
42,3
90$4
,706
,249
$19,
906
$112
,525
$13,
516
$5,3
01,6
76
Man
ufac
turin
g$6
8,49
1$4
91,8
65$5
,110
,109
$34,
650
$4,2
56$1
9,80
6$2
,889
$5,7
32,0
67W
hole
sale
trad
e$4
33,1
53$4
1,38
4$6
96,9
74$1
,546
,626
$18,
598
$70,
974
$12,
636
$2,8
20,3
46R
etai
l tra
de$8
10,6
98$3
9,74
1$2
19,9
83$8
,265
,963
$342
,361
$910
,609
$239
,628
$10,
828,
983
Tran
spor
tatio
n &
war
ehou
sing
$323
,330
$76,
970
$369
,461
$175
,162
$204
,422
$88,
883
$138
,118
$1,3
76,3
46In
form
atio
n$1
40,9
26$1
6,47
6$1
94,9
39$2
82,2
49$3
3,91
3$1
55,6
19$2
3,02
7$8
47,1
48Fi
nanc
e &
insu
ranc
e$2
,245
,536
$74,
468
$274
,841
$1,8
73,3
18$6
7,33
8$4
46,3
37$4
5,84
7$5
,027
,684
Rea
l est
ate
& re
ntal
$4,2
31,4
41$1
37,0
67$1
,030
,552
$2,7
65,7
33$2
27,2
80$9
49,9
55$1
54,5
79$9
,496
,607
Pro
fess
iona
l, sc
ient
ific
& te
chni
cal s
ervi
ces
$815
,862
$106
,884
$798
,567
$3,9
23,1
76$1
32,9
43$7
34,7
30$9
0,18
6$6
,602
,347
Man
agem
ent o
f com
pani
es$1
2,22
4$1
6,09
7$1
90,2
43$2
3,43
7$5
,519
$27,
113
$3,7
38$2
78,3
70A
dmin
istra
tive
& w
aste
ser
vice
s$2
43,1
18$2
9,61
6$1
63,7
26$3
29,0
15$5
0,70
6$2
39,7
21$3
4,40
7$1
,090
,308
Edu
catio
nal s
ervi
ces
$68,
875
$3,4
77$1
6,90
3$6
7,17
5$4
,892
$27,
919
$3,3
29$1
92,5
70H
ealth
& s
ocia
l ser
vice
s$9
35,9
38$4
5,45
8$2
28,8
47$8
89,0
71$5
9,83
9$2
41,0
84$4
0,72
3$2
,440
,958
Arts
, ent
erta
inm
ent &
recr
eatio
n$8
9,65
9$6
,526
$31,
043
$113
,603
$166
,314
$1,0
01,4
34$1
12,3
37$1
,520
,916
Acc
omm
odat
ion
& fo
od s
ervi
ces
$328
,577
$25,
222
$103
,324
$606
,456
$811
,394
$4,6
09,1
73$5
48,0
06$7
,032
,153
Oth
er s
ervi
ces
$352
,560
$27,
136
$136
,480
$378
,503
$202
,595
$134
,911
$136
,929
$1,3
69,1
14G
over
nmen
t & o
ther
$256
,018
$16,
750
$85,
494
$194
,423
$27,
114
$123
,277
$18,
405
$721
,481
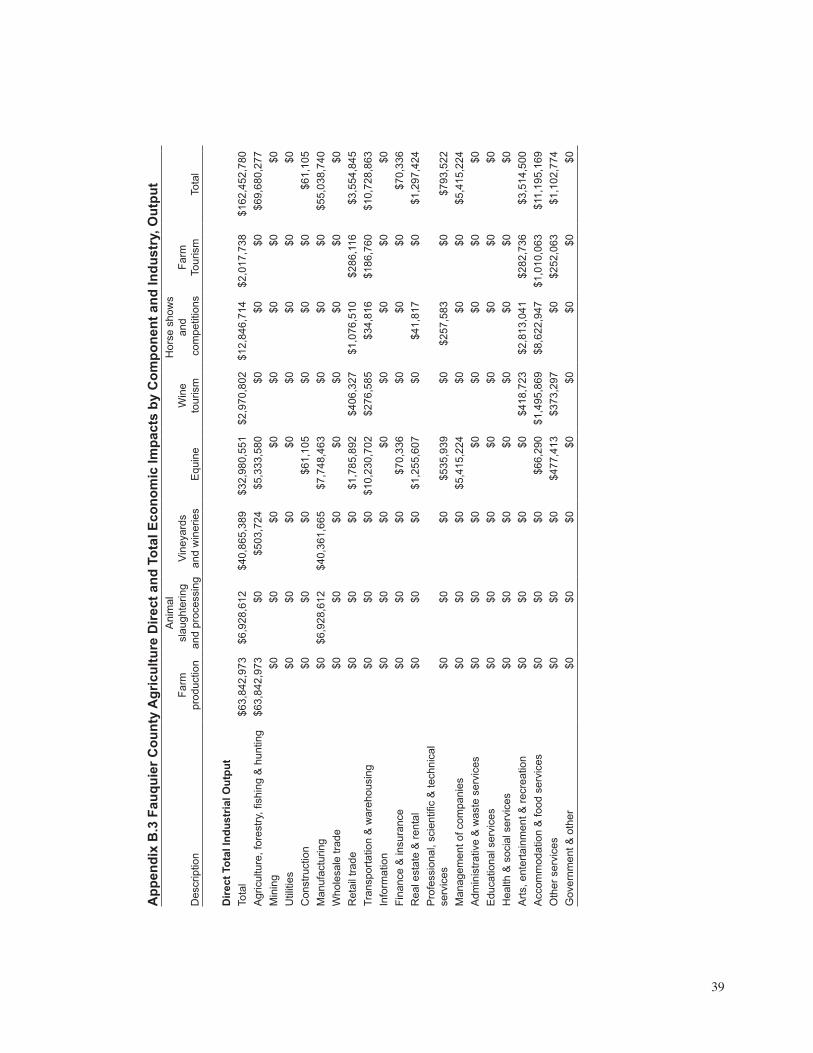
39
App
endi
x B
.3 F
auqu
ier C
ount
y A
gric
ultu
re D
irect
and
Tot
al E
cono
mic
Impa
cts
by C
ompo
nent
and
Indu
stry
, Out
put
Des
crip
tion
Farm
pr
oduc
tion
Ani
mal
sl
augh
terin
g an
d pr
oces
sing
Vine
yard
s an
d w
iner
ies
Equ
ine
Win
e to
uris
m
Hor
se s
how
s an
d c
ompe
titio
nsFa
rm
Tour
ism
Tota
l
Dire
ct T
otal
Indu
stria
l Out
put
Tota
l$6
3,84
2,97
3$6
,928
,612
$40,
865,
389
$32,
980,
551
$2,9
70,8
02$1
2,84
6,71
4$2
,017
,738
$162
,452
,780
Agr
icul
ture
, for
estry
, fish
ing
& h
untin
g$6
3,84
2,97
3$0
$503
,724
$5,3
33,5
80$0
$0$0
$69,
680,
277
Min
ing
$0$0
$0$0
$0$0
$0$0
Util
ities
$0$0
$0$0
$0$0
$0$0
Con
stru
ctio
n$0
$0$0
$61,
105
$0$0
$0$6
1,10
5M
anuf
actu
ring
$0$6
,928
,612
$40,
361,
665
$7,7
48,4
63$0
$0$0
$55,
038,
740
Who
lesa
le tr
ade
$0$0
$0$0
$0$0
$0$0
Ret
ail t
rade
$0$0
$0$1
,785
,892
$406
,327
$1,0
76,5
10$2
86,1
16$3
,554
,845
Tran
spor
tatio
n &
war
ehou
sing
$0$0
$0$1
0,23
0,70
2$2
76,5
85$3
4,81
6$1
86,7
60$1
0,72
8,86
3In
form
atio
n$0
$0$0
$0$0
$0$0
$0Fi
nanc
e &
insu
ranc
e$0
$0$0
$70,
336
$0$0
$0$7
0,33
6R
eal e
stat
e &
rent
al$0
$0$0
$1,2
55,6
07$0
$41,
817
$0$1
,297
,424
Pro
fess
iona
l, sc
ient
ific
& te
chni
cal
serv
ices
$0$0
$0$5
35,9
39$0
$257
,583
$0$7
93,5
22M
anag
emen
t of c
ompa
nies
$0$0
$0$5
,415
,224
$0$0
$0$5
,415
,224
Adm
inis
trativ
e &
was
te s
ervi
ces
$0$0
$0$0
$0$0
$0$0
Edu
catio
nal s
ervi
ces
$0$0
$0$0
$0$0
$0$0
Hea
lth &
soc
ial s
ervi
ces
$0$0
$0$0
$0$0
$0$0
Arts
, ent
erta
inm
ent &
recr
eatio
n$0
$0$0
$0$4
18,7
23$2
,813
,041
$282
,736
$3,5
14,5
00A
ccom
mod
atio
n &
food
ser
vice
s$0
$0$0
$66,
290
$1,4
95,8
69$8
,622
,947
$1,0
10,0
63$1
1,19
5,16
9O
ther
ser
vice
s$0
$0$0
$477
,413
$373
,297
$0$2
52,0
63$1
,102
,774
Gov
ernm
ent &
oth
er$0
$0$0
$0$0
$0$0
$0

40
App
endi
x B
.3 (C
ontin
ued)
Des
crip
tion
Farm
pr
oduc
tion
Ani
mal
sl
augh
terin
g an
d pr
oces
sing
Vine
yard
s an
d w
iner
ies
Equ
ine
Win
e to
uris
m
Hor
se s
how
s an
d c
ompe
titio
nsFa
rm
Tour
ism
Tota
l
Tota
l Ind
ustr
ial O
utpu
t Im
pact
Tota
l$8
3,90
5,25
3$8
,165
,843
$49,
036,
943
$47,
376,
654
$4,3
68,4
85$1
9,26
4,43
3$2
,967
,339
$215
,084
,950
Agr
icul
ture
, for
estry
, fish
ing
& h
untin
g$6
3,84
6,67
5$2
05$5
04,6
72$5
,337
,132
$248
$1,0
44$1
69$6
9,69
0,14
6M
inin
g$3
1,53
5$2
75$1
,693
$41,
723
$248
$1,2
96$1
68$7
6,93
8U
tiliti
es$6
18,4
42$4
6,40
5$2
90,4
52$3
23,4
46$4
1,03
2$2
17,8
21$2
7,85
5$1
,565
,453
Con
stru
ctio
n$4
61,1
66$4
2,91
1$2
38,0
64$7
,985
,963
$32,
789
$187
,079
$22,
263
$8,9
70,2
34M
anuf
actu
ring
$759
,449
$6,9
32,3
11$4
0,43
8,98
3$9
8,71
3$1
1,64
5$5
4,35
6$7
,905
$48,
303,
363
Who
lesa
le tr
ade
$591
,569
$56,
519
$951
,876
$2,1
12,2
69$2
5,40
0$9
6,93
2$1
7,25
8$3
,851
,822
Ret
ail t
rade
$1,1
43,5
46$5
6,05
8$3
10,3
46$1
1,47
4,48
3$4
84,0
23$1
,383
,487
$338
,984
$15,
190,
928
Tran
spor
tatio
n &
war
ehou
sing
$751
,261
$183
,583
$870
,282
$371
,670
$312
,094
$179
,313
$210
,910
$2,8
79,1
14In
form
atio
n$2
61,6
60$3
0,75
6$3
79,4
19$5
27,5
11$6
5,31
9$3
01,8
79$4
4,35
3$1
,610
,898
Fina
nce
& in
sura
nce
$4,0
88,2
20$1
47,4
05$5
54,3
08$3
,334
,783
$138
,025
$896
,757
$93,
951
$9,2
53,4
49R
eal e
stat
e &
rent
al$6
,011
,048
$197
,124
$1,4
48,4
57$4
,029
,760
$323
,766
$1,3
54,4
54$2
20,2
03$1
3,58
4,81
2P
rofe
ssio
nal,
scie
ntifi
c &
tech
nica
l se
rvic
es$1
,249
,714
$163
,354
$1,3
10,0
46$7
,100
,702
$203
,687
$1,1
81,0
67$1
38,1
83$1
1,34
6,75
3M
anag
emen
t of c
ompa
nies
$22,
330
$29,
405
$347
,519
$42,
812
$10,
081
$49,
527
$6,8
28$5
08,5
01A
dmin
istra
tive
& w
aste
ser
vice
s$4
71,6
11$5
8,04
0$3
19,5
56$6
11,6
66$9
5,92
9$4
62,4
52$6
5,08
6$2
,084
,339
Edu
catio
nal s
ervi
ces
$111
,597
$5,6
45$2
7,52
4$1
09,5
09$8
,039
$47,
581
$5,4
71$3
15,3
65H
ealth
& s
ocia
l ser
vice
s$1
,569
,653
$76,
214
$383
,828
$1,4
88,7
21$1
00,3
42$4
03,9
63$6
8,28
7$4
,091
,008
Arts
, ent
erta
inm
ent &
recr
eatio
n$1
95,8
09$1
4,42
7$7
5,29
1$2
72,4
56$4
86,8
95$3
,057
,480
$328
,847
$4,4
31,2
06A
ccom
mod
atio
n &
food
ser
vice
s$6
19,2
17$4
7,47
8$1
94,5
86$1
,141
,452
$1,5
56,2
88$8
,937
,347
$1,0
51,0
95$1
3,54
7,46
1O
ther
ser
vice
s$5
61,4
15$4
2,71
2$2
15,4
75$6
01,6
42$4
23,5
32$2
12,5
11$2
86,1
91$2
,343
,479
Gov
ernm
ent &
oth
er$5
39,3
39$3
5,01
5$1
74,5
65$3
70,2
40$4
9,10
3$2
38,0
87$3
3,33
3$1
,439
,682

41