![FATIGUE CRACK INITIATION AND PROPAGATION IN … Library/101. Fatigue Crack... · 3 or predict fatigue life [15, 20]. In this paper we have conducted a detailed examination of fatigue](https://static.fdocuments.in/doc/165x107/5ab7a8aa7f8b9ad5338bd8f5/fatigue-crack-initiation-and-propagation-in-library101-fatigue-crack3-or.jpg)
Fatigue Crack and Porosity Measurement in Composite ... · Fatigue Crack and Porosity Measurement...
16
Fatigue Crack and Porosity Measurement in Composite Materials by Thermographic and Ultrasonic Methods James L. Walker, Samuel S. Russell and Michael W. Suits National Aeronautics and Space Administration Nondestructive Evaluation Team, ED32 Marshall Space Flight Center, AL 35812 256-961-1784 Gary L. Workman University of Alabama in Huntsville Center for Automation and Robotics Huntsville, AL 35899 256-824-6578 https://ntrs.nasa.gov/search.jsp?R=20040084006 2019-08-23T17:42:38+00:00Z
Transcript of Fatigue Crack and Porosity Measurement in Composite ... · Fatigue Crack and Porosity Measurement...

Fatigue Crack and Porosity Measurement inComposite Materials by Thermographic and
Ultrasonic Methods
James L. Walker, Samuel S. Russell and Michael W. Suits
National Aeronautics and Space Administration
Nondestructive Evaluation Team, ED32
Marshall Space Flight Center, AL 35812
256-961-1784
Gary L. Workman
University of Alabama in Huntsville
Center for Automation and Robotics
Huntsville, AL 35899
256-824-6578
https://ntrs.nasa.gov/search.jsp?R=20040084006 2019-08-23T17:42:38+00:00Z

OUTLINE• PURPOSE
Detect thermo-mechanically induced intra-ply fatigue microcracking andmanufactured porosity in unlined composite pressure vessels
• DEFECT DESCRIPTIONSPorosityMicrocracking
• THERMOGRAPHYOverview of techniqueStrengths and WeaknessesExamples of its use for porosity detection
• RESONANT ULTRASOUND SPECTROSCOPYOverview of techniqueStrengths and WeaknessesExamples of its use for microcracking detection
• CONCLUSIONS
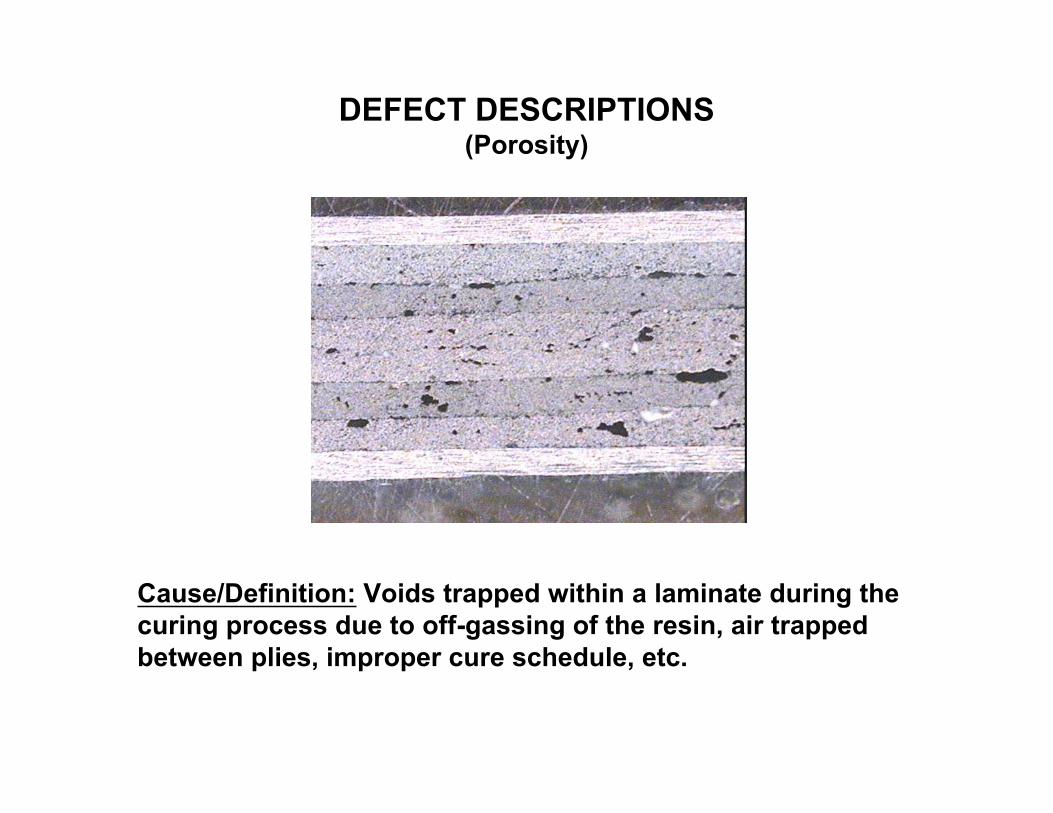
DEFECT DESCRIPTIONS(Porosity)
Cause/Definition: Voids trapped within a laminate during thecuring process due to off-gassing of the resin, air trappedbetween plies, improper cure schedule, etc.

DEFECT DESCRIPTIONS(Microcracking)
Cause/Definition: Cracking of the resin used to support thefibers in the laminate due to combined thermal “cryogenic”and mechanical loading.
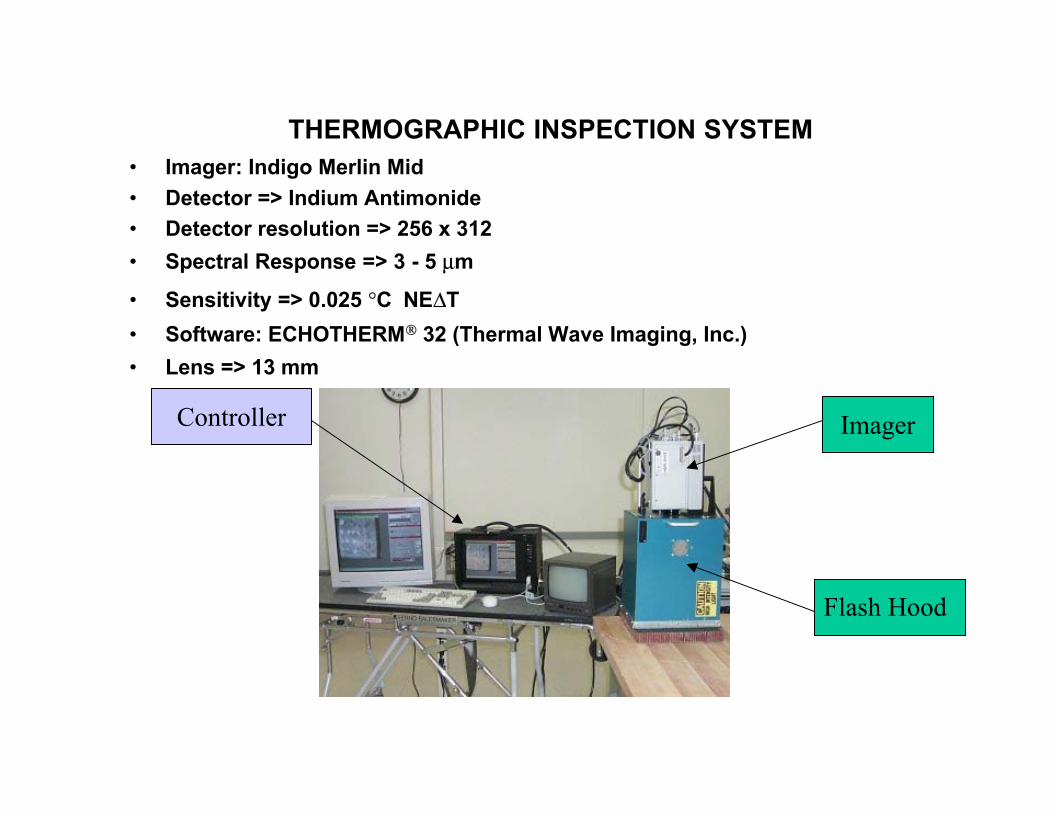
THERMOGRAPHIC INSPECTION SYSTEM• Imager: Indigo Merlin Mid
• Detector => Indium Antimonide
• Detector resolution => 256 x 312
• Spectral Response => 3 - 5 mm
• Sensitivity => 0.025 ∞C NEDT
• Software: ECHOTHERM“ 32 (Thermal Wave Imaging, Inc.)
• Lens => 13 mm
Imager
Flash Hood
Controller
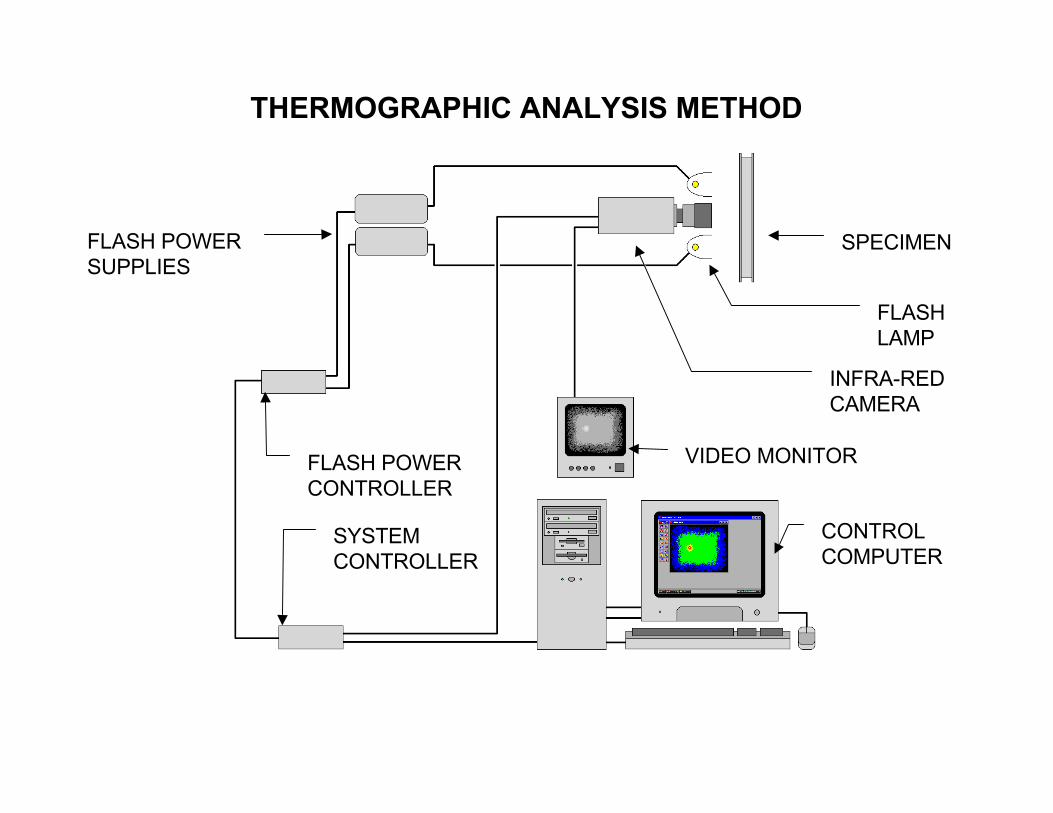
CONTROLCOMPUTER
FLASHLAMPFLASHLAMP
INFRA-REDCAMERAINFRA-REDCAMERA
VIDEO MONITOR
SPECIMEN
FLASH POWERCONTROLLER
FLASH POWERSUPPLIES
SYSTEMCONTROLLER
THERMOGRAPHIC ANALYSIS METHOD
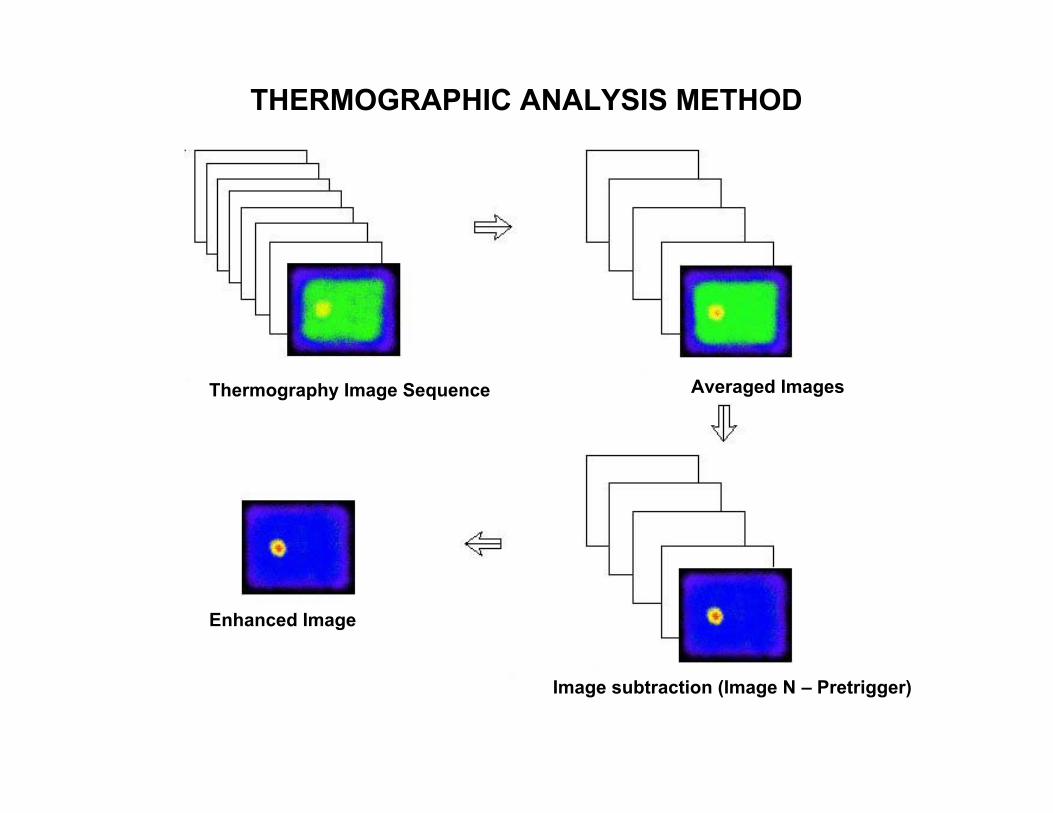
Thermography Image Sequence
Image subtraction (Image N – Pretrigger)
Enhanced Image
Averaged Images
THERMOGRAPHIC ANALYSIS METHOD
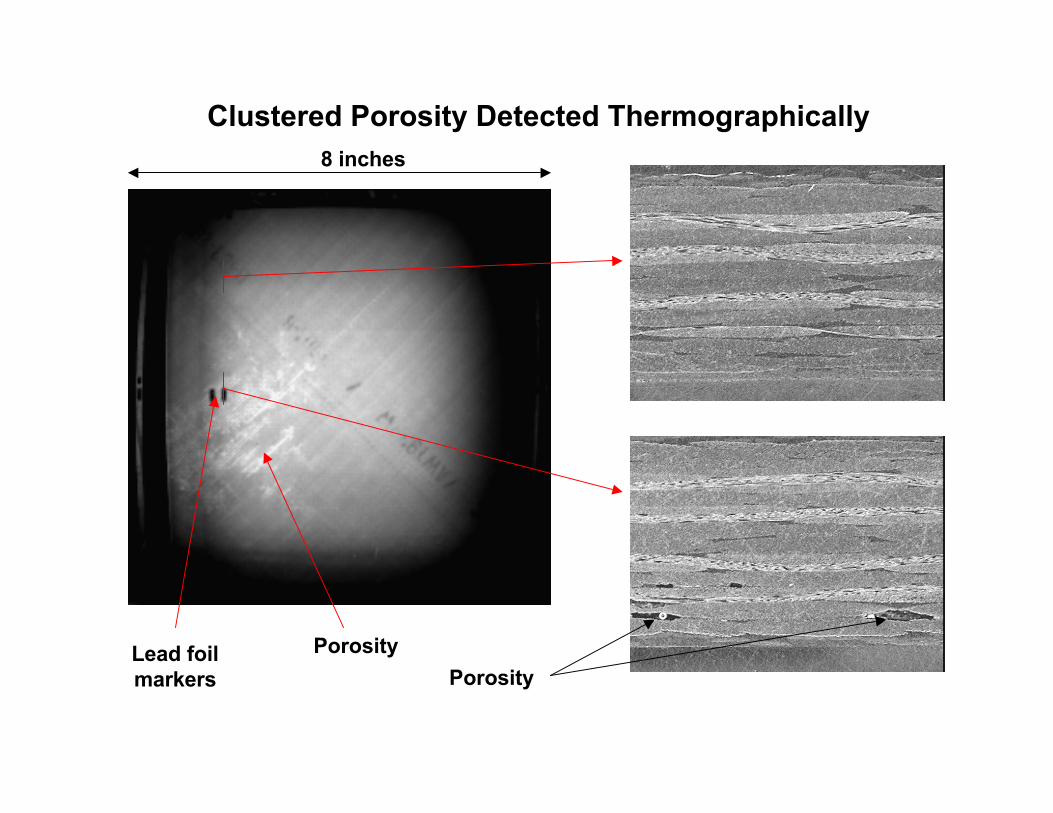
Clustered Porosity Detected Thermographically
Lead foilmarkers
Porosity
8 inches
Porosity
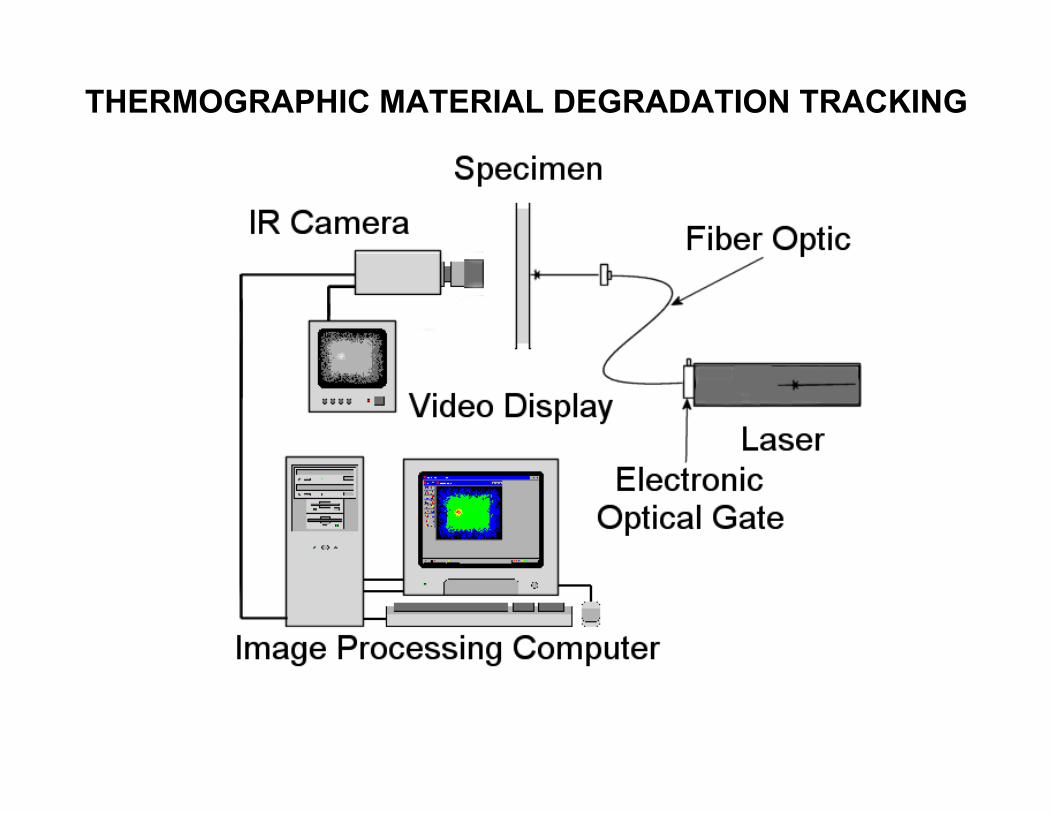
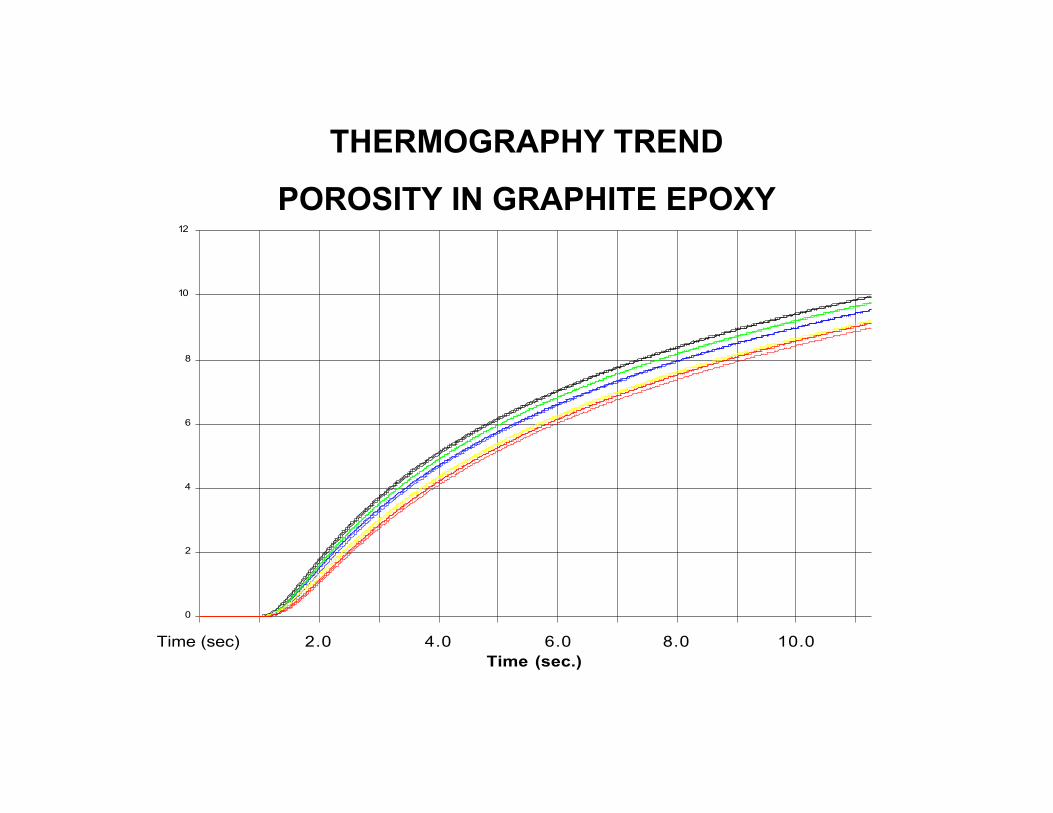
THERMOGRAPHIC MATERIAL DEGRADATION TRACKING
0
2
4
6
8
10
12
Time (sec) 2.0 4.0 6.0 8.0 10.0Time (sec.)
THERMOGRAPHY TREND
POROSITY IN GRAPHITE EPOXY

RESONANCE ULTRASOUND(ACOUSTO-ULTRASONICS)
0
2
4
6
8
10
12
0.1 0.6 1.0 1.5Frequency (MHz)
Pulser
Receiver Typical Power Spectra
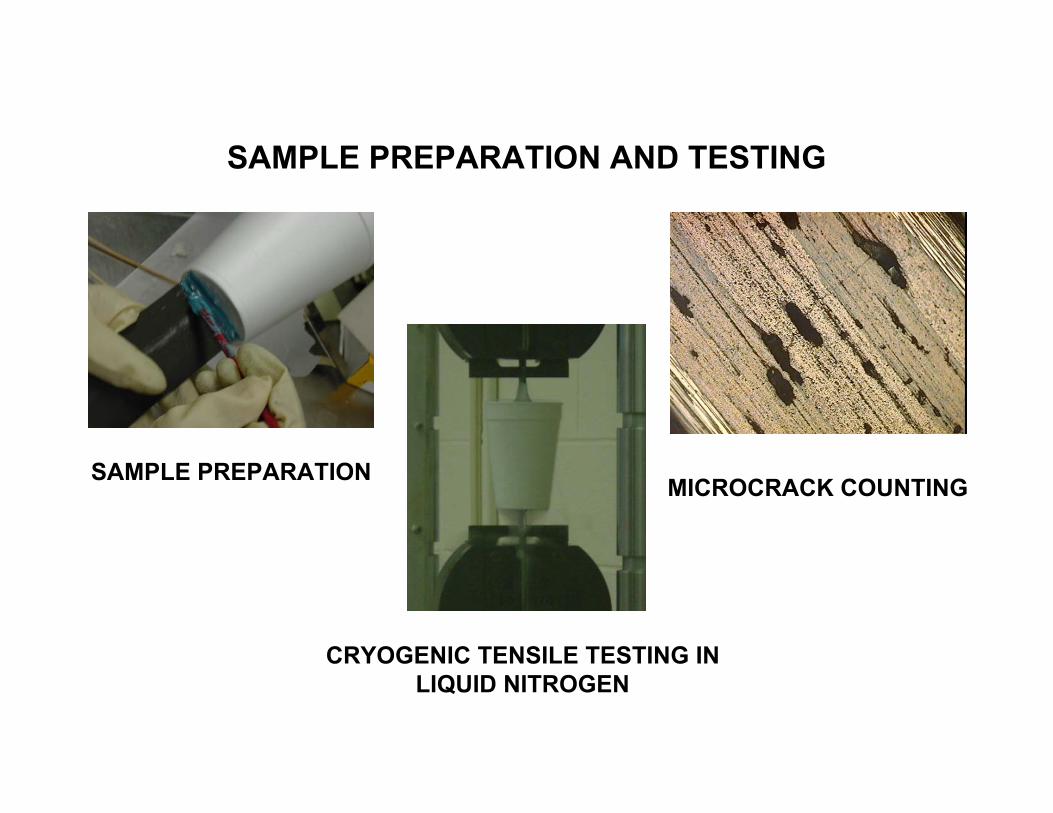
SAMPLE PREPARATION
CRYOGENIC TENSILE TESTING INLIQUID NITROGEN
MICROCRACK COUNTING
SAMPLE PREPARATION AND TESTING
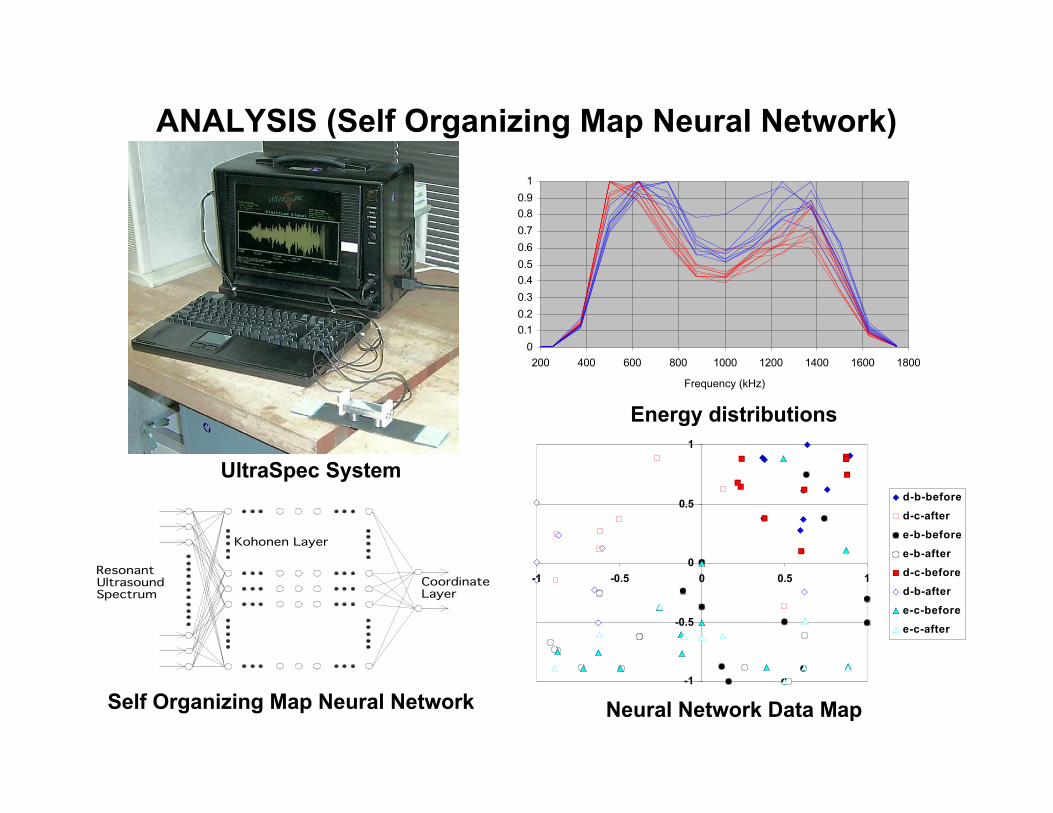
ANALYSIS (Self Organizing Map Neural Network)
0
0.1
0.2
0.3
0.4
0.5
0.6
0.7
0.8
0.9
1
200 400 600 800 1000 1200 1400 1600 1800
Frequency (kHz)
CoordinateLayer
UltrasoundResonant
Spectrum
Kohonen Layer
-1
-0.5
0
0.5
1
-1 -0.5 0 0.5 1
d-b-before
d-c-after
e-b-before
e-b-after
d-c-before
d-b-after
e-c-before
e-c-after
UltraSpec System
Energy distributions
Self Organizing Map Neural Network Neural Network Data Map

(0, 90, 0, 90)s SAMPLES
0
10
20
30
40
50
60
70
80
90
100
0.00 10.00 20.00 30.00 40.00 50.00 60.00 70.00 80.00 90.00 100.00
Cracks/inch
-1
-0.5
0
0.5
1
-1 -0.5 0 0.5 1
b-before
c-after
c-before
b-after
Kohonen Map
Microcrack Trend
Increasing count

Surface Breaking Feature
(0, 45, 0, -45)s SAMPLES
0
20
40
60
80
100
120
0 3 6 9 12 15
Cracks/Inch
-1
-0.5
0
0.5
1
-1 -0.5 0 0.5 1
b-before
b-after
c-before
c-after
Kohonen Map
Microcrack Trend

CONCLUSIONS
Thermography has been shown to be capable of detectingclustered porosity and shows promise for quantifying generalporosity level
Resonance ultrasound has been shown capable of detecting thepresence of microcracking
The ability to detect microcracking with resonance ultrasound is
dependent upon the number of cracks present
FUTURE WORK
Validate thermographic porosity level assessment
Quantify microcrack detection