Far West Coast Marine Park Regional Impact Statement · Far West Coast Marine Park Regional Impact...
86
Far West Coast Marine Park Regional Impact Statement A report prepared for Department of Environment, Water and Natural Resources Prepared by In association with the Australian Workplace Innovation and Social Research Centre, Dr Hugh Kirkman, Dr Simon Bryars and James Brook 20 August 2012 EconSearch Pty Ltd 214 Kensington Road Marryatville SA 5068 Tel: (08) 8431 5533 Fax: (08) 8431 7710 www.econsearch.com.au e c o n s e a r c h
Transcript of Far West Coast Marine Park Regional Impact Statement · Far West Coast Marine Park Regional Impact...

Far West Coast Marine Park Regional
Impact Statement
A report prepared for
Department of Environment, Water and Natural Resources
Prepared by
In association with the Australian Workplace Innovation and Social Research Centre, Dr Hugh Kirkman, Dr Simon Bryars and James Brook
20 August 2012
EconSearch Pty Ltd 214 Kensington Road Marryatville SA 5068 Tel: (08) 8431 5533 Fax: (08) 8431 7710
www.econsearch.com.au
e c o n s e a r c h

e c o n s e a r c h
DEWNR Far West Coast Marine Park Regional Impact Statement
Page: iii
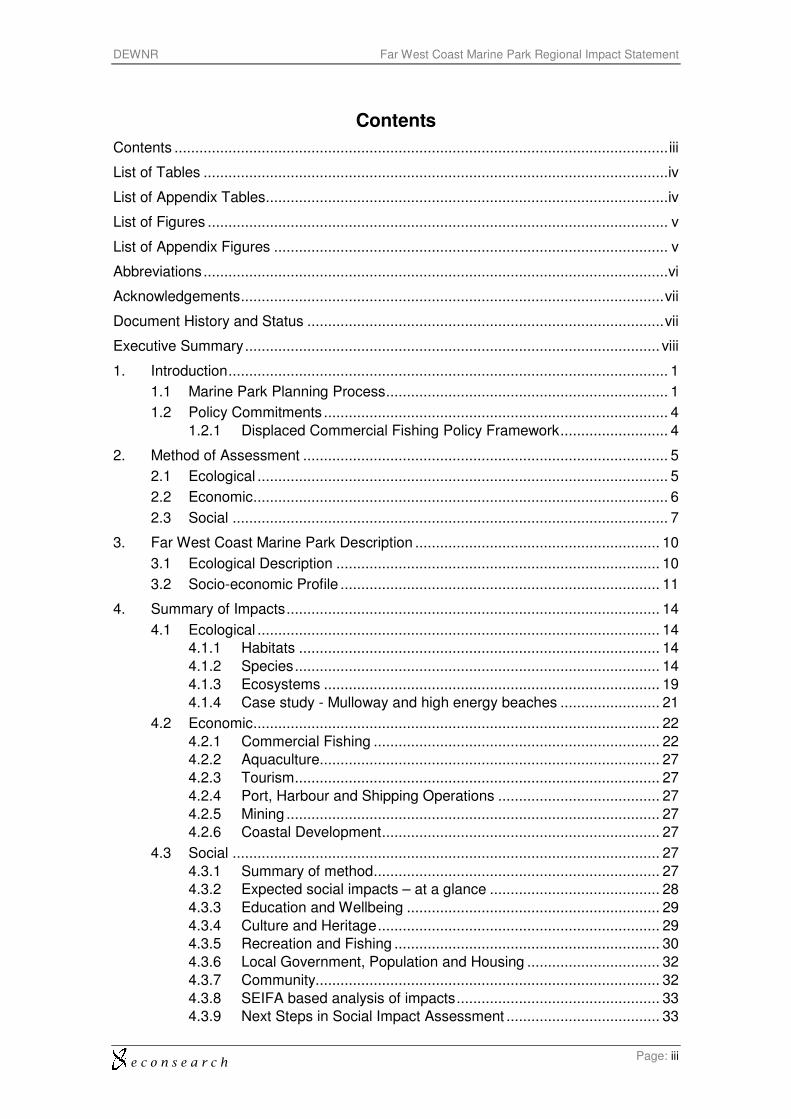
Contents
Contents ....................................................................................................................... iii
List of Tables ................................................................................................................ iv
List of Appendix Tables ................................................................................................. iv
List of Figures ............................................................................................................... v
List of Appendix Figures ............................................................................................... v
Abbreviations ................................................................................................................ vi
Acknowledgements ...................................................................................................... vii
Document History and Status ...................................................................................... vii
Executive Summary .................................................................................................... viii
1. Introduction .......................................................................................................... 1
1.1 Marine Park Planning Process .................................................................... 1
1.2 Policy Commitments ................................................................................... 4
1.2.1 Displaced Commercial Fishing Policy Framework .......................... 4
2. Method of Assessment ........................................................................................ 5
2.1 Ecological ................................................................................................... 5
2.2 Economic .................................................................................................... 6
2.3 Social ......................................................................................................... 7
3. Far West Coast Marine Park Description ........................................................... 10
3.1 Ecological Description .............................................................................. 10
3.2 Socio-economic Profile ............................................................................. 11
4. Summary of Impacts .......................................................................................... 14
4.1 Ecological ................................................................................................. 14
4.1.1 Habitats ....................................................................................... 14
4.1.2 Species ........................................................................................ 14
4.1.3 Ecosystems ................................................................................. 19
4.1.4 Case study - Mulloway and high energy beaches ........................ 21
4.2 Economic .................................................................................................. 22
4.2.1 Commercial Fishing ..................................................................... 22
4.2.2 Aquaculture .................................................................................. 27
4.2.3 Tourism ........................................................................................ 27
4.2.4 Port, Harbour and Shipping Operations ....................................... 27
4.2.5 Mining .......................................................................................... 27
4.2.6 Coastal Development ................................................................... 27
4.3 Social ....................................................................................................... 27
4.3.1 Summary of method ..................................................................... 27
4.3.2 Expected social impacts – at a glance ......................................... 28
4.3.3 Education and Wellbeing ............................................................. 29
4.3.4 Culture and Heritage .................................................................... 29
4.3.5 Recreation and Fishing ................................................................ 30
4.3.6 Local Government, Population and Housing ................................ 32
4.3.7 Community................................................................................... 32
4.3.8 SEIFA based analysis of impacts ................................................. 33
4.3.9 Next Steps in Social Impact Assessment ..................................... 33

e c o n s e a r c h
DEWNR Far West Coast Marine Park Regional Impact Statement
Page: iv
References ................................................................................................................. 35
Appendix 1 Socio-economic Profile – Far West Coast .................................... 38
Appendix 2 Activities and Uses Tables ........................................................... 52
Appendix 3 List of Parties Consulted .............................................................. 65
Appendix 4 MPSIAT feedback ........................................................................ 67
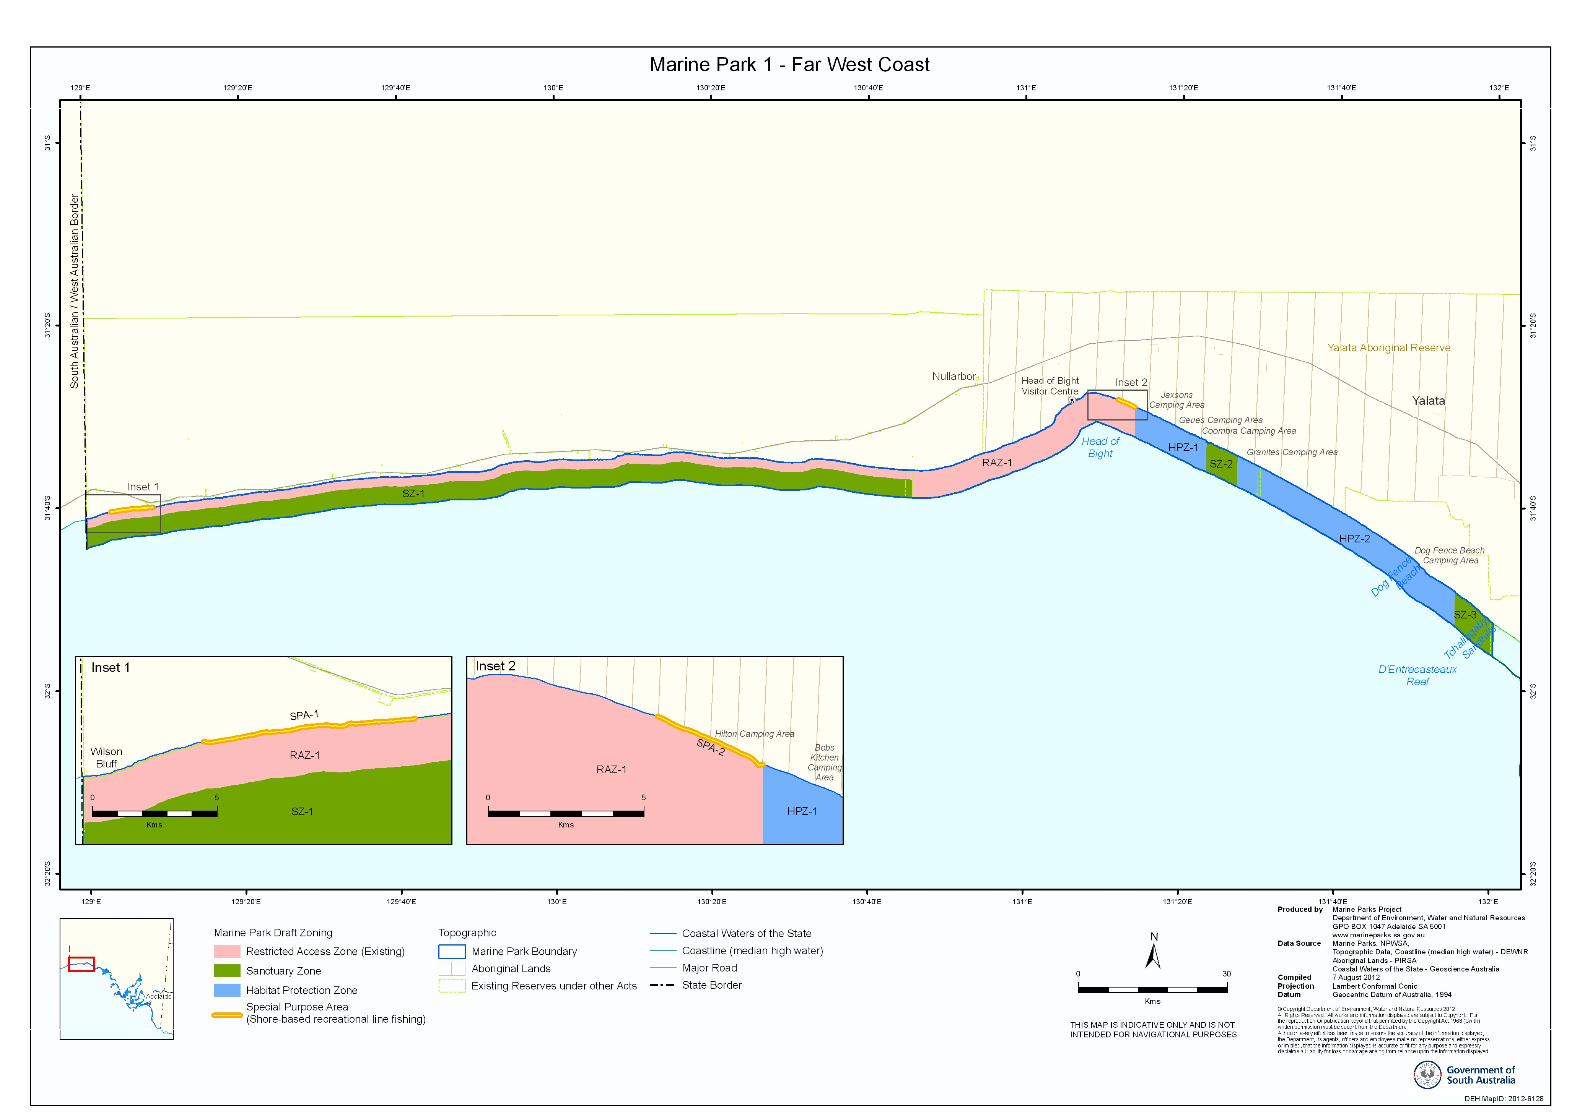
Appendix 5 Map of Marine Park Showing Draft Zoning ................................... 73
List of Tables
Table 1-1 Public consultation process to date ............................................................ 3
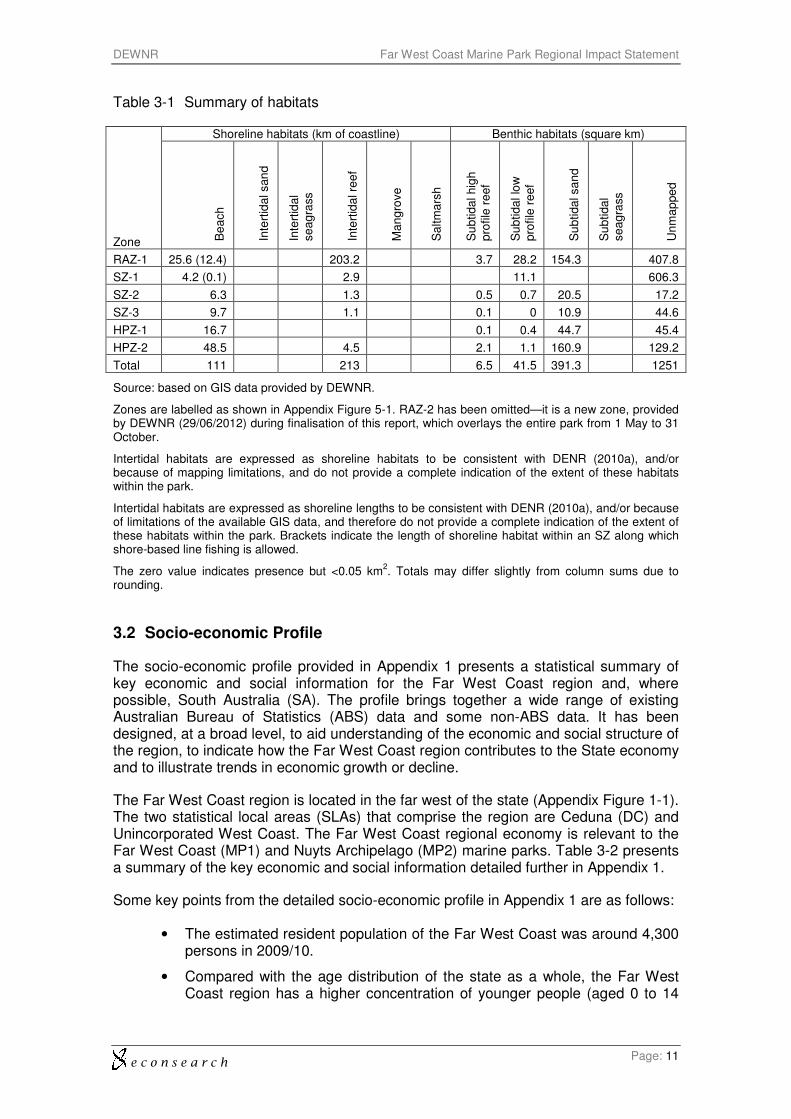
Table 3-1 Summary of habitats ................................................................................ 11
Table 3-2 Summary of key economic and social indicators for the Far West Coast region ............................................................................................ 13
Table 4-1 Potential first-order responses of one of the indicator speciesa ................ 18
Table 4-2 Fished species which may respond to or benefit from protection ............. 19
Table 4-3 Regional economic impact of marine park zoning on the Northern Zone Rock Lobster fishery based on SARDI estimates of displaced effort ........................................................................................ 24
Table 4-4 Average annual Marine Scalefish effort in draft sanctuary zones by sector .................................................................................................. 26
Table 4-5 Average annual Marine Scalefish catch in draft sanctuary zones by main species ....................................................................................... 26
Table 4-6 Social Impact for Far West Coast Impact Region ..................................... 33
List of Appendix Tables
Appendix Table 1-1 Summary of key economic and social indicators for the Far West Coast region ............................................................................. 39
Appendix Table 1-2 Age distribution of the population for the Far West Coast region and SA, 2000/01 to 2009/10 ............................................... 40
Appendix Table 1-3 Highest level of qualifications for persons aged 15 and over in the Far West Coast region and SA, 2001 and 2006 a ................... 42
Appendix Table 1-4 School enrolments in the Far West Coast region and SA, 2001, 2006 and 2011 ........................................................................ 43
Appendix Table 1-5 Employment, household income and household expenditure, Far West Coast region, 2009/10 a ........................................ 47
Appendix Table 1-6 Components of gross regional product in the Far West Coast region by industry, 2009/10 a ......................................................... 48
Appendix Table 1-7 Value of imports and exports by industry, Far West Coast region, 2009/10 a ........................................................................... 49
Appendix Table 4-1 General views about the Far West Coast Marine Park .............. 67
Appendix Table 4-2 Tourism, education & wellbeing impacts for Far West Coast Marine Park ................................................................................... 68
Appendix Table 4-3 Culture and heritage impacts for Far West Coast Marine Park 69
e c o n s e a r c h
DEWNR Far West Coast Marine Park Regional Impact Statement
Page: v
Appendix Table 4-4 Recreation & fishing impacts for Far West Coast Marine Park 70
Appendix Table 4-5 Population & housing impacts for Far West Coast Marine Park ............................................................................................. 71
Appendix Table 4-6 Community response impacts for Far West Coast Marine Park ............................................................................................. 72
List of Figures
Figure 1–1 Marine Park Zones ................................................................................... 2
Figure 4–1 Simplified conceptual food web for subtidal high profile reef .................... 20
Figure 4–2 Simplified conceptual food web for a beach ecosystem ........................... 22
List of Appendix Figures
Appendix Figure 1-1 Far West Coast region ............................................................ 38
Appendix Figure 5-1 Map of Marine Park Showing Draft Zoning ............................. 73
e c o n s e a r c h
DEWNR Far West Coast Marine Park Regional Impact Statement
Page: vi
Abbreviations
ABS Australian Bureau of Statistics
C Council
CBA Cost Benefit Analysis
DC District Council
DEH Department for Environment and Heritage
DENR Department of Environment and Natural Resources
DEWNR Department of Environment, Water and Natural Resources
fte full-time equivalent
GABMPCC Great Australian Bight Marine Park Consultative Committee
GMUZ General Managed Use Zone
GRP gross regional product
HPZ Habitat Protection Zone
MPLAG Marine Park Local Advisory Group
MPSIAT Marine Parks Social Impact Assessment Tool
NL natural level
NRM Natural Resource Management
PIRSA Department of Primary Industries and Regions SA
RAZ Restricted Access Zone
RIAS Regional Impact Assessment Statement
RIS Regional Impact Statement
RISE Regional Industry Structure and Employment
SA South Australia
SARFAC South Australian Recreational Fishing Advisory Council
SAMPIT South Australian Marine Parks Information Tool
SARDI South Australian Research and Development Institute
SEIFA Socio-Economic Indexes for Areas
SIA social impact assessment
SLA Statistical Local Area
SPA Special Purpose Area
SZ Sanctuary Zone
UNHL unnaturally high level
UNLL unnaturally low level
e c o n s e a r c h
DEWNR Far West Coast Marine Park Regional Impact Statement
Page: vii
Acknowledgements
The consulting team has relied heavily on the voluntary cooperation of a range of government, industry and broader community representatives and is indebted to these people for providing the necessary information, guidance and assistance (list provided in Appendix 3. Janine Baker provided assistance to the ecological impact assessment team early in the project and we are grateful for that. DEWNR and PIRSA officers provided assistance, were supportive of the data collection and interpretation and offered valuable advice throughout.
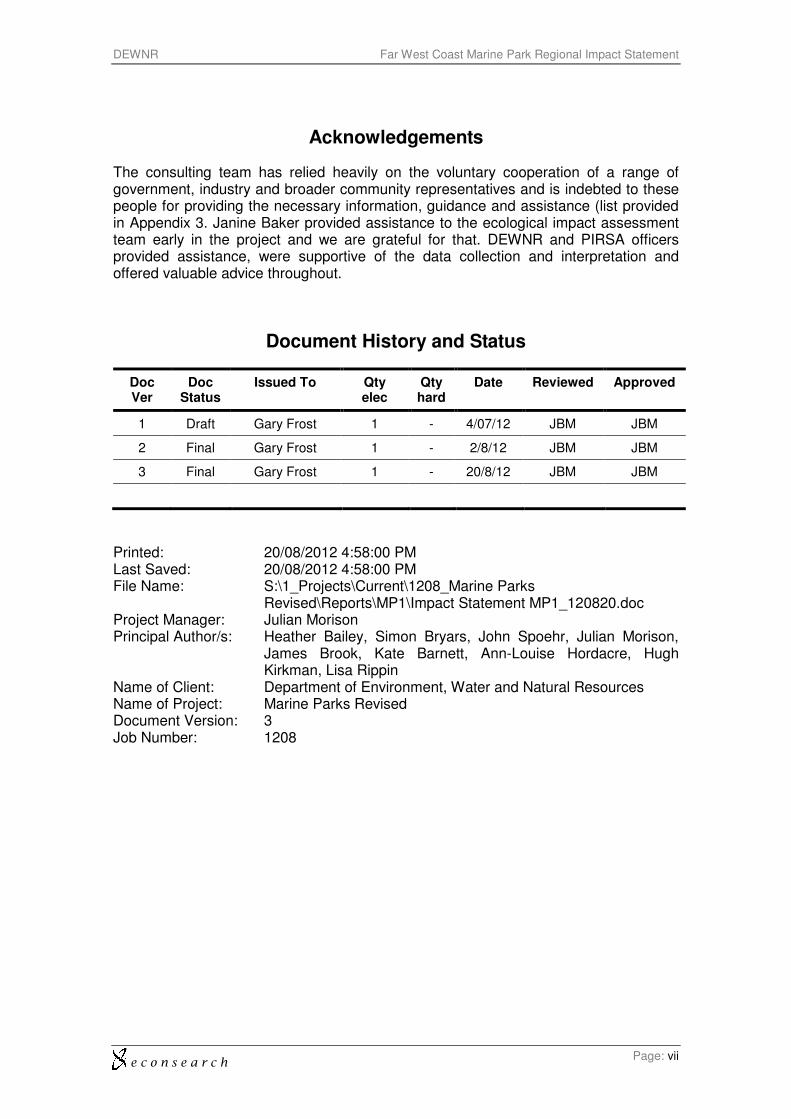
Document History and Status
Doc Ver
Doc Status
Issued To Qty elec
Qty hard
Date Reviewed Approved
1 Draft Gary Frost 1 - 4/07/12 JBM JBM
2 Final Gary Frost 1 - 2/8/12 JBM JBM
3 Final Gary Frost 1 - 20/8/12 JBM JBM
Printed: 20/08/2012 4:58:00 PM Last Saved: 20/08/2012 4:58:00 PM File Name: S:\1_Projects\Current\1208_Marine Parks
Revised\Reports\MP1\Impact Statement MP1_120820.doc Project Manager: Julian Morison Principal Author/s: Heather Bailey, Simon Bryars, John Spoehr, Julian Morison,
James Brook, Kate Barnett, Ann-Louise Hordacre, Hugh Kirkman, Lisa Rippin
Name of Client: Department of Environment, Water and Natural Resources Name of Project: Marine Parks Revised Document Version: 3 Job Number: 1208

e c o n s e a r c h
DEWNR Far West Coast Marine Park Regional Impact Statement
Page: viii
Executive Summary
Situated between the Western Australian border and the Tchalingaby sand hills, the Far West Coast Marine Park covers 1,690km2 and is located within the Eucla Bioregion. This park encompasses the Great Australian Bight Marine Park and partially overlays the Nullarbor National Park and Wahgunyah Conservation Park up to median high water.
Impacts of implementing the draft management plans were assessed against a base case scenario of no management plans. The base case is not static, and requires an understanding of the existing trends in natural resource, economic and social conditions. There are external factors which influence both the ‘with management plan’ and the base case scenarios that were taken into consideration.
Marine Park Profile
The shoreline habitats of the park are characterised by limestone cliffs, interspersed by rocky headlands, narrow intertidal wave-cut rock platforms, reefs and beaches. The rocky coastline habitats are dominated by species of large brown macroalgae and smaller red coralline algae typically associated with exposure to the strong south-westerly swell, high waves and low-nutrient warm water.
From a socio-economic viewpoint the community relevant to this marine park is that of the Far West Coast region. The two statistical local areas (SLAs) that comprise the region are Ceduna (DC) and Unincorporated West Coast. Some of the key socio-economic characteristics of the region include:
• a resident population of around 4,300 persons in 2010/11.
• a higher concentration of younger people (aged 0 to 14 years) and a lower than average share of people aged 65 and over compared with the State.
• The total population is projected to increase by just 5 per cent by 2026, whereas the SA population is expected to increase by around 23 per cent.
• The unemployment rate in the Far West Coast region was 8.6 per cent in the June quarter of 2011, well above the state rate of 5.3 per cent.
• Approximately 50 per cent of the businesses in the Far West Coast region were classified in the agriculture, forestry and fishing sector.
• Mean taxable income was $48,300 in 2009/10, 11 per cent below SA’s average of $54,300.
• Over the 10 years to 2010/11, median dwelling prices increased by 273 per cent ($250,000 in 2010/11) compared with a 197 per cent in SA as a whole ($357,500).
In 2009/10, the top four contributors to gross regional product (GRP) were the agriculture, forestry and fishing (15 per cent), ownership of dwellings (14 per cent), health and community services and transport and storage (7 per cent each) sectors.
The commercial fishing, aquaculture and tourism industries are important to the local economy in terms of contributing to jobs and GRP. Directly and indirectly commercial fishing and aquaculture contributed 4 per cent of GRP ($6.1 million) and 6 per cent of employment (107 fte jobs) in 2009/10. By comparison, the tourism sector contributed 7 per cent of GRP ($12.4 million) and 9 per cent of employment (164 fte jobs).
e c o n s e a r c h
DEWNR Far West Coast Marine Park Regional Impact Statement
Page: ix
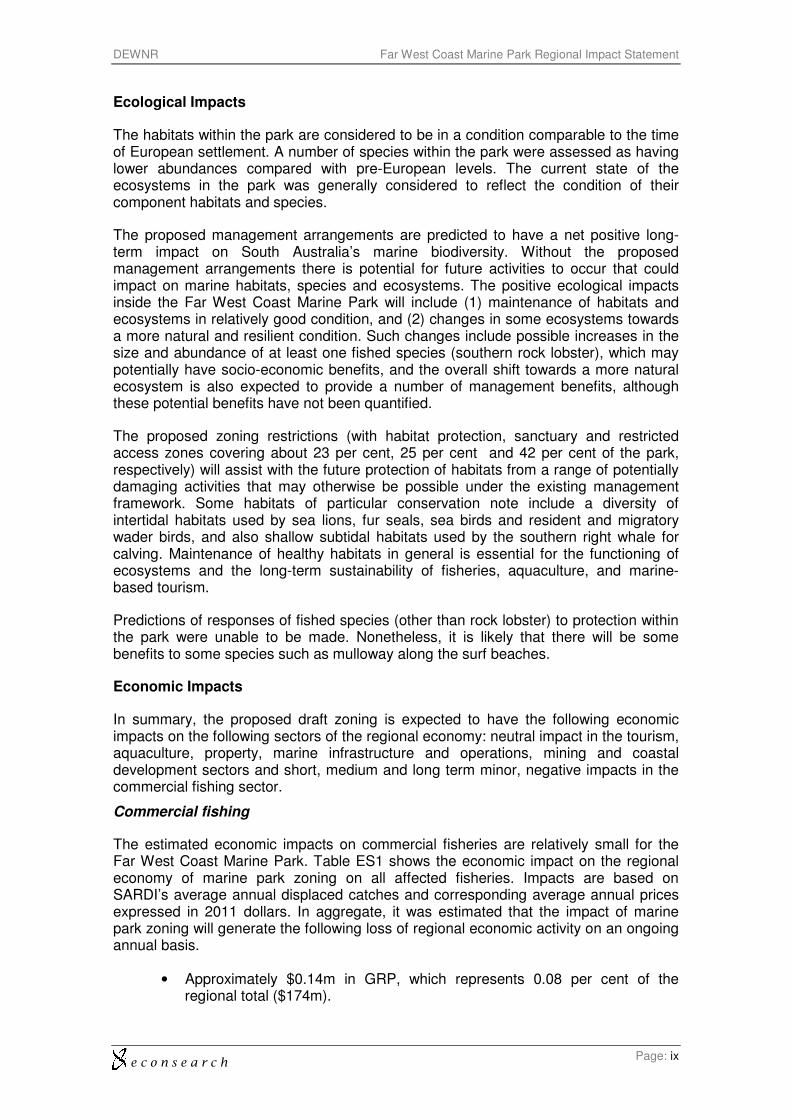
Ecological Impacts
The habitats within the park are considered to be in a condition comparable to the time of European settlement. A number of species within the park were assessed as having lower abundances compared with pre-European levels. The current state of the ecosystems in the park was generally considered to reflect the condition of their component habitats and species.
The proposed management arrangements are predicted to have a net positive long-term impact on South Australia’s marine biodiversity. Without the proposed management arrangements there is potential for future activities to occur that could impact on marine habitats, species and ecosystems. The positive ecological impacts inside the Far West Coast Marine Park will include (1) maintenance of habitats and ecosystems in relatively good condition, and (2) changes in some ecosystems towards a more natural and resilient condition. Such changes include possible increases in the size and abundance of at least one fished species (southern rock lobster), which may potentially have socio-economic benefits, and the overall shift towards a more natural ecosystem is also expected to provide a number of management benefits, although these potential benefits have not been quantified.
The proposed zoning restrictions (with habitat protection, sanctuary and restricted access zones covering about 23 per cent, 25 per cent and 42 per cent of the park, respectively) will assist with the future protection of habitats from a range of potentially damaging activities that may otherwise be possible under the existing management framework. Some habitats of particular conservation note include a diversity of intertidal habitats used by sea lions, fur seals, sea birds and resident and migratory wader birds, and also shallow subtidal habitats used by the southern right whale for calving. Maintenance of healthy habitats in general is essential for the functioning of ecosystems and the long-term sustainability of fisheries, aquaculture, and marine-based tourism.
Predictions of responses of fished species (other than rock lobster) to protection within the park were unable to be made. Nonetheless, it is likely that there will be some benefits to some species such as mulloway along the surf beaches.
Economic Impacts
In summary, the proposed draft zoning is expected to have the following economic impacts on the following sectors of the regional economy: neutral impact in the tourism, aquaculture, property, marine infrastructure and operations, mining and coastal development sectors and short, medium and long term minor, negative impacts in the commercial fishing sector.
Commercial fishing
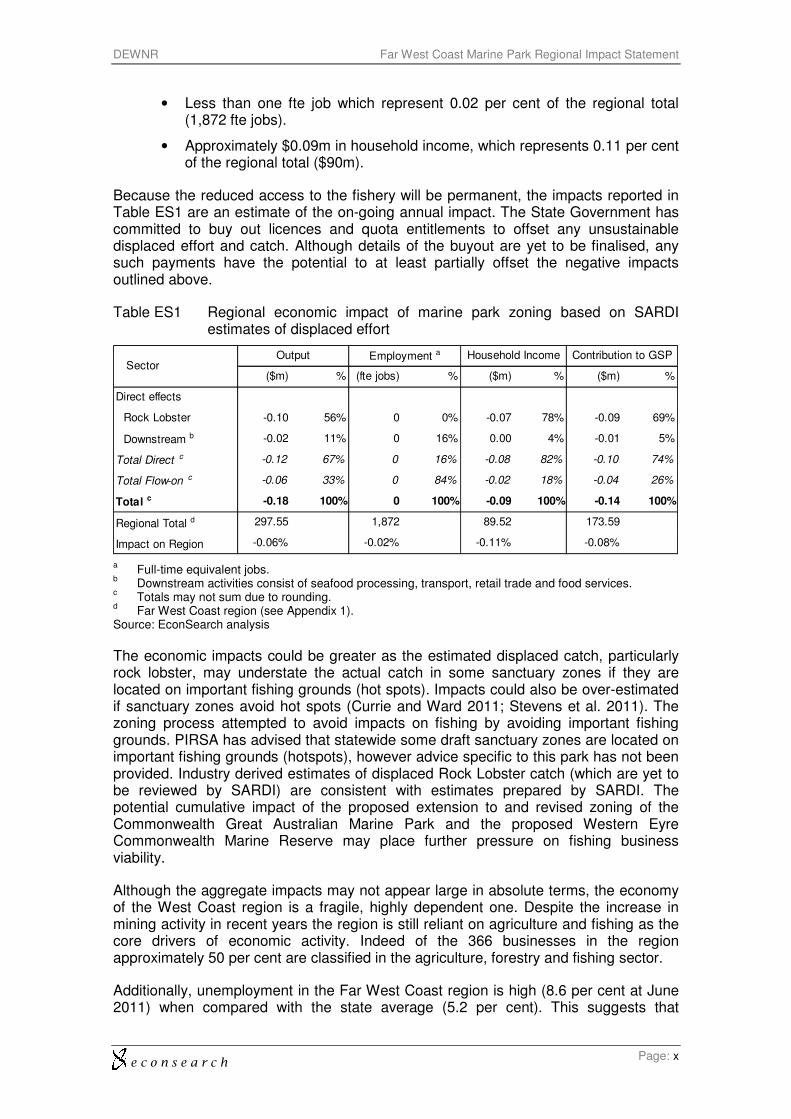
The estimated economic impacts on commercial fisheries are relatively small for the Far West Coast Marine Park. Table ES1 shows the economic impact on the regional economy of marine park zoning on all affected fisheries. Impacts are based on SARDI’s average annual displaced catches and corresponding average annual prices expressed in 2011 dollars. In aggregate, it was estimated that the impact of marine park zoning will generate the following loss of regional economic activity on an ongoing annual basis.
• Approximately $0.14m in GRP, which represents 0.08 per cent of the regional total ($174m).
e c o n s e a r c h
DEWNR Far West Coast Marine Park Regional Impact Statement
Page: x
• Less than one fte job which represent 0.02 per cent of the regional total (1,872 fte jobs).
• Approximately $0.09m in household income, which represents 0.11 per cent of the regional total ($90m).
Because the reduced access to the fishery will be permanent, the impacts reported in Table ES1 are an estimate of the on-going annual impact. The State Government has committed to buy out licences and quota entitlements to offset any unsustainable displaced effort and catch. Although details of the buyout are yet to be finalised, any such payments have the potential to at least partially offset the negative impacts outlined above.
Table ES1 Regional economic impact of marine park zoning based on SARDI estimates of displaced effort
($m) % (fte jobs) % ($m) % ($m) %
Direct effects
Rock Lobster -0.10 56% 0 0% -0.07 78% -0.09 69%
Downstream b -0.02 11% 0 16% 0.00 4% -0.01 5%
Total Direct c -0.12 67% 0 16% -0.08 82% -0.10 74%
Total Flow-on c -0.06 33% 0 84% -0.02 18% -0.04 26%
Total c -0.18 100% 0 100% -0.09 100% -0.14 100%
Regional Total d 297.55 1,872 89.52 173.59
Impact on Region -0.06% -0.02% -0.11% -0.08%
SectorOutput Employment a Household Income Contribution to GSP
a Full-time equivalent jobs.
b Downstream activities consist of seafood processing, transport, retail trade and food services.
c Totals may not sum due to rounding.
d Far West Coast region (see Appendix 1).
Source: EconSearch analysis
The economic impacts could be greater as the estimated displaced catch, particularly rock lobster, may understate the actual catch in some sanctuary zones if they are located on important fishing grounds (hot spots). Impacts could also be over-estimated if sanctuary zones avoid hot spots (Currie and Ward 2011; Stevens et al. 2011). The zoning process attempted to avoid impacts on fishing by avoiding important fishing grounds. PIRSA has advised that statewide some draft sanctuary zones are located on important fishing grounds (hotspots), however advice specific to this park has not been provided. Industry derived estimates of displaced Rock Lobster catch (which are yet to be reviewed by SARDI) are consistent with estimates prepared by SARDI. The potential cumulative impact of the proposed extension to and revised zoning of the Commonwealth Great Australian Marine Park and the proposed Western Eyre Commonwealth Marine Reserve may place further pressure on fishing business viability.
Although the aggregate impacts may not appear large in absolute terms, the economy of the West Coast region is a fragile, highly dependent one. Despite the increase in mining activity in recent years the region is still reliant on agriculture and fishing as the core drivers of economic activity. Indeed of the 366 businesses in the region approximately 50 per cent are classified in the agriculture, forestry and fishing sector.
Additionally, unemployment in the Far West Coast region is high (8.6 per cent at June 2011) when compared with the state average (5.2 per cent). This suggests that
e c o n s e a r c h
DEWNR Far West Coast Marine Park Regional Impact Statement
Page: xi
alternative regional opportunities for unemployed labour will be difficult to find and any job losses will be real and unlikely to be absorbed into the local workforce. However no job losses are anticipated as a result of implementing the draft management plan.
Aquaculture
There are currently no aquaculture operations in this marine park and any future development will need to be consistent with policy commitments, marine park and aquaculture related legislation (PIRSA, pers. comm., 27 June 2012).
Tourism
The Head of Bight Visitor Centre attracts around 30,000 visitors a year (DENR, pers. Comm., 3 August 2011) who come mainly to whale watch. It is expected that the changes to zoning will not have an impact, either positive or negative, on visitation (DENR, pers. comm., 3 August 2011)
Port, harbour and shipping operations
There are no ports or harbours in this marine park. No significant impacts on shipping activities arising from the zoning in this park are expected, which is consistent with Government policy commitments.
Mining
No mineral, petroleum or geothermal tenements are currently located within this park.
Coastal development
There are no major projects or infrastructure planned for this park.
Social Impacts
The overall social impacts of the Far West Coast Marine Park on communities living in the Far West Coast region of South Australia are expected to be low given the magnitude of the economic impacts that have been projected (no job losses anticipated). The impact on recreational fishing is also considered to be low. Consequently, any impact on local community identity as a fishing centre and on fishing as a way of life is likely to be low, with some potential impact at the granites composite.
No impacts on local government operations, infrastructure and revenue or compliance related activities are expected as a result of the proposed draft zoning.
Experience elsewhere in Australia and internationally, suggests that a range of benefits from the establishment of marine parks become evident over time. These include increased opportunities for education about marine life and conservation, and increased tourism and ecotourism opportunities. This experience indicates that these benefits usually take approximately five years to be evident, and that in the earliest stages of marine protected areas being developed, local communities are more likely to identify possible negative impacts than potential benefits. It takes time to observe how the park’s ecological and economic impacts evolve, with social impacts (positive or negative) flowing from these.
Marine parks have broad support in the South Australian community. Market research commissioned by the state government between 2006 and 2012 found strong support
e c o n s e a r c h
DEWNR Far West Coast Marine Park Regional Impact Statement
Page: xii
for the concept of marine parks among South Australians with approximately 85 per cent in favour of them in 2012 (87 per cent support in metropolitan Adelaide and 82 per cent support in regional areas). Those least likely to support marine parks have been fishing groups (in 2009 55 per cent of respondents who did not support marine parks identified restricted fishing as the reason, this dropped to 39 per cent in 2012). Between 2011 and 2012 the market research findings identify a decline in those who believe they will have limited access to marine parks and an increase in those who associate swimming, boating and snorkelling with marine parks.
A critical factor in determining the ultimate impact of marine parks is how well local communities are able to adapt to change and how cohesive they are in supporting each other through change. The level of support provided by government to adjust to change is also crucial. One very important factor that affects community attitudes is how informed they are, and feedback from market research and marine park local advisory groups, as well as analysis of media reports indicates a gap in this information. In particular, increasing communities’ understanding of the scientific rationale underpinning marine protected areas, and the benefits that these can bring, needs to be enhanced. This is one of the functions of impact assessment which is best conceived of as a continuous process informing both the establishment and operation of marine parks.

e c o n s e a r c h
DEWNR Far West Coast Marine Park Regional Impact Statement
Page: 1
1. Introduction
In 2009, the SA Government established 19 marine parks covering approximately 44 per cent of the State’s waters. The Government has prepared a draft management plan for each of South Australia's marine parks. These draft management plans include a number of proposed zones where certain activities will be restricted for biodiversity conservation purposes. Global scientific research is demonstrating that marine parks have the potential to conserve coastal and marine biodiversity (PISCO 2007).
However, it is recognised that the zoning of marine parks will come with some costs such as restrictions on commercial and recreational activities. The Marine Parks Act 2007 provides that when the Minister prepares a draft management plan, an impact statement of the expected environmental, economic and social impacts of the management plan must also be prepared. The impact statements are designed to assist the community to understand the projected impacts of the draft management plans1 during public consultation.
The Department of Environment, Water and Natural Resources (DEWNR) contracted EconSearch Pty Ltd and its project partners to provide:
1. Impact statements for each of the 19 marine parks which describe both positive and negative impacts of implementing the draft management plans on the local marine ecosystems, economies and communities. These impact statements are to comply with the SA Government’s Regional Impact Assessment Statement Policy (RIAS) and with Section 14(4)(c) of the Marine Parks Act 2007.
2. A state level Cost Benefit Analysis (CBA) of the proposed management of the 19 marine parks through zoning regulations. The CBA is to comply with the SA Governments Regulatory Impact Statement (RIS) Policy, but is not a RIS in its own right. The results of the CBA are presented in the Marine Park Impact Statements Main Report.
1.1 Marine Park Planning Process
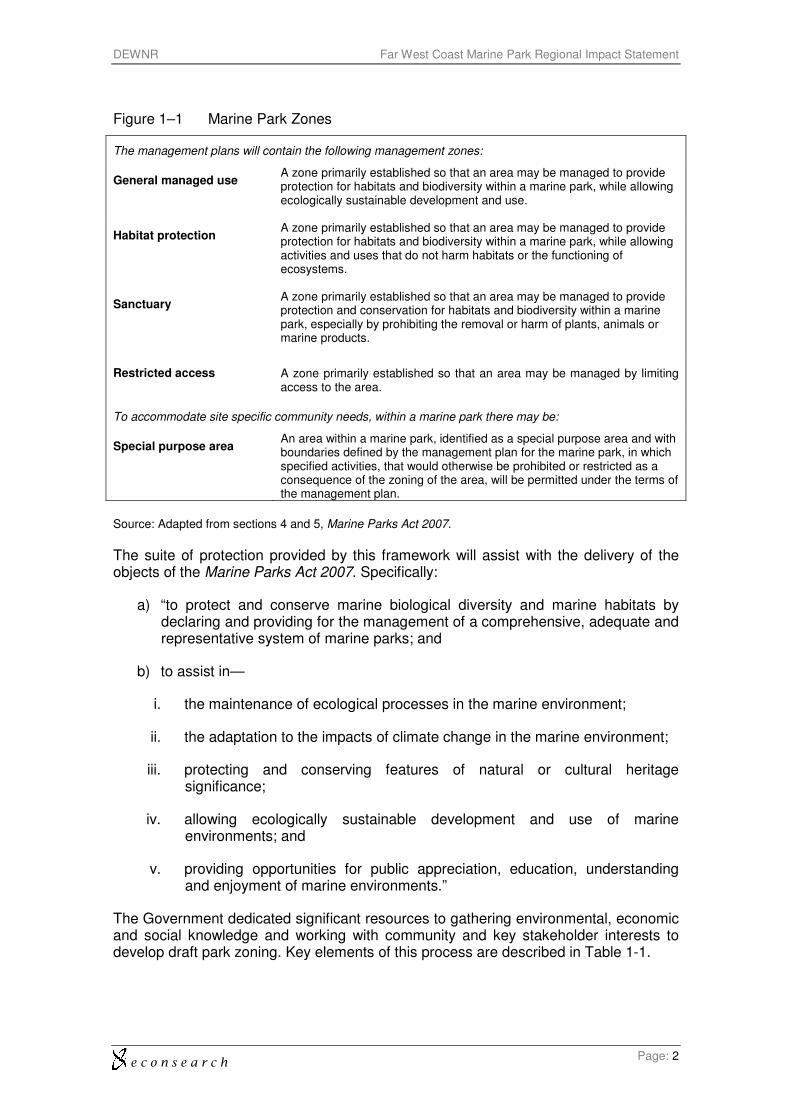
Marine parks in South Australia will be zoned for multiple-uses, providing for varying levels of conservation, recreational and commercial use. Zoning provides the basis for the management of marine parks, in accordance with the objects of the Marine Parks Act 2007. Figure 1–1 describes the marine park zone.
The Government has developed a table of activities and uses that occur in the marine environment and summarises how these activities are expected to be managed in each marine park zone. The prohibitions and restrictions in the matrix will be included in regulations that will be finalised when marine park management plans are adopted (see Appendix 2).
1 The impact statements were prepared before the draft management plans were finalised.
e c o n s e a r c h
DEWNR Far West Coast Marine Park Regional Impact Statement
Page: 2
Figure 1–1 Marine Park Zones
The management plans will contain the following management zones:
General managed use A zone primarily established so that an area may be managed to provide protection for habitats and biodiversity within a marine park, while allowing ecologically sustainable development and use.
Habitat protection A zone primarily established so that an area may be managed to provide protection for habitats and biodiversity within a marine park, while allowing activities and uses that do not harm habitats or the functioning of ecosystems.
Sanctuary A zone primarily established so that an area may be managed to provide protection and conservation for habitats and biodiversity within a marine park, especially by prohibiting the removal or harm of plants, animals or marine products.
Restricted access A zone primarily established so that an area may be managed by limiting access to the area.
To accommodate site specific community needs, within a marine park there may be:
Special purpose area An area within a marine park, identified as a special purpose area and with boundaries defined by the management plan for the marine park, in which specified activities, that would otherwise be prohibited or restricted as a consequence of the zoning of the area, will be permitted under the terms of the management plan.
Source: Adapted from sections 4 and 5, Marine Parks Act 2007.
The suite of protection provided by this framework will assist with the delivery of the objects of the Marine Parks Act 2007. Specifically:
a) “to protect and conserve marine biological diversity and marine habitats by declaring and providing for the management of a comprehensive, adequate and representative system of marine parks; and
b) to assist in—
i. the maintenance of ecological processes in the marine environment;
ii. the adaptation to the impacts of climate change in the marine environment;
iii. protecting and conserving features of natural or cultural heritage significance;
iv. allowing ecologically sustainable development and use of marine environments; and
v. providing opportunities for public appreciation, education, understanding and enjoyment of marine environments.”
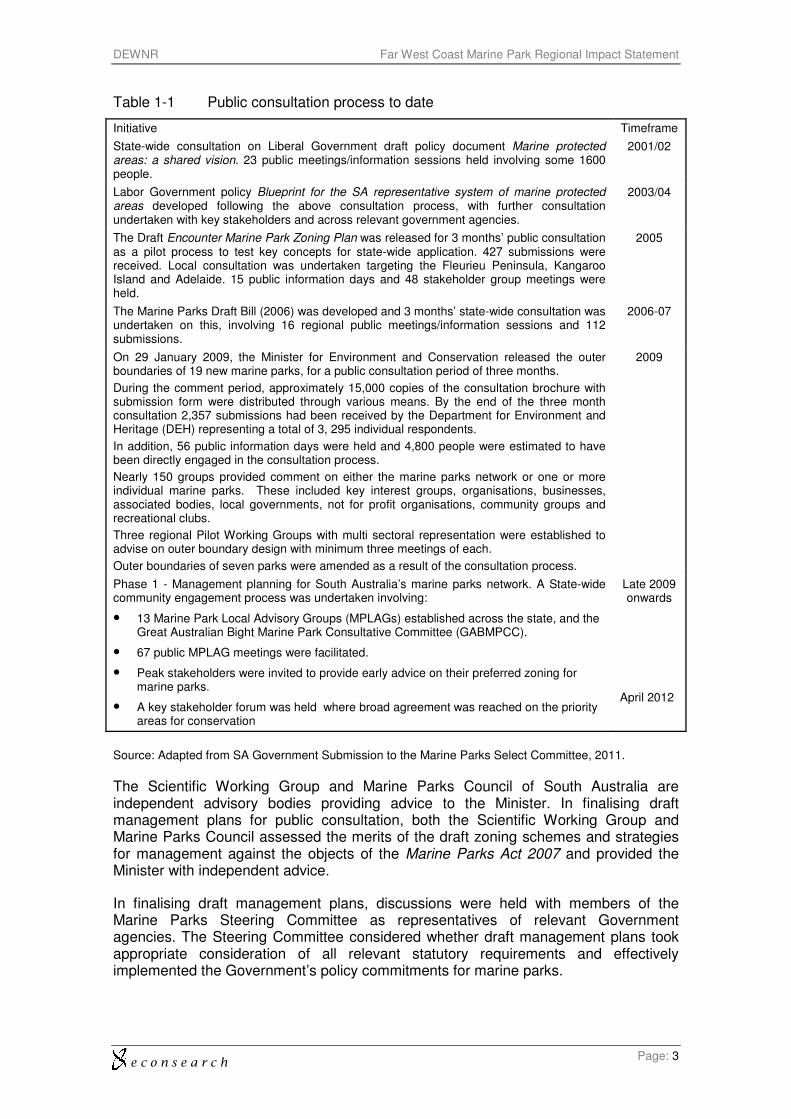
The Government dedicated significant resources to gathering environmental, economic and social knowledge and working with community and key stakeholder interests to develop draft park zoning. Key elements of this process are described in Table 1-1.
e c o n s e a r c h
DEWNR Far West Coast Marine Park Regional Impact Statement
Page: 3
Table 1-1 Public consultation process to date
Initiative Timeframe
State-wide consultation on Liberal Government draft policy document Marine protected areas: a shared vision. 23 public meetings/information sessions held involving some 1600 people.
2001/02
Labor Government policy Blueprint for the SA representative system of marine protected areas developed following the above consultation process, with further consultation undertaken with key stakeholders and across relevant government agencies.
2003/04
The Draft Encounter Marine Park Zoning Plan was released for 3 months’ public consultation as a pilot process to test key concepts for state-wide application. 427 submissions were received. Local consultation was undertaken targeting the Fleurieu Peninsula, Kangaroo Island and Adelaide. 15 public information days and 48 stakeholder group meetings were held.
2005
The Marine Parks Draft Bill (2006) was developed and 3 months’ state-wide consultation was undertaken on this, involving 16 regional public meetings/information sessions and 112 submissions.
2006-07
On 29 January 2009, the Minister for Environment and Conservation released the outer boundaries of 19 new marine parks, for a public consultation period of three months.
During the comment period, approximately 15,000 copies of the consultation brochure with submission form were distributed through various means. By the end of the three month consultation 2,357 submissions had been received by the Department for Environment and Heritage (DEH) representing a total of 3, 295 individual respondents.
In addition, 56 public information days were held and 4,800 people were estimated to have been directly engaged in the consultation process.
Nearly 150 groups provided comment on either the marine parks network or one or more individual marine parks. These included key interest groups, organisations, businesses, associated bodies, local governments, not for profit organisations, community groups and recreational clubs.
Three regional Pilot Working Groups with multi sectoral representation were established to advise on outer boundary design with minimum three meetings of each.
Outer boundaries of seven parks were amended as a result of the consultation process.
2009
Phase 1 - Management planning for South Australia’s marine parks network. A State-wide community engagement process was undertaken involving:
• 13 Marine Park Local Advisory Groups (MPLAGs) established across the state, and the Great Australian Bight Marine Park Consultative Committee (GABMPCC).
• 67 public MPLAG meetings were facilitated.
• Peak stakeholders were invited to provide early advice on their preferred zoning for marine parks.
• A key stakeholder forum was held where broad agreement was reached on the priority areas for conservation
Late 2009 onwards
April 2012
Source: Adapted from SA Government Submission to the Marine Parks Select Committee, 2011.
The Scientific Working Group and Marine Parks Council of South Australia are independent advisory bodies providing advice to the Minister. In finalising draft management plans for public consultation, both the Scientific Working Group and Marine Parks Council assessed the merits of the draft zoning schemes and strategies for management against the objects of the Marine Parks Act 2007 and provided the Minister with independent advice.
In finalising draft management plans, discussions were held with members of the Marine Parks Steering Committee as representatives of relevant Government agencies. The Steering Committee considered whether draft management plans took appropriate consideration of all relevant statutory requirements and effectively implemented the Government’s policy commitments for marine parks.
e c o n s e a r c h
DEWNR Far West Coast Marine Park Regional Impact Statement
Page: 4
Based on the collective advice from MPLAGs, other community members, peak stakeholders and discussions across relevant agencies, the Government developed a draft management plan with zoning for each of the 19 marine parks for formal public consultation. The draft management plans are currently out for public consultation.
1.2 Policy Commitments
The Government has made a range of policy commitments2 to help ensure South Australian lifestyles and livelihoods are maintained, and to provide more certainty for the industries that use the marine environment. The commitments informed the design of zoning for each marine park, and include:
• access to specific key recreational and commercial fishing sites through appropriate zoning
• access for existing and future aquaculture development through appropriate zoning
• certainty that marine parks will not affect access to, or use of, jetties, break walls or boat ramps
• accommodation of approved coastal development as well as future development and infrastructure needs
• accommodation of approved mining, petroleum and geothermal development activities
• accommodation of shipping and harbour activities
• certainty that marine parks will not create an extra approval process as government agencies will work together to streamline administration.
1.2.1 Displaced Commercial Fishing Policy Framework
The adoption of marine park management plans with zoning will displace some commercial fishing activities. This Policy Framework3 describes the steps that support this process:
1. Avoid displacement by pragmatic zoning;
2. Redistribute effort only where possible without impacting ecological or economic sustainability of the fishery;
3. Market-based buy back of sufficient effort to avoid impact on the fishery;
4. Compulsory acquisition as a last resort option.
The Government expects that market based buy back of effort and any necessary compulsory acquisition will be undertaken under the authority of the Minister for Agriculture, Food and Fisheries. The Minister for Sustainability, Environment and Conservation will consider any fair and reasonable compensation in accordance with section 21 of the Marine Parks Act 2007, and it is envisaged that regulations will be drafted to support this process.
2 A complete list of the commitments is available at Appendix 2 of the South Australia’s Marine Parks
Network Explanatory Document which accompanies the draft management plans. 3 The Displaced Commercial Fishing Policy Framework is provided at Appendix 5 of the South
Australia’s Marine Parks Network Explanatory Document.
e c o n s e a r c h
DEWNR Far West Coast Marine Park Regional Impact Statement
Page: 5
2. Method of Assessment
This study undertook both an impact analysis and an economic evaluation, in the form of a cost benefit analysis (CBA), of implementing the marine park draft management plans. The method and results of the CBA are presented in the Main Report.
Impacts of implementing the draft management plans were assessed against a base case scenario of no management plans. This also applies to the CBA. The base case is not static, and requires an understanding of the existing trends in natural resource, economic and social conditions. There are external factors which influence both the ‘with management plan’ and the base case scenarios that need to be taken into consideration.
2.1 Ecological
The ecological impact assessment was required to:
1. describe the current status of the marine habitats, plants and animals in each marine park;
2. discuss (in qualitative terms) the services that the protected ecosystems provide to South Australians (where not possible to measure their economic value);
3. identify the range of activities that impact on the environment and quantify how the draft management plans will influence the marine environment, against a base case of no management plans;
4. assess the implications of the management plans in 5, 10 and 20 years on species diversity and abundance, marine habitats, and ecosystem function;
5. include case studies that highlight the potential impacts of the draft management plans on iconic and threatened species and contribute to case studies that effectively communicate the trade-offs between the different environmental, social and economic factors.
The outcomes for Items 1, 4 and 5 listed above are included in each individual park statement and can be found in Section 4 of this impact statement. The outcomes for Item 2 are generic across the park network and are briefly introduced in Section 3.1 of this impact statement and detailed in Appendix 4 of the Main Report (see Ecosystem services). The outcomes for Item 3 inform the outcomes for Items 4 and 5, and are discussed in a generic sense in Appendix 1.1.4 of the Main Report. It should be noted that despite the broad spectrum of activities that can potentially be influenced by zoning under the Marine Parks Act 2007, the proposed zones have been located in such a manner that very few current activities will be affected. The most widespread of these is fishing, with the cessation of all forms of fishing inside most SZs and RAZs (with exceptions relating to existing restrictions), and benthic trawling inside HPZs of six parks. Furthermore, predicting species and ecosystem responses to the cessation of fishing is highly complex (see Appendix 1.3 of the Main Report) and, compared to other activities, there are generally more data available to inform the assessment. Consequently, the extent and depth of discussion on fishing-related responses may appear to be disproportionate in comparison to other activities, but this is not intended to place any particular emphasis on fishing as a threatening process.
The process of ecological impact assessment undertaken for the current report can essentially be summarised by three main steps:
e c o n s e a r c h
DEWNR Far West Coast Marine Park Regional Impact Statement
Page: 6
1. Activities and uses: determining the range of activities and uses that potentially impact on the marine environment under current management regimes, and then determining how the marine park zoning and management arrangements will influence them.
2. Baseline: determining the current status of the marine species, habitats, and ecosystems in the marine parks; what are we comparing future changes against?
3. Predictions: assessing the implications of the marine park zoning and management arrangements in 5, 10 and 20 years on species, habitats, and ecosystems against the case of no marine park zoning and management arrangements.
A total of 205 species or species groups, 11 habitat types, and 11 habitat-based ecosystem types were selected for the impact assessment (see Appendices 2, 4 and 6 of the Main Report).
Further details of the method can be found in Appendix 1 of the Main Report.
2.2 Economic
At a regional level, the economic impact analysis was based on the input-output method. This method provides a standard approach for the estimation of the economic impact of a particular activity. The input-output model is used to calculate industry multipliers that can then be applied to various change scenarios, as has been done in this study.
For this impact assessment an input-output model was constructed specifically for the Far West Coast region (see Map in Appendix 1). The model is known as a Regional Industry Structure and Employment (RISE) model which is an extension of the standard input-output model that is used within the SA Government for various types of impact assessment.
At a micro level individual businesses could be impacted by marine parks. To assess the impact on commercial fishing operations representative financial models of fishing businesses were constructed for each of the relevant fishing sectors. These models were based on financial information collected and reported by EconSearch (2010) over the past 13 years. The results of the financial modelling provided input into the regional RISE model to estimate impacts on the regional economy.
The principal driver for change in fishing industry operations and profitability is lost access to the resource. Estimates of displaced catch were provided by the South Australian Research and Development Institute (SARDI). PIRSA Fisheries and Aquaculture provided detailed information on the recreational and commercial fisheries relating to the:
• current condition of the fishery;
• outlook for the fishery without marine parks management plans;
• marine parks impacts on the fishery; and
• measures to mitigate anticipated impacts.
Discussions were also held with representatives of each of the commercial fishing sectors, recreational fishing, mining, various State Government departments and Local
e c o n s e a r c h
DEWNR Far West Coast Marine Park Regional Impact Statement
Page: 7
Government (see Appendix 3). These discussions provided insights to the likely responses of businesses and organisations associated with or members of the interviewee’s organisation. Because of time and resource constraints it was not possible to undertake discussions with or collect data from all potentially impacted parties.
Because some of the activities that could potentially be impacted by marine parks are related to the tourism sector, the Far West Coast RISE model includes explicit specification of the regional tourism industry. This was done by following the standard ABS method of constructing tourism satellite accounts.
The following indicators of economic impact were generated using the economic modelling framework described above:
• value of output,
• gross regional product (GRP),
• household income and
• employment.
(Value of) Output is a measure of the gross revenue of goods and services produced by commercial organisations (e.g. the value of processed seafood products) and gross expenditure by government agencies. Total output needs to be used with care as it can include elements of double counting when the output of integrated industries is added together (e.g. the value of processed seafood includes the beach value of the fish).
Gross regional product (GRP) is a measure of the net contribution of an activity to the regional economy. GRP is measured as value of output less the cost of goods and services (including imports) used in producing the output. In other words, it can be measured as the sum of household income, 'gross operating surplus and gross mixed income net of payments to owner managers' and 'taxes less subsidies on products and production'. It represents payments to the primary inputs of production (labour, capital and land). Using GRP as a measure of economic impact avoids the problem of double counting that may arise from using value of output for this purpose.
Household income is a component of GRP and is a measure of wages and salaries paid in cash and in-kind, drawings by owner operators and other payments to labour including overtime payments, employer’s superannuation contributions and income tax, but excluding payroll tax.
Employment is a measure of the number of working proprietors, managers, directors and other employees, in terms of the number of full-time equivalent (fte) jobs. Employment is measured by place of remuneration rather than place of residence.
Further details of the economic method can be found in Section 3.2 of the Main Report.
2.3 Social
The identification of potential social impacts of different marine park zoning options has been informed by a review of relevant research, analysis of the Environmental, Economic and Social Values Statements developed for each park, a review of the minutes and available correspondence of Marine Parks Local Advisory Groups (MPLAG), an overview of local media reports on the parks, an examination of market research on community perspectives on the establishment of marine parks, an
e c o n s e a r c h
DEWNR Far West Coast Marine Park Regional Impact Statement
Page: 8
assessment of MPLAG member perspectives on zoning options and targeted impact assessment interviews. An analysis of SAMPIT4 data was also undertaken to identify the potential impact of the zoning proposal on recreational fishing. An examination of the impacts of the establishment of marine parks in relevant jurisdictions was undertaken to inform the design of the social impact assessment tool.
A ‘Marine Parks Social Impact Assessment Tool’ (MPSIAT) was developed by the Australian Institute for Social Research to identify and compare potential social impacts from the preliminary DEWNR marine park sanctuary zones (DEWNR zones) and zones resulting from Marine Park Local Advisory Groups advice (MPLAG zones). MPSIAT respondents provided perspectives on impacts of zoning proposals based on their experience and expertise. Final MPLAG zone advice was normally based on a majority view. While this approach to decision making delivers a decision it does tend to obscure differences in views and opposing views on potential impacts from the perspectives of different stakeholders. The MPSIAT has been designed to shed light on these differences in order to identify a range of potential social impacts identified by key stakeholders. In the context of the impact assessment process these perspectives can inform our understanding of what the social impacts of the draft zoning proposal are likely to be. This impact assessment statement helps to identify what the likely social impacts will be.
This social impact assessment provides baseline perspectives on potential positive and negative impacts across five domains:
• Education and wellbeing;
• Culture and heritage;
• Recreation and fishing;
• Population and housing; and
• Community.
Social vulnerability of the Impact Region associated with each Marine Park has been determined through a combination of Socio-Economic Indexes for Areas (SEIFA) indexes, population (health, family, education, Indigenous status) and economic characteristics (unemployment, job losses).
The SEIFA Indexes presented here provide a measure of the socio-economic disadvantage for the Impact Regions associated with Marine Parks at the time of the 2006 Census5. We have included figures from the Index of Relative Socio-economic Disadvantage, the Index of Economic Resources and the Index of Education and Occupation. Each of these provides a slightly different view of the socio-economic profile and potential vulnerability of each region.
4 The South Australian Marine Parks Information Tool (SAMPIT) is a computer tool designed to gather
information from community members about their favourite fishing spots and areas they believe need protection. Data is collected and reported by ‘grid cell’. SAMPIT data for 1,739 people is available including 1311 recreational fishers. Quality control by the Department of Environment and Natural Resources included cross-verification of legitimate naming and activities from the data provided (DENR 2010b).
5 Australian Bureau of Statistics. 2008. Census of Population and Housing: Socio-Economic
Indexes for Areas (SEIFA), Australia - Data only 2006 (cat. no. 2033.0.55.001) and Information Paper: An Introduction to Socio-Economic Indexes for Areas (SEIFA), 2006 (cat. no. 2039.0). Note SEIFA Indexes for the 2011 Census are not yet available.
e c o n s e a r c h
DEWNR Far West Coast Marine Park Regional Impact Statement
Page: 9
SEIFA values have been standardised with Australia (as a whole) having a value of 1000 and a standard deviation of 100, low scores indicate greater disadvantage. South Australia sits below the Australian average with a relative disadvantage level of 979. At the SLA level, South Australian SEIFA relative disadvantage scores range from a low of 527 through to 1,107.
A range of SEIFA values at the statistical local areas (SLA) level are associated with the Impact Regions, noting between one and seven SLAs are associated with each Impact Region. These capture information about average socio-economic conditions for the SLA and Impact Region but do not account for variation of individuals within the areas. Areas identified with relative disadvantage may well have individuals and sub-regions that are relatively advantaged. We have also presented individual variables to provide additional information about the potential social vulnerability of SLAs associated with the Impact Regions.
Where an Impact Region has an SLA falling within the top decile in South Australia (i.e. most disadvantaged) a ranking of High is provided. A ranking in the second highest decile is ranked as Moderate. Where there are moderate to high ranking SLAs they are rated to as Moderate-High.
It is important to acknowledge that the impact of marine parks on employment and wellbeing is likely to vary significantly across regions and will be mediated by a range of social and economic factors including:
• the age and retirement intentions of fishers;
• the ability of fishers to adapt to changes within the region in which they fish;
• the opportunities available to fishers and those dependent on fishers to work
in other industry sectors;
• the impact of compensation packages provided to fishers on their financial
circumstances and the local economy;
• the influence of lifestyle attachment and importance of place in the lives of
fishers
• the extent to which the existence of marine parks might generate employment
in tourism, research, education and other sectors.
e c o n s e a r c h
DEWNR Far West Coast Marine Park Regional Impact Statement
Page: 10
3. Far West Coast Marine Park Description
Situated between the Western Australian border and the Tchalingaby sand hills, the Far West Coast Marine Park covers 1,690km2 and is located within the Eucla Bioregion. This park encompasses the Great Australian Bight Marine Park and partially overlays the Nullarbor National Park and Wahgunyah Conservation Park up to median high water (DENR 2010a).
A map of the Far West Coast Marine Park and the proposed draft zoning is provided at the end of this statement at Appendix 5.
3.1 Ecological Description
The shoreline habitats of the park are characterised by limestone cliffs, interspersed by rocky headlands, narrow intertidal wave-cut rock platforms, reefs and beaches. The rocky coastline habitats are dominated by species of large brown macroalgae and smaller red coralline algae typically associated with exposure to the strong south-westerly swell, high waves and low-nutrient warm water (DENR, 2010a).
For the current impact assessment, coastal and marine habitats/ecosystems were divided into the following types: saltmarsh, mangrove, intertidal sand flat, subtidal sand, intertidal seagrass flat, subtidal seagrass, intertidal reef, subtidal high profile reef, subtidal low profile reef, beach, and pelagic. The extent of these habitats (except pelagic) mapped for this park are shown in Table 3-1.
These eleven habitats/ecosystems, and others not considered in the current impact assessment, support thousands of species (Edyvane, 1999; Baker, 2004). They also offer goods and services that are of economic, social and environmental value to SA. The economic value of these services can be difficult to determine but to illustrate the importance of valuing coastal marine habitats in SA a description of the necessary goods and services that need to be taken into account is provided. The goods and services provided by coastal, marine and estuarine habitats were classified under four headings by McLeod and Leslie (2009). These headings were:
• Life supporting services,
• Resources and products,
• Maintaining Earth’s living space and
• Recreational and cultural services.
Each one of these headings was divided into categories that could be more easily valued, either directly or as a service. A more detailed discussion of these goods and services is provided in Appendices 4 (habitat specific information) and 5 (consolidated discussion) of the Main Report.
e c o n s e a r c h
DEWNR Far West Coast Marine Park Regional Impact Statement
Page: 11
Table 3-1 Summary of habitats
Zone
Shoreline habitats (km of coastline) Benthic habitats (square km)
Be
ach
Inte
rtid
al s
an
d
Inte
rtid
al
se
ag
rass
Inte
rtid
al r
ee
f
Ma
ng
rove
Sa
ltm
ars
h
Su
btida
l hig
h
pro
file
re
ef
Su
btida
l lo
w
pro
file
re
ef
Su
btida
l sa
nd
Su
btida
l se
ag
rass
Un
ma
ppe
d
RAZ-1 25.6 (12.4) 203.2 3.7 28.2 154.3 407.8
SZ-1 4.2 (0.1) 2.9 11.1 606.3
SZ-2 6.3 1.3 0.5 0.7 20.5 17.2
SZ-3 9.7 1.1 0.1 0 10.9 44.6
HPZ-1 16.7 0.1 0.4 44.7 45.4
HPZ-2 48.5 4.5 2.1 1.1 160.9 129.2
Total 111 213 6.5 41.5 391.3 1251
Source: based on GIS data provided by DEWNR.
Zones are labelled as shown in Appendix Figure 5-1. RAZ-2 has been omitted—it is a new zone, provided by DEWNR (29/06/2012) during finalisation of this report, which overlays the entire park from 1 May to 31 October.
Intertidal habitats are expressed as shoreline habitats to be consistent with DENR (2010a), and/or because of mapping limitations, and do not provide a complete indication of the extent of these habitats within the park.
Intertidal habitats are expressed as shoreline lengths to be consistent with DENR (2010a), and/or because of limitations of the available GIS data, and therefore do not provide a complete indication of the extent of these habitats within the park. Brackets indicate the length of shoreline habitat within an SZ along which shore-based line fishing is allowed.
The zero value indicates presence but <0.05 km2. Totals may differ slightly from column sums due to
rounding.
3.2 Socio-economic Profile
The socio-economic profile provided in Appendix 1 presents a statistical summary of key economic and social information for the Far West Coast region and, where possible, South Australia (SA). The profile brings together a wide range of existing Australian Bureau of Statistics (ABS) data and some non-ABS data. It has been designed, at a broad level, to aid understanding of the economic and social structure of the region, to indicate how the Far West Coast region contributes to the State economy and to illustrate trends in economic growth or decline.
The Far West Coast region is located in the far west of the state (Appendix Figure 1-1). The two statistical local areas (SLAs) that comprise the region are Ceduna (DC) and Unincorporated West Coast. The Far West Coast regional economy is relevant to the Far West Coast (MP1) and Nuyts Archipelago (MP2) marine parks. Table 3-2 presents a summary of the key economic and social information detailed further in Appendix 1.
Some key points from the detailed socio-economic profile in Appendix 1 are as follows:
• The estimated resident population of the Far West Coast was around 4,300 persons in 2009/10.
• Compared with the age distribution of the state as a whole, the Far West Coast region has a higher concentration of younger people (aged 0 to 14

e c o n s e a r c h
DEWNR Far West Coast Marine Park Regional Impact Statement
Page: 12
years), a similar share of persons aged 15 to 64 years and, consequently, a lower than average share of people aged 65 and over.
• The total population in the Far West Coast region is projected to increase by just 5 per cent by 2026, whereas the SA population is expected to increase by more than four times that, around 23 per cent.
• The unemployment rate in the Far West Coast region was 8.6 per cent in the June quarter of 2011, well above the state rate and is more than double the rate of 4 years earlier.
• Approximately 50 per cent of the businesses in the Far West Coast region were classified in the agriculture, forestry and fishing sector and 11 per cent were in the construction sector.
• Over the period 2000/01 to 2008/09, the mean taxable income (in nominal terms) increased by 61 per cent in the Far West Coast region ($45,600 in 2008/09) and 47 per cent in SA as a whole ($52,000 in 2008/09).
• Median dwelling (units and houses) prices increased by 273 per cent in the Far West Coast region ($250,000 in 2010/11) and 197 per cent in SA as a whole ($357,500 in 2010/11) over the period 2000/01 to 2010/11.
• In 2009/10, the top four contributors to total jobs in the region were the agriculture, forestry and fishing (15 per cent), health and community services (14 per cent), education (13 per cent) and retail trade (12 per cent) sectors.
• In 2009/10, the top four contributors to GRP were the agriculture, forestry and fishing (15 per cent), ownership of dwellings (14 per cent), health and community services and transport and storage (7 per cent each) sectors.
• The commercial fishing and tourism industries are important to the local economy in terms of contributing to jobs and GRP. Directly and indirectly commercial fishing and aquaculture contributed 4 per cent of GRP ($6.1 million) and 6 per cent of employment (107 fte jobs) in 2009/10. By comparison, the tourism sector contributed 7 per cent of GRP ($12.4 million) and 9 per cent of employment (164 fte jobs).

e c o n s e a r c h
DEWNR Far West Coast Marine Park Regional Impact Statement
Page: 13
Table 3-2 Summary of key economic and social indicators for the Far West Coast region
IndicatorFar West
CoastSA
Far West Coast as
a proportion of SA
Population, 2009/10 (no.) 4,330 1,644,582 0.3%
Birth Rate, 2008/09 (births/1000 residents) 15.6 12.1 -
Death Rate, 2008/09 (deaths/1000 residents) 6.5 7.7 -
Age Distribution, 2009/10:
Proportion of Population aged 0-14 23% 18% -
Proportion of Population aged 15-64 66% 67% -
Proportion of Population aged 65+ 11% 16% -
Dependency Rate, 2009/10:
Child 35% 27% -
Aged 16% 23% -
Total 51% 50% -
Population Projection, Increase from 2006 to 2026 5% 23% -
Employment, June qtr 2011:
Labour Force (no.) 2,228 867,500 0.3%
Unemployed (no.) 192 45,300 0.4%
Unemployment Rate 9% 5% -
Participation Rate, 2009/10 62% 63% -
Businesses, June 2009 (no.) 366 141,625 0.3%
School Enrollments, 2006 (no.) 693 245,388 0.3%
Tertiary Enrollments, 2006 (no.) 578 202,011 0.3%
Non-school Qualifications, 2006 (no.) 1,208 595,379 0.2%
Mean Taxable Income, 2008/09 ($) 45,559 51,932 -
Proportion of Taxable Individuals, 2008/09 71% 75% -
Value per Buiding Approval, 2009/10 ($) 188,295 213,828 -
Median Dwelling Price, 2010/11 ($) 250,000 357,500 -
Commercial Fishing, Ave/yr 2000/01 to 2009/10:
Catch (t) 299 47,581 0.6%
Value of Catch ($m) 6 202 2.8%
Charter Boats, Ave/yr 2007/08 to 2009/10 (no. of fish) 4,242 146,341 2.9%
Recreational Fishing, 2007/08:
Fishers (no.) 7,750 236,463 3.3%
Days Fished (no.) 35,656 1,054,200 3.4%
Gross Regional Product, 2009/10 ($m) 174 80,356 0.2%
Employment, 2009/10 (fte) 1,872 774,953 0.2%
Tourism, 2009/10 ($m) 26 4,524 0.6%
Other Regional Exports, 2009/10 ($m) 81 26,757 0.3%
Regional Imports, 2009/10 ($m) 185 40,573 0.5%
Source: Appendix 1.
e c o n s e a r c h
DEWNR Far West Coast Marine Park Regional Impact Statement
Page: 14
4. Summary of Impacts
4.1 Ecological
This section presents the summarised results of the ecological impact assessment for this particular park. As such, output tables and other information presented that are not otherwise referenced, represent the professional judgement of the authors. Full details behind the assessments can be found in the Main Report and accompanying appendices (see cross-references below).
4.1.1 Habitats
The habitats within the park are considered to be at a level comparable to the time of European settlement. The park is adjacent to the Nullarbor National Park to the west (approximately 190 km of coastline), and the Wahgunyah Conservation Park to the east (approximately 40 km), with the Yalata Aboriginal Reserve in between (approximately 100 km). The park is therefore unlikely to be subject to land-based threats.
The proposed zoning plan will influence future activity in all zones and apply specific restrictions on future activity within HPZs, SZs and RAZs, with respectively increasing protection across this hierarchy of zone types (see Appendix 1.2.6 of the Main Report). The Far West Coast Marine Park has about 23 per cent, 42 per cent and 35 per cent of the total park area designated as HPZ, SZ and RAZ, respectively.
For the Far West Coast Marine Park, some of the habitats of particular conservation note are the diversity of intertidal habitats used by sea lions (breeding and haul-out), fur seals (haul-out), sea birds (nesting) and migratory wader birds (SZ-1) and resident wader birds (SZ-2), and the shallow subtidal habitats used by the southern right whale for calving (SZ-1, HPZ-1).
4.1.2 Species
4.1.2.1 Threatened and protected species
A large number of marine species are protected in SA under either State and/or Federal legislation, including all syngnathids (seahorses, seadragons, pipefishes, pipehorses), all marine mammals and most seabirds. Some of these species are also listed as threatened species under either State and/or Federal legislation. It was beyond the scope of this impact statement to assess all of these species, but some of the species or species groups that were identified in the Ecosystem Food Webs (see Appendix 6 of the Main Report) and/or that are a key feature of this particular marine park are considered here. Each of these species is discussed in more detail in Appendix 3 of the Main Report.
The following species may benefit from maintenance and/or improvement of habitats and ecological processes within the park:
• Australian sea lion (threatened and protected species) (breeding colonies along the Bunda Cliffs)
e c o n s e a r c h
DEWNR Far West Coast Marine Park Regional Impact Statement
Page: 15
• Southern right whale (threatened and protected species) (calving area at the Head of the Bight)
• Little penguin (protected species) (breeding colonies along the Bunda Cliffs)
• New Zealand fur seal (protected species)
• White shark (threatened and protected species)
• Common dolphin (protected species)
• White-bellied sea eagle (threatened and protected species)
• Eastern osprey (threatened and protected species)
Changes in abundance of these species due to the introduction of the proposed management arrangements are not able to be predicted over the next 20 years due to the complexities of ecosystem interactions and/or a lack of data on current status and zone use. Listed threatened species often have individual recovery plans that identify objectives/actions required to mitigate against threatening processes that will ultimately allow recovery of the species. Protection of critical habitat is often identified in these plans as a useful objective, and thus the protection of breeding and aggregation areas under the proposed zoning arrangements should have some positive impact on the Australian sea lion, southern right whale, and white shark. However, it is unlikely that the main anthropogenic threatening processes to these species (or the white-bellied sea eagle and eastern osprey) will be out-weighed by any potential positive impact from the park zoning and management plan (see Species Profiles in Appendix 3 of the Main Report). Nonetheless, some of the zones of particular note for threatened and protected species within the Far West Coast Marine Park are:
• SZ-1/RAZ-1 which includes the southern right whale calving area at the Head of the Bight
• SZ-1 which includes the waters adjacent to the Australian sea lion breeding colonies along the Bunda Cliffs
• SZ-1 which is adjacent to a white-bellied sea eagle territory
• SZ-1 and SZ-3 which are adjacent to eastern osprey territories
4.1.2.2 Fished species
South Australia’s proposed system of marine parks was designed for biodiversity conservation purposes rather than as a fisheries management tool. Nevertheless, the impact assessment identified that species which are currently fished are most likely to show a direct first-order response over the next 20 years (relative to current uses) to the proposed management arrangements and zonings (see Appendix 1.3 of the Main Report). Therefore the assessment of the impact on 20 indicator fished species has been provided in a specific section here. More detailed discussion on the rationale for selecting the indicator species, and their expected response to protection, can be found in Appendices 1.3.4 and 3 of the Main Report.
Fishing activity to the west of the Head of the Bight is relatively low. Recreational beach fishing occurs (mainly in the eastern part of the park) and commercial fishing occurs across the park. The current status of the only indicator species that was able to be assessed (southern rock lobster) within various sanctuary zones of the park was considered to be at an unnaturally low level (UNLL) compared with a pre-European (pre-fishing) baseline (Table 4-1). A pre-fishing baseline rather than the current
e c o n s e a r c h
DEWNR Far West Coast Marine Park Regional Impact Statement
Page: 16
baseline is required to enable future predictions of change because the level of fishing activity prior to protection influences the response following protection (see Appendix 1 of the Main Report). The reduced level of this species does not necessarily reflect poorly on fisheries management in accordance with the principles of ecologically sustainable development.
Predicting ecological responses to marine parks is inherently complex and depends on many factors (see Appendix 1.3.7 in the Main Report). In the few instances where it has been attempted, the actual changes have often been different to the predictions (Langlois and Ballantine, 2005). Nevertheless, as required for this assessment, some predictions have been attempted based on a number of assumptions listed in Appendix 1.3.13 of the Main Report. Each species is considered only in isolation and therefore interactions between species also need to be considered when interpreting the potential responses described below (see Section 4.1.3).
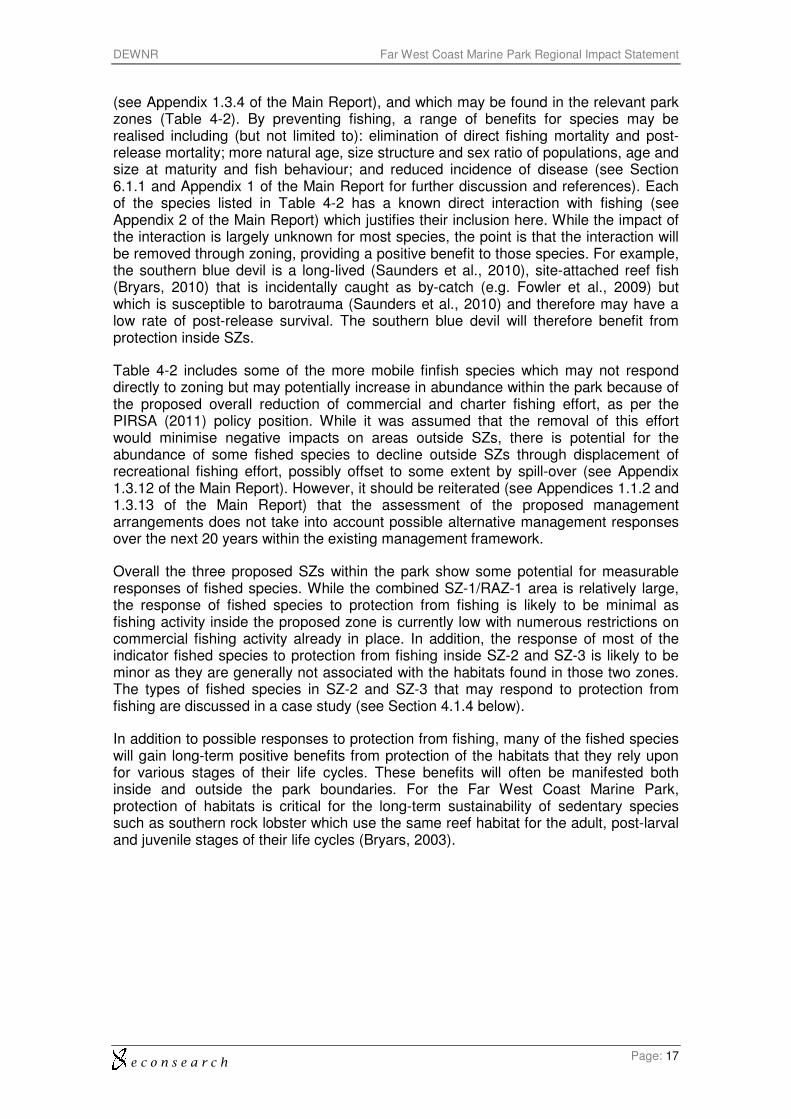
Table 4-1 summarises the outcomes of the predictive modelling that was undertaken on a subset of indicator species (see Appendix 1.3 of the Main Report for further details of the methodology, in particular the list of assumptions and limitations in Appendix 1.3.13). For southern rock lobster, Table 4-1 indicates that the current status of adult southern rock lobster is at UNLL in sanctuary zones 1 and 2, which all include reef habitat used by lobster. Under the proposed zoning, the adults and sub-adults already resident in these sanctuary zones and any post-larval juveniles that then become residents (or recruits) would be protected. Consequently, the potential exists for the size and abundance of adults to increase within these zones after 5 years (shown as +), 10 years (shown as ++) and 20 years (shown as +++) (Table 4-1). Without the proposed zoning, adult lobsters would continue to be harvested and the population level was assumed to remain as it is today, as indicated by the zeros at 5, 10 and 20 years. Thus the predicted net effect of the proposed zoning arrangements shown in Table 4-1 is a positive increase within these zones across 5, 10 and 20 years6. Table 4-1 also shows for southern rock lobster that there is potential for: a spill-over as a result of the population density inside the SZs increasing relative to outside to the point where some lobsters will tend to migrate from the SZ; and increased larval production from inside the SZs due to increased lobster abundance and increased spawning. It should be noted that due to existing management arrangements, RAZ-1 has been protected from lobster fishing for some time now and thus a response to no fishing inside that zone may already be underway and that this could potentially accentuate the response inside the adjacent SZ-1 through long-term spill-over.
Of the other indicator species assessed (and which are not presented in Table 4–1), the following observations were made for the Far West Coast Marine Park:
• Species occurring within the park but with insufficient information to enable an assessment include: snapper, Bight redfish, swallowtail, sea sweep, bluethroat wrasse, harlequin fish, western blue groper, King George whiting, southern garfish, blacklip/greenlip abalone, and southern calamary.
• Species considered as not occurring within the park include: yellowfin whiting, blue swimmer crab, western king prawn, razorfish, Goolwa cockle and mud cockle.
In addition to the species that were able to be assessed, there are numerous species (target, by-product, by-catch) that may respond to protection from fishing within SZs
6 Current management arrangements are aiming for a recovery of lobster populations in the Northern
and Southern Zones. Nonetheless, the increase inside SZs would still be expected to be greater than outside, but the net effect of the SZs would be lowered.
e c o n s e a r c h
DEWNR Far West Coast Marine Park Regional Impact Statement
Page: 17
(see Appendix 1.3.4 of the Main Report), and which may be found in the relevant park zones (Table 4-2). By preventing fishing, a range of benefits for species may be realised including (but not limited to): elimination of direct fishing mortality and post-release mortality; more natural age, size structure and sex ratio of populations, age and size at maturity and fish behaviour; and reduced incidence of disease (see Section 6.1.1 and Appendix 1 of the Main Report for further discussion and references). Each of the species listed in Table 4-2 has a known direct interaction with fishing (see Appendix 2 of the Main Report) which justifies their inclusion here. While the impact of the interaction is largely unknown for most species, the point is that the interaction will be removed through zoning, providing a positive benefit to those species. For example, the southern blue devil is a long-lived (Saunders et al., 2010), site-attached reef fish (Bryars, 2010) that is incidentally caught as by-catch (e.g. Fowler et al., 2009) but which is susceptible to barotrauma (Saunders et al., 2010) and therefore may have a low rate of post-release survival. The southern blue devil will therefore benefit from protection inside SZs.
Table 4-2 includes some of the more mobile finfish species which may not respond directly to zoning but may potentially increase in abundance within the park because of the proposed overall reduction of commercial and charter fishing effort, as per the PIRSA (2011) policy position. While it was assumed that the removal of this effort would minimise negative impacts on areas outside SZs, there is potential for the abundance of some fished species to decline outside SZs through displacement of recreational fishing effort, possibly offset to some extent by spill-over (see Appendix 1.3.12 of the Main Report). However, it should be reiterated (see Appendices 1.1.2 and 1.3.13 of the Main Report) that the assessment of the proposed management arrangements does not take into account possible alternative management responses over the next 20 years within the existing management framework.
Overall the three proposed SZs within the park show some potential for measurable responses of fished species. While the combined SZ-1/RAZ-1 area is relatively large, the response of fished species to protection from fishing is likely to be minimal as fishing activity inside the proposed zone is currently low with numerous restrictions on commercial fishing activity already in place. In addition, the response of most of the indicator fished species to protection from fishing inside SZ-2 and SZ-3 is likely to be minor as they are generally not associated with the habitats found in those two zones. The types of fished species in SZ-2 and SZ-3 that may respond to protection from fishing are discussed in a case study (see Section 4.1.4 below).
In addition to possible responses to protection from fishing, many of the fished species will gain long-term positive benefits from protection of the habitats that they rely upon for various stages of their life cycles. These benefits will often be manifested both inside and outside the park boundaries. For the Far West Coast Marine Park, protection of habitats is critical for the long-term sustainability of sedentary species such as southern rock lobster which use the same reef habitat for the adult, post-larval and juvenile stages of their life cycles (Bryars, 2003).
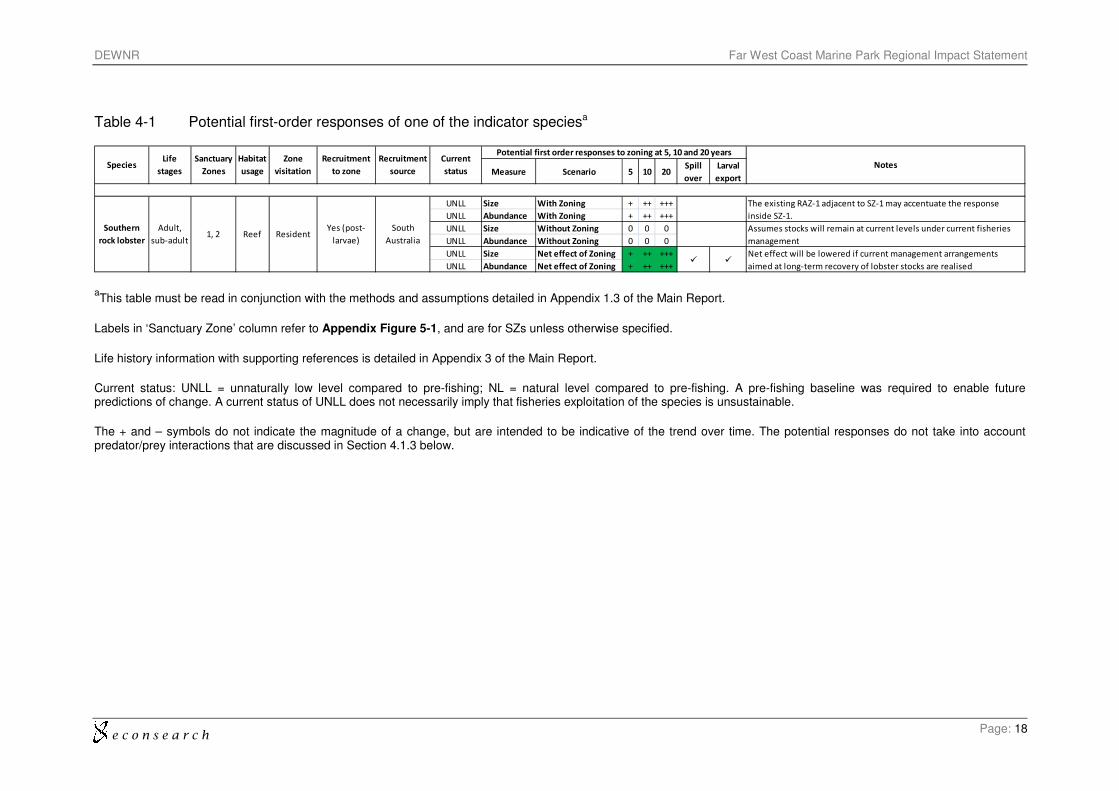
e c o n s e a r c h
DEWNR Far West Coast Marine Park Regional Impact Statement
Page: 18
Table 4-1 Potential first-order responses of one of the indicator speciesa
Measure Scenario 5 10 20Spill
over
Larval
export
UNLL Size With Zoning + ++ +++
UNLL Abundance With Zoning + ++ +++
UNLL Size Without Zoning 0 0 0
UNLL Abundance Without Zoning 0 0 0
UNLL Size Net effect of Zoning + ++ +++
UNLL Abundance Net effect of Zoning + ++ +++
Southern
rock lobster
Adult,
sub-adult1, 2 Reef Resident
Yes (post-
larvae)
South
Australia
The existing RAZ-1 adjacent to SZ-1 may accentuate the response
inside SZ-1.
Assumes stocks will remain at current levels under current fisheries
management
� �Net effect will be lowered if current management arrangements
aimed at long-term recovery of lobster stocks are realised
Recruitment
to zone
Recruitment
source
Current
status
Potential first order responses to zoning at 5, 10 and 20 years
NotesSpeciesLife
stages
Sanctuary
Zones
Habitat
usage
Zone
visitation
aThis table must be read in conjunction with the methods and assumptions detailed in Appendix 1.3 of the Main Report.
Labels in ‘Sanctuary Zone’ column refer to Appendix Figure 5-1, and are for SZs unless otherwise specified.
Life history information with supporting references is detailed in Appendix 3 of the Main Report.
Current status: UNLL = unnaturally low level compared to pre-fishing; NL = natural level compared to pre-fishing. A pre-fishing baseline was required to enable future predictions of change. A current status of UNLL does not necessarily imply that fisheries exploitation of the species is unsustainable.
The + and – symbols do not indicate the magnitude of a change, but are intended to be indicative of the trend over time. The potential responses do not take into account predator/prey interactions that are discussed in Section 4.1.3 below.
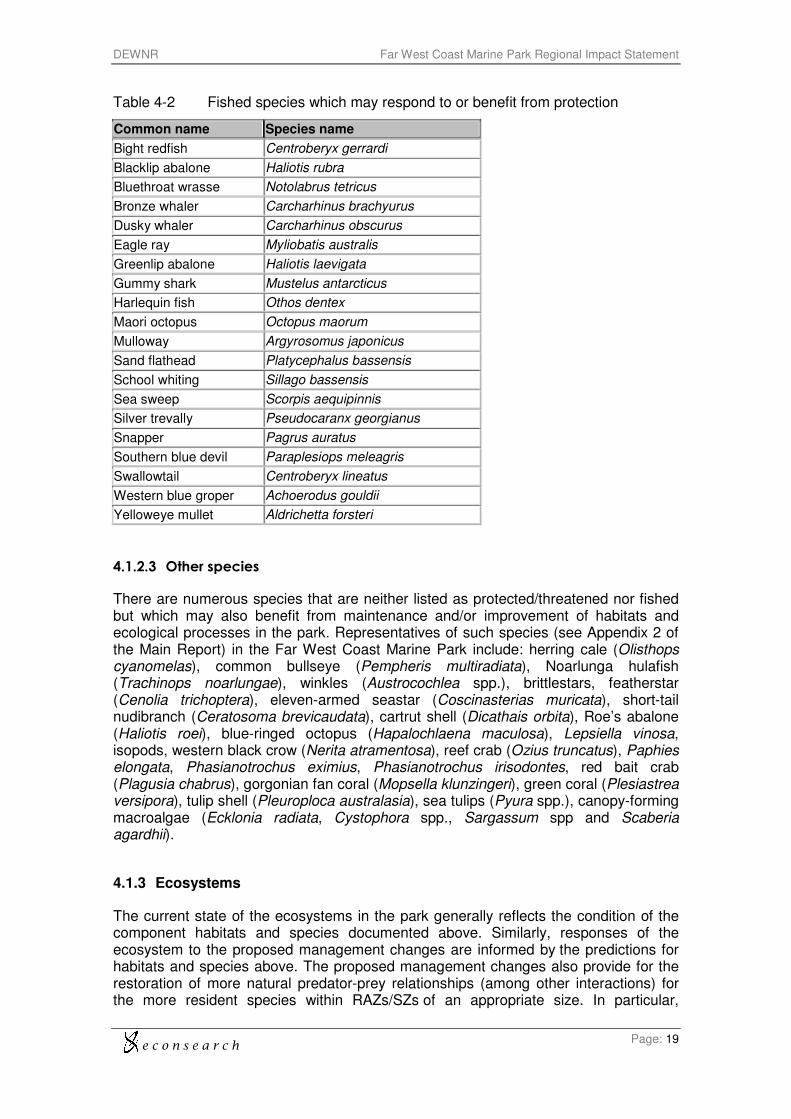
e c o n s e a r c h
DEWNR Far West Coast Marine Park Regional Impact Statement
Page: 19
Table 4-2 Fished species which may respond to or benefit from protection
Common name Species name
Bight redfish Centroberyx gerrardi
Blacklip abalone Haliotis rubra
Bluethroat wrasse Notolabrus tetricus
Bronze whaler Carcharhinus brachyurus
Dusky whaler Carcharhinus obscurus
Eagle ray Myliobatis australis
Greenlip abalone Haliotis laevigata
Gummy shark Mustelus antarcticus
Harlequin fish Othos dentex
Maori octopus Octopus maorum
Mulloway Argyrosomus japonicus
Sand flathead Platycephalus bassensis
School whiting Sillago bassensis
Sea sweep Scorpis aequipinnis
Silver trevally Pseudocaranx georgianus
Snapper Pagrus auratus
Southern blue devil Paraplesiops meleagris
Swallowtail Centroberyx lineatus
Western blue groper Achoerodus gouldii
Yelloweye mullet Aldrichetta forsteri
4.1.2.3 Other species
There are numerous species that are neither listed as protected/threatened nor fished but which may also benefit from maintenance and/or improvement of habitats and ecological processes in the park. Representatives of such species (see Appendix 2 of the Main Report) in the Far West Coast Marine Park include: herring cale (Olisthops cyanomelas), common bullseye (Pempheris multiradiata), Noarlunga hulafish (Trachinops noarlungae), winkles (Austrocochlea spp.), brittlestars, featherstar (Cenolia trichoptera), eleven-armed seastar (Coscinasterias muricata), short-tail nudibranch (Ceratosoma brevicaudata), cartrut shell (Dicathais orbita), Roe’s abalone (Haliotis roei), blue-ringed octopus (Hapalochlaena maculosa), Lepsiella vinosa, isopods, western black crow (Nerita atramentosa), reef crab (Ozius truncatus), Paphies elongata, Phasianotrochus eximius, Phasianotrochus irisodontes, red bait crab (Plagusia chabrus), gorgonian fan coral (Mopsella klunzingeri), green coral (Plesiastrea versipora), tulip shell (Pleuroploca australasia), sea tulips (Pyura spp.), canopy-forming macroalgae (Ecklonia radiata, Cystophora spp., Sargassum spp and Scaberia agardhii).
4.1.3 Ecosystems
The current state of the ecosystems in the park generally reflects the condition of the component habitats and species documented above. Similarly, responses of the ecosystem to the proposed management changes are informed by the predictions for habitats and species above. The proposed management changes also provide for the restoration of more natural predator-prey relationships (among other interactions) for the more resident species within RAZs/SZs of an appropriate size. In particular,
e c o n s e a r c h
DEWNR Far West Coast Marine Park Regional Impact Statement
Page: 20
changes might be expected in the reef ecosystems of SZ-1 and SZ-2 where first-order changes have been predicted for southern rock lobster (see Section 4.1.2.2 earlier). Interactions between lobster, blacklip abalone and urchins, and potentially blue groper, snapper and octopus, are expected, resulting in increased abundances of some species, but decreases for others (see Figure 4–1). Such changes may be more pronounced within SZ-1 which significantly extends the section of reef already partially protected within RAZ-1, but SZ-2 also contains reef within a section of coast of comparable length to a Tasmanian reserve that showed ecosystem responses to protection from lobster fishing (see Appendix 1.4.4. of the Main Report). Changes to beach ecosystems within SZ-2 and SZ-3 may also occur, as discussed in the case study below.
Natural food webs cannot be fully restored, due to the scales over which the more mobile higher- and middle-order fished species range. However, some increase in abundance of such species is expected as a result of the proposed overall reduction of fishing effort in the marine scalefish and charter fisheries, as per the PIRSA (2011) policy position, and there may be localised flow-on effects for food webs inside the marine parks.
Figure 4–1 Simplified conceptual food web for subtidal high profile reef
Sweep
Sponges
EpifaunaZooplankton
Phytoplankton
Turfing &
epiphytic algae
Tro
ph
ic le
ve
l
1
5
4
3
2
Detritus
Subtidal high profile reef
Ascidians
Turbos
Purple
urchin
Snapper
Australian
sea lion
White sharkWhaler sharks
Blacklip &
greenlip
abalone
Macroalgae
Nudibranch
Rock
lobster
Herring
cale
Calamary,
Cuttlefish
Bluethroat
& other
wrasse
Wobbegong
Harlequin
fish
Encrusting
coralline algae
Silver
drummer,
ZebrafishBullseyes,
Seadragons
Blue
groper
Red bait
crab
Maori
octopus
?
Note: showing links between a variety of species across all trophic levels and indicating those species that interact with fishing (highlighted in red). See Appendix 6 of the Main Report for further details about the food web.
It is also apparent from the simplified food webs (see Figure 4–1, Figure 4–2 and Appendix 6 of Main Report) that many fished species (shown in red text) and non-fished species are ultimately reliant upon the maintenance of habitat-forming species (such as macroalgae and seagrasses) which lie at or near the base of the food webs, and it is these very habitats that will receive a high level of protection within the marine parks network. Thus the marine parks network will have a positive long-term impact on

e c o n s e a r c h
DEWNR Far West Coast Marine Park Regional Impact Statement
Page: 21
ecosystems regardless of whether there are zone-specific responses following implementation of the management plans.
4.1.4 Case study - Mulloway and high energy beaches
The high-energy beaches and mulloway of the Yalata region are iconic. The beaches in the eastern part of the Far West Coast Marine Park have considerable lengths that lie within SZs (approximately 7 and 10 km for SZ-2 and SZ-3 respectively). This situation is unusual across the SA marine parks network as there are very few beaches elsewhere with true SZs; most of the accessible beaches allow shore fishing, either through an exemption for line fishing or through a shoreline buffer that extends offshore such that the beach is outside the park boundaries. In addition, the remainder of the beaches within the Far West Coast Marine Park lie within HPZs or SZs which should provide a level of protection from damaging activities that may be proposed in the future. These beach ecosystems support a variety of biodiversity including a number of fished species (see Figure 4–2).
Recreational shore fishing effort within the Far West Coast Marine Park is significant; it was estimated at 3639 fishing days for 2007/08 (data derived from Jones, 2009), i.e. more than 100 fishers per day on average. Species such as mulloway, Australian salmon and gummy shark are targeted. These species move along the surf beaches, but can be considered to be temporary residents at times in the gutters and holes along the beaches. Australian salmon and gummy shark are generally highly migratory (Kailola et al., 1993). For example, adult Australian salmon return from surf beaches in SA to spawning grounds in south-west WA from where they originated as larval fish; these larva are carried across the Great Australian Bight to sheltered inshore bays in SA via The Leeuwin Current. Other species harvested by recreational fishers along the surf beaches include school whiting, Australian herring, sand flathead, and yelloweye mullet. It is likely that some of these fishes are preyed upon by mulloway (see Figure 4–1).
The mulloway on the west coast are unusual in that they may represent a separate stock from those further to the east that are associated with The Coorong estuary and appear to be dependent on freshwater flows (Ferguson et al., 2011). While both juveniles and adults are present at the west coast surf beaches, it is unknown if spawning occurs in the region. If fishing mortality along the beaches is significant and mulloway do aggregate in relatively small areas for periods of time, then abundance of individuals within the SZs will be elevated compared to a scenario of no fishing. Thus if spawning does occur at these surf beaches then the SZs may offer areas where spawning can occur uninterrupted and larval production might be enhanced. In addition, if the fishing mortality of prey fishes is also reduced inside SZs then mulloway may be attracted to them (although most of the prey species mentioned above are also highly mobile). While this scenario is based on several assumptions, it does demonstrate our lack of understanding of the basic life history for many fished species and also our lack of understanding of ecological processes in habitats such as high-energy beaches. A study of the effect of a no-take marine reserve on temperate surf-zone fish assemblages in South Africa found stock recoveries of exploited fish species following protection (Bennett and Attwood, 1991). However, similar studies have not been conducted for the types of fish assemblages found in SA waters. The relatively large SZs along the high-energy beaches within the Far West Coast Marine Park would therefore provide a unique opportunity to study some of the potential interactions between fishing and iconic species such as mulloway, and also to better understand the potential impacts of fishing on these ecosystems (see Figure 4–2).
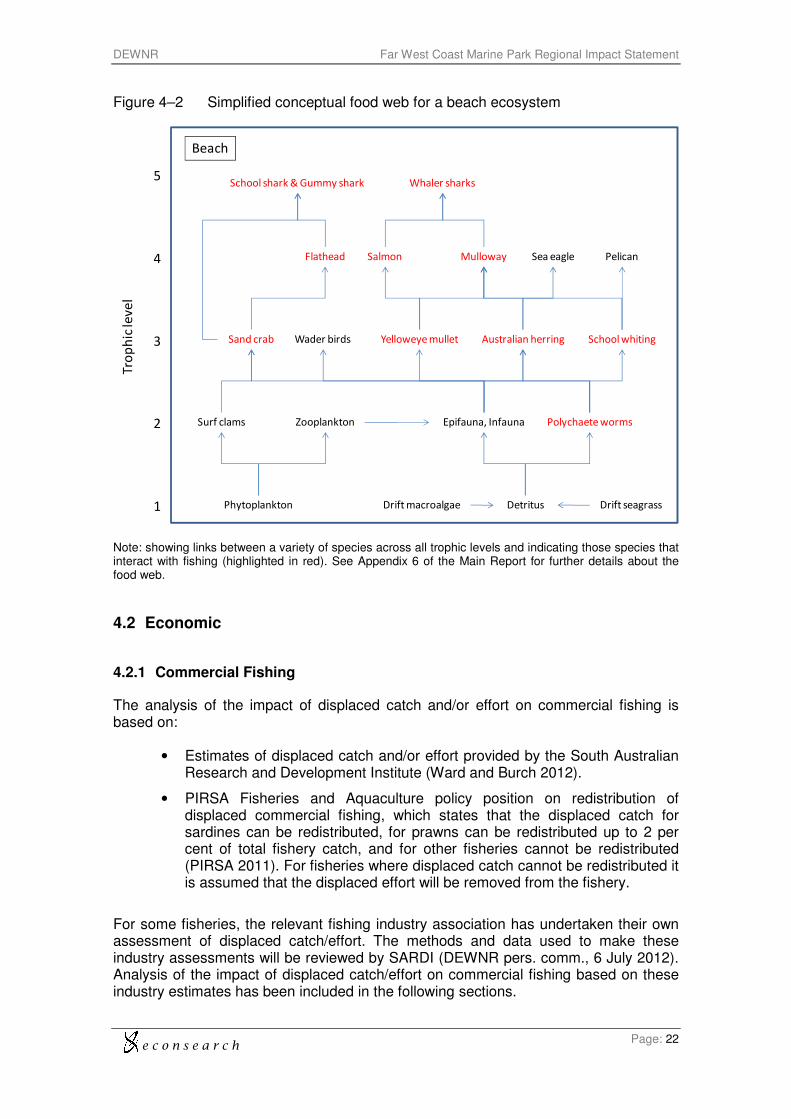
e c o n s e a r c h
DEWNR Far West Coast Marine Park Regional Impact Statement
Page: 22
Figure 4–2 Simplified conceptual food web for a beach ecosystem
Sand crab
Surf clams Epifauna, InfaunaZooplankton
DetritusPhytoplankton Drift seagrass
Wader birds
Flathead
Tro
ph
ic le
ve
l
1
5
4
3
2
Pelican
School shark & Gummy shark
Drift macroalgae
School whiting
Beach
Polychaete worms
Australian herring
Salmon
Yelloweye mullet
Mulloway
Whaler sharks
Sea eagle
Note: showing links between a variety of species across all trophic levels and indicating those species that interact with fishing (highlighted in red). See Appendix 6 of the Main Report for further details about the food web.
4.2 Economic
4.2.1 Commercial Fishing
The analysis of the impact of displaced catch and/or effort on commercial fishing is based on:
• Estimates of displaced catch and/or effort provided by the South Australian Research and Development Institute (Ward and Burch 2012).
• PIRSA Fisheries and Aquaculture policy position on redistribution of displaced commercial fishing, which states that the displaced catch for sardines can be redistributed, for prawns can be redistributed up to 2 per cent of total fishery catch, and for other fisheries cannot be redistributed (PIRSA 2011). For fisheries where displaced catch cannot be redistributed it is assumed that the displaced effort will be removed from the fishery.
For some fisheries, the relevant fishing industry association has undertaken their own assessment of displaced catch/effort. The methods and data used to make these industry assessments will be reviewed by SARDI (DEWNR pers. comm., 6 July 2012). Analysis of the impact of displaced catch/effort on commercial fishing based on these industry estimates has been included in the following sections.
e c o n s e a r c h
DEWNR Far West Coast Marine Park Regional Impact Statement
Page: 23
4.2.1.1 Summary
The estimated economic impacts on commercial fisheries, based on SARDI’s average annual displaced catches and corresponding average annual prices, are relatively small for the Far West Coast Marine Park (see Table 4-3 in section 4.2.1.4). The State Government has committed to buy out licences and quota entitlements of displaced effort and catch, although details of the buyout are yet to be finalised. Compensation payments have the potential to, at least partially, offset the negative impact of the displaced catch reported in Table 4-3. However, if compensation is limited to the buyout of displaced fishing entitlements, the negative impacts on the local economy are unlikely to be fully offset:
• There would be no requirement for the recipients of the buyout to spend or invest the funds in the region.
• Even if all the funds were invested in full in the region it is unlikely the investment would generate economic activity and wealth equivalent to that generated by the displaced fishing activity. This is because fishers have the opportunity to sell their licences at any time (they are fully transferable) but choose not to. If there were alternative investment opportunities locally that fishers had the skill and risk bearing capacity to undertake, then it is reasonable to assume that they would already be doing it.
For entitlement holders there are potentially direct financial losses suffered as a direct consequence of the cancellation of their entitlement. These could take the form of:
• a pecuniary loss such as removal and re-establishment costs or legal costs in acquiring a replacement licence/entitlements
• a capital loss of business operation - the loss of a partial entitlement or the location of sanctuary zones may negatively impact the efficiency of business operations, which might in turn impact on the market value of plant and equipment, as well as the market value of remaining fishing entitlements held by the licence holder.
4.2.1.2 Sardines
SARDI estimates of historical catch in draft sanctuary zones indicate that there would be nil catch displaced from this marine park.
4.2.1.3 Abalone
SARDI estimates of historical catch in draft sanctuary zones indicate that there would be nil catch displaced from this marine park.
4.2.1.4 Rock Lobster
SARDI estimates7 indicate that historically there has been an average annual catch of 1,973 kg of rock lobster in the draft sanctuary zones in this marine park. This
7 Based on 17 years (1993-2009) of logbook and pot sampling data, and assumes catch is evenly
distributed within State waters within each marine fishing area. See Ward and Burch (2012) for more details.
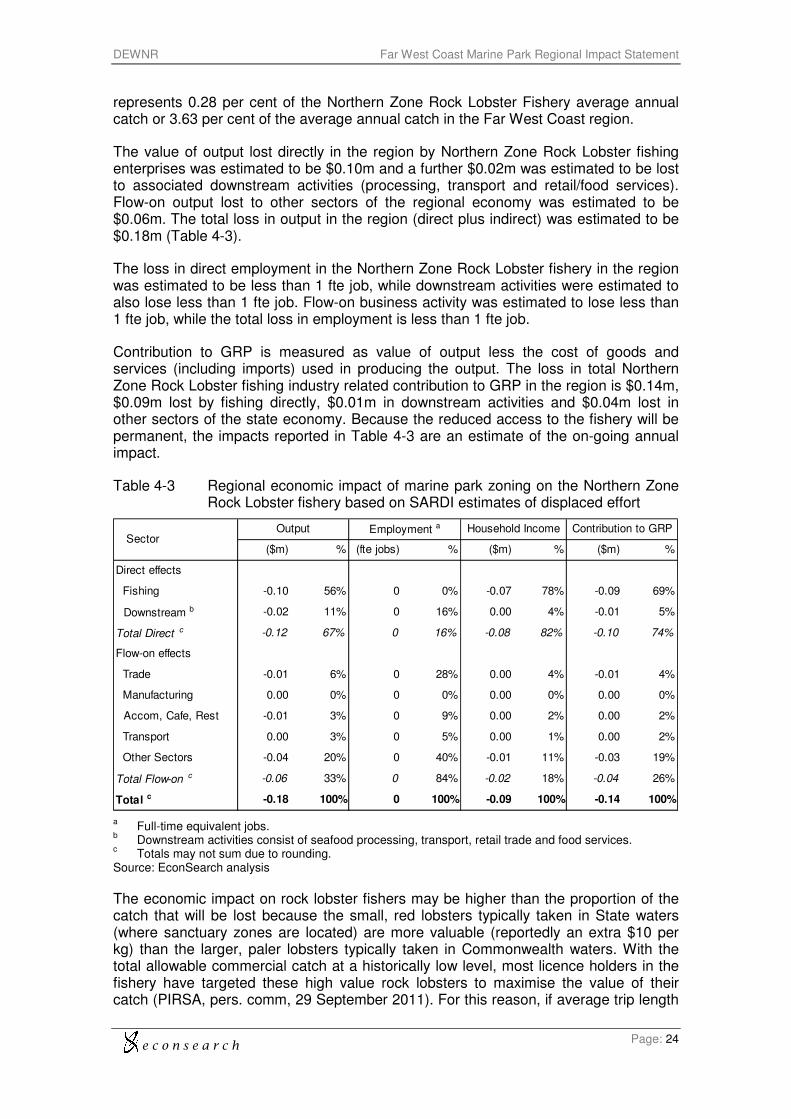
e c o n s e a r c h
DEWNR Far West Coast Marine Park Regional Impact Statement
Page: 24
represents 0.28 per cent of the Northern Zone Rock Lobster Fishery average annual catch or 3.63 per cent of the average annual catch in the Far West Coast region.
The value of output lost directly in the region by Northern Zone Rock Lobster fishing enterprises was estimated to be $0.10m and a further $0.02m was estimated to be lost to associated downstream activities (processing, transport and retail/food services). Flow-on output lost to other sectors of the regional economy was estimated to be $0.06m. The total loss in output in the region (direct plus indirect) was estimated to be $0.18m (Table 4-3).
The loss in direct employment in the Northern Zone Rock Lobster fishery in the region was estimated to be less than 1 fte job, while downstream activities were estimated to also lose less than 1 fte job. Flow-on business activity was estimated to lose less than 1 fte job, while the total loss in employment is less than 1 fte job.
Contribution to GRP is measured as value of output less the cost of goods and services (including imports) used in producing the output. The loss in total Northern Zone Rock Lobster fishing industry related contribution to GRP in the region is $0.14m, $0.09m lost by fishing directly, $0.01m in downstream activities and $0.04m lost in other sectors of the state economy. Because the reduced access to the fishery will be permanent, the impacts reported in Table 4-3 are an estimate of the on-going annual impact.
Table 4-3 Regional economic impact of marine park zoning on the Northern Zone Rock Lobster fishery based on SARDI estimates of displaced effort
($m) % (fte jobs) % ($m) % ($m) %
Direct effects
Fishing -0.10 56% 0 0% -0.07 78% -0.09 69%
Downstream b -0.02 11% 0 16% 0.00 4% -0.01 5%
Total Direct c -0.12 67% 0 16% -0.08 82% -0.10 74%
Flow-on effects
Trade -0.01 6% 0 28% 0.00 4% -0.01 4%
Manufacturing 0.00 0% 0 0% 0.00 0% 0.00 0%
Accom, Cafe, Rest -0.01 3% 0 9% 0.00 2% 0.00 2%
Transport 0.00 3% 0 5% 0.00 1% 0.00 2%
Other Sectors -0.04 20% 0 40% -0.01 11% -0.03 19%
Total Flow-on c -0.06 33% 0 84% -0.02 18% -0.04 26%
Total c -0.18 100% 0 100% -0.09 100% -0.14 100%
SectorOutput Employment a Household Income Contribution to GRP
a Full-time equivalent jobs.
b Downstream activities consist of seafood processing, transport, retail trade and food services.
c Totals may not sum due to rounding.
Source: EconSearch analysis
The economic impact on rock lobster fishers may be higher than the proportion of the catch that will be lost because the small, red lobsters typically taken in State waters (where sanctuary zones are located) are more valuable (reportedly an extra $10 per kg) than the larger, paler lobsters typically taken in Commonwealth waters. With the total allowable commercial catch at a historically low level, most licence holders in the fishery have targeted these high value rock lobsters to maximise the value of their catch (PIRSA, pers. comm, 29 September 2011). For this reason, if average trip length
e c o n s e a r c h
DEWNR Far West Coast Marine Park Regional Impact Statement
Page: 25
increases, costs will rise which is likely to lead to a reduction in profits, which will further diminish the value for licences, pots and quota.
Fishers usually fish “stop-over” areas (areas where pots are set on patchy reef en route to more distant fishing grounds) when fishers go on their usual 5-7 day trips. Sanctuary zones located over these fishing routes, even if not located in the most productive fishery areas, may disrupt this pattern leading to less efficient fishing patterns, which would mean greater cost per trip (PIRSA, pers. comm, 29 September 2011)..
Since there has already been substantial consolidation occurring in the fishery, with the Total Allowable Commercial Catch presently at 310 tonnes, the introduction of sanctuary zones is likely to add further strain to many of the remaining licence holders.
The estimates of reduced regional economic activity, while relatively small, are likely to persist into the future, i.e. over next 20 years, as the reduced access to the resource will be permanent given the current fully exploited status of the fishery.
Estimates of historical rock lobster catches in the sanctuary zones have a high level of uncertainty because of the limited spatially-resolved data available for the fishery (Ward and Burch 2012). For instance, it is assumed that catch of the fishery was evenly distributed in state waters within each marine fished area.
According to Ward and Burch (2012) this assumption introduces significant potential for bias in the estimates of historical catches for individual sanctuary zones because it may lead to:
• over-estimation of the historical catch from a sanctuary zone if the fishing hotspots (e.g. rock lobster, abalone or marine scalefish) in state waters of that marine fished area were outside the sanctuary zone; and
• under-estimation of the historical catch from that sanctuary zone if the fishing hotspots (e.g. rock lobster, abalone or marine scalefish) were in a sanctuary zone.
According to Knuckey (2012) the industry estimate of displaced catch is similar to the estimate prepared by SARDI. The sanctuary zone catch of rock lobster was estimated by Knuckey (2012) to be 1,950kg. Based on this estimate (which has not yet been reviewed by SARDI), the value of this catch is $99,000. Consequently, the economic impacts would be similar to those presented in Table 4-3.
A range of spatial management arrangements are being considered to spread fishing effort across the whole Zone, but especially into deeper waters and the Far West (PIRSA pers. comm. 29 September 2011). The revised zoning in this park may impact upon this initiative.
The potential cumulative impact of the proposed extension to and revised zoning of the Commonwealth Great Australian Marine Park and the proposed Western Eyre Commonwealth Marine Reserve may place further pressure on fishing business viability. The designation of sanctuary zones in State waters has the potential to transfer fishing activity into deeper, offshore Commonwealth waters. If this occurs, it would add to production costs because of increased travel.

e c o n s e a r c h
DEWNR Far West Coast Marine Park Regional Impact Statement
Page: 26
4.2.1.5 Marine Scalefish
SARDI estimates of historic effort in draft sanctuary zones for the Marine Scalefish Fishery are provided in Table 4-4 and historic catch for the main fishery species in Table 4-5. The total sanctuary zone catch of marine scalefish represents less than 0.01 per cent of the average annual catch in the Far West Coast region.
The value of the sanctuary zone catch is estimated to be approximately $1,000.
As with rock lobster, estimates of historical marine scalefish catches in sanctuary zones have a high level of uncertainty because of the limited spatially-resolved data available for the fishery (Ward and Burch 2012).
Table 4-4 Average annual Marine Scalefish effort in draft sanctuary zones by sector
Sector Sanctuary zone effort (person days) % effort of sector
Handline 1 0.01
Haulnet nil nil
Longline <1 0.01
Other 8 0.04
Notes: Handline, longline and other gear sectors based on 10 years of data, haulnet based on 3 years of data Source: Ward and Burch (2012)
Table 4-5 Average annual Marine Scalefish catch in draft sanctuary zones by main species
Species Sanctuary zone catch (kg) % species catch in fishery
Garfish <1 <0.01
King George whiting 1 <0.01
Snapper 50 <0.01
Southern calamary 2 <0.01
Notes: based on 3 years of data Source: Ward and Burch 2012
4.2.1.6 Charter Boat
SARDI estimates indicate that historically there has been an average annual charter boat effort of 1 person days in the draft sanctuary zones in this marine park. This represents less than 0.01 per cent of the average annual effort for the charter boat industry or 0.08 per cent of the average annual catch in the Far West Coast region. The value of this sanctuary zone effort is estimated to be less than $1000.
4.2.1.7 Sharks8
The Gillnet, Hook and Trap sector of the Commonwealth Southern and Eastern Scalefish and Shark Fishery operates in the Far West Marine Park. The fishery occurs predominantly in Commonwealth waters and therefore is managed by Australian Fisheries Management Authority under an Offshore Constitutional Settlement. Target species are school and gummy sharks. A preliminary estimate of an average catch of
8 Australian Fisheries Management Authority data shows no reported catch by the Southern Bluefin
Tuna fishery or Great Australian Bight trawl fishery in South Australian state waters for the period 2001-2010. No impact from the draft zoning is anticipated on these fisheries.

e c o n s e a r c h
DEWNR Far West Coast Marine Park Regional Impact Statement
Page: 27
268 kg per year will be displaced from the line fishing sector by sanctuary zones in this park. This sanctuary zone catch represents 1.70 per cent of the fishery’s catch in State waters, and 0.09 per cent of the catch off SA (State and Commonwealth waters).
4.2.2 Aquaculture
There are currently no aquaculture operations in this marine park and any future development will need to be consistent with policy commitments, marine park and aquaculture related legislation (PIRSA, pers. comm., 27 June 2012).
4.2.3 Tourism
The Head of Bight Visitor Centre attracts around 30,000 visitors a year (DENR, pers. Comm., 3 August 2011) who come mainly to watch whales. It is expected that the changes to zoning will not have an impact, either positive or negative, on visitation (DENR, pers. comm., 3 August 2011)
4.2.4 Port, Harbour and Shipping Operations
There are no ports or harbours in this marine park. No significant impacts on shipping activities arising from the zoning in this park are expected, which is consistent with Government policy commitments.
4.2.5 Mining
No mineral, petroleum or geothermal tenements are currently located within this park.
4.2.6 Coastal Development
There are no significant projects or infrastructure in or known to be planned for this park.
4.3 Social
4.3.1 Summary of method
The social impact assessment drew on multiple sources of information – a review of research relating to established marine parks elsewhere in Australia and overseas; an analysis of market research undertaken in relation to South Australian marine parks; an analysis of MPLAG minutes and of media reports relating to each park, a review of the social values statement prepared for the park, and analysis of the economic impacts identified.
Finally a Marine Parks Social Impact Assessment Tool (MPSIAT) was designed which sought feedback from MPLAG members on different types of social impact expected to flow from preliminary zoning options considered prior to the draft zones presented within the draft management plans.
e c o n s e a r c h
DEWNR Far West Coast Marine Park Regional Impact Statement
Page: 28
The findings from these different sources were analysed separately and in combination to determine overall expected social impacts.
Although this report presents impact analysis relating to the draft zones, the online social impact assessment findings are included because they represent part of the community consultation process and the draft zones reflect the SA government's response to the findings of that process.
Eight of 11 members9 (73 per cent) of the Far West Coast MPLAG responded to the MPSIAT for the Far West Coast Marine Park.
4.3.2 Expected social impacts – at a glance
The overall social impacts of the Far West Coast Marine Park on communities living in the Far West Coast region of South Australia are expected to be low given the magnitude of the economic impacts that have been projected (no job losses anticipated). The impact on recreational fishing is also considered to be low, with some potential impact at the granites composite. Consequently, any impact on local community identity as a fishing centre and on fishing as a way of life is likely to be low.
Certainly at this stage of the South Australian marine parks’ development, monitoring of media reports, feedback from MPLAGs and analysis of their meeting discussions, illustrates the trend to expect the changes associated with their development to be problematic. One very important factor that affects community attitudes is how informed they are, and feedback from market research and MPLAGs, as well as analysis of media reports indicates a gap in this information. In particular, increasing communities’ understanding of the scientific rationale underpinning marine protected areas, and the benefits that these can bring, needs to be enhanced.
Experience elsewhere in Australia and internationally (Ledee et al 2011, Cocklin et al 1998), suggests that a range of benefits from the establishment of marine parks become evident over time. These include increased opportunities for education about marine life and conservation, and increased tourism and ecotourism opportunities. This experience indicates that these benefits usually take approximately five years to be evident, and that in the earliest stages of marine protected areas being developed, communities are more likely to identify possible negative impacts than potential benefits. It takes time to observe how the park’s ecological and economic impacts evolve, with social impacts (positive or negative) flowing from these.
Marine parks have broad support in the South Australian community. Market research commissioned by the state government between 2006 and 2012 (McGregor Tan Research 2006, 2007, 2008 and 2009; Square Holes 2009, 2011 and 2012) found strong support for the concept of marine parks among South Australians with approximately 85 per cent in favour of them in 2012 (87 per cent support in metropolitan Adelaide and 82 per cent support in regional areas). People interviewed for this research were able to identify seven main benefits arising from marine parks:
1. preservation of the environment for future generations
2. protection and conservation of marine habitats and wildlife
3. increases in fish stocks
9 Any MPLAG members who indicated they did not wish to participate in the social impact assessment a
priori were not approached.
e c o n s e a r c h
DEWNR Far West Coast Marine Park Regional Impact Statement
Page: 29
4. greater opportunities for scientific research and education
5. greater opportunities for nature based tourism and recreation
6. protection of cultural and heritage sites
7. greater certainty for marine industries and users.
The research found in 2011 and again in 2012 that 88 per cent believe that protection of the marine environment through managed marine parks is the responsibility of current generations for the benefit of future generations.
The market research found that loss of commercial benefits is a particular concern, particularly for those living in regional areas (33 per cent in 2012) compared with those in metropolitan Adelaide (22 per cent in 2012). Those least likely to support marine parks have been fishing groups (in 2009 55 per cent of respondents who did not support marine parks identified restricted fishing as the reason, this dropped to 39 per cent in 2012).
Between 2011 and 2012 the market research findings identify a decline in those who believe they will have limited access to marine parks and an increase in those who associate swimming, boating and snorkelling with marine parks.
4.3.3 Education and Wellbeing
Most MPSIAT respondents expected the marine park to provide increased opportunities for education about marine life and for understanding marine conservation issues. International researchers confirm that this is a key outcome and benefit of marine protected areas (Angulo-Valdes and Hatcher 2010). The establishment of marine parks is likely to attract domestic and international interest from researchers and be the focus of conservation focused education initiatives.
The MPLAG zoning was not expected by most MPSIAT respondents to have any impact, positive or negative, on them or their families, or community quality of life, or to change overall current way of life. However, on these and other issues explored in feedback, a minority of MPSIAT respondents held more positive expectations.
The draft zoning proposal is the result of considerable discussion about how potential negative impacts on users of marine resources in the marine park can be minimised. For this reason it is expected that personal quality of life in general and quality of community life is unlikely to be negatively impacted by the draft zoning proposal.
4.3.4 Culture and Heritage
DEWNR undertook a process of consultation with Aboriginal stakeholders about the establishment of the marine parks. No significant negative impacts on Aboriginal communities were identified. However, it is important that further consultation be undertaken in relation to the likely impact of the draft zoning.
Aboriginal people have interacted with the marine environment for thousands of years and their relationships with the sea remain strong through customs, laws and traditions. Traditional usage, Aboriginal cultural heritage, Indigenous Protected Areas, Indigenous Land Use Agreements and Native Title considerations are being taken into account in developing the management plan for the Far West Coast Marine Park.
e c o n s e a r c h
DEWNR Far West Coast Marine Park Regional Impact Statement
Page: 30
The Mirning, Wirangu and Yalata Anangu Aboriginal people have traditional associations with areas of the marine park including estuarine and coastal environments which provide food and resources for local Aboriginal people and still hold strong cultural significance today. A group of overlapping Native Title claimants have combined to form one claim known as the Far West Coast Native Title claim. This claim currently contains parts of the Far West Coast Marine Park.
The Yalata Indigenous Protected Area lies at the edge of the Far West Coast Marine Park and protects large areas of uncleared native vegetation, including one of the largest stands of mallee in the country. Leased and managed by the Yalata Community and owned by the South Australian Aboriginal Lands Trust, the Yalata IPA helps protect and manage important breeding areas for many marine and coastal species.
MPSIAT respondents believed it was likely that the Far West Coast Marine Park would respect the interests of Aboriginal communities (see Appendix Table 4-3). There was a diversity of opinion about the park’s impact on preserving Aboriginal and local Australian culture and heritage. Open ended feedback noted that while access for Native Title claimants to traditional fishing activities and sites was to be maintained, details about this should be enshrined in the regulations and that differences in meanings regarding commercial and traditional access for Aboriginal people needed to be clearly articulated.
4.3.5 Recreation and Fishing
4.3.5.1 Recreation
A minority of MPSIAT respondents expected that the proposed zoning would encourage more recreational activity, a greater range of recreational activities and improved recreational facilities (see Appendix Table 4-4).
4.3.5.2 Recreational Fishing
The following assessment is based mainly on the SAMPIT mapping10, with material from separate interviews with the South Australian Recreational Fishing Advisory Council (SARFAC) and the DEWNR project coordinators who facilitated the MPLAG process, where appropriate.
Recreational fishers come to the Far West Coast Marine Park to fish for mulloway, bronze whalers and salmon. Due to its remoteness it attracts serious fishers who use off-road vehicles and camp on the beach for up to a week at a time (SARFAC, pers. comm., 26 September 2011). Main areas fished are off Yalata Indigenous Protected Area and Wahgunyah Conservation Park and are accessible through 4WD tracks (two in the Yalata Indigenous Protected Area and one in Wahgunyah Conservation Park). The placement of SZ-2 is likely to displace some fishing from the Granites campsite but SZ-3 is unlikely to displace recreational fishing as there are no public tracks to the area. However, there are concerns that some fishers unfamiliar with the area may think
10
The South Australian Marine Parks Information Tool (SAMPIT) is a computer tool designed to gather information from community members about their favourite fishing spots and areas they believe need protection. Data is collected and reported by ‘grid cell’. SAMPIT data for 1,739 people is available including 1311 recreational fishers. Quality control by the Department of Environment and Natural Resources included cross-verification of legitimate naming and activities from the data provided (DENR 2010b).
e c o n s e a r c h
DEWNR Far West Coast Marine Park Regional Impact Statement
Page: 31
that most of Wahgunyah Conservation Park is closed to fishing and may decide to visit the Yalata Indigenous Protected Area instead. There are concerns that SZ-2 may discourage beach fishing and impact on revenues to Yalata Land Management from beach access fees.
4.3.5.3 Commercial Fishing
The estimated economic impacts on commercial fisheries are relatively small for the Far West Coast Marine Park. There will be a small quantity of rock lobster and shark displaced from the sanctuary zones, and no job losses are anticipated as a result of implementing the draft management plan. The State Government has committed to buy out licences and quota entitlements to offset any unsustainable displaced effort and catch. Although details of the buyout are yet to be finalised, any such payments have the potential to at least offset the negative impacts outlined above. Given the magnitude of the economic impacts that have been projected the overall social impacts of the Far West Coast Marine Park on communities living in the Far West Coast region of South Australia are expected to be low.
The designation of sanctuary zones in State waters has the potential to transfer rock lobster fishing activity into deeper, offshore Commonwealth waters. If this occurs, it could increase safety risks with a probable increase in the length of fishing trips (PIRSA, pers. comm, 29 September 2011).
Given the preference for fishing in State waters, reducing the area of State waters that can be fished is likely to result in an increase in conflict amongst commercial rock lobster fishers in these waters (PIRSA, pers. comm, 29 September 2011).. It could be expected that this type of conflict would be resolved over time and not persist into the medium to long-term.
Australian researchers have identified the potential psychological impacts on fishing families arising from uncertainty about fishing business viability, reduced family income, reduced self-esteem arising from the loss of fishing occupation and the difficulty of finding alternative employment in the region (Schirmer et al. 2004: 7-8). Much depends on individual fishers’ capacity to adapt which in turn has been found to depend on their financial situation, ability to work elsewhere, business skills and willingness to accept rather than resist change (Marshall and Marshall 2007). This diversity means that fishers, commercial, will vary significantly in the way marine parks affect them, and will have differing views on that impact, as is reflected in Appendix Table 4-4.
Furthermore, there is minimal research on the social impacts of marine parks on commercial fishers and their families in particular, and on communities as a whole (Voyer 2011, 2012, Beeton et al 2012, Fairweather et al 2009). The Great Barrier Reef Marine Park Authority is cited as one exception to this trend (Voyer et al 2012, Beeton et al 2012) while social impact research has also been undertaken in relation to Ningaloo Marine Park in Western Australia (Northcote & Macbeth 2008).
By contrast, economic impacts of marine parks have been significantly more researched. Australian researchers have found that most commercial fishers have adapted their fishing activity and fishing business at least moderately well in the five years following implementation of the 2004 Great Barrier Reef Marine Park rezoning, leading them to conclude that many of the impacts experienced by fishers might be short-term and decline over time as fishers adapt to the change (Ledee et al. 2011: 8). Similarly, research undertaken in New Zealand’s Leigh Marine Reserve has found that almost two decades after it was established in 1975, commercial and recreational
e c o n s e a r c h
DEWNR Far West Coast Marine Park Regional Impact Statement
Page: 32
fishers reported that fishing outside the boundaries had improved over time (Cocklin et al. 1998).
4.3.6 Local Government, Population and Housing
4.3.6.1 Local Government
Through the SA Regional Organisations of Councils, facilitated by the Local Government Association SA, all local government councils which border marine parks in SA were invited to participate in a survey about potential impact of marine park zoning on council operations, council infrastructure and council revenues.
No local council responded. However, based on the response from other local councils and on the expected social and economic impacts, no impacts on local government operations, infrastructure and revenue or compliance related activities are expected as a result of the proposed draft zoning.
4.3.6.2 Population and housing
The proposed zoning is unlikely to have any significant negative impacts on population and housing given the low level of economic impacts projected for the region (see section 4.2.1.1).
The proposed changes in zoning in the Far West Coast Marine Park are not expected to bring too many tourists, and in the process to change the local quality of life (see Appendix Table 4-5 and section 4.2.3). Nor is a departure of locals from the area expected.
4.3.7 Community
The majority of MPSIAT respondents expected the local community to be sufficiently resilient to be able to manage the changes brought about by the revised zoning of this park. This confidence dropped when asked whether the community would embrace the change (see Appendix Table 4-6).
A minority of MPSIAT respondents expected that new business opportunities would arise out of the revised zoning, and likewise perceived that training would be needed to take advantage of these opportunities.
MPSIAT respondents were divided about whether the marine park would become a source of pride to the community, and about the park’s likelihood of encouraging an increased number of events and other activities that bring the community together.
While there is little research evidence about the impacts of marine protected areas on communities as a whole, there are several studies in Australia and overseas that have identified a range of positive impacts, including enhanced tourism opportunities with flow on benefits to other sectors in the local economy (Ward et al. 2001, Cocklin et al. 1998). However, these and other benefits are not apparent in the early implementation stages and where positive impacts are reported these tend to be evident after about five years, becoming increasingly evident over the longer term (Cocklin et al. 1998, reporting on New Zealand marine parks established from 1975 onwards).
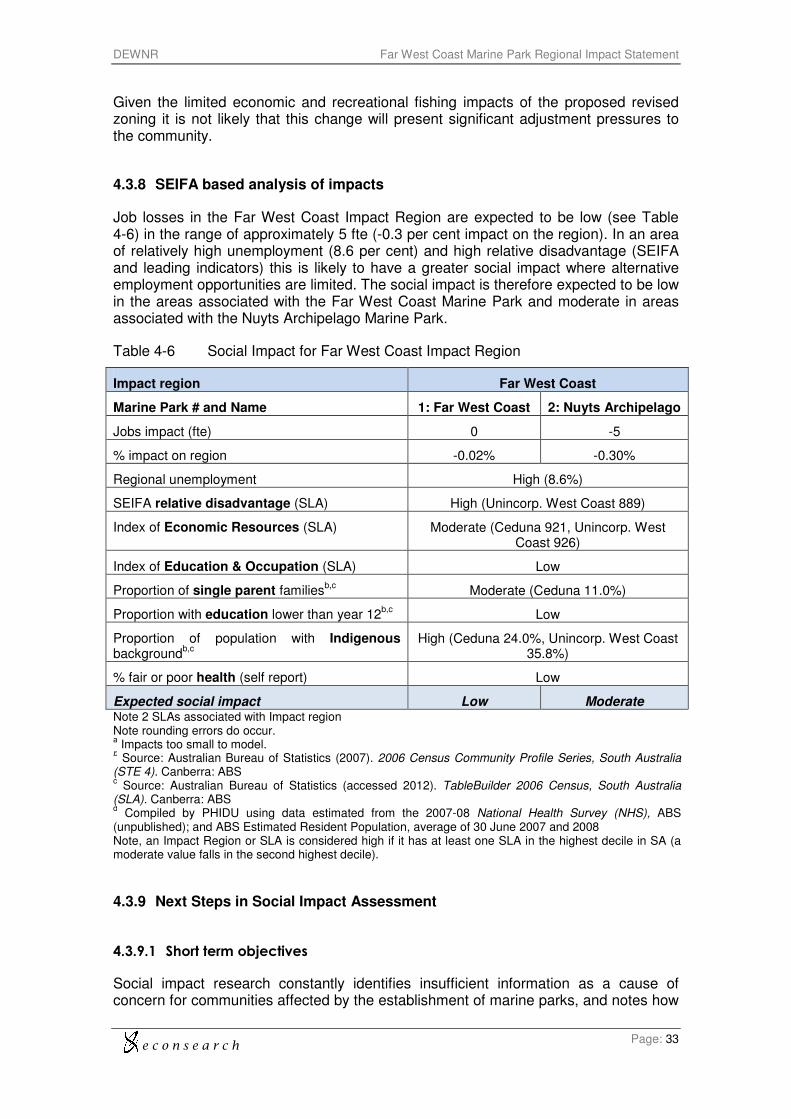
e c o n s e a r c h
DEWNR Far West Coast Marine Park Regional Impact Statement
Page: 33
Given the limited economic and recreational fishing impacts of the proposed revised zoning it is not likely that this change will present significant adjustment pressures to the community.
4.3.8 SEIFA based analysis of impacts
Job losses in the Far West Coast Impact Region are expected to be low (see Table 4-6) in the range of approximately 5 fte (-0.3 per cent impact on the region). In an area of relatively high unemployment (8.6 per cent) and high relative disadvantage (SEIFA and leading indicators) this is likely to have a greater social impact where alternative employment opportunities are limited. The social impact is therefore expected to be low in the areas associated with the Far West Coast Marine Park and moderate in areas associated with the Nuyts Archipelago Marine Park.
Table 4-6 Social Impact for Far West Coast Impact Region
Impact region Far West Coast
Marine Park # and Name 1: Far West Coast 2: Nuyts Archipelago
Jobs impact (fte) 0 -5
% impact on region -0.02% -0.30%
Regional unemployment High (8.6%)
SEIFA relative disadvantage (SLA) High (Unincorp. West Coast 889)
Index of Economic Resources (SLA) Moderate (Ceduna 921, Unincorp. West Coast 926)
Index of Education & Occupation (SLA) Low
Proportion of single parent familiesb,c
Moderate (Ceduna 11.0%)
Proportion with education lower than year 12b,c
Low
Proportion of population with Indigenous background
b,c
High (Ceduna 24.0%, Unincorp. West Coast 35.8%)
% fair or poor health (self report) Low
Expected social impact Low Moderate Note 2 SLAs associated with Impact region Note rounding errors do occur. a Impacts too small to model.
b Source: Australian Bureau of Statistics (2007). 2006 Census Community Profile Series, South Australia
(STE 4). Canberra: ABS c Source: Australian Bureau of Statistics (accessed 2012). TableBuilder 2006 Census, South Australia
(SLA). Canberra: ABS d Compiled by PHIDU using data estimated from the 2007-08 National Health Survey (NHS), ABS
(unpublished); and ABS Estimated Resident Population, average of 30 June 2007 and 2008 Note, an Impact Region or SLA is considered high if it has at least one SLA in the highest decile in SA (a moderate value falls in the second highest decile).
4.3.9 Next Steps in Social Impact Assessment
4.3.9.1 Short term objectives
Social impact research constantly identifies insufficient information as a cause of concern for communities affected by the establishment of marine parks, and notes how
e c o n s e a r c h
DEWNR Far West Coast Marine Park Regional Impact Statement
Page: 34
important such information can be for effective participation in the process of designing and implementing these parks. This includes better communication of the underpinning science of marine protected areas and how it has influenced their design and the setting of zones (Fairweather et al. 2009). The more recent review of marine parks in NSW (Beeton et al 2012) also found that insufficient community informing, and an associated lack of resourcing for this purpose, has resulted in marine parks-related decision making and the benefits of marine parks being insufficiently understood the general public. There is also research evidence of the importance of informed participation in marine park decision making and management, and in the enforcement of compliance (McPhee 2011, Cocklin et al. 1998).
In this context it is important to note that a range of information provision and consultation strategies were implemented by DEWNR to inform the marine parks decision making process. The SAMPIT and MPLAG processes provided an important opportunity for key stakeholders to contribute to the design of the marine park. This impact assessment report is the foundation for a further community consultation process. Further details about the information provision and consultation processes undertaken by DEWNR are detailed in section 1.1.
A clear message from the market research, media reporting and feedback from MPLAGs is that the scientific arguments in favour of establishing marine parks, including the Far West Coast Marine Park, need to be better understood by the wider community. This is one of the functions of this impact statement which is designed to inform judgements on the impact of the draft zoning proposal. MPSIAT feedback indicates that those members who do not understand the scientific arguments, also tend to disagree that the park’s boundaries and proposed zoning are based on sound science.
4.3.9.2 Ongoing impact assessment
Social impact assessment that is repeated over time, provides a mechanism for informing as well as engaging communities, involving them in decision making, and identifying and assisting with managing intended and unintended social consequences (Vanclay 2005). However coastal zone management is often criticised for a failure to facilitate effective community engagement in what has been termed a 'democratic deficit' (Vanclay 2012).
Perceptions of social impacts of change reflect knowledge, experience, values and roles. They provide a guide to possible but not certain impacts. To provide greater certainty about likely impacts we need to subject marine park zones to economic and environmental impact identification processes like those adopted in this impact assessment statement, repeating them over time to measure changes. The results of this process are necessary to inform judgments about the magnitude of social impacts.
The opportunity now exists for key stakeholders to provide perspectives on social impacts in the light of new knowledge about industry, employment, species and habitat impacts provided in this impact statement.
e c o n s e a r c h
DEWNR Far West Coast Marine Park Regional Impact Statement
Page: 35
References
Angulo-Valdes, J. and Hatcher, B. 2010, “A new typology of benefits from marine protected areas”, Marine Policy, 34: 635-644.
Baker, J.L. 2004, Towards a System of Ecologically Representative Marine Protected Areas in South Australian Marine Bioregions - Technical Report, prepared for Coast and Marine Conservation Branch, Department for Environment and Heritage, South Australia.
Beeton RJS, Buxton CD, Cutbush GC, Fairweather PG, Johnston EL & Ryan R (2012) Report of the Independent Scientific Audit of Marine Parks in New South Wales, Department of Primary Industries and Office of Environment and Heritage, NSW – http://www.marineparksaudit.nsw.gov.au/audit-report/
Bennett, B.A., and Attwood, C.G. 1991, Evidence for recovery of a surf-zone fish assemblage following the establishment of a marine reserve on the southern coast of South Africa. Marine Ecology Progress Series 75: 173–181.
Bryars, S. 2003, An Inventory of Important Coastal Fisheries Habitats in South Australia, Fish Habitat Program, Primary Industries and Resources South Australia, Adelaide.
Bryars, S. 2010, Monitoring marine fishes of conservation concern on Adelaide’s coastal reefs: results of 2009/2010 surveys for the southern blue devil and harlequin fish, report to the Adelaide and Mount Lofty Ranges Natural Resources Management Board, Department of Environment and Natural Resources, 29 pp.
Cocklin, C., Craw, M. and Mcauley, I. 1998, “Marine reserves in New Zealand: use rights, public attitudes, and social impacts”, Coastal Management, 26 (3) 213-231.
Currie, D. and Ward, T. 2011, Estimating historical catches from the proposed sanctuary zone scenarios in South Australia’s marine parks, report to PIRSA Fisheries and Aquaculture, South Australian Research and Development Institute (Aquatic Sciences), Adelaide, SARDI Publication No. F2011/000307-1.
Department of Environment and Natural Resources (DENR) 2010a, Environmental, Economic and Social Values of the Far West Coast Marine Park, Department of Environment and Natural Resources, South Australia.
Department of Environment and Natural Resources (DENR) 2010b, Far West Coast Marine Park - Fishing data from SAMPIT Submissions 10 May 2010, Coast and Marine Conservation – Department of Environment and Natural Resources.
Department of Primary Industries and Resources South Australia (PIRSA) 2011, Policy Position Regarding Redistribution of Displaced Commercial Fishing – Marine Parks, Department of Primary Industries and Resources of South Australia.
EconSearch 2010, Economic Indicators for the Commercial Fisheries of South Australia, Summary report, 2008/09, report prepared for Primary Industries and Resources South Australia, August.
Edyvane, K. 1999, Conserving Marine Biodiversity in South Australia – Part 1 – Background, Status and Review of Approach to Marine Biodiversity Conservation in South Australia, SARDI Report Number 38, PIRSA.
Fairweather, P., Buxton, C. and Robinson, J. 2009, Marine Park science in NSW: an independent review, a report prepared for the Marine Parks Advisory Council, NSW.
e c o n s e a r c h
DEWNR Far West Coast Marine Park Regional Impact Statement
Page: 36
Ferguson, G.J., Ward, T.M. and Gillanders, B.M. 2011, Otolith shape and elemental composition: Complimentary tools for stock discrimination of mulloway (Argyrosomus japonicus) in Southern Australia, Fisheries Research (in press).
Fowler, A.J., Lloyd, M. and Schmarr, D. 2009, A preliminary consideration of by-catch in the Marine Scalefish fishery of South Australia, F2009/000097-1, SARDI Research Report Series No. 365, South Australian Research and Development Institute (Aquatic Sciences), Adelaide.
Government of South Australia 2011, Government Submission to the Marine Parks Select Committee, July 2011.
Jones, K. 2009, South Australian Recreational Fishing Survey, PIRSA Fisheries, Adelaide, 84 pp, South Australian Fisheries Management Series Paper No 54.
Kailola, P.J., Williams, M.J., Stewart, P.C., Reichelt, R.E., McNee, A. and Grieve, C. 1993, Australian Fisheries Resources, Bureau of Resource Sciences and the Fisheries Research and Development Corporation, Canberra, Australia.
Knuckey, I. 2012, Impacts of Proposed Marine Park Sanctuary Zones on the South Australian Rock Lobster Industry, report to SARLAC Inc.
Langlois, T.J. and Ballantine, W.J. 2005, “Marine ecological research in New Zealand: Developing predictive models through the study of no-take marine reserves”, Conservation Biology 19:1763–1770.
Ledee, J., Sutton, S., Tobin, R. and De Freitas, D. 2011, “Responses and adaptation strategies of commercial and charter fishers to zoning changes in the Great Barrier Reef Marine Park”, Marine Policy, doi: 10.1016/j.marpol.2011.05.009
Marshall, N. and Marshall, P. 2007, “Conceptualizing and operationalizing social resilience within commercial fisheries in Northern Australia”, Ecology and Society, 12 (1) www.ecologyandsociety.org/vol12/iss1/art/
McGregor Tan Research 2006, Marine Parks Regional Study Report, report prepared for the Department for Environment and Heritage.
McGregor Tan Research 2007, Marine Parks Research – June 2007 McGregor Tan Household Omnibus Survey, report prepared for the Department for Environment and Heritage.
McGregor Tan Research 2008, Marine Parks Statewide Study Final Report, report prepared for the Department for Environment and Heritage.
McGregor Tan Research 2009, Marine Parks Regional Study Report, report prepared for the Department for Environment and Heritage.
McLeod, K.L. and Leslie, H.M. 2009, Ecosystem-Based Management for the Oceans, Island Press, Washington, DC.
McPhee, D. 2011, “Marine Park planning and recreational fishing: is the science lost at sea? Case studies from Australia”, Int. Jl of Science in Society, 2 (2) 23-37.
Northcote J & Macbeth J (2008) Socio-economic impacts of sanctuary zone changes in Ningaloo Marine Park, CRC for Sustainable Tourism Pty Ltd - http://researchrepository.murdoch.edu.au/4762/1/socio-economic_impacts.pdf
PISCO 2007, The Science of Marine Reserves (2nd Edition, International Version), Partnership for Interdisciplinary Studies of Coastal Oceans.
Saunders, R.J., Bryars, S.R. and Fowler, A.J. 2010, Preliminary consideration of the biology of several of South Australia’s marine fish species that have conservation or management interest, report to the Department for Environment and Heritage,
e c o n s e a r c h
DEWNR Far West Coast Marine Park Regional Impact Statement
Page: 37
South Australian Research and Development Institute (Aquatic Sciences), Adelaide, 41 pp. SARDI Publication Number F2009/000693-1. SARDI Research Report Series No. 426.
Schirmer, J., Casey, A. M. and Mazur, N. 2004, Socio-economic impact assessment of the proposed Cod Grounds Marine Protected Area, report prepared for Department of Environment and Heritage, Canberra.
Square Holes 2009, Marine Parks, report prepared for the Department for Environment and Heritage.
Square Holes 2011, Reserve Today Preserve Forever – Marine Parks Tracking Report, report prepared for the Department of Environment and Heritage.
Stevens, R., Smith, A. and Morgan, G. 2011, Expert Advisory Panel Final Report on Displaced Commercial Fishing Activities, report to PIRSA Fisheries and Aquaculture, 22 June 2011.
Vanclay F (2005) Engaging communities with social impact assessment: SIA as a social assurance process, Tasmanian Institute of Agricultural Research, University of Tasmania - http://www.engagingcommunities2005.org/abstracts/Vanclay-Frank-final.pdf
Vanclay F (2012) ‘The potential application of social impact assessment in integrated coastal zone management’, Ocean and Coastal Management, http://www.sciencedirect.com/science/article/pii/S0964569112001251?v=s5
van’t Hof, T. 1998, Social and economic impacts of marine protected areas: a study and analysis of selected cases in the Caribbean, Caribbean Natural Resources Institute (CANARI), Saba, Netherlands Antilles.
Voyer M (2011) Why social factors affect the success of marine parks School of Environment, University of Technology, Sydney - http://www.aqob.com.au/details.php?p_id=714&seo=Why_social_factors_affect_the_success_of_marine_parks&listid=528&menuid=category_id_24&submenuid=categorylist_id_528Ward, T., Heinemann, D. and Evans, N. 2001, The Role of Marine Reserves as Fisheries Management Tools: a review of concepts, evidence and international experience, Bureau of Rural Sciences, Canberra.
Ward T and Burch P 2012, Revised estimates of historical commercial fishery catches/effort in draft sanctuary zones and draft habitat protection zones in South Australia’s Marine Parks, report to PIRSA Fisheries and Aquaculture. South Australian Research and Development Institute (Aquatic Sciences), Adelaide. SARDI Publication No. F2011/000307-6. SARDI Research Report Series No. 642
Disclaimer
We have prepared the above report exclusively for the use and benefit of our client. Neither the firm nor any employee of the firm undertakes responsibility in any way whatsoever to any person (other than to the above mentioned client) in respect of the report including any errors or omissions therein however caused.
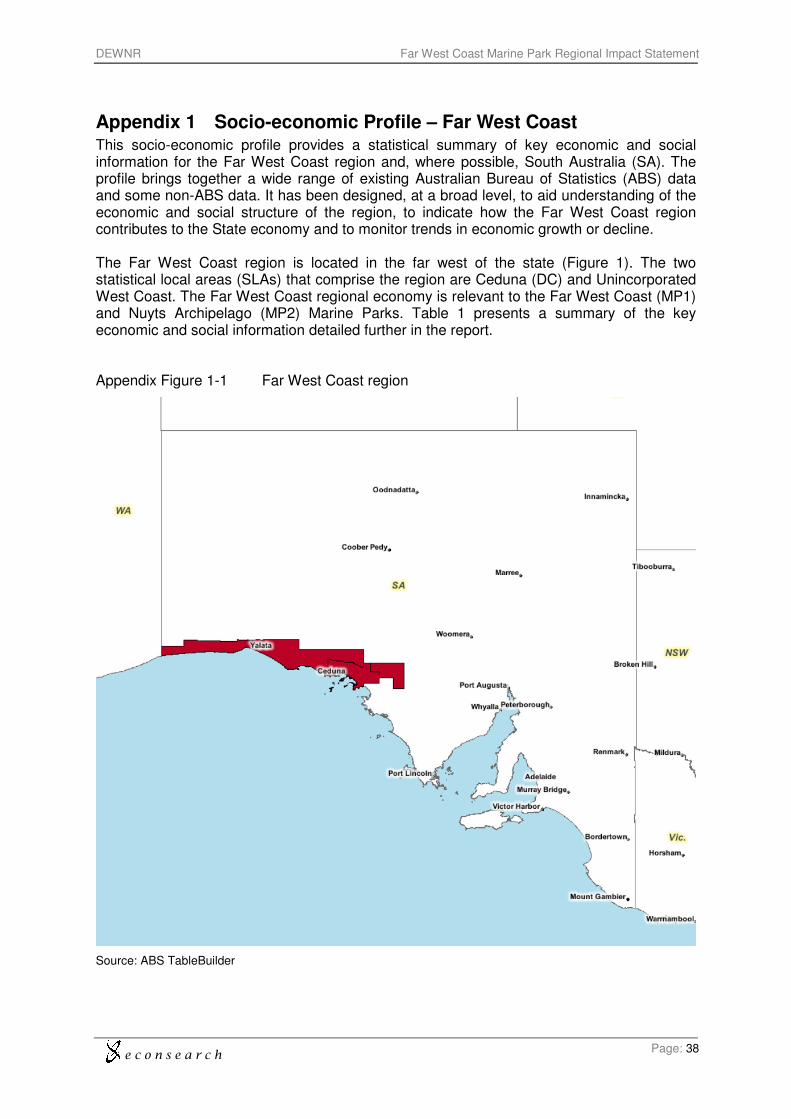
e c o n s e a r c h
DEWNR Far West Coast Marine Park Regional Impact Statement
Page: 38
Appendix 1 Socio-economic Profile – Far West Coast This socio-economic profile provides a statistical summary of key economic and social information for the Far West Coast region and, where possible, South Australia (SA). The profile brings together a wide range of existing Australian Bureau of Statistics (ABS) data and some non-ABS data. It has been designed, at a broad level, to aid understanding of the economic and social structure of the region, to indicate how the Far West Coast region contributes to the State economy and to monitor trends in economic growth or decline. The Far West Coast region is located in the far west of the state (Figure 1). The two statistical local areas (SLAs) that comprise the region are Ceduna (DC) and Unincorporated West Coast. The Far West Coast regional economy is relevant to the Far West Coast (MP1) and Nuyts Archipelago (MP2) Marine Parks. Table 1 presents a summary of the key economic and social information detailed further in the report. Appendix Figure 1-1 Far West Coast region
Source: ABS TableBuilder
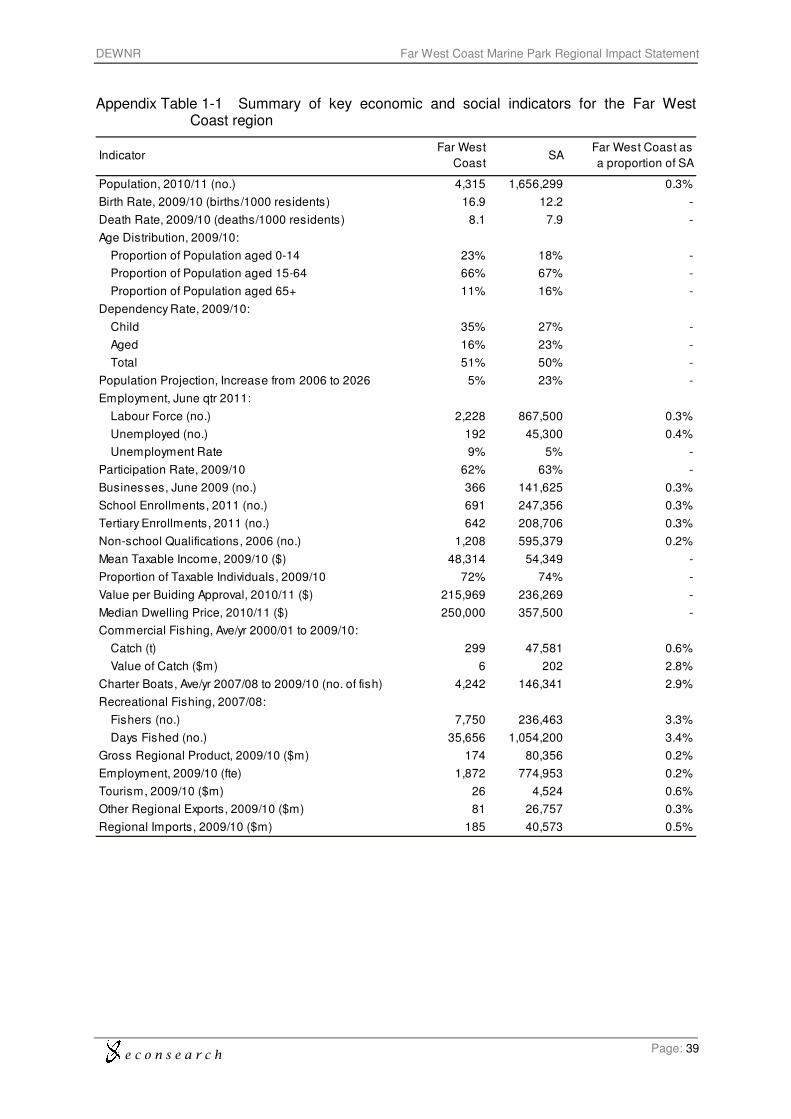
e c o n s e a r c h
DEWNR Far West Coast Marine Park Regional Impact Statement
Page: 39
Appendix Table 1-1 Summary of key economic and social indicators for the Far West Coast region
IndicatorFar West
CoastSA
Far West Coast as
a proportion of SA
Population, 2010/11 (no.) 4,315 1,656,299 0.3%
Birth Rate, 2009/10 (births/1000 residents) 16.9 12.2 -
Death Rate, 2009/10 (deaths/1000 residents) 8.1 7.9 -
Age Distribution, 2009/10:
Proportion of Population aged 0-14 23% 18% -
Proportion of Population aged 15-64 66% 67% -
Proportion of Population aged 65+ 11% 16% -
Dependency Rate, 2009/10:
Child 35% 27% -
Aged 16% 23% -
Total 51% 50% -
Population Projection, Increase from 2006 to 2026 5% 23% -
Employment, June qtr 2011:
Labour Force (no.) 2,228 867,500 0.3%
Unemployed (no.) 192 45,300 0.4%
Unemployment Rate 9% 5% -
Participation Rate, 2009/10 62% 63% -
Businesses, June 2009 (no.) 366 141,625 0.3%
School Enrollments, 2011 (no.) 691 247,356 0.3%
Tertiary Enrollments, 2011 (no.) 642 208,706 0.3%
Non-school Qualifications, 2006 (no.) 1,208 595,379 0.2%
Mean Taxable Income, 2009/10 ($) 48,314 54,349 -
Proportion of Taxable Individuals, 2009/10 72% 74% -
Value per Buiding Approval, 2010/11 ($) 215,969 236,269 -
Median Dwelling Price, 2010/11 ($) 250,000 357,500 -
Commercial Fishing, Ave/yr 2000/01 to 2009/10:
Catch (t) 299 47,581 0.6%
Value of Catch ($m) 6 202 2.8%
Charter Boats, Ave/yr 2007/08 to 2009/10 (no. of fish) 4,242 146,341 2.9%
Recreational Fishing, 2007/08:
Fishers (no.) 7,750 236,463 3.3%
Days Fished (no.) 35,656 1,054,200 3.4%
Gross Regional Product, 2009/10 ($m) 174 80,356 0.2%
Employment, 2009/10 (fte) 1,872 774,953 0.2%
Tourism, 2009/10 ($m) 26 4,524 0.6%
Other Regional Exports, 2009/10 ($m) 81 26,757 0.3%
Regional Imports, 2009/10 ($m) 185 40,573 0.5%
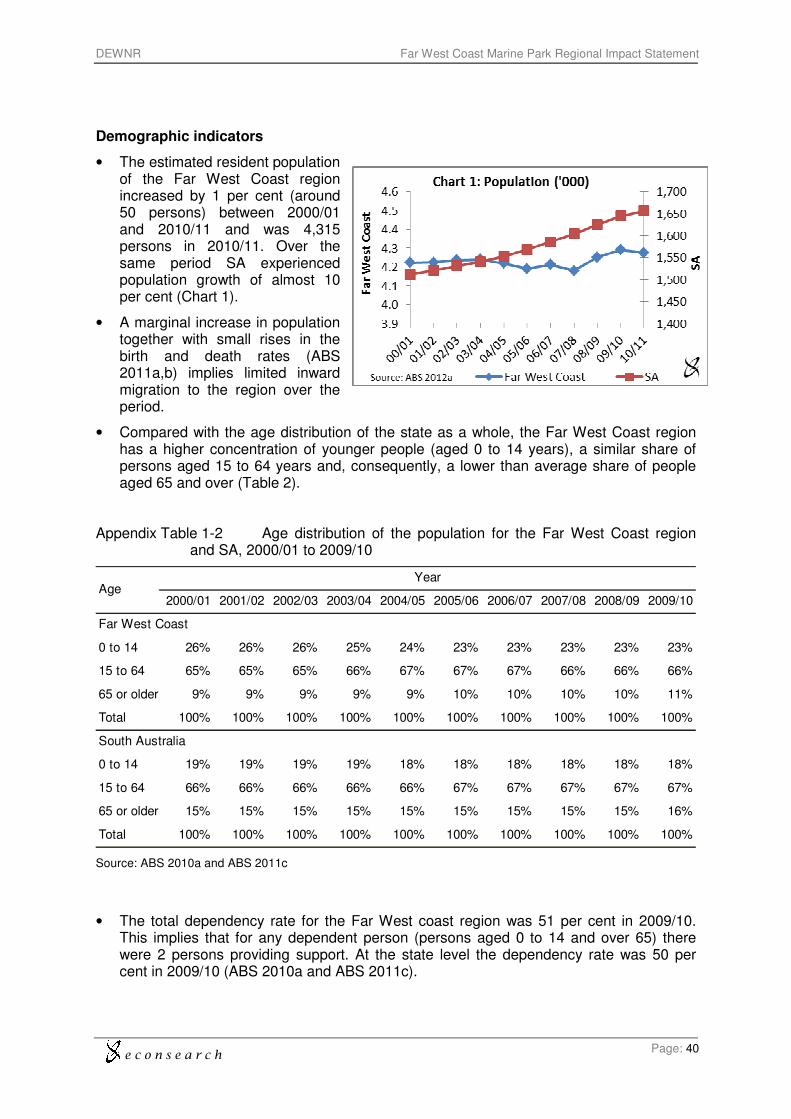
e c o n s e a r c h
DEWNR Far West Coast Marine Park Regional Impact Statement
Page: 40
Demographic indicators
• The estimated resident population of the Far West Coast region increased by 1 per cent (around 50 persons) between 2000/01 and 2010/11 and was 4,315 persons in 2010/11. Over the same period SA experienced population growth of almost 10 per cent (Chart 1).
• A marginal increase in population together with small rises in the birth and death rates (ABS 2011a,b) implies limited inward migration to the region over the period.
• Compared with the age distribution of the state as a whole, the Far West Coast region has a higher concentration of younger people (aged 0 to 14 years), a similar share of persons aged 15 to 64 years and, consequently, a lower than average share of people aged 65 and over (Table 2).
Appendix Table 1-2 Age distribution of the population for the Far West Coast region
and SA, 2000/01 to 2009/10
2000/01 2001/02 2002/03 2003/04 2004/05 2005/06 2006/07 2007/08 2008/09 2009/10
Far West Coast
0 to 14 26% 26% 26% 25% 24% 23% 23% 23% 23% 23%
15 to 64 65% 65% 65% 66% 67% 67% 67% 66% 66% 66%
65 or older 9% 9% 9% 9% 9% 10% 10% 10% 10% 11%
Total 100% 100% 100% 100% 100% 100% 100% 100% 100% 100%
South Australia
0 to 14 19% 19% 19% 19% 18% 18% 18% 18% 18% 18%
15 to 64 66% 66% 66% 66% 66% 67% 67% 67% 67% 67%
65 or older 15% 15% 15% 15% 15% 15% 15% 15% 15% 16%
Total 100% 100% 100% 100% 100% 100% 100% 100% 100% 100%
AgeYear
Source: ABS 2010a and ABS 2011c
• The total dependency rate for the Far West coast region was 51 per cent in 2009/10. This implies that for any dependent person (persons aged 0 to 14 and over 65) there were 2 persons providing support. At the state level the dependency rate was 50 per cent in 2009/10 (ABS 2010a and ABS 2011c).
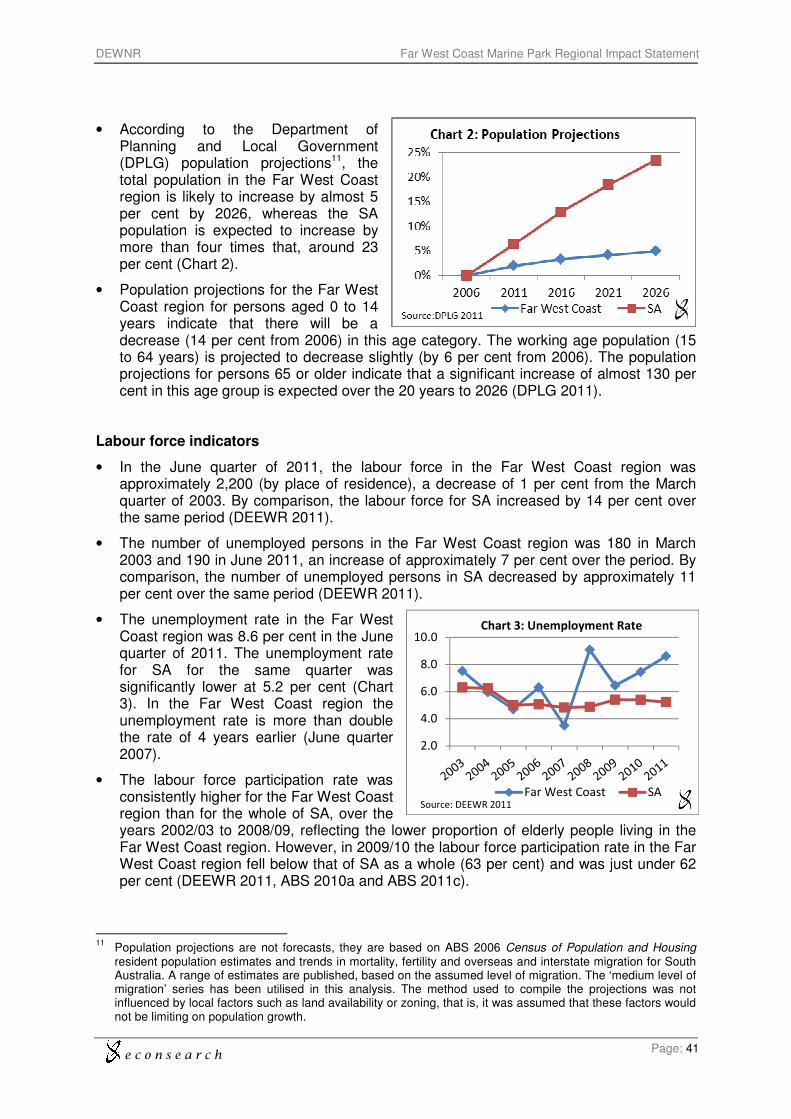
e c o n s e a r c h
DEWNR Far West Coast Marine Park Regional Impact Statement
Page: 41
2.0
4.0
6.0
8.0
10.0
Far West Coast SA
Chart 3: Unemployment Rate
Source: DEEWR 2011
• According to the Department of Planning and Local Government (DPLG) population projections11, the total population in the Far West Coast region is likely to increase by almost 5 per cent by 2026, whereas the SA population is expected to increase by more than four times that, around 23 per cent (Chart 2).
• Population projections for the Far West Coast region for persons aged 0 to 14 years indicate that there will be a decrease (14 per cent from 2006) in this age category. The working age population (15 to 64 years) is projected to decrease slightly (by 6 per cent from 2006). The population projections for persons 65 or older indicate that a significant increase of almost 130 per cent in this age group is expected over the 20 years to 2026 (DPLG 2011).
Labour force indicators
• In the June quarter of 2011, the labour force in the Far West Coast region was approximately 2,200 (by place of residence), a decrease of 1 per cent from the March quarter of 2003. By comparison, the labour force for SA increased by 14 per cent over the same period (DEEWR 2011).
• The number of unemployed persons in the Far West Coast region was 180 in March 2003 and 190 in June 2011, an increase of approximately 7 per cent over the period. By comparison, the number of unemployed persons in SA decreased by approximately 11 per cent over the same period (DEEWR 2011).
• The unemployment rate in the Far West Coast region was 8.6 per cent in the June quarter of 2011. The unemployment rate for SA for the same quarter was significantly lower at 5.2 per cent (Chart 3). In the Far West Coast region the unemployment rate is more than double the rate of 4 years earlier (June quarter 2007).
• The labour force participation rate was consistently higher for the Far West Coast region than for the whole of SA, over the years 2002/03 to 2008/09, reflecting the lower proportion of elderly people living in the Far West Coast region. However, in 2009/10 the labour force participation rate in the Far West Coast region fell below that of SA as a whole (63 per cent) and was just under 62 per cent (DEEWR 2011, ABS 2010a and ABS 2011c).
11
Population projections are not forecasts, they are based on ABS 2006 Census of Population and Housing resident population estimates and trends in mortality, fertility and overseas and interstate migration for South Australia. A range of estimates are published, based on the assumed level of migration. The ‘medium level of migration’ series has been utilised in this analysis. The method used to compile the projections was not influenced by local factors such as land availability or zoning, that is, it was assumed that these factors would not be limiting on population growth.
e c o n s e a r c h
DEWNR Far West Coast Marine Park Regional Impact Statement
Page: 42
Business Count
• The total number of businesses operating at the end of June 2009 in the Far West Coast region was 366, 0.3 per cent of the total businesses operating in SA (almost 142,000) (ABS 2011d).
• Of the 366 businesses operating in the Far West Coast region, approximately 50 per cent were classified in the agriculture, forestry and fishing sector and 11 per cent were in the construction sector (ABS 2011d).
• Over half of the businesses (56 per cent) operating in the Far West Coast region did not employ anyone and over one quarter (26 per cent) employed between 1 and 4 people (ABS 2011d).
Education and training
• The total number of residents in the Far West Coast region with a non-school qualification increased over the 5 years to 2006. In 2006, approximately 39 per cent of all persons aged 15 or over held some form of non-school qualification, compared with 30 per cent in 2001 (ABS 2007 and 2010a).
• The level of qualification was generally lower for the Far West Coast region than for SA, with the proportion of persons with a bachelor degree or higher being significantly lower (Table 3).
Appendix Table 1-3 Highest level of qualifications for persons aged 15 and over in the
Far West Coast region and SA, 2001 and 2006 a
Postgraduate Degree 3 0% 10 1%
Graduate Diploma & Graduate Certificate 28 3% 32 3%
Bachelor Degree 133 14% 140 12%
Advanced Diploma & Diploma 119 12% 137 11%
Certificate 398 41% 449 37%
Level of education not described or stated 284 29% 440 36%
Total 965 100% 1,208 100%
Postgraduate Degree 15,203 3% 22,897 4%
Graduate Diploma & Graduate Certificate 14,361 3% 16,098 3%
Bachelor Degree 95,812 20% 120,979 20%
Advanced Diploma & Diploma 63,469 13% 79,698 13%
Certificate 185,129 38% 212,581 36%
Level of education not described or stated 115,200 24% 143,126 24%
Total 489,174 100% 595,379 100%
Far West Coast
South Australia
20062001
Qualification2001 2006
e c o n s e a r c h
DEWNR Far West Coast Marine Park Regional Impact Statement
Page: 43
a 2011 Census data on qualifications not available until the second release in October 2012.
Source: 2006 Census of Population and Housing (ABS 2007).
• The total number of students enrolled in primary school in the Far West Coast region decreased by 18 per cent between 2001 and 2011. This decrease was comprised of an 2 per cent decrease in enrolments in government schools and a 63 per cent decline in enrolments at non-government schools (Table 4).
• The total number of Far West Coast region students enrolled in secondary school rose by 8 per cent between 2001 and 2011. The increase was comprised of a 17 per cent increase in government school enrolments and a 52 per cent decline in non-government school enrolments (Table 4).
• Between 2001 and 2011 the total number of Far West Coast regions residents enrolled in a higher education institute increased by 86 per cent. This is significantly greater increase than for SA as a whole (38 per cent increase) (ABS 2012b).
Appendix Table 1-4 School enrolments in the Far West Coast region and SA, 2001,
2006 and 2011
2001 2006 2011
Far West Coast
Pre-school 76 58 63
Primary
- Government 378 333 369
- Non-Government 128 101 47
Total Primary Student 506 434 416
Secondary Students
- Government 171 159 200
- Non-Government 25 29 12
Total Secondary Students 196 188 212
South Australia
Pre-school 18,246 18,533 20,537
Primary
- Government 103,975 93,220 87,542
- Non-Government 43,150 45,796 48,634
Total Primary Student 147,125 139,016 136,176
Secondary Students
- Government 57,770 51,752 51,901
- Non-Government 31,725 35,172 38,742
Total Secondary Students 89,495 86,924 90,643
Census Year
Source: 2011 Census of Population and Housing (ABS 2012b)
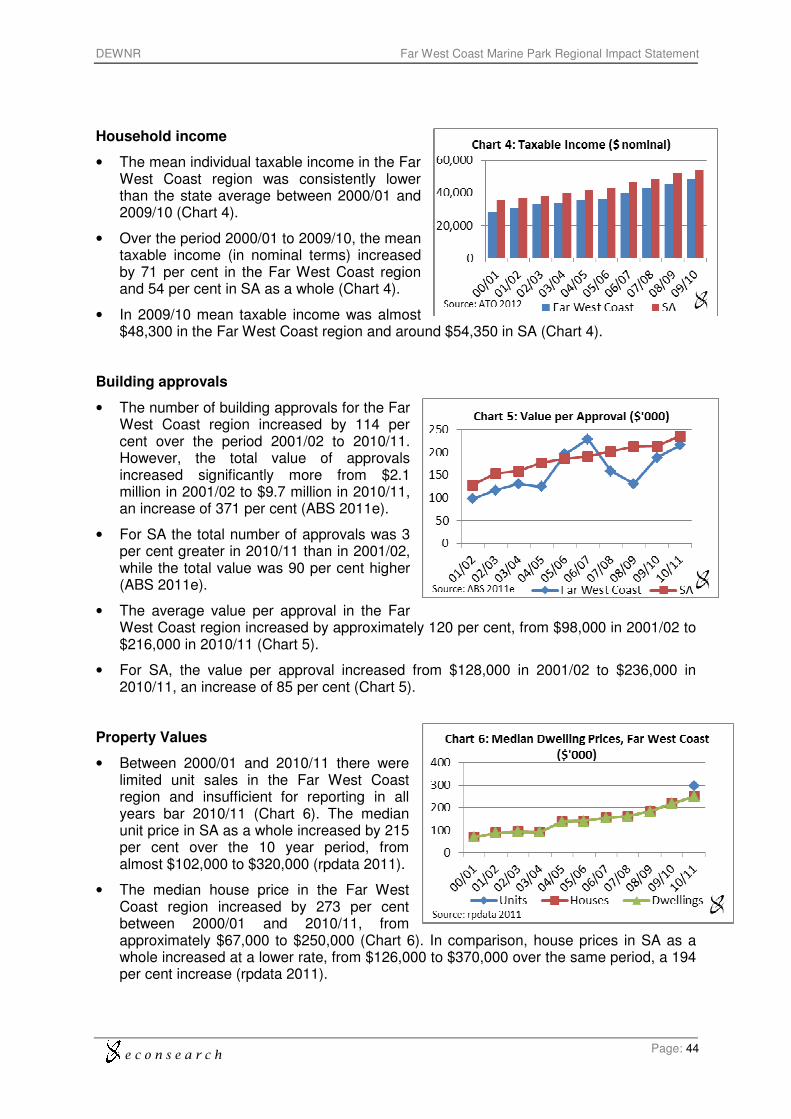
e c o n s e a r c h
DEWNR Far West Coast Marine Park Regional Impact Statement
Page: 44
Household income
• The mean individual taxable income in the Far West Coast region was consistently lower than the state average between 2000/01 and 2009/10 (Chart 4).
• Over the period 2000/01 to 2009/10, the mean taxable income (in nominal terms) increased by 71 per cent in the Far West Coast region and 54 per cent in SA as a whole (Chart 4).
• In 2009/10 mean taxable income was almost $48,300 in the Far West Coast region and around $54,350 in SA (Chart 4).
Building approvals
• The number of building approvals for the Far West Coast region increased by 114 per cent over the period 2001/02 to 2010/11. However, the total value of approvals increased significantly more from $2.1 million in 2001/02 to $9.7 million in 2010/11, an increase of 371 per cent (ABS 2011e).
• For SA the total number of approvals was 3 per cent greater in 2010/11 than in 2001/02, while the total value was 90 per cent higher (ABS 2011e).
• The average value per approval in the Far West Coast region increased by approximately 120 per cent, from $98,000 in 2001/02 to $216,000 in 2010/11 (Chart 5).
• For SA, the value per approval increased from $128,000 in 2001/02 to $236,000 in 2010/11, an increase of 85 per cent (Chart 5).
Property Values
• Between 2000/01 and 2010/11 there were limited unit sales in the Far West Coast region and insufficient for reporting in all years bar 2010/11 (Chart 6). The median unit price in SA as a whole increased by 215 per cent over the 10 year period, from almost $102,000 to $320,000 (rpdata 2011).
• The median house price in the Far West Coast region increased by 273 per cent between 2000/01 and 2010/11, from approximately $67,000 to $250,000 (Chart 6). In comparison, house prices in SA as a whole increased at a lower rate, from $126,000 to $370,000 over the same period, a 194 per cent increase (rpdata 2011).
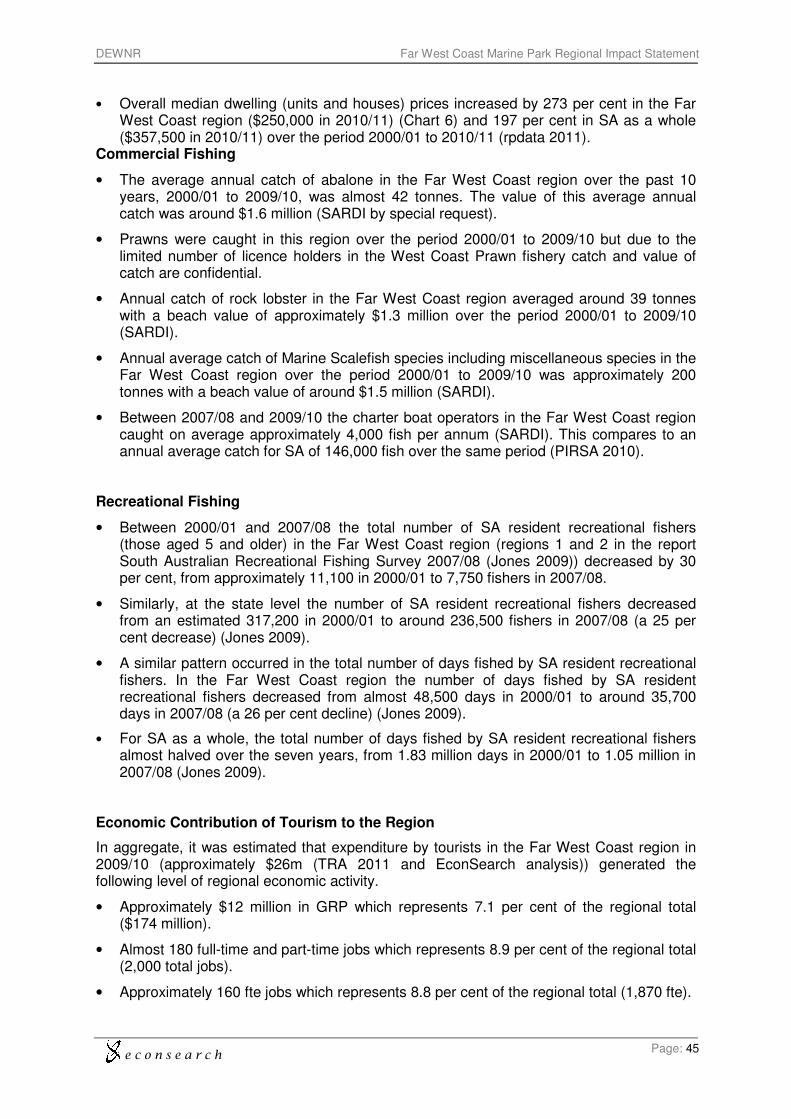
e c o n s e a r c h
DEWNR Far West Coast Marine Park Regional Impact Statement
Page: 45
• Overall median dwelling (units and houses) prices increased by 273 per cent in the Far West Coast region ($250,000 in 2010/11) (Chart 6) and 197 per cent in SA as a whole ($357,500 in 2010/11) over the period 2000/01 to 2010/11 (rpdata 2011).
Commercial Fishing
• The average annual catch of abalone in the Far West Coast region over the past 10 years, 2000/01 to 2009/10, was almost 42 tonnes. The value of this average annual catch was around $1.6 million (SARDI by special request).
• Prawns were caught in this region over the period 2000/01 to 2009/10 but due to the limited number of licence holders in the West Coast Prawn fishery catch and value of catch are confidential.
• Annual catch of rock lobster in the Far West Coast region averaged around 39 tonnes with a beach value of approximately $1.3 million over the period 2000/01 to 2009/10 (SARDI).
• Annual average catch of Marine Scalefish species including miscellaneous species in the Far West Coast region over the period 2000/01 to 2009/10 was approximately 200 tonnes with a beach value of around $1.5 million (SARDI).
• Between 2007/08 and 2009/10 the charter boat operators in the Far West Coast region caught on average approximately 4,000 fish per annum (SARDI). This compares to an annual average catch for SA of 146,000 fish over the same period (PIRSA 2010).
Recreational Fishing
• Between 2000/01 and 2007/08 the total number of SA resident recreational fishers (those aged 5 and older) in the Far West Coast region (regions 1 and 2 in the report South Australian Recreational Fishing Survey 2007/08 (Jones 2009)) decreased by 30 per cent, from approximately 11,100 in 2000/01 to 7,750 fishers in 2007/08.
• Similarly, at the state level the number of SA resident recreational fishers decreased from an estimated 317,200 in 2000/01 to around 236,500 fishers in 2007/08 (a 25 per cent decrease) (Jones 2009).
• A similar pattern occurred in the total number of days fished by SA resident recreational fishers. In the Far West Coast region the number of days fished by SA resident recreational fishers decreased from almost 48,500 days in 2000/01 to around 35,700 days in 2007/08 (a 26 per cent decline) (Jones 2009).
• For SA as a whole, the total number of days fished by SA resident recreational fishers almost halved over the seven years, from 1.83 million days in 2000/01 to 1.05 million in 2007/08 (Jones 2009).
Economic Contribution of Tourism to the Region
In aggregate, it was estimated that expenditure by tourists in the Far West Coast region in 2009/10 (approximately $26m (TRA 2011 and EconSearch analysis)) generated the following level of regional economic activity.
• Approximately $12 million in GRP which represents 7.1 per cent of the regional total ($174 million).
• Almost 180 full-time and part-time jobs which represents 8.9 per cent of the regional total (2,000 total jobs).
• Approximately 160 fte jobs which represents 8.8 per cent of the regional total (1,870 fte).
e c o n s e a r c h
DEWNR Far West Coast Marine Park Regional Impact Statement
Page: 46
Regional Economic Structure
• At the time of the 2006 population census it was estimated that approximately 97 per cent of the jobs in the region were held by local residents and the balance were held predominantly by residents of adjacent regions (i.e. travelled to work from the surrounding SLAs). Approximately 92 per cent of employed residents were employed locally, with the balance travelling to other areas in SA for work including a significant proportion in the Streaky Bay and Unincorporated Far North SLAs12).
• It was estimated that there were approximately 2,000 jobs (1,870 fte jobs) in the Far West Coast region in 2009/10 (by place of remuneration) (Table 5).
• In 2009/10, the top four contributors to total jobs in the region were agriculture, forestry and fishing (15 per cent), health and community services (14 per cent), education (13 per cent) and retail trade (12 per cent each) sectors (Table 5).
• The Far West Coast gross regional product (GRP) was estimated to be $174m in 2009/10 (Table 6). This compares with gross state product (GSP) in the same year of $80.36 billion (ABS 2010b).
• The GRP of the Far West Coast region comprised approximately 0.2 per cent of the SA GSP.
• In 2009/10, the top four contributors to GRP were agriculture, forestry and fishing (15 per cent), ownership of dwellings (14 per cent), health and community services and transport and storage (7 per cent each) sectors (Table 6).
• Expenditure by households accounted for almost 42 per cent of the total value of goods and services imported into the region in 2009/10. Among of the intermediate sectors, the top importers in the region in 2009/10 were the building and construction (10 per cent) and agriculture, forestry and fishing and transport and storage (5 per cent each) sectors (Table 7).
• Expenditure by tourists ($26m) contributed approximately 24 per cent of the total value of exports from the region in 2009/10 (Table 7).
• The top contributors to the value of ‘other exports’ from the region in 2009/10 were the agriculture, forestry and fishing (48 per cent) and transport and storage (13 per cent) sectors (Table 7).
12
Based on detailed ‘journey to work’ employment data obtained from the ABS 2006 Census of Population and Housing using the TableBuilder database.
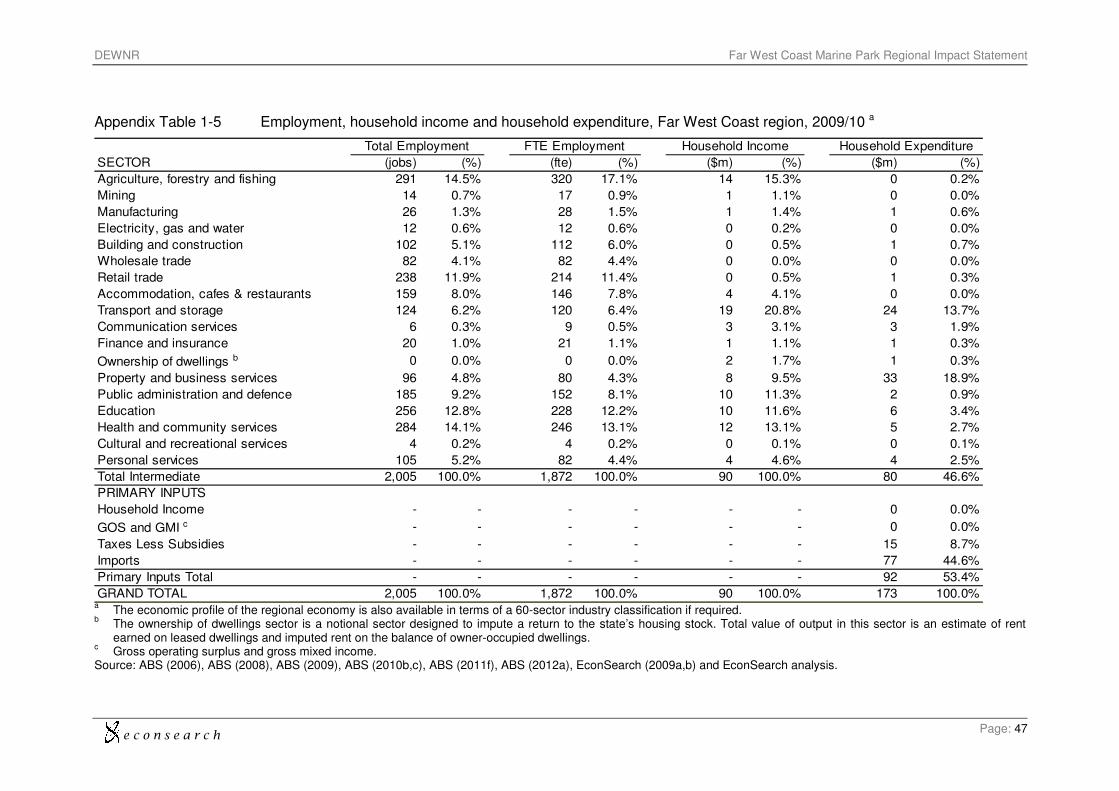
e c o n s e a r c h
DEWNR Far West Coast Marine Park Regional Impact Statement
Page: 47
Appendix Table 1-5 Employment, household income and household expenditure, Far West Coast region, 2009/10 a
SECTOR (jobs) (%) (fte) (%) ($m) (%) ($m) (%)
Agriculture, forestry and fishing 291 14.5% 320 17.1% 14 15.3% 0 0.2%
Mining 14 0.7% 17 0.9% 1 1.1% 0 0.0%
Manufacturing 26 1.3% 28 1.5% 1 1.4% 1 0.6%
Electricity, gas and water 12 0.6% 12 0.6% 0 0.2% 0 0.0%
Building and construction 102 5.1% 112 6.0% 0 0.5% 1 0.7%
Wholesale trade 82 4.1% 82 4.4% 0 0.0% 0 0.0%
Retail trade 238 11.9% 214 11.4% 0 0.5% 1 0.3%
Accommodation, cafes & restaurants 159 8.0% 146 7.8% 4 4.1% 0 0.0%
Transport and storage 124 6.2% 120 6.4% 19 20.8% 24 13.7%
Communication services 6 0.3% 9 0.5% 3 3.1% 3 1.9%
Finance and insurance 20 1.0% 21 1.1% 1 1.1% 1 0.3%
Ownership of dwellings b 0 0.0% 0 0.0% 2 1.7% 1 0.3%
Property and business services 96 4.8% 80 4.3% 8 9.5% 33 18.9%
Public administration and defence 185 9.2% 152 8.1% 10 11.3% 2 0.9%
Education 256 12.8% 228 12.2% 10 11.6% 6 3.4%
Health and community services 284 14.1% 246 13.1% 12 13.1% 5 2.7%
Cultural and recreational services 4 0.2% 4 0.2% 0 0.1% 0 0.1%
Personal services 105 5.2% 82 4.4% 4 4.6% 4 2.5%
Total Intermediate 2,005 100.0% 1,872 100.0% 90 100.0% 80 46.6%
PRIMARY INPUTS
Household Income - - - - - - 0 0.0%
GOS and GMI c - - - - - - 0 0.0%
Taxes Less Subsidies - - - - - - 15 8.7%
Imports - - - - - - 77 44.6%
Primary Inputs Total - - - - - - 92 53.4%
GRAND TOTAL 2,005 100.0% 1,872 100.0% 90 100.0% 173 100.0%
Total Employment FTE Employment Household Income Household Expenditure
a The economic profile of the regional economy is also available in terms of a 60-sector industry classification if required.
b The ownership of dwellings sector is a notional sector designed to impute a return to the state’s housing stock. Total value of output in this sector is an estimate of rent earned on leased dwellings and imputed rent on the balance of owner-occupied dwellings.
c Gross operating surplus and gross mixed income.
Source: ABS (2006), ABS (2008), ABS (2009), ABS (2010b,c), ABS (2011f), ABS (2012a), EconSearch (2009a,b) and EconSearch analysis.
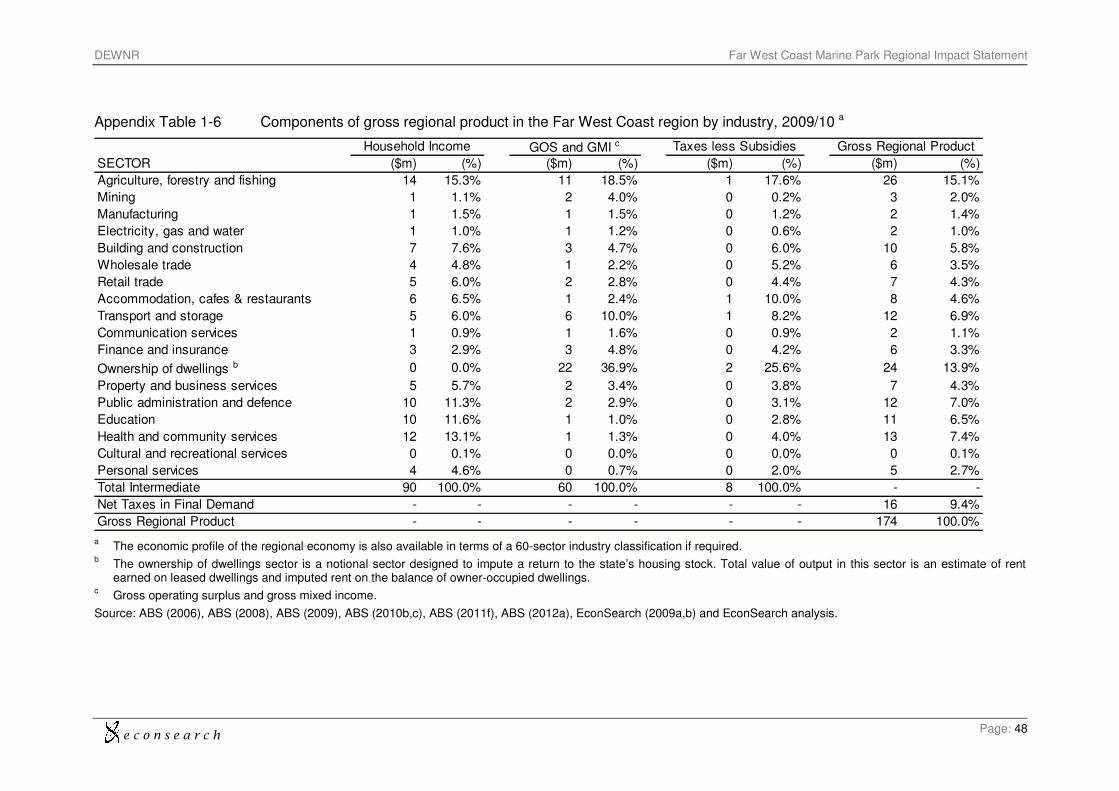
e c o n s e a r c h
DEWNR Far West Coast Marine Park Regional Impact Statement
Page: 48
Appendix Table 1-6 Components of gross regional product in the Far West Coast region by industry, 2009/10 a
SECTOR ($m) (%) ($m) (%) ($m) (%) ($m) (%)
Agriculture, forestry and fishing 14 15.3% 11 18.5% 1 17.6% 26 15.1%
Mining 1 1.1% 2 4.0% 0 0.2% 3 2.0%
Manufacturing 1 1.5% 1 1.5% 0 1.2% 2 1.4%
Electricity, gas and water 1 1.0% 1 1.2% 0 0.6% 2 1.0%
Building and construction 7 7.6% 3 4.7% 0 6.0% 10 5.8%
Wholesale trade 4 4.8% 1 2.2% 0 5.2% 6 3.5%
Retail trade 5 6.0% 2 2.8% 0 4.4% 7 4.3%
Accommodation, cafes & restaurants 6 6.5% 1 2.4% 1 10.0% 8 4.6%
Transport and storage 5 6.0% 6 10.0% 1 8.2% 12 6.9%
Communication services 1 0.9% 1 1.6% 0 0.9% 2 1.1%
Finance and insurance 3 2.9% 3 4.8% 0 4.2% 6 3.3%
Ownership of dwellings b 0 0.0% 22 36.9% 2 25.6% 24 13.9%
Property and business services 5 5.7% 2 3.4% 0 3.8% 7 4.3%
Public administration and defence 10 11.3% 2 2.9% 0 3.1% 12 7.0%
Education 10 11.6% 1 1.0% 0 2.8% 11 6.5%
Health and community services 12 13.1% 1 1.3% 0 4.0% 13 7.4%
Cultural and recreational services 0 0.1% 0 0.0% 0 0.0% 0 0.1%
Personal services 4 4.6% 0 0.7% 0 2.0% 5 2.7%
Total Intermediate 90 100.0% 60 100.0% 8 100.0% - -
Net Taxes in Final Demand - - - - - - 16 9.4%
Gross Regional Product - - - - - - 174 100.0%
Household Income GOS and GMI c Taxes less Subsidies Gross Regional Product
a The economic profile of the regional economy is also available in terms of a 60-sector industry classification if required.
b The ownership of dwellings sector is a notional sector designed to impute a return to the state’s housing stock. Total value of output in this sector is an estimate of rent earned on leased dwellings and imputed rent on the balance of owner-occupied dwellings.
c Gross operating surplus and gross mixed income.
Source: ABS (2006), ABS (2008), ABS (2009), ABS (2010b,c), ABS (2011f), ABS (2012a), EconSearch (2009a,b) and EconSearch analysis.
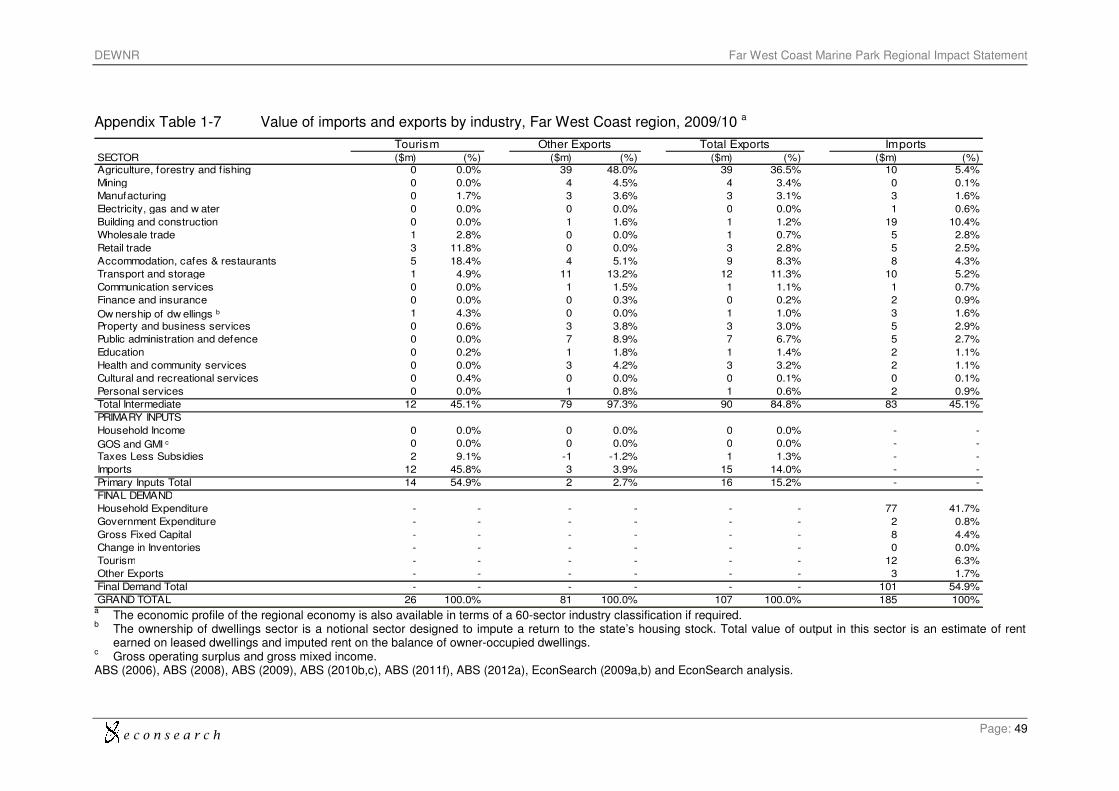
e c o n s e a r c h
DEWNR Far West Coast Marine Park Regional Impact Statement
Page: 49
Appendix Table 1-7 Value of imports and exports by industry, Far West Coast region, 2009/10 a
SECTOR ($m) (%) ($m) (%) ($m) (%) ($m) (%)Agriculture, forestry and f ishing 0 0.0% 39 48.0% 39 36.5% 10 5.4%
Mining 0 0.0% 4 4.5% 4 3.4% 0 0.1%
Manufacturing 0 1.7% 3 3.6% 3 3.1% 3 1.6%
Electricity, gas and w ater 0 0.0% 0 0.0% 0 0.0% 1 0.6%
Building and construction 0 0.0% 1 1.6% 1 1.2% 19 10.4%
Wholesale trade 1 2.8% 0 0.0% 1 0.7% 5 2.8%
Retail trade 3 11.8% 0 0.0% 3 2.8% 5 2.5%
Accommodation, cafes & restaurants 5 18.4% 4 5.1% 9 8.3% 8 4.3%
Transport and storage 1 4.9% 11 13.2% 12 11.3% 10 5.2%
Communication services 0 0.0% 1 1.5% 1 1.1% 1 0.7%
Finance and insurance 0 0.0% 0 0.3% 0 0.2% 2 0.9%
Ow nership of dw ellings b 1 4.3% 0 0.0% 1 1.0% 3 1.6%
Property and business services 0 0.6% 3 3.8% 3 3.0% 5 2.9%
Public administration and defence 0 0.0% 7 8.9% 7 6.7% 5 2.7%
Education 0 0.2% 1 1.8% 1 1.4% 2 1.1%
Health and community services 0 0.0% 3 4.2% 3 3.2% 2 1.1%
Cultural and recreational services 0 0.4% 0 0.0% 0 0.1% 0 0.1%
Personal services 0 0.0% 1 0.8% 1 0.6% 2 0.9%
Total Intermediate 12 45.1% 79 97.3% 90 84.8% 83 45.1%
PRIMARY INPUTS
Household Income 0 0.0% 0 0.0% 0 0.0% - -
GOS and GMI c 0 0.0% 0 0.0% 0 0.0% - -
Taxes Less Subsidies 2 9.1% -1 -1.2% 1 1.3% - -
Imports 12 45.8% 3 3.9% 15 14.0% - -
Primary Inputs Total 14 54.9% 2 2.7% 16 15.2% - -
FINAL DEMAND
Household Expenditure - - - - - - 77 41.7%
Government Expenditure - - - - - - 2 0.8%
Gross Fixed Capital - - - - - - 8 4.4%
Change in Inventories - - - - - - 0 0.0%
Tourism - - - - - - 12 6.3%
Other Exports - - - - - - 3 1.7%
Final Demand Total - - - - - - 101 54.9%
GRAND TOTAL 26 100.0% 81 100.0% 107 100.0% 185 100%
Tourism Other Exports Total Exports Imports
a The economic profile of the regional economy is also available in terms of a 60-sector industry classification if required.
b The ownership of dwellings sector is a notional sector designed to impute a return to the state’s housing stock. Total value of output in this sector is an estimate of rent earned on leased dwellings and imputed rent on the balance of owner-occupied dwellings.
c Gross operating surplus and gross mixed income.
ABS (2006), ABS (2008), ABS (2009), ABS (2010b,c), ABS (2011f), ABS (2012a), EconSearch (2009a,b) and EconSearch analysis.
e c o n s e a r c h
DEWNR Far West Coast Marine Park Regional Impact Statement
Page: 50
References
Australian Bureau of Statistics (ABS) 2006, 2003/04 Household Expenditure Survey Summary of Results, ABS Cat. No. 6530.0, Canberra, electronic version.
ABS 2007, 2006 Census Tables, Cat. No. 2068.0, Canberra, June.
ABS 2008, Agricultural Commodities: Small Area Data, Australia, 2005/06, ABS Cat. No. 7125.0, Canberra.
ABS 2009, Australian National Accounts: Input-Output Tables - Electronic Publication 2005-06, ABS Cat. No. 5209.0.55.001, Canberra.
ABS 2010a, National Regional Profiles, Cat. No. 1379.0, Canberra, November (and previous issues).
ABS 2010b, 2009/10 Australian National Accounts, State Accounts, ABS Cat. No. 5220.0, Canberra.
ABS 2010c, Australian National Accounts, Tourism Satellite Account, 2009/10, ABS Cat. No. 5249.0, Canberra.
ABS 2011a, Births, Australia, 2009, Cat. No. 3301.0, Canberra, March (and previous issues).
ABS 2011b, Deaths, Australia, 2009, Cat. No. 3302.0, Canberra, March (and previous issues).
ABS 2011c, Population by Age and Sex, Regions of Australia, 2009/10, ABS Cat. No. 3235.0, Canberra, August.
ABS 2011d, Counts of Australian Businesses, including Entries and Exits, June 2007 to June 2009, Cat No. 8165.0, Canberra, February.
ABS 2011e, Building Approvals, Australia, Cat. No. 8731.0, Canberra, August (and previous issues).
ABS 2011f, Value of Agricultural Commodities Produced, Australia, 2009/10, ABS Cat. No. 7503.0, Canberra.
ABS 2012a, Regional Population Growth, Australia, Population Estimates by Statistical Local Area, 2001 to 2010, Cat. No. 3218.0, Canberra, March (and previous issues).
ABS 2012b, 2011 Census of Population and Housing, Basic Community Profiles, June.
Australian Taxation Office 2012, Taxation Statistics 2009/10, Table 3: Personal Tax, Selected items, by state/territory and postcode, for taxable individuals, 2009/10 income year (and previous issues).
Department of Education, Employment and Workplace Relations (DEEWR) 2011, Small Area Labour Markets – June Quarter 2011, Canberra, December, (and previous issues).
Department of Planning and Local Government 2011, Age-sex Population Projections by Local Government Area, 2006 to 2026, May.
EconSearch 2009a, Economic and Environmental Indicators for South Australia and its Regions, 2006/07, report prepared for the DTED, May.
EconSearch 2009b, Input-Output Tables for South Australia and its Regions, 2006/07: Technical Report, report prepared for the Department of Trade and Economic Development, May.
Jones, K. 2009, South Australian Recreational fishing Survey 2007/08, Fisheries Division, Primary Industries and Resources South Australia, December.
e c o n s e a r c h
DEWNR Far West Coast Marine Park Regional Impact Statement
Page: 51
PIRSA 2010, 2010 Data Summary of the South Australian Recreational Charter Boat Fishery, September.
Rpdata 2011, Median unit, house and dwelling prices by region, 2000/01 to 2010/11, by special request
Tourism Research Australia (TRA), 2011, Regional Tourism Profiles 2009/10, Canberra.
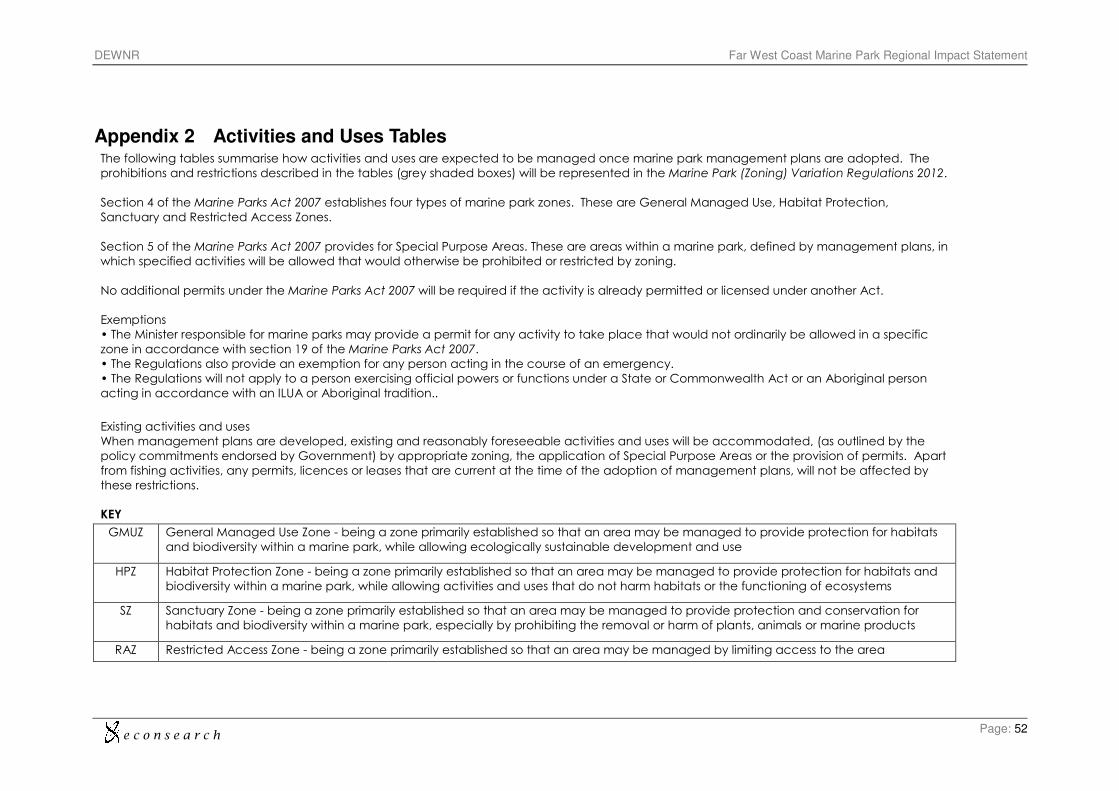
e c o n s e a r c h
DEWNR Far West Coast Marine Park Regional Impact Statement
Page: 52
Appendix 2 Activities and Uses Tables The following tables summarise how activities and uses are expected to be managed once marine park management plans are adopted. The
prohibitions and restrictions described in the tables (grey shaded boxes) will be represented in the Marine Park (Zoning) Variation Regulations 2012.
Section 4 of the Marine Parks Act 2007 establishes four types of marine park zones. These are General Managed Use, Habitat Protection,
Sanctuary and Restricted Access Zones.
Section 5 of the Marine Parks Act 2007 provides for Special Purpose Areas. These are areas within a marine park, defined by management plans, in
which specified activities will be allowed that would otherwise be prohibited or restricted by zoning.
No additional permits under the Marine Parks Act 2007 will be required if the activity is already permitted or licensed under another Act.
Exemptions
• The Minister responsible for marine parks may provide a permit for any activity to take place that would not ordinarily be allowed in a specific
zone in accordance with section 19 of the Marine Parks Act 2007.
• The Regulations also provide an exemption for any person acting in the course of an emergency.
• The Regulations will not apply to a person exercising official powers or functions under a State or Commonwealth Act or an Aboriginal person
acting in accordance with an ILUA or Aboriginal tradition..
Existing activities and uses
When management plans are developed, existing and reasonably foreseeable activities and uses will be accommodated, (as outlined by the
policy commitments endorsed by Government) by appropriate zoning, the application of Special Purpose Areas or the provision of permits. Apart
from fishing activities, any permits, licences or leases that are current at the time of the adoption of management plans, will not be affected by
these restrictions.
KEY
GMUZ General Managed Use Zone - being a zone primarily established so that an area may be managed to provide protection for habitats
and biodiversity within a marine park, while allowing ecologically sustainable development and use
HPZ Habitat Protection Zone - being a zone primarily established so that an area may be managed to provide protection for habitats and
biodiversity within a marine park, while allowing activities and uses that do not harm habitats or the functioning of ecosystems
SZ Sanctuary Zone - being a zone primarily established so that an area may be managed to provide protection and conservation for
habitats and biodiversity within a marine park, especially by prohibiting the removal or harm of plants, animals or marine products
RAZ Restricted Access Zone - being a zone primarily established so that an area may be managed by limiting access to the area
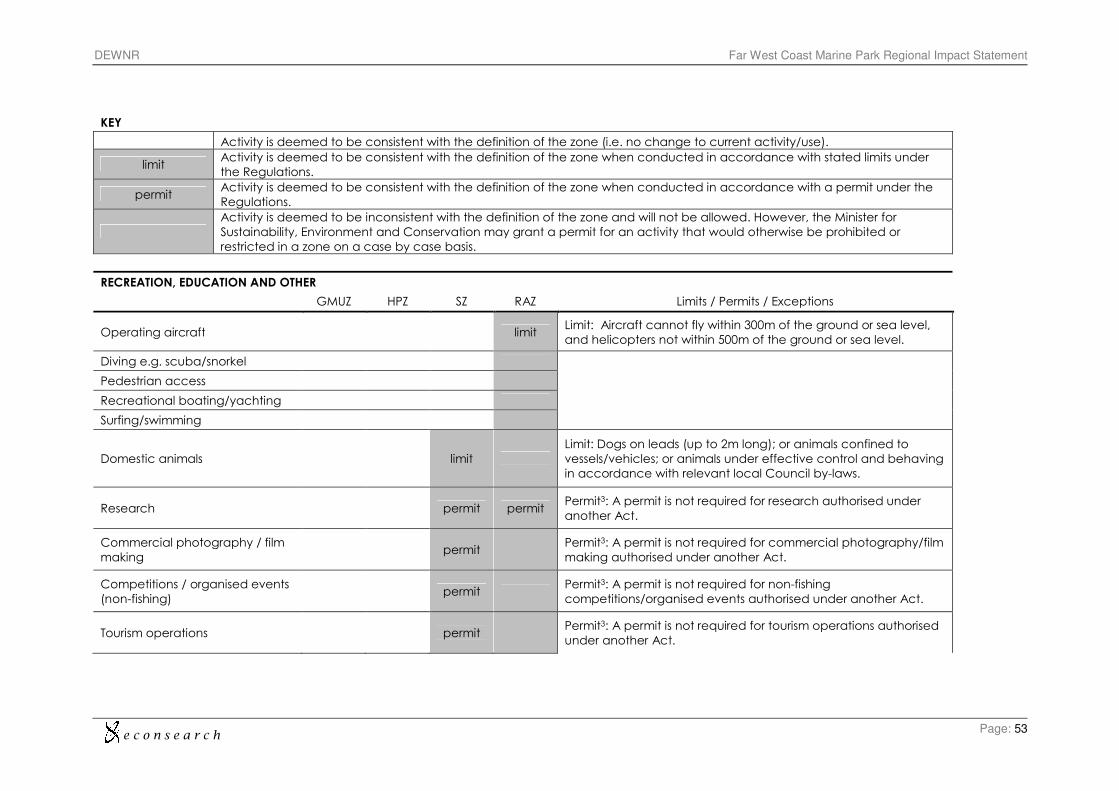
e c o n s e a r c h
DEWNR Far West Coast Marine Park Regional Impact Statement
Page: 53
KEY
Activity is deemed to be consistent with the definition of the zone (i.e. no change to current activity/use).
limit Activity is deemed to be consistent with the definition of the zone when conducted in accordance with stated limits under
the Regulations.
permit Activity is deemed to be consistent with the definition of the zone when conducted in accordance with a permit under the
Regulations.
Activity is deemed to be inconsistent with the definition of the zone and will not be allowed. However, the Minister for
Sustainability, Environment and Conservation may grant a permit for an activity that would otherwise be prohibited or
restricted in a zone on a case by case basis.
RECREATION, EDUCATION AND OTHER
GMUZ HPZ SZ RAZ Limits / Permits / Exceptions
Operating aircraft limit Limit: Aircraft cannot fly within 300m of the ground or sea level,
and helicopters not within 500m of the ground or sea level.
Diving e.g. scuba/snorkel
Pedestrian access
Recreational boating/yachting
Surfing/swimming
Domestic animals limit
Limit: Dogs on leads (up to 2m long); or animals confined to
vessels/vehicles; or animals under effective control and behaving
in accordance with relevant local Council by-laws.
Research permit permit Permit3: A permit is not required for research authorised under
another Act.
Commercial photography / film
making permit
Permit3: A permit is not required for commercial photography/film
making authorised under another Act.
Competitions / organised events
(non-fishing) permit
Permit3: A permit is not required for non-fishing
competitions/organised events authorised under another Act.
Tourism operations permit Permit3: A permit is not required for tourism operations authorised
under another Act.
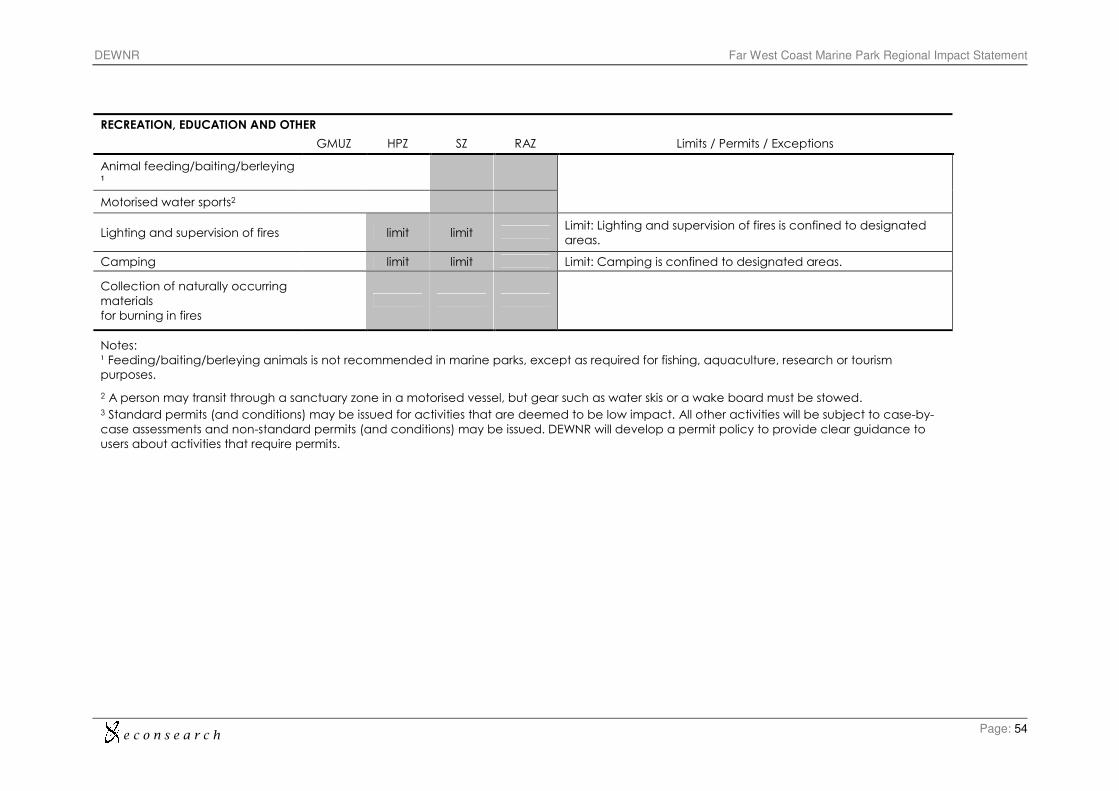
e c o n s e a r c h
DEWNR Far West Coast Marine Park Regional Impact Statement
Page: 54
RECREATION, EDUCATION AND OTHER
GMUZ HPZ SZ RAZ Limits / Permits / Exceptions
Animal feeding/baiting/berleying ¹
Motorised water sports2
Lighting and supervision of fires limit limit Limit: Lighting and supervision of fires is confined to designated
areas.
Camping limit limit Limit: Camping is confined to designated areas.
Collection of naturally occurring
materials
for burning in fires
Notes:
¹ Feeding/baiting/berleying animals is not recommended in marine parks, except as required for fishing, aquaculture, research or tourism
purposes.
2 A person may transit through a sanctuary zone in a motorised vessel, but gear such as water skis or a wake board must be stowed. 3 Standard permits (and conditions) may be issued for activities that are deemed to be low impact. All other activities will be subject to case-by-
case assessments and non-standard permits (and conditions) may be issued. DEWNR will develop a permit policy to provide clear guidance to
users about activities that require permits.
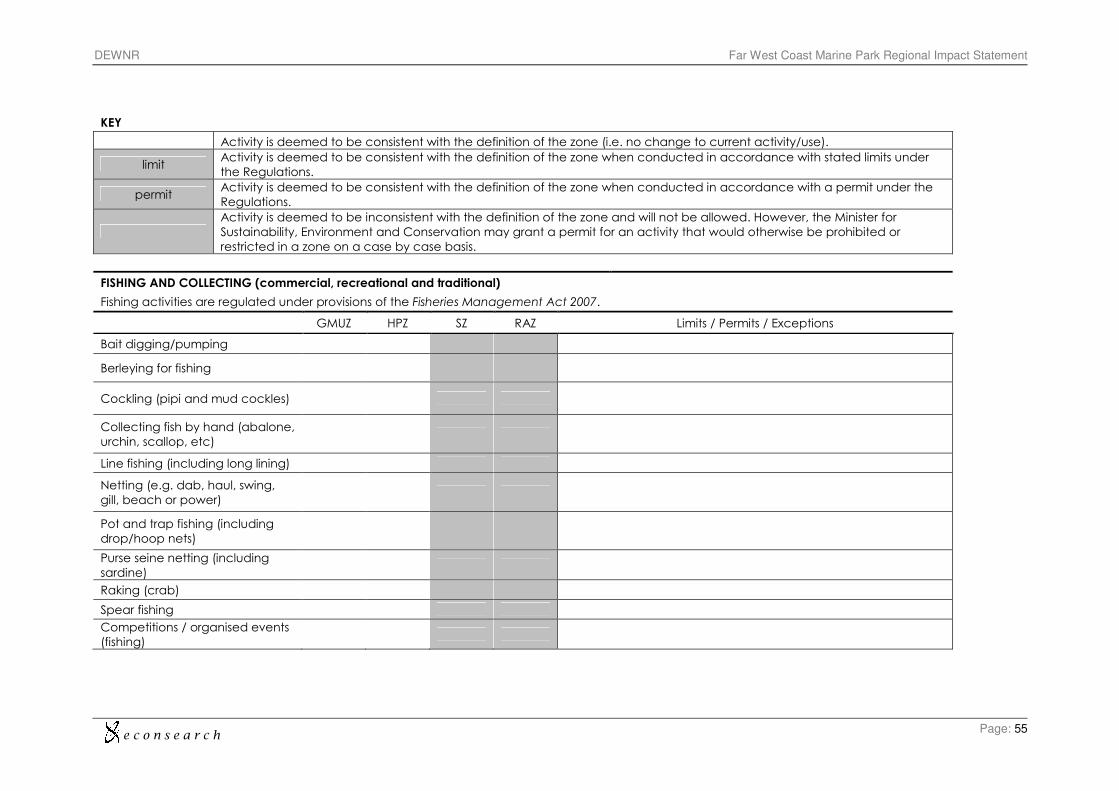
e c o n s e a r c h
DEWNR Far West Coast Marine Park Regional Impact Statement
Page: 55
KEY
Activity is deemed to be consistent with the definition of the zone (i.e. no change to current activity/use).
limit Activity is deemed to be consistent with the definition of the zone when conducted in accordance with stated limits under
the Regulations.
permit Activity is deemed to be consistent with the definition of the zone when conducted in accordance with a permit under the
Regulations.
Activity is deemed to be inconsistent with the definition of the zone and will not be allowed. However, the Minister for
Sustainability, Environment and Conservation may grant a permit for an activity that would otherwise be prohibited or
restricted in a zone on a case by case basis.
FISHING AND COLLECTING (commercial, recreational and traditional)
Fishing activities are regulated under provisions of the Fisheries Management Act 2007.
GMUZ HPZ SZ RAZ Limits / Permits / Exceptions
Bait digging/pumping
Berleying for fishing
Cockling (pipi and mud cockles)
Collecting fish by hand (abalone,
urchin, scallop, etc)
Line fishing (including long lining)
Netting (e.g. dab, haul, swing,
gill, beach or power)
Pot and trap fishing (including
drop/hoop nets)
Purse seine netting (including
sardine)
Raking (crab)
Spear fishing
Competitions / organised events
(fishing)
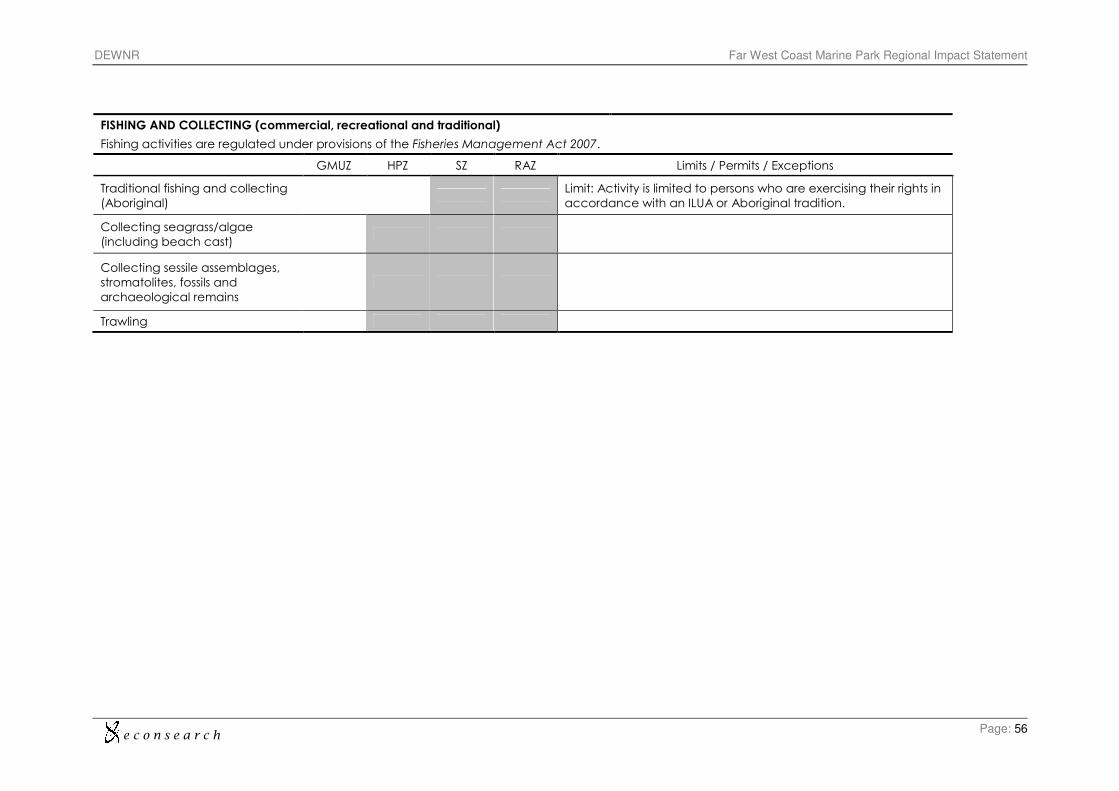
e c o n s e a r c h
DEWNR Far West Coast Marine Park Regional Impact Statement
Page: 56
FISHING AND COLLECTING (commercial, recreational and traditional)
Fishing activities are regulated under provisions of the Fisheries Management Act 2007.
GMUZ HPZ SZ RAZ Limits / Permits / Exceptions
Traditional fishing and collecting
(Aboriginal)
Limit: Activity is limited to persons who are exercising their rights in
accordance with an ILUA or Aboriginal tradition.
Collecting seagrass/algae
(including beach cast)
Collecting sessile assemblages,
stromatolites, fossils and
archaeological remains
Trawling
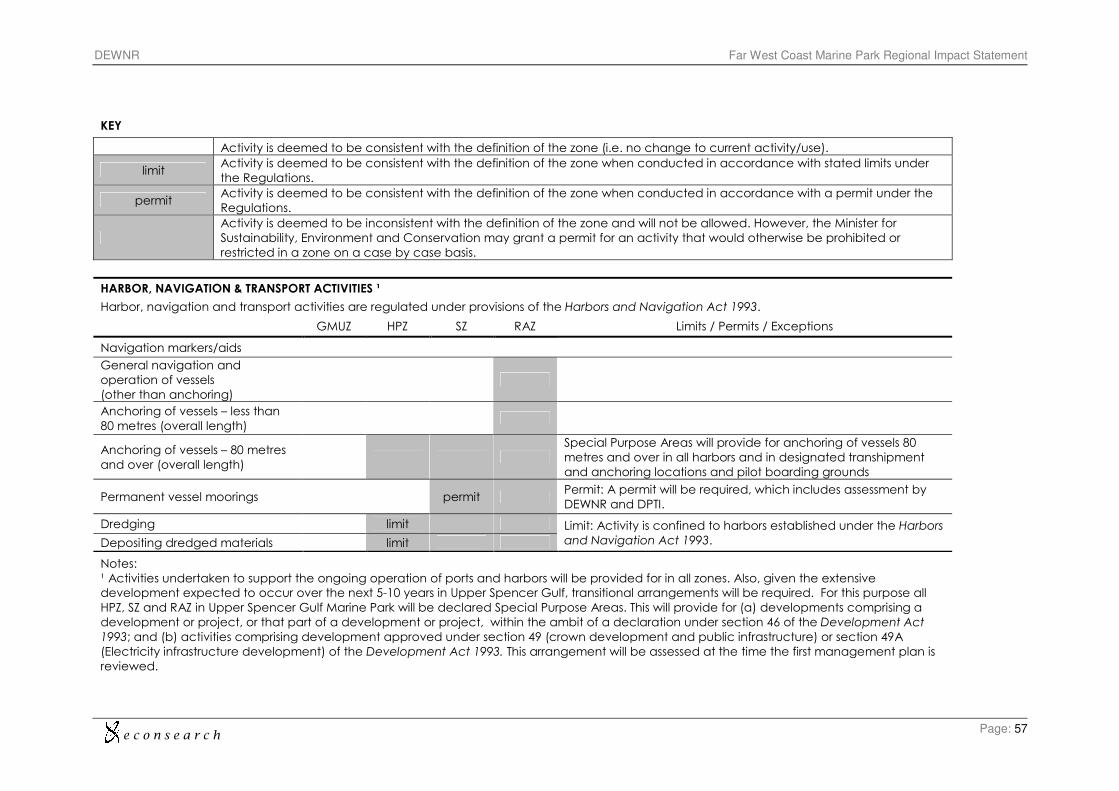
e c o n s e a r c h
DEWNR Far West Coast Marine Park Regional Impact Statement
Page: 57
KEY
Activity is deemed to be consistent with the definition of the zone (i.e. no change to current activity/use).
limit Activity is deemed to be consistent with the definition of the zone when conducted in accordance with stated limits under
the Regulations.
permit Activity is deemed to be consistent with the definition of the zone when conducted in accordance with a permit under the
Regulations.
Activity is deemed to be inconsistent with the definition of the zone and will not be allowed. However, the Minister for
Sustainability, Environment and Conservation may grant a permit for an activity that would otherwise be prohibited or
restricted in a zone on a case by case basis.
HARBOR, NAVIGATION & TRANSPORT ACTIVITIES ¹
Harbor, navigation and transport activities are regulated under provisions of the Harbors and Navigation Act 1993.
GMUZ HPZ SZ RAZ Limits / Permits / Exceptions
Navigation markers/aids
General navigation and
operation of vessels
(other than anchoring)
Anchoring of vessels – less than
80 metres (overall length)
Anchoring of vessels – 80 metres
and over (overall length)
Special Purpose Areas will provide for anchoring of vessels 80
metres and over in all harbors and in designated transhipment
and anchoring locations and pilot boarding grounds
Permanent vessel moorings permit Permit: A permit will be required, which includes assessment by
DEWNR and DPTI.
Dredging limit Limit: Activity is confined to harbors established under the Harbors
and Navigation Act 1993. Depositing dredged materials limit
Notes:
¹ Activities undertaken to support the ongoing operation of ports and harbors will be provided for in all zones. Also, given the extensive
development expected to occur over the next 5-10 years in Upper Spencer Gulf, transitional arrangements will be required. For this purpose all
HPZ, SZ and RAZ in Upper Spencer Gulf Marine Park will be declared Special Purpose Areas. This will provide for (a) developments comprising a
development or project, or that part of a development or project, within the ambit of a declaration under section 46 of the Development Act
1993; and (b) activities comprising development approved under section 49 (crown development and public infrastructure) or section 49A
(Electricity infrastructure development) of the Development Act 1993. This arrangement will be assessed at the time the first management plan is
reviewed.
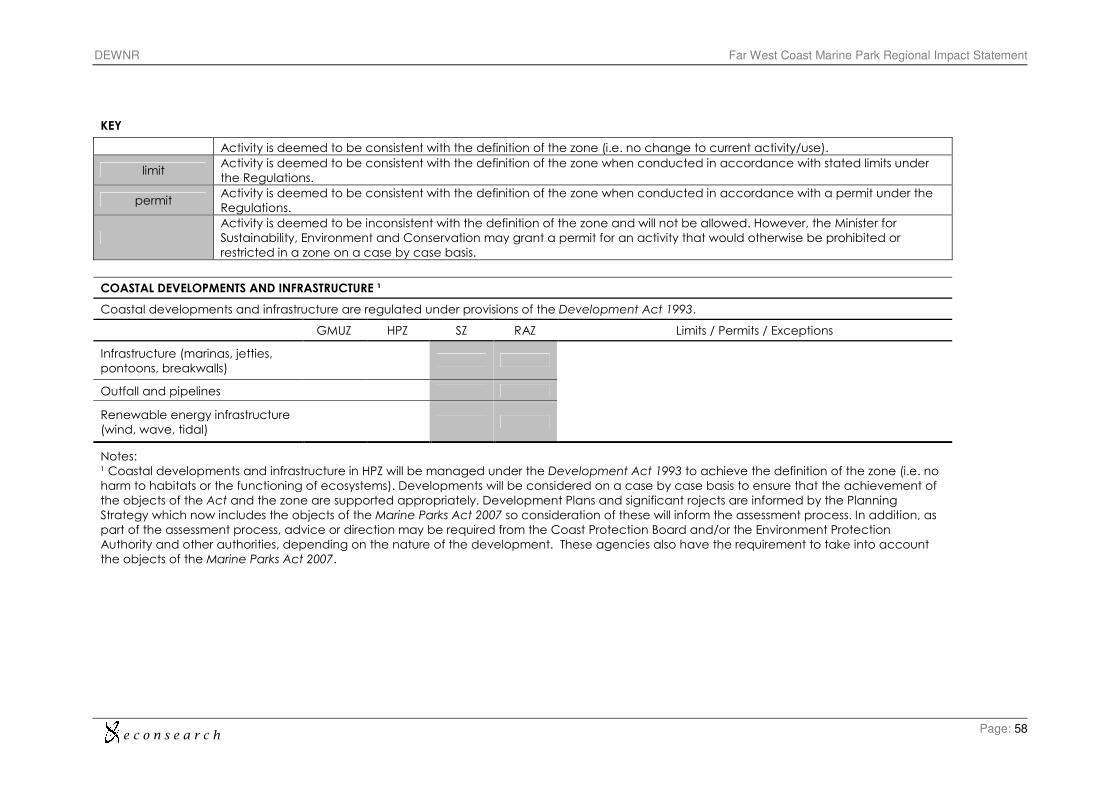
e c o n s e a r c h
DEWNR Far West Coast Marine Park Regional Impact Statement
Page: 58
KEY
Activity is deemed to be consistent with the definition of the zone (i.e. no change to current activity/use).
limit Activity is deemed to be consistent with the definition of the zone when conducted in accordance with stated limits under
the Regulations.
permit Activity is deemed to be consistent with the definition of the zone when conducted in accordance with a permit under the
Regulations.
Activity is deemed to be inconsistent with the definition of the zone and will not be allowed. However, the Minister for
Sustainability, Environment and Conservation may grant a permit for an activity that would otherwise be prohibited or
restricted in a zone on a case by case basis.
COASTAL DEVELOPMENTS AND INFRASTRUCTURE ¹
Coastal developments and infrastructure are regulated under provisions of the Development Act 1993.
GMUZ HPZ SZ RAZ Limits / Permits / Exceptions
Infrastructure (marinas, jetties,
pontoons, breakwalls)
Outfall and pipelines
Renewable energy infrastructure
(wind, wave, tidal)
Notes:
¹ Coastal developments and infrastructure in HPZ will be managed under the Development Act 1993 to achieve the definition of the zone (i.e. no
harm to habitats or the functioning of ecosystems). Developments will be considered on a case by case basis to ensure that the achievement of
the objects of the Act and the zone are supported appropriately. Development Plans and significant rojects are informed by the Planning
Strategy which now includes the objects of the Marine Parks Act 2007 so consideration of these will inform the assessment process. In addition, as
part of the assessment process, advice or direction may be required from the Coast Protection Board and/or the Environment Protection
Authority and other authorities, depending on the nature of the development. These agencies also have the requirement to take into account
the objects of the Marine Parks Act 2007.
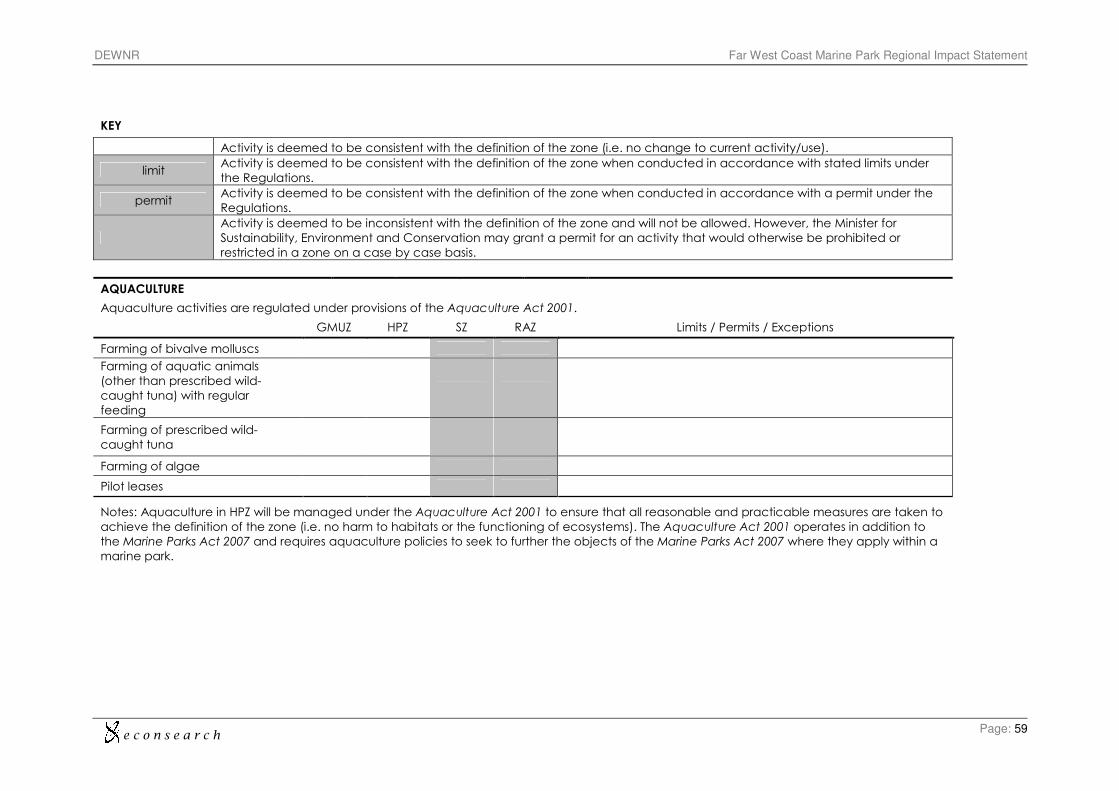
e c o n s e a r c h
DEWNR Far West Coast Marine Park Regional Impact Statement
Page: 59
KEY
Activity is deemed to be consistent with the definition of the zone (i.e. no change to current activity/use).
limit Activity is deemed to be consistent with the definition of the zone when conducted in accordance with stated limits under
the Regulations.
permit Activity is deemed to be consistent with the definition of the zone when conducted in accordance with a permit under the
Regulations.
Activity is deemed to be inconsistent with the definition of the zone and will not be allowed. However, the Minister for
Sustainability, Environment and Conservation may grant a permit for an activity that would otherwise be prohibited or
restricted in a zone on a case by case basis.
AQUACULTURE
Aquaculture activities are regulated under provisions of the Aquaculture Act 2001.
GMUZ HPZ SZ RAZ Limits / Permits / Exceptions
Farming of bivalve molluscs
Farming of aquatic animals
(other than prescribed wild-
caught tuna) with regular
feeding
Farming of prescribed wild-
caught tuna
Farming of algae
Pilot leases
Notes: Aquaculture in HPZ will be managed under the Aquaculture Act 2001 to ensure that all reasonable and practicable measures are taken to
achieve the definition of the zone (i.e. no harm to habitats or the functioning of ecosystems). The Aquaculture Act 2001 operates in addition to
the Marine Parks Act 2007 and requires aquaculture policies to seek to further the objects of the Marine Parks Act 2007 where they apply within a
marine park.
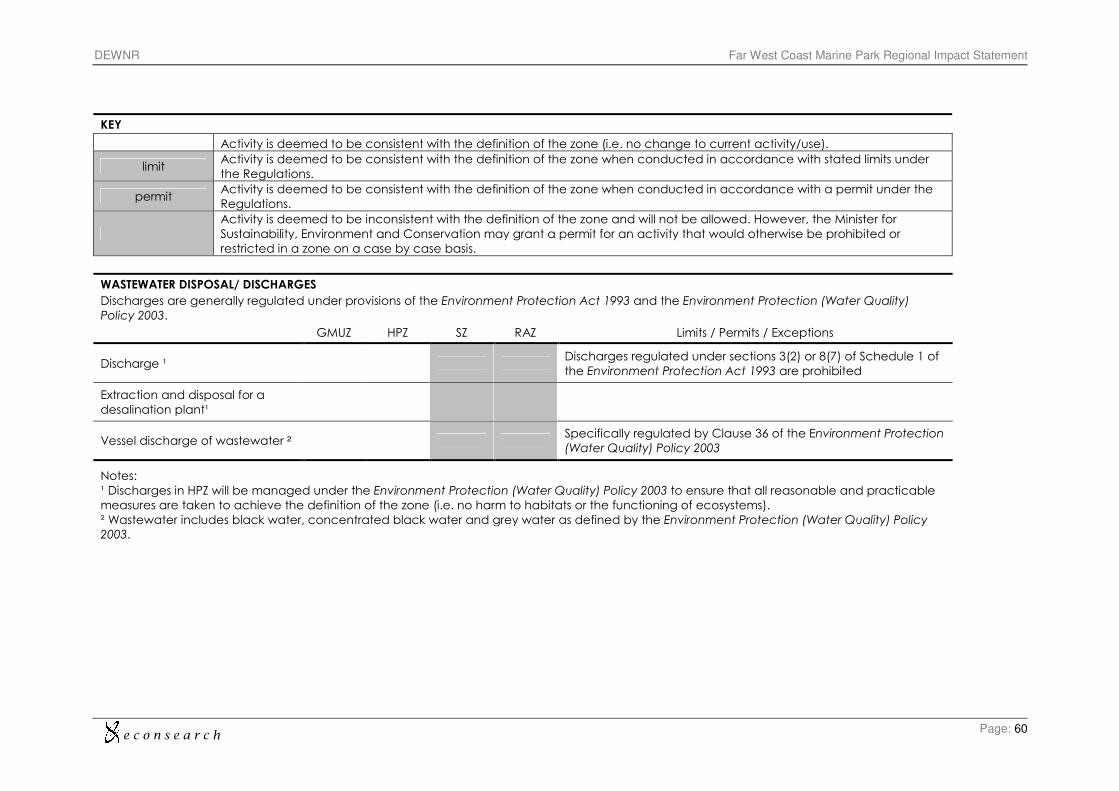
e c o n s e a r c h
DEWNR Far West Coast Marine Park Regional Impact Statement
Page: 60
KEY
Activity is deemed to be consistent with the definition of the zone (i.e. no change to current activity/use).
limit Activity is deemed to be consistent with the definition of the zone when conducted in accordance with stated limits under
the Regulations.
permit Activity is deemed to be consistent with the definition of the zone when conducted in accordance with a permit under the
Regulations.
Activity is deemed to be inconsistent with the definition of the zone and will not be allowed. However, the Minister for
Sustainability, Environment and Conservation may grant a permit for an activity that would otherwise be prohibited or
restricted in a zone on a case by case basis.
WASTEWATER DISPOSAL/ DISCHARGES
Discharges are generally regulated under provisions of the Environment Protection Act 1993 and the Environment Protection (Water Quality)
Policy 2003.
GMUZ HPZ SZ RAZ Limits / Permits / Exceptions
Discharge ¹ Discharges regulated under sections 3(2) or 8(7) of Schedule 1 of
the Environment Protection Act 1993 are prohibited
Extraction and disposal for a
desalination plant¹
Vessel discharge of wastewater ² Specifically regulated by Clause 36 of the Environment Protection
(Water Quality) Policy 2003
Notes:
¹ Discharges in HPZ will be managed under the Environment Protection (Water Quality) Policy 2003 to ensure that all reasonable and practicable
measures are taken to achieve the definition of the zone (i.e. no harm to habitats or the functioning of ecosystems).
² Wastewater includes black water, concentrated black water and grey water as defined by the Environment Protection (Water Quality) Policy
2003.
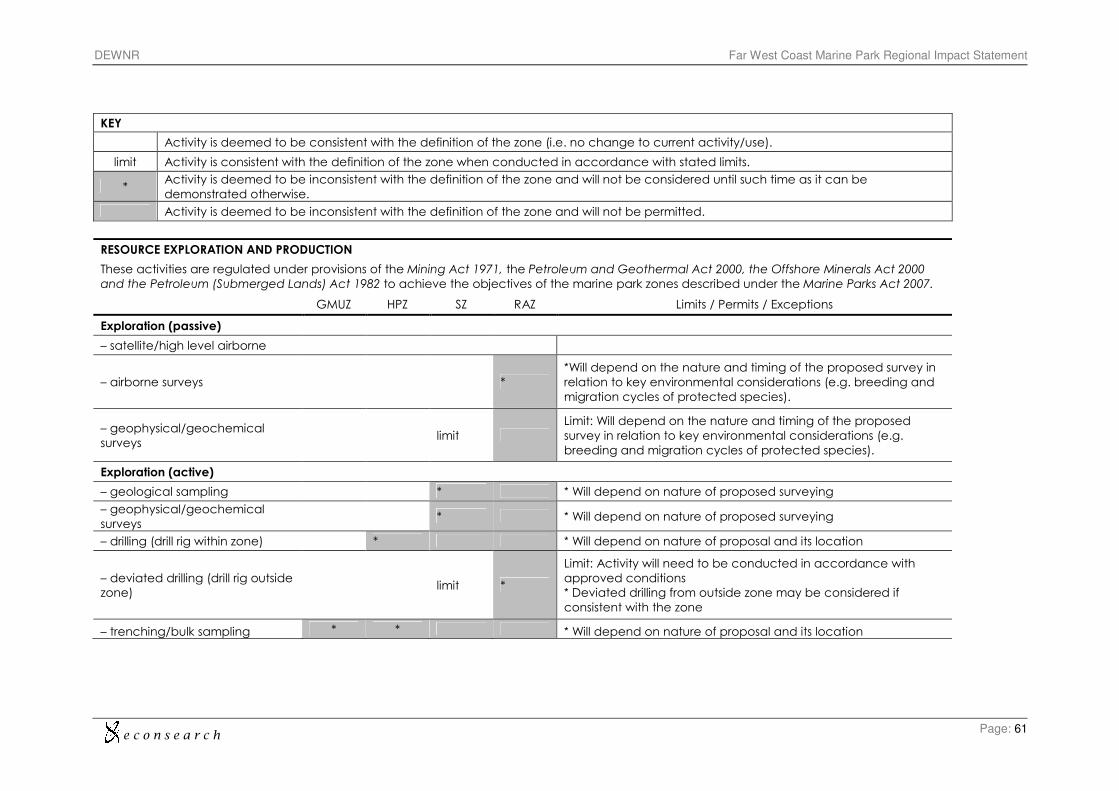
e c o n s e a r c h
DEWNR Far West Coast Marine Park Regional Impact Statement
Page: 61
KEY
Activity is deemed to be consistent with the definition of the zone (i.e. no change to current activity/use).
limit Activity is consistent with the definition of the zone when conducted in accordance with stated limits.
* Activity is deemed to be inconsistent with the definition of the zone and will not be considered until such time as it can be
demonstrated otherwise.
Activity is deemed to be inconsistent with the definition of the zone and will not be permitted.
RESOURCE EXPLORATION AND PRODUCTION
These activities are regulated under provisions of the Mining Act 1971, the Petroleum and Geothermal Act 2000, the Offshore Minerals Act 2000
and the Petroleum (Submerged Lands) Act 1982 to achieve the objectives of the marine park zones described under the Marine Parks Act 2007.
GMUZ HPZ SZ RAZ Limits / Permits / Exceptions
Exploration (passive) � � � �
– satellite/high level airborne
– airborne surveys *
*Will depend on the nature and timing of the proposed survey in relation to key environmental considerations (e.g. breeding and
migration cycles of protected species).
– geophysical/geochemical
surveys limit
Limit: Will depend on the nature and timing of the proposed
survey in relation to key environmental considerations (e.g.
breeding and migration cycles of protected species).
Exploration (active) � � � �
– geological sampling * * Will depend on nature of proposed surveying
– geophysical/geochemical
surveys * * Will depend on nature of proposed surveying
– drilling (drill rig within zone) * * Will depend on nature of proposal and its location
– deviated drilling (drill rig outside
zone) limit *
Limit: Activity will need to be conducted in accordance with
approved conditions * Deviated drilling from outside zone may be considered if consistent with the zone
– trenching/bulk sampling * * * Will depend on nature of proposal and its location
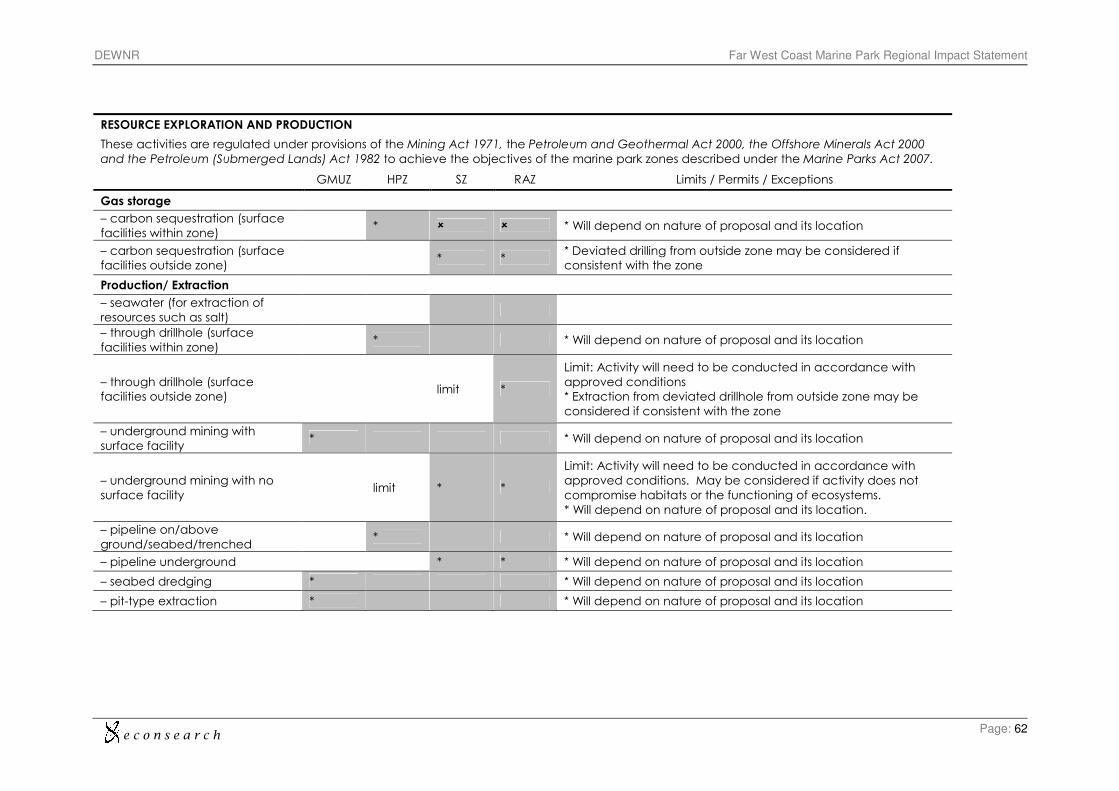
e c o n s e a r c h
DEWNR Far West Coast Marine Park Regional Impact Statement
Page: 62
RESOURCE EXPLORATION AND PRODUCTION
These activities are regulated under provisions of the Mining Act 1971, the Petroleum and Geothermal Act 2000, the Offshore Minerals Act 2000
and the Petroleum (Submerged Lands) Act 1982 to achieve the objectives of the marine park zones described under the Marine Parks Act 2007.
GMUZ HPZ SZ RAZ Limits / Permits / Exceptions
Gas storage
– carbon sequestration (surface
facilities within zone) * � � * Will depend on nature of proposal and its location
– carbon sequestration (surface
facilities outside zone) * *
* Deviated drilling from outside zone may be considered if consistent with the zone
Production/ Extraction � � � �
– seawater (for extraction of
resources such as salt)
– through drillhole (surface
facilities within zone) * * Will depend on nature of proposal and its location
– through drillhole (surface
facilities outside zone) limit *
Limit: Activity will need to be conducted in accordance with
approved conditions
* Extraction from deviated drillhole from outside zone may be considered if consistent with the zone
– underground mining with
surface facility * * Will depend on nature of proposal and its location
– underground mining with no
surface facility limit * *
Limit: Activity will need to be conducted in accordance with
approved conditions. May be considered if activity does not
compromise habitats or the functioning of ecosystems.
* Will depend on nature of proposal and its location.
– pipeline on/above
ground/seabed/trenched * * Will depend on nature of proposal and its location
– pipeline underground * * * Will depend on nature of proposal and its location
– seabed dredging * * Will depend on nature of proposal and its location
– pit-type extraction * * Will depend on nature of proposal and its location
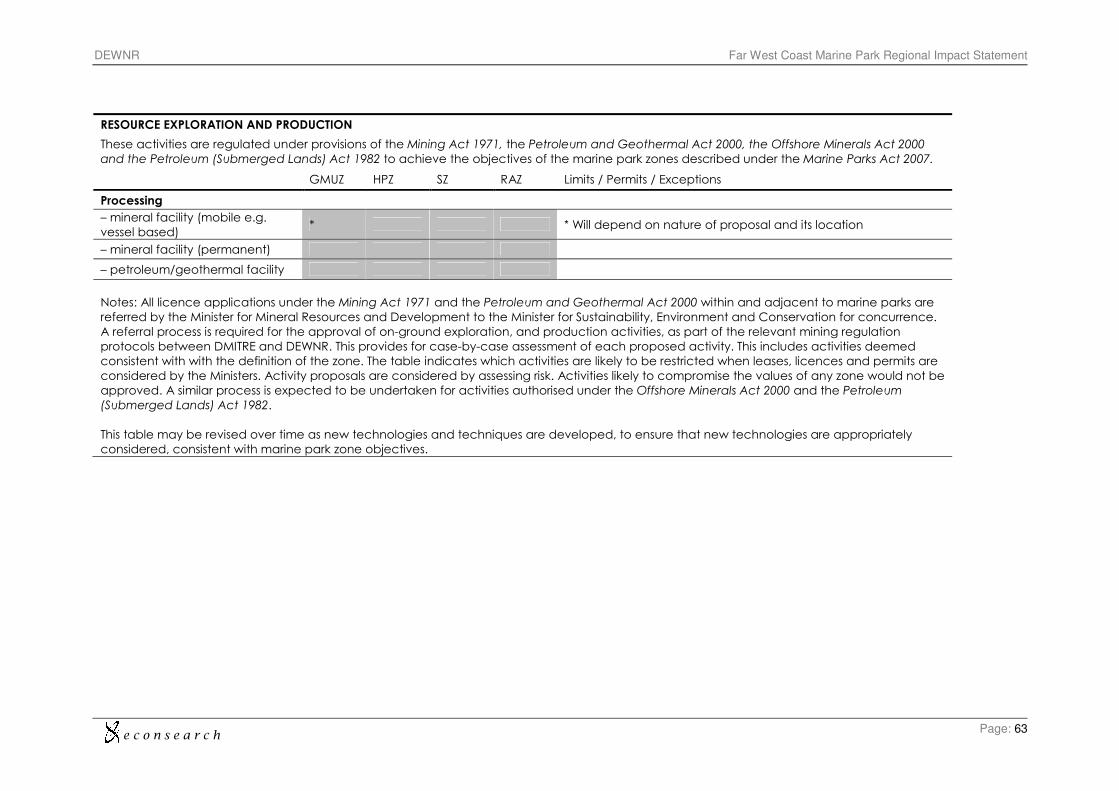
e c o n s e a r c h
DEWNR Far West Coast Marine Park Regional Impact Statement
Page: 63
RESOURCE EXPLORATION AND PRODUCTION
These activities are regulated under provisions of the Mining Act 1971, the Petroleum and Geothermal Act 2000, the Offshore Minerals Act 2000
and the Petroleum (Submerged Lands) Act 1982 to achieve the objectives of the marine park zones described under the Marine Parks Act 2007.
GMUZ HPZ SZ RAZ Limits / Permits / Exceptions
Processing � � � �
– mineral facility (mobile e.g.
vessel based) * * Will depend on nature of proposal and its location
– mineral facility (permanent)
– petroleum/geothermal facility
Notes: All licence applications under the Mining Act 1971 and the Petroleum and Geothermal Act 2000 within and adjacent to marine parks are
referred by the Minister for Mineral Resources and Development to the Minister for Sustainability, Environment and Conservation for concurrence.
A referral process is required for the approval of on-ground exploration, and production activities, as part of the relevant mining regulation
protocols between DMITRE and DEWNR. This provides for case-by-case assessment of each proposed activity. This includes activities deemed
consistent with with the definition of the zone. The table indicates which activities are likely to be restricted when leases, licences and permits are
considered by the Ministers. Activity proposals are considered by assessing risk. Activities likely to compromise the values of any zone would not be
approved. A similar process is expected to be undertaken for activities authorised under the Offshore Minerals Act 2000 and the Petroleum
(Submerged Lands) Act 1982.
This table may be revised over time as new technologies and techniques are developed, to ensure that new technologies are appropriately
considered, consistent with marine park zone objectives.
e c o n s e a r c h
DEWNR Far West Coast Marine Park Regional Impact Statement
Page: 64
The following types of special purpose area may be identified in accordance with section 13(1)(c) of the Marine Parks Act 2007. Notwithstanding the zoning of
the area, the following activities will be permitted in the special purpose areas.
Special Purpose Areas (significant economic development)
Activities comprising a development or project, or that part of a development or project, within the ambit of a declaration under section 46 of the Development
Act 1993; and
Activities comprising development approved under section 49 (Crown development and public infrastructure) or section 49A (Electricity infrastructure
development) of the Development Act 1993.
Special Purpose Areas (harbor activities)
Activities undertaken by or on behalf of the Minister responsible for the administration of the Harbors and Navigation Act 1993, or a port operator, for the
purposes of maintaining or improving a harbor or port. (Harbor, port and port operator have the same meanings as in the Harbors and Navigation Act 1993.)
Special Purpose Areas (submarine cables and pipelines)
Activities undertaken for the purposes of maintaining or improving submarine cables or pipelines comprising public infrastructure (within the meaning of section
49 of the Development Act 1993).
Special Purpose Areas (transhipment)
Activities comprising the establishment, maintenance or improvement of facilities for a transhipment point prescribed or to be prescribed under the Harbors and
Navigation Regulations 2009; and
Activities comprising or connected with loading or unloading a vessel at a transhipment point prescribed under the Harbors and Navigation Regulations 2009.
Special Purpose Areas (anchoring)
Activities comprising anchoring a commercial vessel (within the meaning of the Harbors and Navigation Act 1993) in an area recommended for that purpose by
way of a Notice to Mariners by the Minister responsible for the administration of the Harbors and Navigation Act 1993.
Special Purpose Areas (shore-based recreational line fishing)
Recreational fishing from the shore by use of a hand line or rod and line. (Hand line, recreational fishing and rod and line have the same respective meanings as
in the Fisheries Management Act 2007.)
Special Purpose Areas (Murray Mouth dredging)
Activities associated with dredging undertaken for the purposes of maintaining or improving water flows through the mouth of the River Murray.
Special Purpose Areas (Defence Prohibited Area)
Activities undertaken by the Department of Defence in relation to the Proof and Experimental Establishment (Port Wakefield).
Special Purpose Areas (Aquaculture)
Activities authorised under the Aquaculture Act 2001.
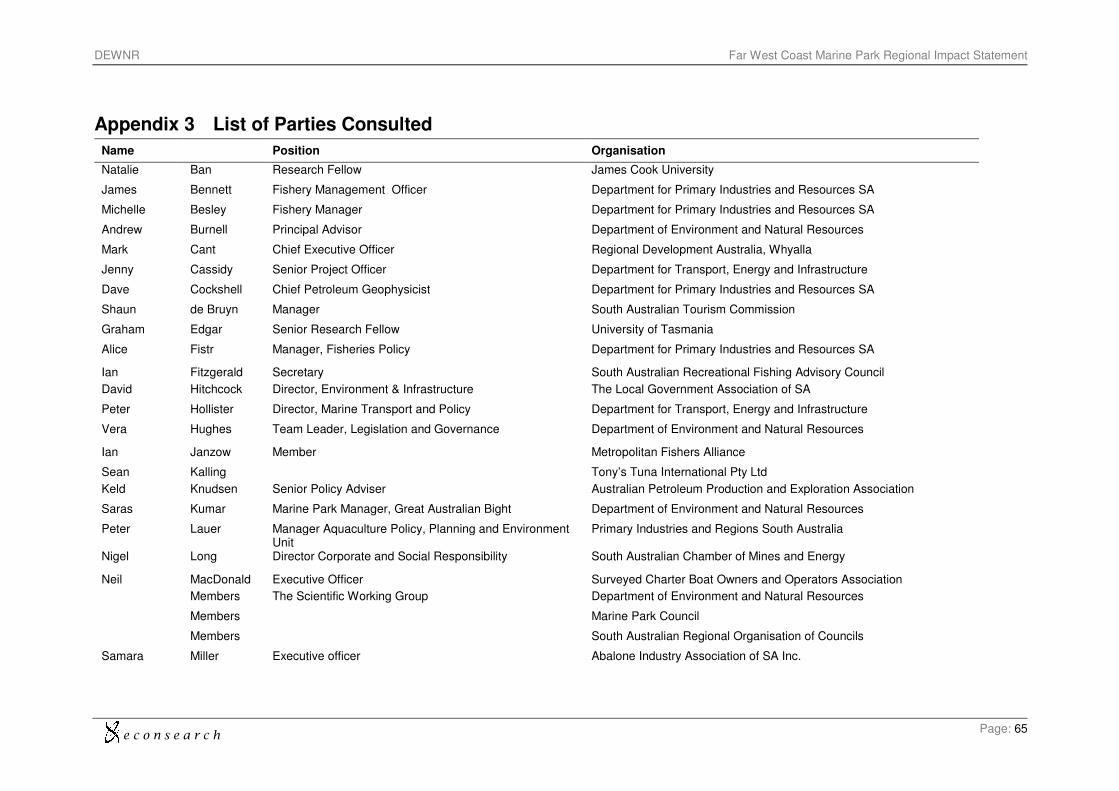
e c o n s e a r c h
DEWNR Far West Coast Marine Park Regional Impact Statement
Page: 65
Appendix 3 List of Parties Consulted
Name Position Organisation
Natalie Ban Research Fellow James Cook University
James Bennett Fishery Management Officer Department for Primary Industries and Resources SA
Michelle Besley Fishery Manager Department for Primary Industries and Resources SA
Andrew Burnell Principal Advisor Department of Environment and Natural Resources
Mark Cant Chief Executive Officer Regional Development Australia, Whyalla
Jenny Cassidy Senior Project Officer Department for Transport, Energy and Infrastructure
Dave Cockshell Chief Petroleum Geophysicist Department for Primary Industries and Resources SA
Shaun de Bruyn Manager South Australian Tourism Commission
Graham Edgar Senior Research Fellow University of Tasmania
Alice Fistr Manager, Fisheries Policy Department for Primary Industries and Resources SA
Ian Fitzgerald Secretary South Australian Recreational Fishing Advisory Council
David Hitchcock Director, Environment & Infrastructure The Local Government Association of SA
Peter Hollister Director, Marine Transport and Policy Department for Transport, Energy and Infrastructure
Vera Hughes Team Leader, Legislation and Governance Department of Environment and Natural Resources
Ian Janzow Member Metropolitan Fishers Alliance
Sean Kalling Tony’s Tuna International Pty Ltd
Keld Knudsen Senior Policy Adviser Australian Petroleum Production and Exploration Association
Saras Kumar Marine Park Manager, Great Australian Bight Department of Environment and Natural Resources
Peter Lauer Manager Aquaculture Policy, Planning and Environment Unit
Primary Industries and Regions South Australia
Nigel Long Director Corporate and Social Responsibility South Australian Chamber of Mines and Energy
Neil MacDonald Executive Officer Surveyed Charter Boat Owners and Operators Association
Members The Scientific Working Group Department of Environment and Natural Resources
Members Marine Park Council
Members South Australian Regional Organisation of Councils
Samara Miller Executive officer Abalone Industry Association of SA Inc.
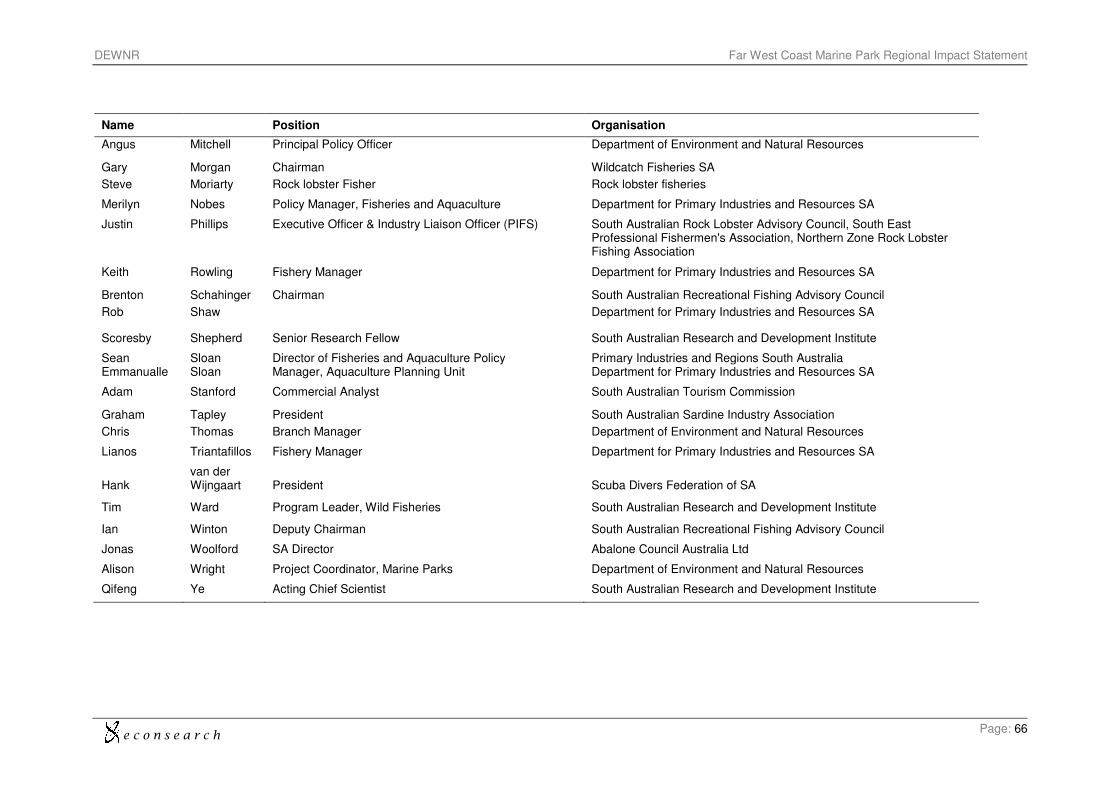
e c o n s e a r c h
DEWNR Far West Coast Marine Park Regional Impact Statement
Page: 66
Name Position Organisation
Angus Mitchell Principal Policy Officer Department of Environment and Natural Resources
Gary Morgan Chairman Wildcatch Fisheries SA
Steve Moriarty Rock lobster Fisher Rock lobster fisheries
Merilyn Nobes Policy Manager, Fisheries and Aquaculture Department for Primary Industries and Resources SA
Justin Phillips Executive Officer & Industry Liaison Officer (PIFS) South Australian Rock Lobster Advisory Council, South East Professional Fishermen's Association, Northern Zone Rock Lobster Fishing Association
Keith Rowling Fishery Manager Department for Primary Industries and Resources SA
Brenton Schahinger Chairman South Australian Recreational Fishing Advisory Council
Rob Shaw Department for Primary Industries and Resources SA
Scoresby Shepherd Senior Research Fellow South Australian Research and Development Institute
Sean Sloan Director of Fisheries and Aquaculture Policy Primary Industries and Regions South Australia Emmanualle Sloan Manager, Aquaculture Planning Unit Department for Primary Industries and Resources SA
Adam Stanford Commercial Analyst South Australian Tourism Commission
Graham Tapley President South Australian Sardine Industry Association
Chris Thomas Branch Manager Department of Environment and Natural Resources
Lianos Triantafillos Fishery Manager Department for Primary Industries and Resources SA
Hank van der Wijngaart President Scuba Divers Federation of SA
Tim Ward Program Leader, Wild Fisheries South Australian Research and Development Institute
Ian Winton Deputy Chairman South Australian Recreational Fishing Advisory Council
Jonas Woolford SA Director Abalone Council Australia Ltd
Alison Wright Project Coordinator, Marine Parks Department of Environment and Natural Resources
Qifeng Ye Acting Chief Scientist South Australian Research and Development Institute
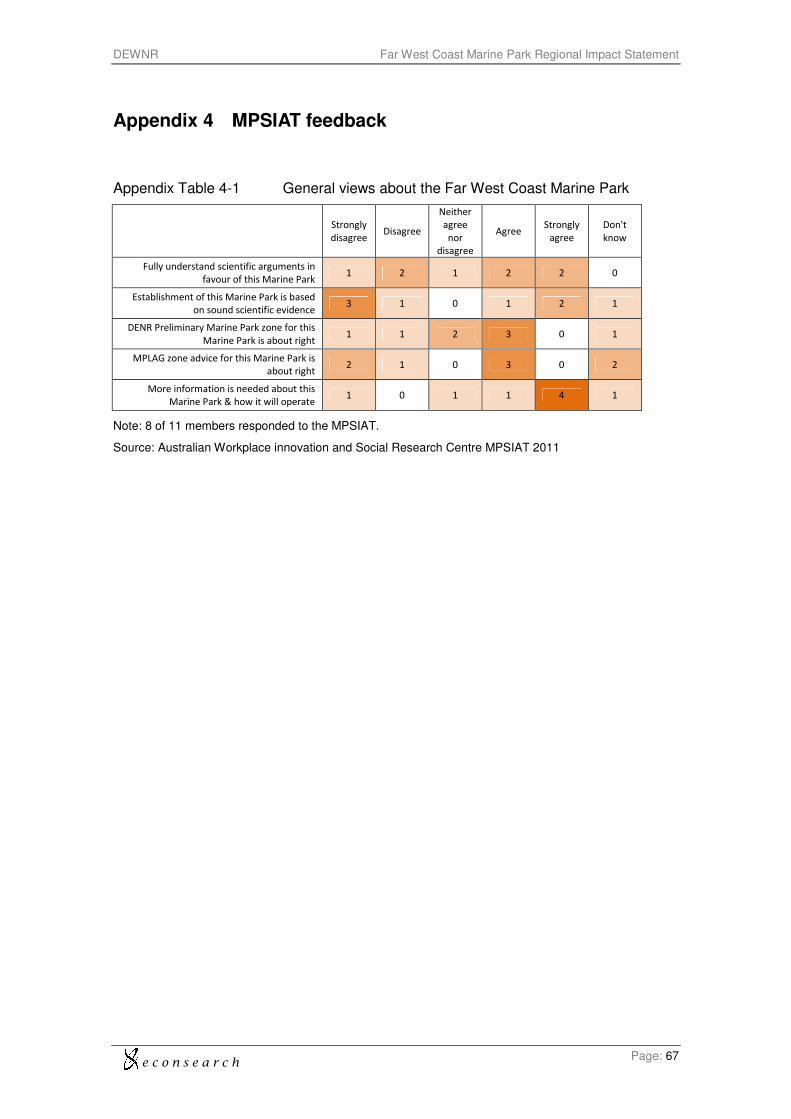
e c o n s e a r c h
DEWNR Far West Coast Marine Park Regional Impact Statement
Page: 67
Appendix 4 MPSIAT feedback
Appendix Table 4-1 General views about the Far West Coast Marine Park
Strongly
disagree Disagree
Neither
agree
nor
disagree
Agree Strongly
agree
Don't
know
Fully understand scientific arguments in
favour of this Marine Park 1 2 1 2 2 0
Establishment of this Marine Park is based
on sound scientific evidence 3 1 0 1 2 1
DENR Preliminary Marine Park zone for this
Marine Park is about right 1 1 2 3 0 1
MPLAG zone advice for this Marine Park is
about right 2 1 0 3 0 2
More information is needed about this
Marine Park & how it will operate 1 0 1 1 4 1
Note: 8 of 11 members responded to the MPSIAT.
Source: Australian Workplace innovation and Social Research Centre MPSIAT 2011
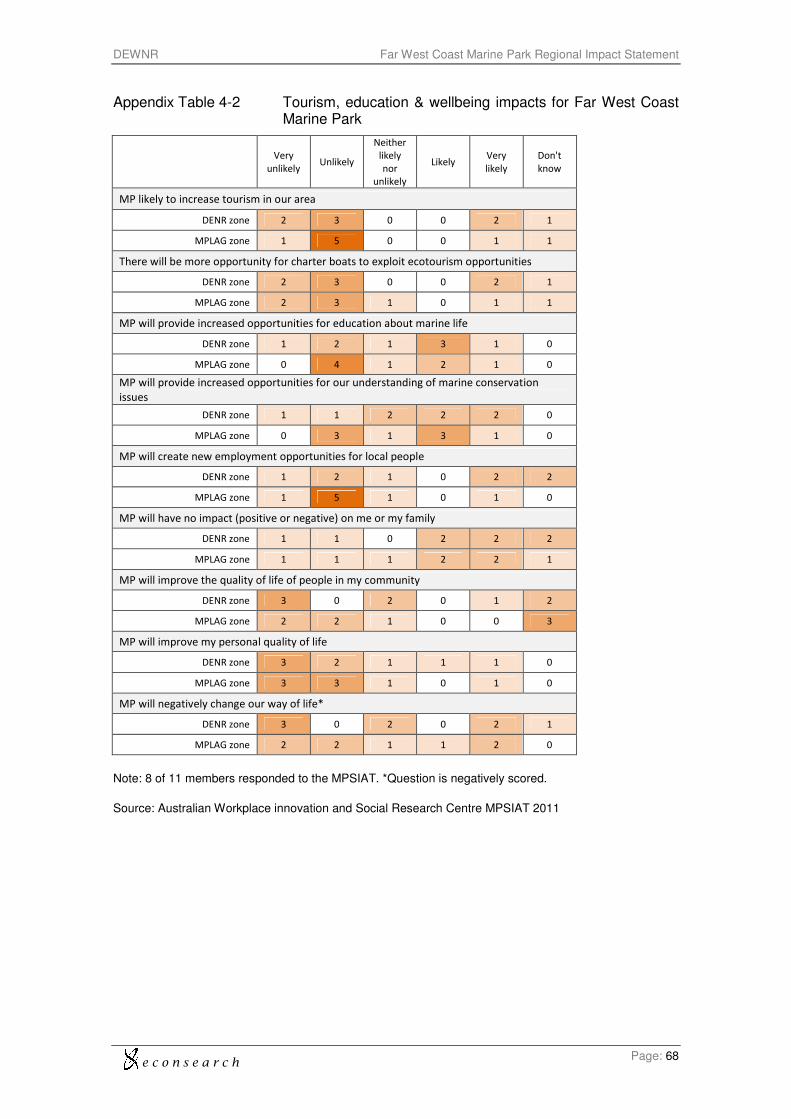
e c o n s e a r c h
DEWNR Far West Coast Marine Park Regional Impact Statement
Page: 68
Appendix Table 4-2 Tourism, education & wellbeing impacts for Far West Coast Marine Park
Very
unlikely Unlikely
Neither
likely
nor
unlikely
Likely Very
likely
Don't
know
MP likely to increase tourism in our area
DENR zone 2 3 0 0 2 1
MPLAG zone 1 5 0 0 1 1
There will be more opportunity for charter boats to exploit ecotourism opportunities
DENR zone 2 3 0 0 2 1
MPLAG zone 2 3 1 0 1 1
MP will provide increased opportunities for education about marine life
DENR zone 1 2 1 3 1 0
MPLAG zone 0 4 1 2 1 0
MP will provide increased opportunities for our understanding of marine conservation
issues
DENR zone 1 1 2 2 2 0
MPLAG zone 0 3 1 3 1 0
MP will create new employment opportunities for local people
DENR zone 1 2 1 0 2 2
MPLAG zone 1 5 1 0 1 0
MP will have no impact (positive or negative) on me or my family
DENR zone 1 1 0 2 2 2
MPLAG zone 1 1 1 2 2 1
MP will improve the quality of life of people in my community
DENR zone 3 0 2 0 1 2
MPLAG zone 2 2 1 0 0 3
MP will improve my personal quality of life
DENR zone 3 2 1 1 1 0
MPLAG zone 3 3 1 0 1 0
MP will negatively change our way of life*
DENR zone 3 0 2 0 2 1
MPLAG zone 2 2 1 1 2 0
Note: 8 of 11 members responded to the MPSIAT. *Question is negatively scored.
Source: Australian Workplace innovation and Social Research Centre MPSIAT 2011
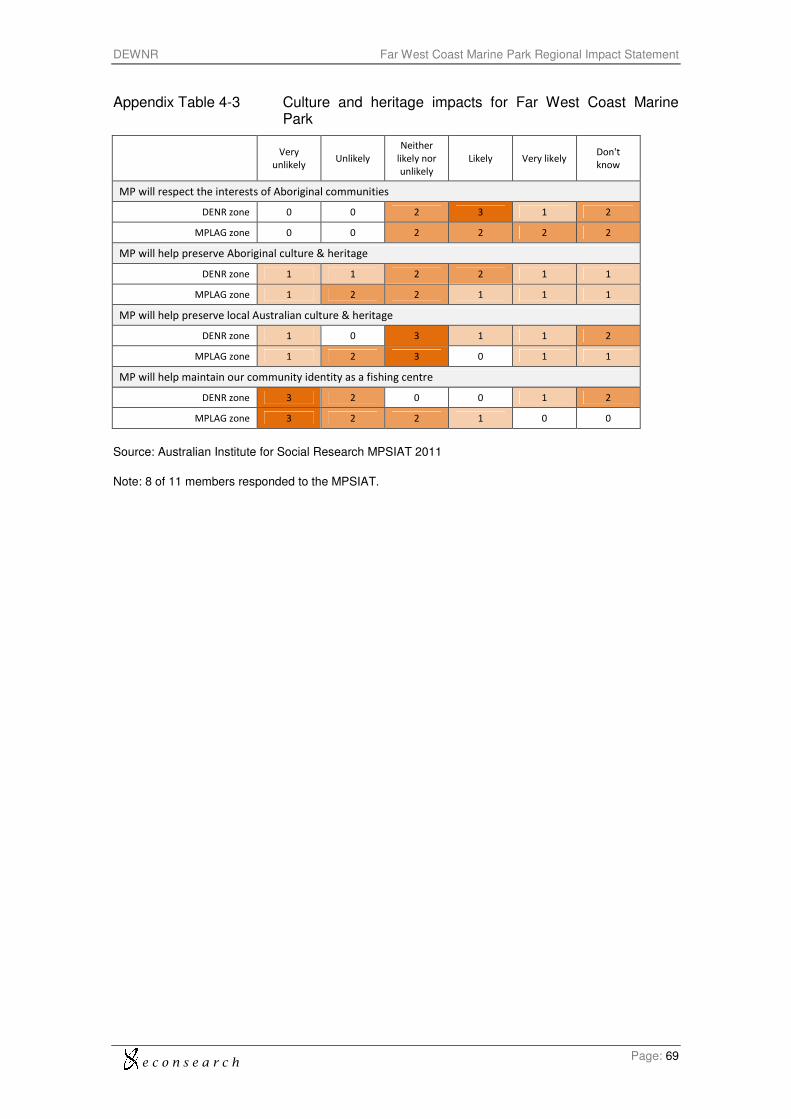
e c o n s e a r c h
DEWNR Far West Coast Marine Park Regional Impact Statement
Page: 69
Appendix Table 4-3 Culture and heritage impacts for Far West Coast Marine Park
Very
unlikely Unlikely
Neither
likely nor
unlikely
Likely Very likely Don't
know
MP will respect the interests of Aboriginal communities
DENR zone 0 0 2 3 1 2
MPLAG zone 0 0 2 2 2 2
MP will help preserve Aboriginal culture & heritage
DENR zone 1 1 2 2 1 1
MPLAG zone 1 2 2 1 1 1
MP will help preserve local Australian culture & heritage
DENR zone 1 0 3 1 1 2
MPLAG zone 1 2 3 0 1 1
MP will help maintain our community identity as a fishing centre
DENR zone 3 2 0 0 1 2
MPLAG zone 3 2 2 1 0 0
Source: Australian Institute for Social Research MPSIAT 2011
Note: 8 of 11 members responded to the MPSIAT.
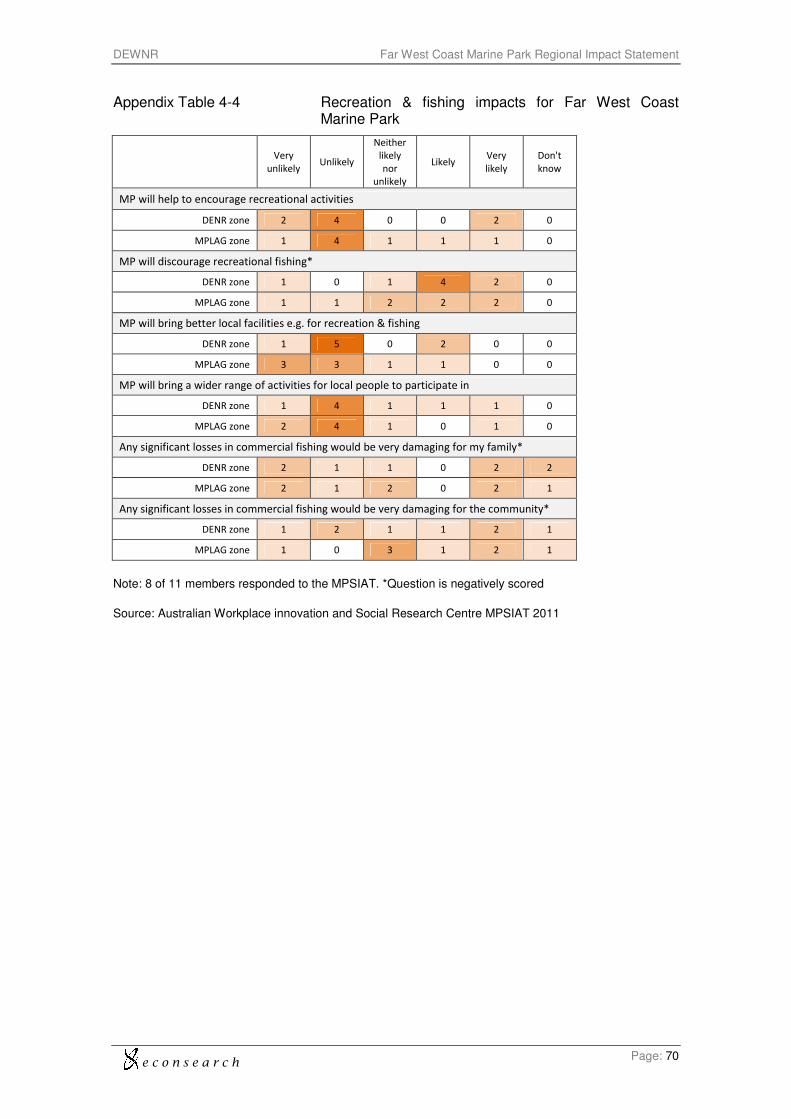
e c o n s e a r c h
DEWNR Far West Coast Marine Park Regional Impact Statement
Page: 70
Appendix Table 4-4 Recreation & fishing impacts for Far West Coast Marine Park
Very
unlikely Unlikely
Neither
likely
nor
unlikely
Likely Very
likely
Don't
know
MP will help to encourage recreational activities
DENR zone 2 4 0 0 2 0
MPLAG zone 1 4 1 1 1 0
MP will discourage recreational fishing*
DENR zone 1 0 1 4 2 0
MPLAG zone 1 1 2 2 2 0
MP will bring better local facilities e.g. for recreation & fishing
DENR zone 1 5 0 2 0 0
MPLAG zone 3 3 1 1 0 0
MP will bring a wider range of activities for local people to participate in
DENR zone 1 4 1 1 1 0
MPLAG zone 2 4 1 0 1 0
Any significant losses in commercial fishing would be very damaging for my family*
DENR zone 2 1 1 0 2 2
MPLAG zone 2 1 2 0 2 1
Any significant losses in commercial fishing would be very damaging for the community*
DENR zone 1 2 1 1 2 1
MPLAG zone 1 0 3 1 2 1
Note: 8 of 11 members responded to the MPSIAT. *Question is negatively scored
Source: Australian Workplace innovation and Social Research Centre MPSIAT 2011
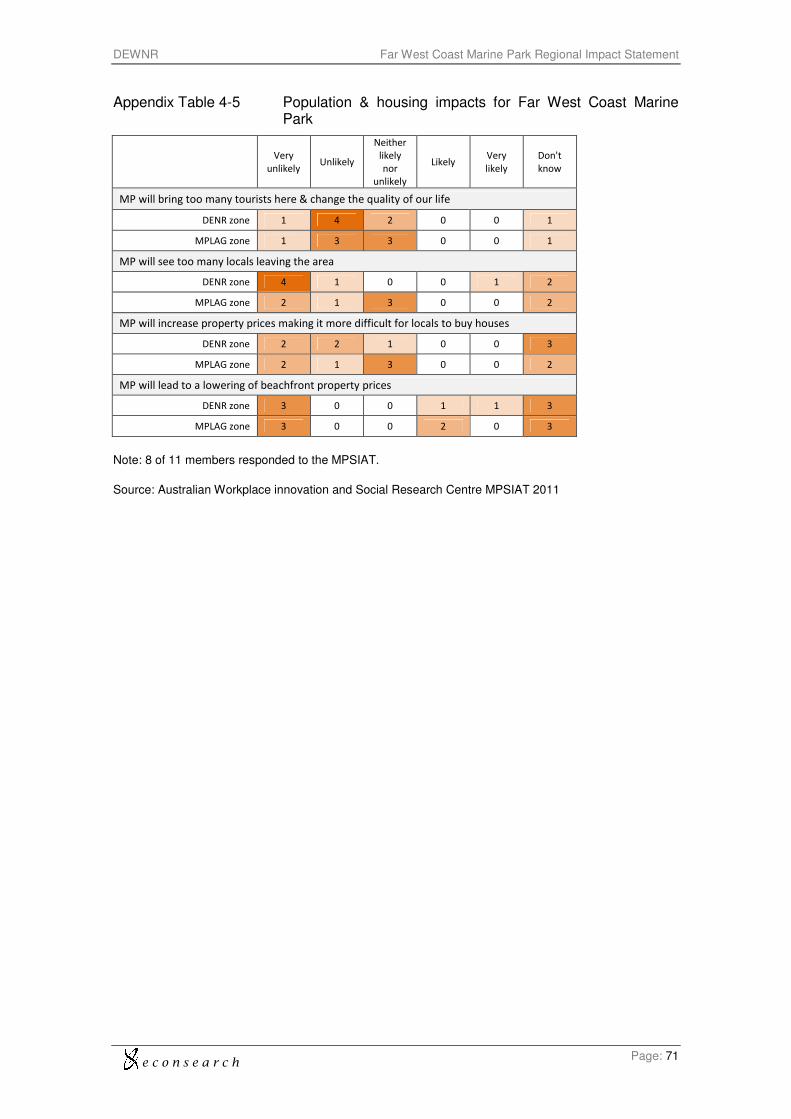
e c o n s e a r c h
DEWNR Far West Coast Marine Park Regional Impact Statement
Page: 71
Appendix Table 4-5 Population & housing impacts for Far West Coast Marine Park
Very
unlikely Unlikely
Neither
likely
nor
unlikely
Likely Very
likely
Don't
know
MP will bring too many tourists here & change the quality of our life
DENR zone 1 4 2 0 0 1
MPLAG zone 1 3 3 0 0 1
MP will see too many locals leaving the area
DENR zone 4 1 0 0 1 2
MPLAG zone 2 1 3 0 0 2
MP will increase property prices making it more difficult for locals to buy houses
DENR zone 2 2 1 0 0 3
MPLAG zone 2 1 3 0 0 2
MP will lead to a lowering of beachfront property prices
DENR zone 3 0 0 1 1 3
MPLAG zone 3 0 0 2 0 3
Note: 8 of 11 members responded to the MPSIAT.
Source: Australian Workplace innovation and Social Research Centre MPSIAT 2011
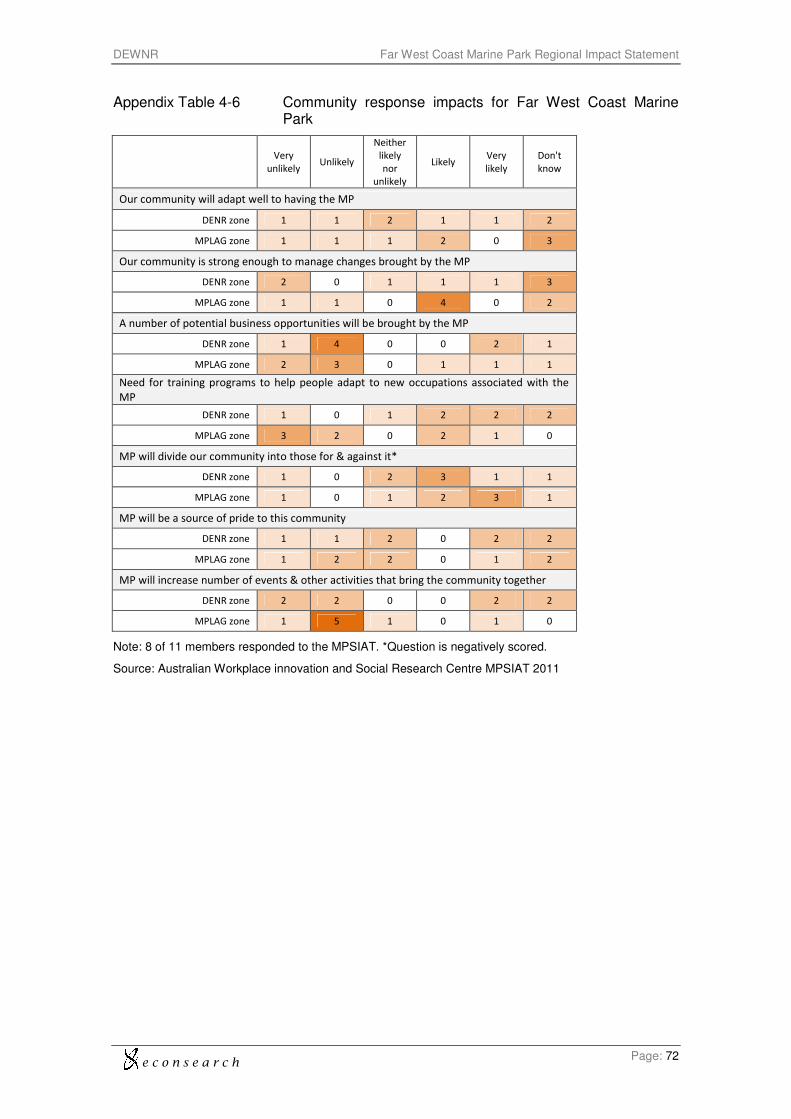
e c o n s e a r c h
DEWNR Far West Coast Marine Park Regional Impact Statement
Page: 72
Appendix Table 4-6 Community response impacts for Far West Coast Marine Park
Very
unlikely Unlikely
Neither
likely
nor
unlikely
Likely Very
likely
Don't
know
Our community will adapt well to having the MP
DENR zone 1 1 2 1 1 2
MPLAG zone 1 1 1 2 0 3
Our community is strong enough to manage changes brought by the MP
DENR zone 2 0 1 1 1 3
MPLAG zone 1 1 0 4 0 2
A number of potential business opportunities will be brought by the MP
DENR zone 1 4 0 0 2 1
MPLAG zone 2 3 0 1 1 1
Need for training programs to help people adapt to new occupations associated with the
MP
DENR zone 1 0 1 2 2 2
MPLAG zone 3 2 0 2 1 0
MP will divide our community into those for & against it*
DENR zone 1 0 2 3 1 1
MPLAG zone 1 0 1 2 3 1
MP will be a source of pride to this community
DENR zone 1 1 2 0 2 2
MPLAG zone 1 2 2 0 1 2
MP will increase number of events & other activities that bring the community together
DENR zone 2 2 0 0 2 2
MPLAG zone 1 5 1 0 1 0
Note: 8 of 11 members responded to the MPSIAT. *Question is negatively scored.
Source: Australian Workplace innovation and Social Research Centre MPSIAT 2011
e c o n s e a r c h
DEWNR Far West Coast Marine Park Regional Impact Statement
Page: 73
Appendix 5 Map of Marine Park Showing Draft Zoning
Appendix Figure 5-1 Map of Marine Park Showing Draft Zoning
See next page.