FAN BEAM OPTICAL TOMOGRAPHY MAZIDAH BINTI...
26
FAN BEAM OPTICAL TOMOGRAPHY MAZIDAH BINTI TAJJUDIN A project report submitted in partial fulfillment of the requirements for the award of the degree of Master of Engineering (Electrical – Mechatronic & Automatic Control) Faculty of Electrical Engineering Universiti Teknologi Malaysia NOVEMBER, 2005
Transcript of FAN BEAM OPTICAL TOMOGRAPHY MAZIDAH BINTI...
FAN BEAM OPTICAL TOMOGRAPHY
MAZIDAH BINTI TAJJUDIN
A project report submitted in partial fulfillment of the
requirements for the award of the degree of
Master of Engineering (Electrical – Mechatronic & Automatic Control)
Faculty of Electrical Engineering
Universiti Teknologi Malaysia
NOVEMBER, 2005

iii
In the name of Allah, Most Gracious, Most Merciful.
To my beloved and supportive husband,
my kids; Ihsan and Irfan.

iv
ACKNOWLEDGEMENT
I would like to express my deepest gratitude to my supervisor Prof. Dr.
Ruzairi Abdul Rahim for his outstanding support and excellent supervision. This
project would not been successful without his invaluable guidance, enthusiastic help
as well as constructive criticisms throughout the project.
Special thanks to my beloved husband, Mohd Hezri for providing me
numerous constructive ideas. Also, thanks to my friends and those whom had helped
me in one way or other during my work.
v
ABSTRACT
The project describes the development of a fan beam optical tomography
which applied infra red sources as the sensing element. The number of sensors used
in the project is very limited and that gave a significant impact on the results
obtained. However, the approach of the project is concentrated on the investigation
of the performance and limitations of applying infra red sensors in process
tomography. Numerous optical sources had been utilized based on the fact that it is
the simplest method available up till now. The advantage of infra red sources
compared to other optical sources was also discussed. The importance of identifying
the sensor characteristics is crucial to make sure that it is the optimum instrument for
our system. This report laid some important criteria that need to be considered upon
applying infrared tomography system. The developed system used four pairs of infra
red sensors to interrogate a pipe having a diameter of 50 mm. The image
reconstruction algorithm was built based on the Linear Back Projection Algorithm.
Several experiments had been carried out to evaluate the results. The results obtained
were analyzed individually and concluded at the end of the report. Some suggestions
were drawn which can be considered in order to improve the system performance.
vi
ABSTRAK
Projek ini adalah bertujuan mendirikan satu sistem tomografi yang
mengaplikasikan teknik ‘fan-beam’ dengan menggunakan sumber cahaya infra
merah sebagai penderia. Bilangan penderia yang digunakan dalam projek ini agak
terhad di mana faktor ini akan mengurangkan ketepatan bagi keputusan yang
diperolehi. Walaubagaimanapun, projek ini memberi penekanan terhadap analisa
bagi kelebihan dan kekurangan yang terdapat pada sistem tomografi yang
menggunakan sumber cahaya infra merah ini. Pelbagai jenis sumber cahaya telah
digunakan dalam projek-projek yang telah dibangunkan sebelum ini. Oleh itu, adalah
dirasakan perlu untuk mengetahui apakah kelebihan atau kekurangan cahaya merah
berbanding sumber-sumber cahaya yang lain. Ini bagi memastikan pemilihan
penderia yang akan digunakan adalah bersesuaian dengan sistem tersebut. Laporan
ini turut menggariskan beberapa criteria yang dirasakan perlu diberi perhatian ketika
menggunakan sistem tomografi cahaya infr merah. Sistem ini menggunakan empat
pasang penderia infra merah bagi mendapatkan data untuk paip dengan diameter
sepanjang 50 mm. Imej objek tersebut dibangunkan menggunakan ‘Linear Back
Projection Algorithm’. Beberapa ujikaji telah dilaksanakan bagi mengenalpasti tahap
keputusan yang diperolehi melalui sistem yang telah dibangunkan. Setiap keputusan
telah dianalisa dan kesimpulan telah dibuat berdasarkan keputusan tersebut.
Cadangan-cadangan yang dirasakan dapat membantu dalam penambahbaikan sistem
tersebut turut diberikan.
vii
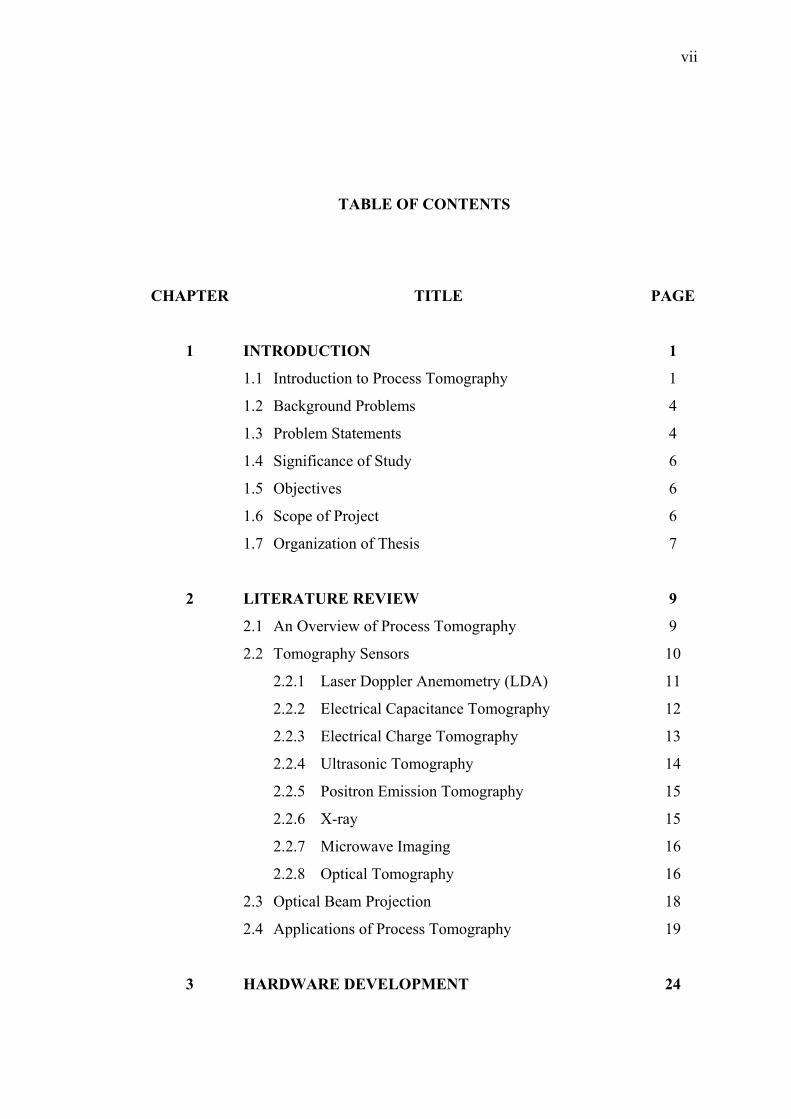
TABLE OF CONTENTS
CHAPTER TITLE PAGE
1 INTRODUCTION 1
1.1 Introduction to Process Tomography 1
1.2 Background Problems 4
1.3 Problem Statements 4
1.4 Significance of Study 6
1.5 Objectives 6
1.6 Scope of Project 6
1.7 Organization of Thesis 7
2 LITERATURE REVIEW 9
2.1 An Overview of Process Tomography 9
2.2 Tomography Sensors 10
2.2.1 Laser Doppler Anemometry (LDA) 11
2.2.2 Electrical Capacitance Tomography 12
2.2.3 Electrical Charge Tomography 13
2.2.4 Ultrasonic Tomography 14
2.2.5 Positron Emission Tomography 15
2.2.6 X-ray 15
2.2.7 Microwave Imaging 16
2.2.8 Optical Tomography 16
2.3 Optical Beam Projection 18
2.4 Applications of Process Tomography 19
3 HARDWARE DEVELOPMENT 24

viii
3.1 Introduction 24
3.2 Pipe Design 24
3.3 Selection of Optical Sensor 29
3.4 Emitter Driver Circuit 32
4 SOFTWARE DEVELOPMENT 35
4.1 Introduction 35
4.2 Linear Back Projection 35
4.3 Process Model 36
4.4 Sensitivity Matrix 41
4.5 Programming Structure 51
4.5.1 Data Acquisition System 53
4.5.2 Color Scheme 54
5 RESULTS AND DISCUSSIONS 56
5.1 Introduction 56
5.2 Experiment to Evaluate IR Light Reflection Effect 56
5.3 Experiment of IR Penetration Limit 58
5.4 Experiment to Investigate the Effect of Lighting 59
5.5 Experiment to Obtain Offline Data 59
5.6 Concentration Profile from the Offline Data 61
5.6.1 Concentration Profile During No-flow Condition 62
5.6.2 Concentration Profile During Full-flow
Condition
64
5.6.3 Concentration Profile During Half-flow
Condition
65
5.6.4 Concentration Profile During Three-Quarter-
flow Condition
66
5.6.5 Concentration Profile During Quarter-flow
Condition
67
5.6.6 Concentration Profile During Single Object
Flow
68
5.6.7 Concentration Profile During Two Objects Flow 69

ix
5.6.8 Concentration Profile for 30 mm Object Flow 70
5.6.9 Concentration Profile for 2.5 mm Object Flow 72
6 CONCLUSION AND FUTURE RECOMMENDATION 74
6.1 Conclusions 74
6.2 Suggestions for Future Works 75
REFERENCES 77
APPENDICES 80
x
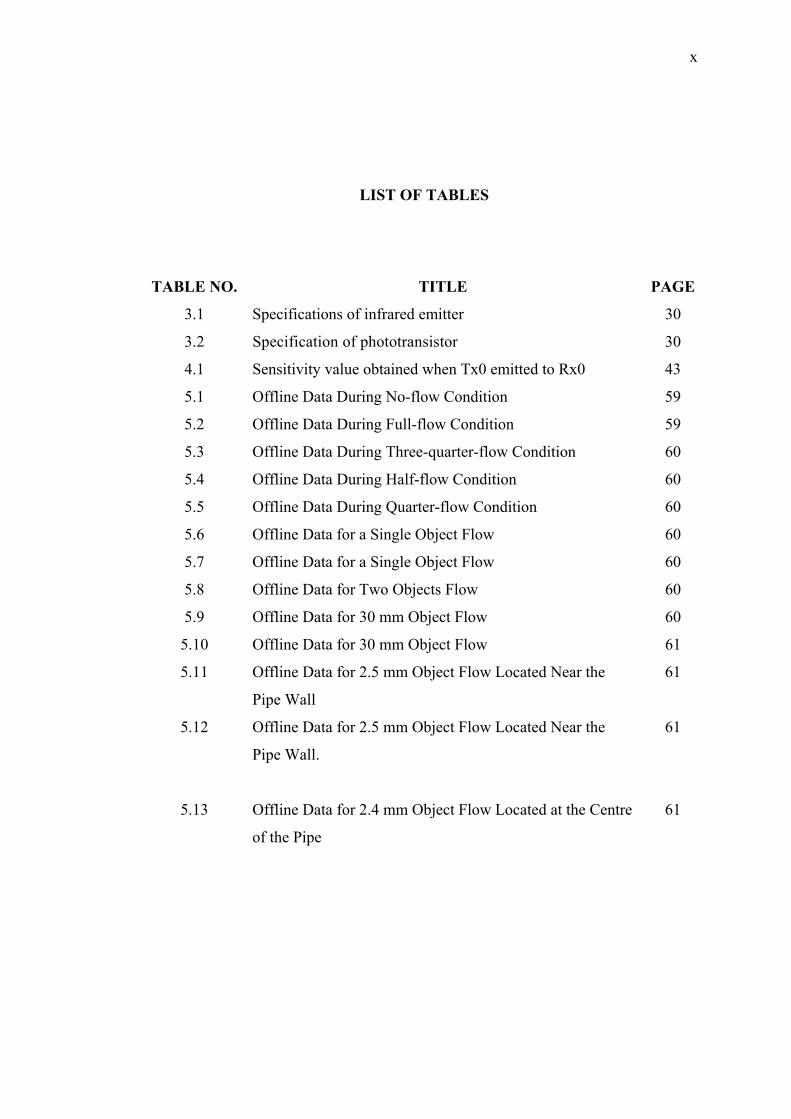
LIST OF TABLES
TABLE NO. TITLE PAGE
3.1 Specifications of infrared emitter 30
3.2 Specification of phototransistor 30
4.1 Sensitivity value obtained when Tx0 emitted to Rx0 43
5.1 Offline Data During No-flow Condition 59
5.2 Offline Data During Full-flow Condition 59
5.3 Offline Data During Three-quarter-flow Condition 60
5.4 Offline Data During Half-flow Condition 60
5.5 Offline Data During Quarter-flow Condition 60
5.6 Offline Data for a Single Object Flow 60
5.7 Offline Data for a Single Object Flow 60
5.8 Offline Data for Two Objects Flow 60
5.9 Offline Data for 30 mm Object Flow 60
5.10 Offline Data for 30 mm Object Flow 61
5.11 Offline Data for 2.5 mm Object Flow Located Near the
Pipe Wall
61
5.12 Offline Data for 2.5 mm Object Flow Located Near the
Pipe Wall.
61
5.13 Offline Data for 2.4 mm Object Flow Located at the Centre
of the Pipe
61
xi
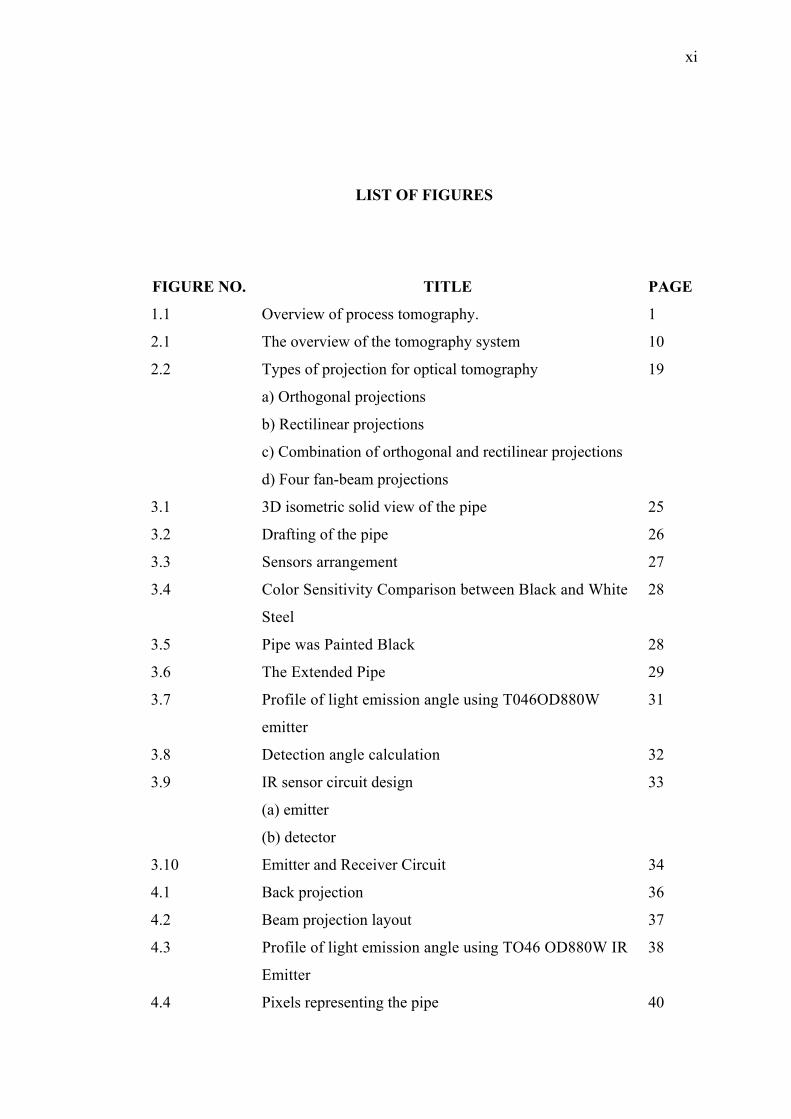
LIST OF FIGURES
FIGURE NO. TITLE PAGE
1.1 Overview of process tomography. 1
2.1 The overview of the tomography system 10
2.2 Types of projection for optical tomography
a) Orthogonal projections
b) Rectilinear projections
c) Combination of orthogonal and rectilinear projections
d) Four fan-beam projections
19
3.1 3D isometric solid view of the pipe 25
3.2 Drafting of the pipe 26
3.3 Sensors arrangement 27
3.4 Color Sensitivity Comparison between Black and White
Steel
28
3.5 Pipe was Painted Black 28
3.6 The Extended Pipe 29
3.7 Profile of light emission angle using T046OD880W
emitter
31
3.8 Detection angle calculation 32
3.9 IR sensor circuit design
(a) emitter
(b) detector
33
3.10 Emitter and Receiver Circuit 34
4.1 Back projection 36
4.2 Beam projection layout 37
4.3 Profile of light emission angle using TO46 OD880W IR
Emitter
38
4.4 Pixels representing the pipe 40
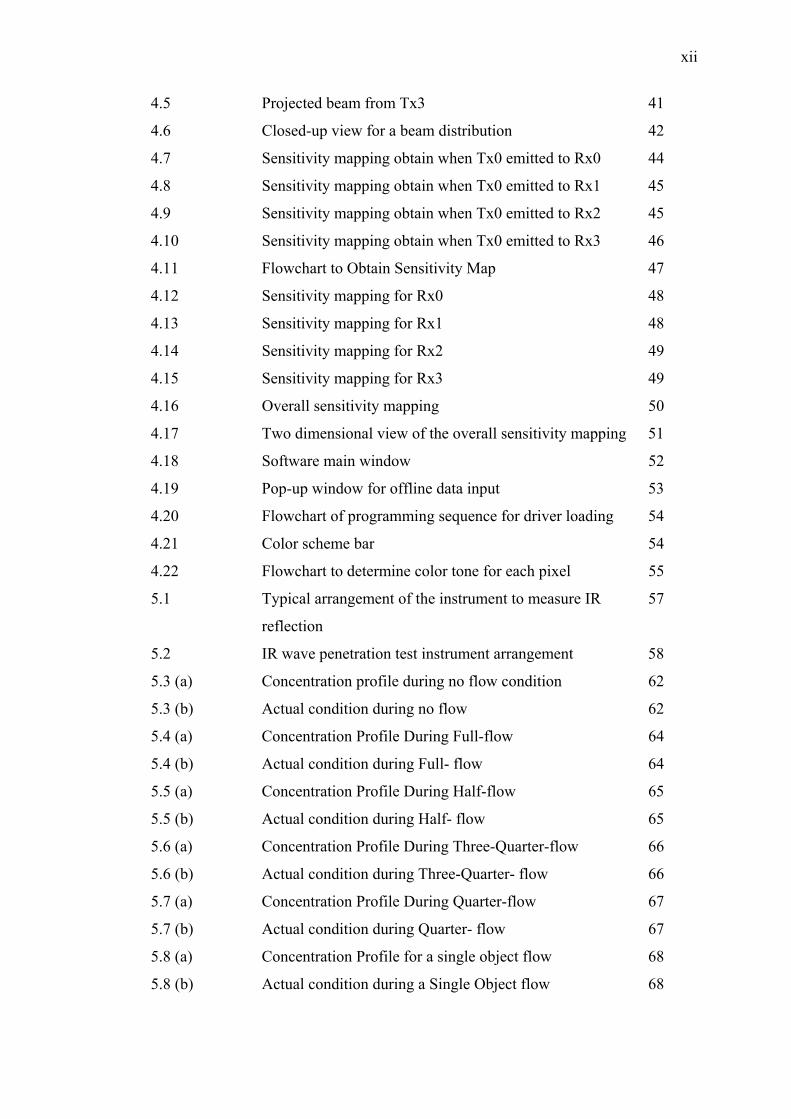
xii
4.5 Projected beam from Tx3 41
4.6 Closed-up view for a beam distribution 42
4.7 Sensitivity mapping obtain when Tx0 emitted to Rx0 44
4.8 Sensitivity mapping obtain when Tx0 emitted to Rx1 45
4.9 Sensitivity mapping obtain when Tx0 emitted to Rx2 45
4.10 Sensitivity mapping obtain when Tx0 emitted to Rx3 46
4.11 Flowchart to Obtain Sensitivity Map 47
4.12 Sensitivity mapping for Rx0 48
4.13 Sensitivity mapping for Rx1 48
4.14 Sensitivity mapping for Rx2 49
4.15 Sensitivity mapping for Rx3 49
4.16 Overall sensitivity mapping 50
4.17 Two dimensional view of the overall sensitivity mapping 51
4.18 Software main window 52
4.19 Pop-up window for offline data input 53
4.20 Flowchart of programming sequence for driver loading 54
4.21 Color scheme bar 54
4.22 Flowchart to determine color tone for each pixel 55
5.1 Typical arrangement of the instrument to measure IR
reflection
57
5.2 IR wave penetration test instrument arrangement 58
5.3 (a) Concentration profile during no flow condition 62
5.3 (b) Actual condition during no flow 62
5.4 (a) Concentration Profile During Full-flow 64
5.4 (b) Actual condition during Full- flow 64
5.5 (a) Concentration Profile During Half-flow 65
5.5 (b) Actual condition during Half- flow 65
5.6 (a) Concentration Profile During Three-Quarter-flow 66
5.6 (b) Actual condition during Three-Quarter- flow 66
5.7 (a) Concentration Profile During Quarter-flow 67
5.7 (b) Actual condition during Quarter- flow 67
5.8 (a) Concentration Profile for a single object flow 68
5.8 (b) Actual condition during a Single Object flow 68

xiii
5.9 (a) Concentration Profile for a single object flow at a
different location
68
5.9 (b) Actual condition during a Single Object flow at a
different location
68
5.10 (a) Concentration Profile for Two Objects Flow 69
5.10 (b) Actual condition during Two Objects Flow 69
5.11 (a) Concentration Profile for 30 mm Object Flow 70
5.11 (b) Actual condition for 30 mm Object Flow 70
5.12 (a) Concentration Profile for 30 mm Object Flow 71
5.12 (b) Actual condition for 30 mm Object Flow 71
5.13 (a) Concentration Profile for 30 mm Object Flow 71
5.13 (b) Actual condition for 30 mm Object Flow 71
5.14 (a) Concentration Profile for 2.5 mm Object Flow 72
5.14 (b) Actual condition for 2.5 mm Object Flow 72
5.15 (a) Concentration Profile for 2.5 mm Object Flow at different
location
73
5.15 (b) Actual condition for 2.5 mm Object Flow at different
location
73
xiv
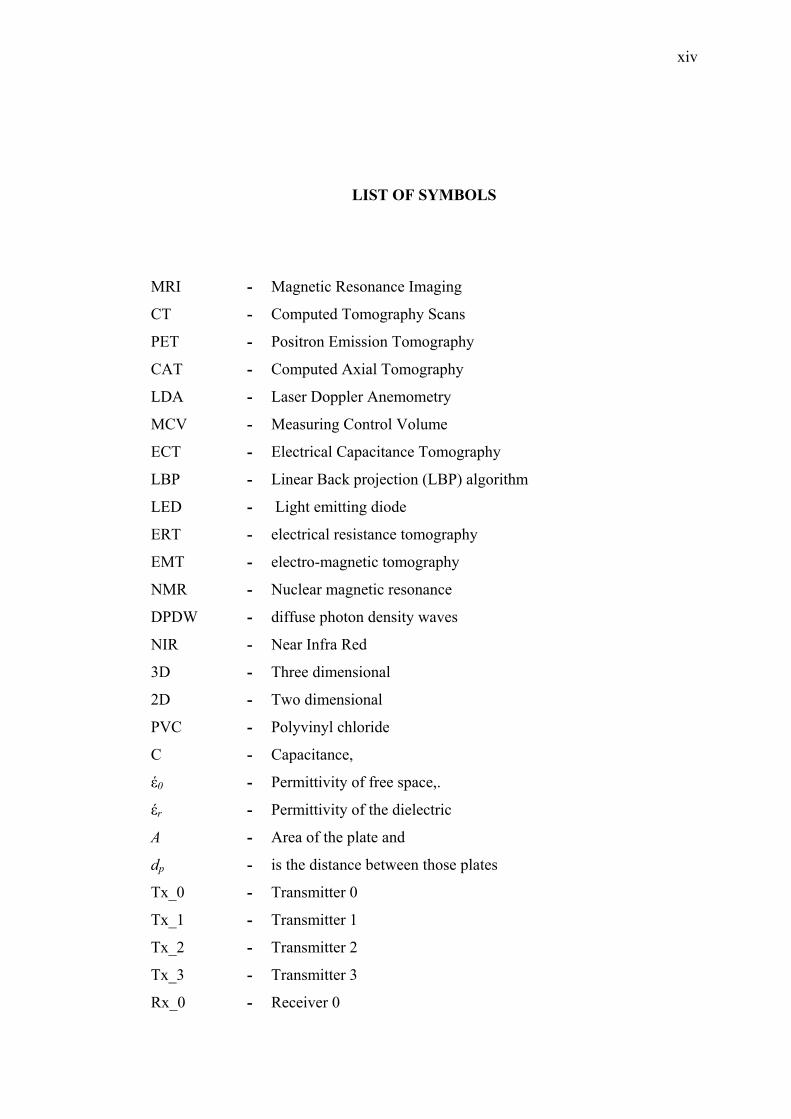
LIST OF SYMBOLS
MRI - Magnetic Resonance Imaging
CT - Computed Tomography Scans
PET - Positron Emission Tomography
CAT - Computed Axial Tomography
LDA - Laser Doppler Anemometry
MCV - Measuring Control Volume
ECT - Electrical Capacitance Tomography
LBP - Linear Back projection (LBP) algorithm
LED - Light emitting diode
ERT - electrical resistance tomography
EMT - electro-magnetic tomography
NMR - Nuclear magnetic resonance
DPDW - diffuse photon density waves
NIR - Near Infra Red
3D - Three dimensional
2D - Two dimensional
PVC - Polyvinyl chloride
C - Capacitance,
έ0 - Permittivity of free space,.
έr - Permittivity of the dielectric
A - Area of the plate and
dp - is the distance between those plates
Tx_0 - Transmitter 0
Tx_1 - Transmitter 1
Tx_2 - Transmitter 2
Tx_3 - Transmitter 3
Rx_0 - Receiver 0

xv
Rx_1 - Receiver 1
Rx_2 - Receiver 2
Rx_3 - Receiver 3
VCC - Voltage supply
Vf - Voltage across LED
I - Current
P - Power

xvi
LIST OF APPENDICES
APPENDIX TITLE PAGE
A 32 x 32 pixels Sensitivity Map for 16 Views 80
B 32 x 32 pixels Weight Balanced map for 16 Views 91
CHAPTER 1
INTRODUCTION
1.1 Introduction to Process Tomography
The word “tomography” is derived from Greek language, “Tomo” means
cutting section and “Graph” means picture. Tomography is a field of
interdisciplinary that is concerned with obtaining cross-sectional images of an object.
Therefore, the tomography process can be defined as a process of obtaining plane
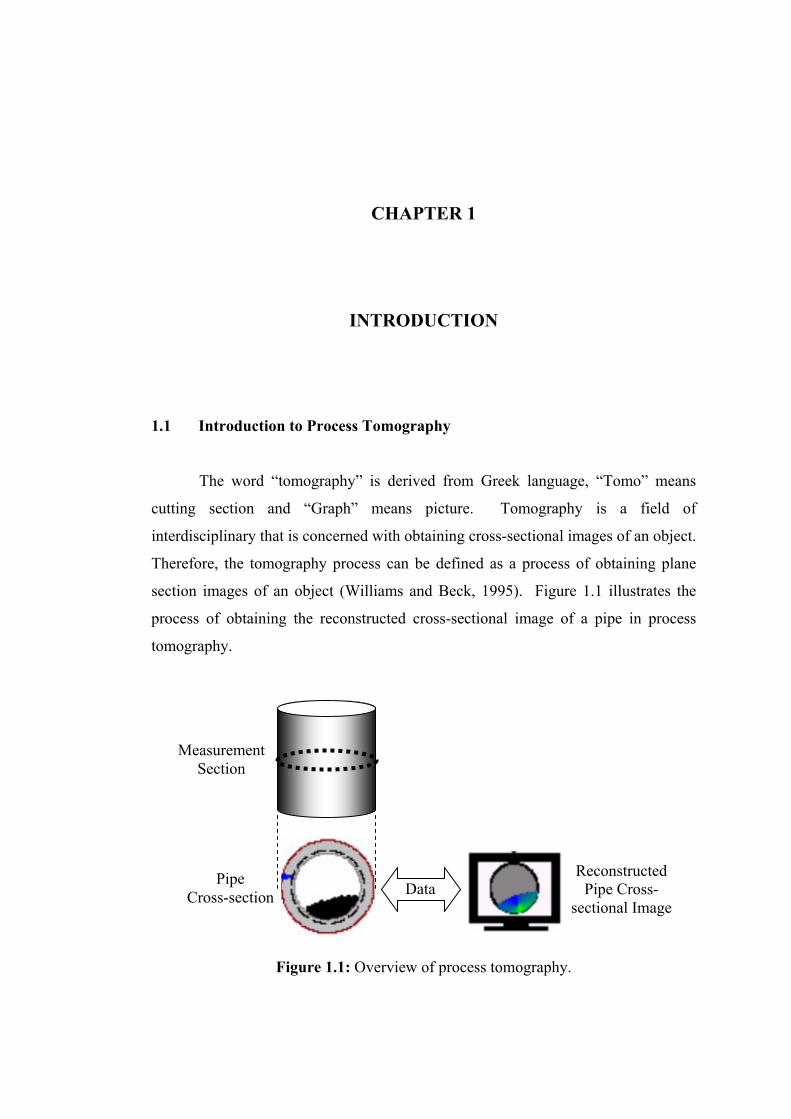
section images of an object (Williams and Beck, 1995). Figure 1.1 illustrates the
process of obtaining the reconstructed cross-sectional image of a pipe in process
tomography.
Figure 1.1: Overview of process tomography.
Measurement Section
Pipe Cross-section
Reconstructed Pipe Cross-
sectional ImageData

2
Process tomography had been widely used in the medical field. The
important factor featured by this process is the ability of unraveling the complexities
of a structure without invading the object. Furthermore, this method is able to
explore the spatial distribution of the contents of a process vessel in an intrinsically
safe manner and non-invasively (Sallehuddin et. al, 2000). Due to that fact,
numerous sophisticated medical equipments were designed by applying this method
such as Magnetic Resonance Imaging (MRI), Computed Tomography Scans (CT)
and Positron Emission Tomography (PET). These equipments are very expensive
due to the application of sensors that are capable of producing high-resolution image
with high accuracy.
The tomography was first applied in industrial field in the middle of 1980’s.
The tomography system can increase the productivity and the efficiency of a process
that uses material transportation through pipes such as in oil industry. Pipes flow
visualization is often to be the first step in experimental analysis in order to improve
the pipe flows and performs the process control. This makes the tomographic
measurement becomes more important in industrial process nowadays (Williams and
Beck, 1995).
A full understanding of process behavior requires knowledge of the direction
of material movement as well as its distribution. The ability to interrogate the
dynamic internal characteristics of a process plant by using conventional
instrumentation is severely limited for most practical conditions (S. Ibrahim et al.,
2000). Tomography provides several real-time methods of obtaining the cross-
section of a process to obtain information relating the material distribution. This
involves taking numerous measurements from sensors placed around the section of
the process being investigated and processing the data to reconstruct an image.
Tomography can be used to provide feedback information on the process for the
objectives of process control.
Optical tomography is an attractive method since it may prove to be less
expensive, have a better dynamic response, and more portable for routine use in
3
process plant than other radiation-based tomographic methods such as positron
emission, nuclear magnetic resonance, gamma photon emission and x-ray
tomography. Its performance is also independent of temperature, pressure and
viscosity of fluid (S. Ibrahim et al., 2000).
A simple tomography system can be built by mounting a number of sensors
around the circumference of a vertical pipe or horizontal pipe. Multiple projections
are used to obtain sets of data from various views across the process vessel. These
data are used to provide tomographic images representing the contents of the
pipeline or vessel.
The output signal from the sensors will be sent to the computer via an
interfacing system. The computer will receive the signal from the respective sensors
to perform data processing and finally construct a cross-section flow image in the
pipe through image reconstruction algorithms. The tomographic imaging of objects
provides an opportunity to unravel the complexities of structure without invading the
object (Dyakowski, 1995).
With further analysis, the same signal can be used to determine the
concentration, velocity and mass-flow rate profile of the flows over a wide range of
flow regimes by providing better averaging in time and space through multi-
projections of the same observation. Tomography will provide an increase in the
quantity and quality of information when compared to many earlier measurement
techniques (Abdul Rahim, 1996).
Process tomography is a technique still in its infancy, but it has the potential
for enabling great improvements in efficiency and safety in process industries, while
minimizing waste and pollution in a range of applications. It can be used to obtain
both qualitative and quantitative data needed in modeling a multi-fluid flow system.
4
1.2 Background Problems
The main objective of this project is to develop an infrared optical
tomography system which is able to capture cross-sectional image of solid flow
inside the pipeline. Several researches had been carried out to investigate the
performance of optical process tomography in obtaining the data from the process
pipeline. The accuracy of the image obtained is dependant on the number of sensors
used and the projection technique applied. Parallel beam projection technique
produced limited number of data obtained and may had a problem with beam
convergence and aliasing effect. A research conducted by Soh in 2000 had proved
that such problems may be minimized with the application of fan-beam projection
technique. The technique will produced a significant number of data and this will
improve the accuracy of the image obtained (R. Abdul Rahim et al., 2004b)
Regarding the optical sources used in the measurement, numerous researches
had been carried out to investigate the feasibility of using visible light source in
many projection techniques. Unfortunately, the application of the previous
mentioned light sources are very limited. For example, the application for
measuring the opaque liquid tends to give erroneous result due to the flow residue
that will block the beam. Even though the residue is in form of thin film, it is
sufficient to block any visible light from being transmitted. To solve this problem,
the infrared light source is preferable. It overcomes the above mentioned limitation.
1.3 Problem Statements
Optical tomography involves projecting a light beam through some medium
from one boundary point and detecting the level of light received at another
boundary point (Ruzairi, 1995). This procedure provides information from which a
profile of the flow can be gained. In practice, several projection views are required
to minimize aliasing effect that occurs when two particles intercept the same view
(Saeed, 1988).
5
The optical sensor emission implemented with switch mode fan beam
projection is a new investigation in process tomography. The first implementation of
switching principle with optical sensors for tomography research had been carried
out by Dugdale in year 1992 in parallel beam optical tomography projection (Ruzairi,
2004b). The research has followed by Soh in 2000 to investigate the divergence
effect of optical beam to an array of optical receivers. The initial stage of her
research has shown that with switching principle implemented with two pair of
optical sensors, four independent measurements obtained. The fan beam projection
has proved to provide higher efficiency of measurements from the same number of
optical sensors compared to parallel beam projection system. ‘Fan beam’ is a term
used when a series of angular projections of the light sources and detectors are
applied to interrogate the measurement section.
This project will utilize a switch-mode fan-beam projection technique which
consists of 4 pairs of infrared optical sensors. There are several factors that must be
considered during the project implementation such as:
i) To develop a process tomography system that is applicable to perform a fan-
beam projection, the suitable sensor should be selected considering on the
wavelength of the emitter-receiver pair and the projection angle of the emitter.
The emitter should be able to project a light beam to every receiver during
data acquisition process.
ii) Since infrared wavelength possessed high electromagnetic energy, several
experiments will be conducted to investigate the effect of the infrared beam
to the sensing system itself such as the reflection effect and the penetration
limit. Further experiments will be performed to investigate the effect of the
surrounding towards the system performance such as the effect of the
infrared signal that is emitted by other objects.
6
1.4 Significance of Study
1) Numerous researches had been carried out to investigate the interior
condition and changes of the substances being conveyed inside the pipeline
or process vessels. In this project, a non-invasive instrument to perform real-
time image reconstruction process has been realized.
2) There are several numbers of researches had been carried out on optical
process tomography. This project utilized infrared beam as a sensing system
for a pipeline having a diameter of 50 mm. The response of infrared
tomography system has been identified.
1.5 Objectives
1) To obtain an online concentration profile of solid particles conveying in a
pipeline.
2) To apply the switch mode fan beam projection technique in order to increase
the optical sensor ability in imaging the solid conveying system.
3) To investigate the response of employing infrared sensors in optical process
tomography.
1.6 Scope of project
1) To construct a small-scale flow rig consists of a pipeline with a diameter of
50mm for system evaluation.
2) To build an image reconstruction algorithm in order to display the
concentration profile of the solid particles in a pipe.
3) To develop an application program to display the concentration profile of the
solid.
7
4) To interface between the hardware and software to realize the real-time
application.
1.7 Organization of the Thesis
Chapter 1 introduces the process tomography. Background problems,
problem statements, importance of the study, research objectives and scope of the
study are presented here.
Chapter 2 mainly discusses the literature review that is related to this
research. It consists of the introduction to process tomography, the significance of
developing the system and some historical review about the evolvement of the
process. Typical sensors used in process tomography are also discussed. The chapter
content is basically give prior attention to the optical tomography system. Readers
are presented with the techniques previously applied and some techniques that are
still at ongoing research. The application of process tomography is very rare in our
country but yet it has been applied to several applications elsewhere. In this chapter,
some examples of the application were reviewed to provide the readers with some
knowledge of applied tomography.
Chapter 3 discusses on the hardware development process where the criteria
of the sensors are presented. This chapter also gives an explanation about the
development process started from drafting to the precautions taken in order to
minimize the error that may affect the data taken.
Chapter 4 gives a thorough explanation on software development stage. This
includes the modeling of the process, the algorithm flowcharts and some
presentation of the developed software.

8
Chapter 5 presents the results obtained from the experiments done on the
developed system. The results obtained are discussed and a conclusion was drawn
based on the analysis. Several experiments had been carried out in order to
investigate the system performance in many aspects such as the accuracy of the
system, the environmental effect towards the system performance and to identify the
limitation of the system.
Chapter 6 contains the conclusions from this project and some suggestions
for future work and development are given in order to improve the system ability.
77
REFERENCES Abdul Rahim, R. (1996). A tomographic imaging system for pneumatic conveyors
using optical fibres. Sheffield Hallam University: PhD Thesis.
Abdul Rahman Bidin, Green, R.G., Shackleton, M.E., Stott, A.L. and Taylor R.W.
(1995). “Electrodynamic Sensors For Process Tomography.” in Williams,
R.A. and Beck, M.S. (Eds.) “Process Tomography: Principles, Techniques
And Applications.” Oxford: Butterworth-Heinemann. 101-117.
Andreas H. Hielscher and Alexander Klose. Image Reconstruction Schemes for
Optical Tomography. Proceeding of the 20th Annual International
Conference of the IEEE Engineering in Medicine and Biology Society. 1998.
20(2): 876 – 879.
Chan Kok San (2002). Real Time Image Reconstruction for Fan Beam Optical
Tomography System. Universiti Teknologi Malaysia: B.Eng. Thesis.
Francis Hindle and Hugh McCann (1999). Optical Flourescence Auto-Projection
Tomography: A Novel Modality. 1st World Congress on Industrial Process
Tomography. April 14-17. Buxton, Great Manchester: 530 – 537.
G.C. Giakos, M. Pastorino, F. Russo, S. Chowdhury, N. Shah, and W. Davros,
Noninvasive imaging for the New Century, IEEE Instrumentation &
Measurement Magazine, June 1999.
G.T. Gullberg and G.L. Zeng. Backprojection Filtering for Variable Orbit Fan Beam
Tomography. IEEE. 1995: 1945 – 1947.
Gregory, I.A. (1987). Shot Velocity Measurement Using Electrodynamic
Transducers. University of Manchester Institute of Science and Technology:
Ph.D. Thesis.
Hoyle, B.S. and Xu, L.A. (1995). “Ultrasonic sensors.” in Williams, R.A. and Beck,
M.S. (Eds.) “Process Tomography: Principles, Techniques And
Applications.” Oxford: Butterworth-Heinemann. 119-149.
78
K. Ozanyan, S.J. Carey, F. Hindle, H. McCann, D E Winterbone, S W Young, and J
Black. All- Optoelectronic Solutions for Process Tomography. IEEE. 2000:
330.
L. Zeni, R. Bernini, and R. Pierri (1999). Optical Tomography for Dielectric
Profiling in Processing Electronic Material. 1st World Congress on Industrial
Process Tomography. April 14-17. Buxton, Great Manchester: 488 – 493.
Lihong V. Wang (1998). Optical Tomography for Biomedical Applications, IEEE
Engineering in Medicine and Biology.
Mohd. Hezri Fazalul Rahiman (2002). Real-Time Velocity Profile Generation of
Powder Conveying Using Electrical Charge Tomography. Universiti
Teknologi Malaysia: M. Eng Thesis.
R. Abdul Rahim, K.S. Chan, J.F. Pang, L.C.Leong (2004a). A Hardware
Development for Optical Tomography System Using Switch Mode Fan
Beam Projection.
R. Abdul Rahim, K.S. Chan, J.F. Pang, L.C.Leong (2004b). Optical Tomography
System Using Switch mode Fan Beam Projection: Modeling Techniques.
R. Abdul Rahim, N. Horbury, F.J. Dickin, R.G. Green, B.D. Naylor, T.P. Pridmore,
Optical Fibre Sensor for Process Tomography use on Pneumatic Conveyors,
1995.
Richard Thorn, Geir Anton Johansen, and Erling A Hammer (1999). Three-Phase
Flow Measurement in the Offshore Oil Industry. Is There a Place for Process
Tomography? 1st World Congress on Industrial Process Tomography. April
14-17. Buxton, Great Manchester: 228 – 235.
S. Ibrahim, R.G. Green, K. Dutton and Abdul Rahim R. Application of Optical
Tomography in Industrial Process Control System. IEEE. 2000: 493 – 498.
S. Ibrahim, R.G.Green, K.Dutton, R. Abdul Rahim, K.Evans and A.Goude (1999).
Optical Fibres for Process Tomography: A Design study. 1st World Congress
on Industrial Process Tomography. April 14-17. Buxton, Great Manchester:
511 – 516.
S.B. Colak, M.B. van der Mark, G. W.’t Hooft, J.H. Hoogenraad, E.S. van der
Linden, and F.A. Kuijpers. Clinical Optical Tomography and NIR
Spectroscopy for Breast Cancer Detection. IEEE Journal of Selected Topics
in Quantum Electronics. 1999. 5(4): 1143 – 1157.

79
S.F.A. Bukhari and W.Q. Yang, Tomographic Imaging Technique for Oil Separator
Control (2004). 3rd International Symposium on Process Tomography.
Poland.
S.J. Carey, H. McCann, D.E. Winterbone, and E. Clough (1999). Near Infra-Red
Absorption Tomography for Measurement of Chemical Species Distribution.
1st World Congress on Industrial Process Tomography. April 14-17. Buxton,
Great Manchester: 480 – 487.
Shackleton, M.E. (1982). Electrodynamic Transducers For Gas/Solids Flow.
Bradford University: M.Phil. Thesis.
Vasilis Ntziachristos, A.G. Yodh and Britton Chance (1999). Optical Tomography
Using multi-frequency Intensity Information, Proceedings of the First Joint
BMES/EMBS Conference Serving Humanity, Advancing Technology, Oct. 13
– 16. Atlanta, USA: IEEE, 1100 – 1101.
Xu, L.A (1987). “Pulsed Ultrasound Cross-Correlation Flowmeter For Two-
Component Flow Measurement”. University of Manchester Institute of
Science and Technology: Ph.D. Thesis.
Yingna Zheng, Qiang Liu, Yang Li, and Nabil Gindy. Study on Concentration
Distribution and Mass Flow Rate Measurement for Gravity Chute Conveyor
by Optical Tomography System.