Fairness Across the World: Preferences and Beliefs
75
Fairness Across the World: Preferences and Beliefs Ingvild Alm˚ as 1,2 Alexander W. Cappelen 1 Erik Ø. Sørensen 1 Bertil Tungodden 1 FAIR Workshop - Deaton Review, October 14, 2020 1 FAIR - The Choice Lab, NHH Norwegian School of Economics 2 IIES - University of Stockholm
Transcript of Fairness Across the World: Preferences and Beliefs

DR
AFT
Fairness Across the World:
Preferences and Beliefs
Ingvild Almas1,2 Alexander W. Cappelen1
Erik Ø. Sørensen1 Bertil Tungodden1
FAIR Workshop - Deaton Review, October 14, 2020
1 FAIR - The Choice Lab, NHH Norwegian School of Economics2 IIES - University of Stockholm

DR
AFT
Large differences in inequality across the world
WB Gini (mean 2010−2018)0.30.40.50.6Not included
DR
AFT
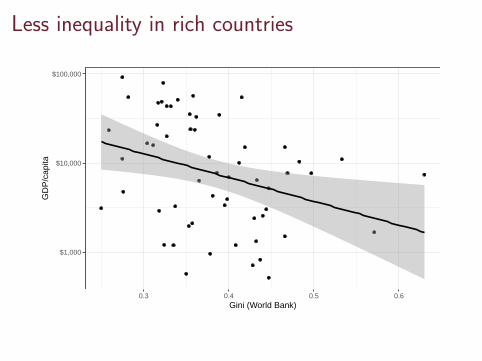
Less inequality in rich countries
$1,000
$10,000
$100,000
0.3 0.4 0.5 0.6Gini (World Bank)
GD
P/c
apita

DR
AFT
The will of the people?
I Focus of the presentation: How are these globalinequality differences related to the fairness views ofpeople in each country?
I Future work: Understand how the fairness viewsco-evolve with social institutions (Bowles, JEL, 1998; Fehrand Hoff, EJ, 2011; Besley and Persson, AERI 2019).

DR
AFT
Why are fairness views important?
Fairness and Voting
DR
AFT
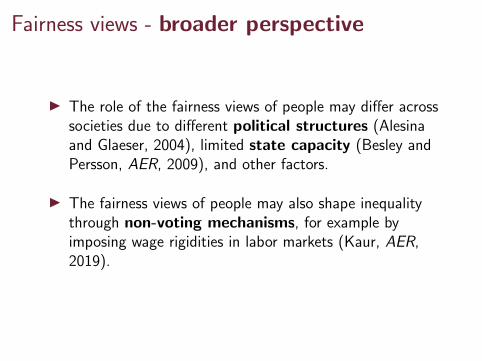
Fairness views - broader perspective
I The role of the fairness views of people may differ acrosssocieties due to different political structures (Alesinaand Glaeser, 2004), limited state capacity (Besley andPersson, AER, 2009), and other factors.
I The fairness views of people may also shape inequalitythrough non-voting mechanisms, for example byimposing wage rigidities in labor markets (Kaur, AER,2019).

DR
AFT
Inequality acceptance - two stories
I The classical view: Equality-efficiency trade-off
I The fairness view: Unfair and fair inequality

DR
AFT
Inequality acceptance - preferences and beliefs
I Preferences: People may differ in inequality acceptancebecause they differ in how they trade off equality andefficiency (Okun, 1975) or in what they consider a fairinequality (Almas, Cappelen, and Tungodden, JPE,2020).
I Beliefs: People may differ in inequality acceptancebecause they differ in their beliefs about howinequality affects efficiency (Acemogly, Robinson, andVerdier, JPE, 2017) or in their beliefs about the causesof inequality (Piketty, QJE, 1995; Alesina andAngeletos, AER, 2005; Benabou and Tirole, QJE, 2006;Alesina, Stantcheva, and Teso, AER, 2018).

DR
AFT
Fairness across the world: the approach
I Preferences: Study real distributive behavior ofrepresentative populations in 60 countries in identicaleconomic environments, where we control andrandomly vary the source of inequality and the costof redistribution?
I Beliefs: Study beliefs about the equality-efficiency tradeoff and a broad range of beliefs about whether individualchoices and background factors cause inequality?
I Policy attitudes: Relate these preferences and beliefs towhether people find existing inequality unfair andsupport redistribution - and to actual inequality andincome levels in the countries.

DR
AFT
Contributions of the paper
I Provides a unique study of fairness preferences acrossthe world, including the largest experimental studyimplemented in the social sciences.
I Provides rich and novel data on the beliefs shapinginequality acceptance.
I Provides new understanding of how fairness preferencesand beliefs may contribute to explain global variationin inequality.
I Provides global large-scale causal evidence on theimportance of the source of inequality and the cost ofredistribution for inequality acceptance in generalpopulations.

DR
AFT
Pre-analysis plan
I Describes the main research questions and formulates themain hypotheses to be tested, but more open than aclassical pre-analysis plan.
I Describes the design in detail.
I Describes the identification strategy.
I The plan is publicly available and was posted on AEARCT registry before we opened any data for analysis.
DR
AFT
The design of the study

DR
AFT
Fairness across the world – study design
I We implemented a module on the Gallup World Poll in2018 in 60 countries (65800 respondents; 1000+ in eachcountry, China (3600+) India (3000), Russia (2000)).
I The module consists of three parts:I Fairness preferences: All the respondents made a real
spectator distributive decision for two workers.I Beliefs: All the respondents answered a subset of
questions on their beliefs about the causes of inequalityand their belief about the efficiency cost ofredistribution.
I Policy attitudes: All the respondents answered twoquestions about attitudes to current inequality and onwhether government should aim to reduce inequality.
I Novel approach: First experimental study in GallupWorld Poll (Falk et al., QJE,2018).

DR
AFT
Countries included in the studyFigure 1: Countries in the experiment
Note: The 60 countries included in the experiment are shown in dark grey, they are: Afghanistan,Algeria, Argentina, Australia, Bangladesh, Bolivia, Brazil, Cambodia, Cameroon, Canada, Chile,China, Colombia, Croatia, Czech Republic, Ecuador, Egypt, Estonia, Ethiopia, France, Germany,Greece, Hungary, India, Indonesia, Iran, Israel, Italy, Japan, Jordan, Kazakhstan, Kenya, Malawi,Mexico, Morocco, Netherlands, Nigeria, Norway, Pakistan, Peru, Philippines, Portugal, Russia,Rwanda, South Africa, South Korea, Spain, Sri Lanka, Switzerland, Tanzania, Thailand, Turkey,Uganda, Ukraine, United Kingdom, USA, Venezuela, Vietnam, Zambia, and Zimbabwe.
3 ParticipantsIn this study, we have two types of participants: spectators and workers. We here provide anoverview of the recruitment procedures.
3.1 Recruitment of spectatorsSpectators were recruited by Gallup, and our questions were asked as a subset of the Gallup WorldPoll 2018. Figure 1 (p. 4) shows the countries covered by our study.
3.2 Recruitment of workersTo elicit the fairness preferences, each spectator makes a real-life redistributive choice for twoworkers. The workers will be recruited from the international online market place Amazon Me-
4

DR
AFT
List of countries
I The 60 countries are: Afghanistan, Algeria, Argentina,Australia, Bangladesh, Bolivia, Brazil, Cambodia,Cameroon, Canada, Chile, China, Colombia, Croatia,Czech Republic, Ecuador, Egypt, Estonia, Ethiopia,France, Germany, Greece, Hungary, India, Indonesia, Iran,Israel, Italy, Japan, Jordan, Kazakhstan, Kenya, Malawi,Mexico, Morocco, Netherlands, Nigeria, Norway,Pakistan, Peru, Philippines, Portugal, Russia, Rwanda,South Africa, South Korea, Spain, Sri Lanka, Switzerland,Tanzania, Thailand, Turkey, Uganda, Ukraine, UnitedKingdom, USA, Venezuela, Vietnam, Zambia, andZimbabwe.
I Covers all the large economies and 80% of the worldpopulation.

DR
AFT
Fairness preferences
I Spectators decide whether to redistribute earningsbetween a pair of workers who have conducted a job.I Workers recruited through an international online market
place (mturk).I Same pool used in all countries.
I Spectators recruited and participating through GallupWorld Poll.
I Representative samples of the populations in the 60countries.
I Three treatments, between-individual design.
I Luck (L).
I Merit (M).
I Efficiency (E), introducing a cost of redistribution.

DR
AFT
Do you accept the inequality?
6 USD 0 USD?

DR
AFT
Luck - Distributive decision (in the US)
I 1. Leave it as it is: (6, 0)
I 2. Redistribute: (4.5, 1.5) or (3, 3)

DR
AFT
Treatments
I Merit: Manipulates the source of the inequality:I Earnings determined by the one who was most
productive on the assignment.
I Efficiency: Manipulates the cost of redistribution:I Iceberg cost of 50% - (3.6,1.2) or (2,2).I Highlights that there is a cost to transfer the money.

DR
AFT
Important design choices
I Real choice: The decision made by a spectator wasmatched with a unique pair of workers.
I Same pre-redistribution earnings in all situations:All spectators faced the pre-redistribution earnings of (6USD, 0 USD); PPP adjusted for each country.
I Complete information: Spectators had completeinformation about the source of the inequality and thecost of redistribution.
DR
AFT
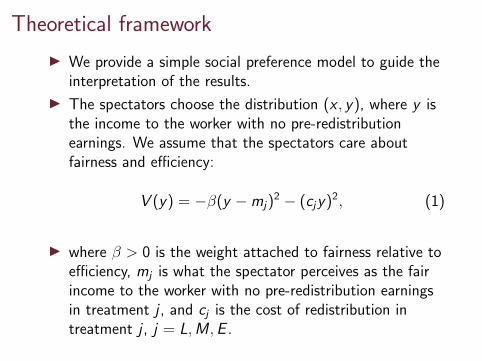
Theoretical framework
I We provide a simple social preference model to guide theinterpretation of the results.
I The spectators choose the distribution (x , y), where y isthe income to the worker with no pre-redistributionearnings. We assume that the spectators care aboutfairness and efficiency:
V (y) = −β(y −mj)2 − (cjy)2, (1)
I where β > 0 is the weight attached to fairness relative toefficiency, mj is what the spectator perceives as the fairincome to the worker with no pre-redistribution earningsin treatment j , and cj is the cost of redistribution intreatment j , j = L,M ,E .

DR
AFT
Optimal behavior in the different treatments
I Luck and Merit treatments:
y(j) = mj (2)
I Efficiency treatment:
y(E ) = mEβ/(β + 1) (3)
I We observe that:I β → 0 implies that y(E )→ 0.I β →∞ implies that y(E )→ mE .

DR
AFT
Fairness views
The spectators make distributive decisions in situations wherethere is no violation of procedural fairness. Three salientfairness views:
I Egalitarianism: Inequalities due to luck and performanceare unfair.
I Meritocratism : Inequalities due to luck are unfair,inequalities due to performance are fair.
I Libertarianism: Inequalities both due to luck andperformance are fair.
DR
AFT
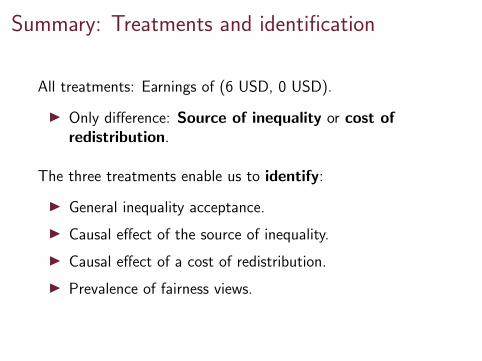
Summary: Treatments and identification
All treatments: Earnings of (6 USD, 0 USD).
I Only difference: Source of inequality or cost ofredistribution.
The three treatments enable us to identify:
I General inequality acceptance.
I Causal effect of the source of inequality.
I Causal effect of a cost of redistribution.
I Prevalence of fairness views.
DR
AFT
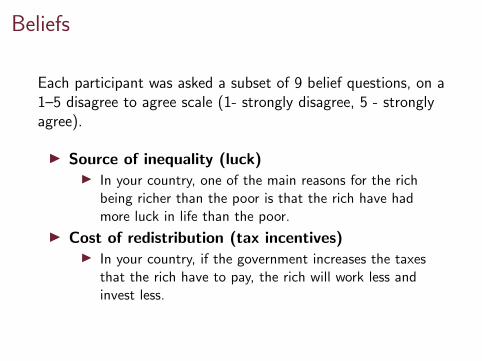
Beliefs
Each participant was asked a subset of 9 belief questions, on a1–5 disagree to agree scale (1- strongly disagree, 5 - stronglyagree).
I Source of inequality (luck)I In your country, one of the main reasons for the rich
being richer than the poor is that the rich have hadmore luck in life than the poor.
I Cost of redistribution (tax incentives)I In your country, if the government increases the taxes
that the rich have to pay, the rich will work less andinvest less.

DR
AFT
Potential sources of inequality
Choice orQ # Background
Hard work CRisk preferences CTime preferences CSelfishness CIllegal activities CLuck BAbilities (innate) BF. Opportunities B
Tax incentives

DR
AFT
Policy attitudes
Everyone answered these two (1–5 disagree to agree scale):
I Unfair inequality: In your country, the economicdifferences between the rich and the poor are unfair.
I Redistribution: In your country, the nationalgovernment should aim to reduce the economicdifferences between the rich and the poor.

DR
AFT
Results: Preferences
DR
AFT
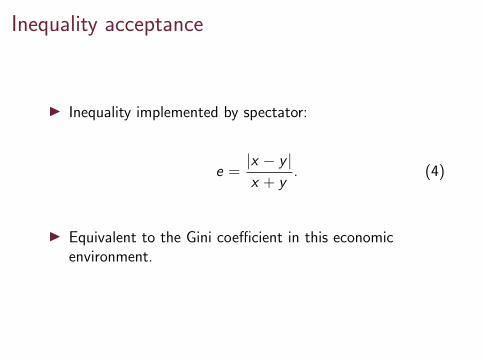
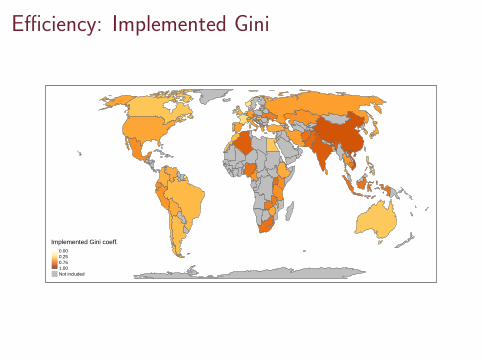
Inequality acceptance
I Inequality implemented by spectator:
e =|x − y |x + y
. (4)
I Equivalent to the Gini coefficient in this economicenvironment.

DR
AFT
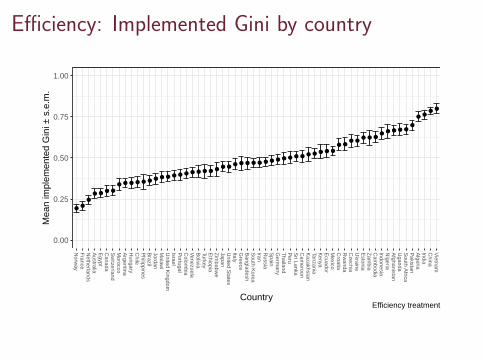
Implemented inequality – pooled across treatments
Implemented Gini coeff.0.000.250.751.00Not included

DR
AFT
Is there less inequality acceptance in rich countries?
$1,000
$10,000
$100,000
0.3 0.4 0.5 0.6Gini (World Bank)
GD
P/c
apita

DR
AFT
Is there less inequality acceptance in rich countries?
$1,000
$10,000
$100,000
0.3 0.4 0.5 0.6Gini (World Bank)
GD
P/c
apita
$1,000
$10,000
$100,000
0.3 0.4 0.5 0.6 0.7 0.8Gini in experiment
GD
P/c
apita
DR
AFT
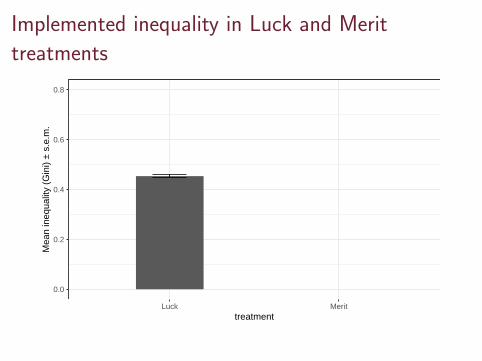
Implemented inequality in Luck and Merit
treatments
0.0
0.2
0.4
0.6
0.8
Luck Merittreatment
Mea
n in
equa
lity
(Gin
i) ±
s.e.
m.

DR
AFT
Implemented inequality in Luck and Merit
treatments
0.0
0.2
0.4
0.6
0.8
Luck Merittreatment
Mea
n in
equa
lity
(Gin
i) ±
s.e.
m.

DR
AFT
Luck: Implemented Gini
Implemented Gini coeff.0.000.250.751.00Not included

DR
AFT
Merit: Implemented Gini
Implemented Gini coeff.0.000.250.751.00Not included
DR
AFT
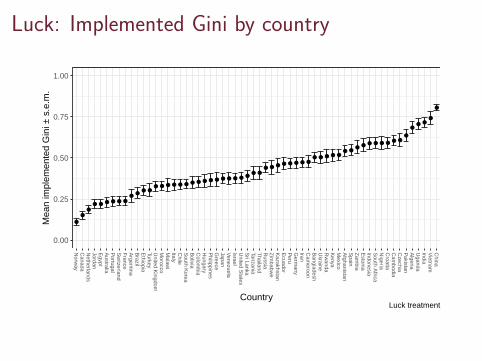
Luck: Implemented Gini by country
●
●
●
●
●
●
●
●
●
●
●
●
●
●
●
●
●
●
●
●
●
●●
●
●
●
●
●
●●
●●
●●
●
●
●
●●●
●
●
●
●
●
●
●
●
●
●
●
●
●
●
●
●
●
● ●
●
0.00
0.25
0.50
0.75
1.00
Norw
ayC
anadaN
etherlandsJordanE
gyptA
ustraliaP
ortugalS
witzerland
France
Argentina
Brazil
Ethiopia
TurkeyU
nited Kingdom
Morocco
Malaw
iItalyC
hileS
outh Korea
Bolivia
Colom
biaH
ungaryP
hilippinesG
reeceJapanV
enezuelaIsraelU
nited States
Sri Lanka
TanzaniaT
hailandR
ussiaZ
imbabw
eK
azakhstanE
cuadorP
eruG
ermany
IranC
ameroon
Bangladesh
Ukraine
Rw
andaK
enyaM
exicoA
fghanistanS
painZ
ambia
Estonia
IndonesiaS
outh Africa
Nigeria
Croatia
Cam
bodiaC
zechiaP
akistanA
lgeriaU
gandaIndiaV
ietnamC
hina
Country
Mea
n im
plem
ente
d G
ini ±
s.e
.m.
Luck treatment

DR
AFT
Merit: Implemented Gini by country
●●
●
● ●
●
●
●
● ● ●
●
●
●●
●
●●
●
●
●
●
●
●
●
●
●
●●
●
●
●
●
●
●
●
●
●
●
●
●●
●
●
●
●
●
●
●
●
●●
● ●
●
●
●
●
●
●
0.00
0.25
0.50
0.75
1.00
Bangladesh
TanzaniaM
alawi
Philippines
IsraelA
rgentinaE
thiopiaT
hailandN
orway
Afghanistan
Sri Lanka
Brazil
Venezuela
Cam
eroonC
hileN
etherlandsF
ranceH
ungaryJordanIndonesiaZ
imbabw
eS
witzerland
Egypt
Colom
biaK
azakhstanS
outh Korea
Morocco
Kenya
Germ
anyB
oliviaU
kraineE
cuadorC
ambodia
Portugal
United K
ingdomIndiaP
eruC
roatiaJapanS
outh Africa
TurkeyC
anadaS
painP
akistanZ
ambia
Nigeria
Mexico
Uganda
IranR
wanda
Australia
ItalyA
lgeriaC
zechiaG
reeceR
ussiaU
nited States
China
Estonia
Vietnam
Country
Mea
n im
plem
ente
d G
ini ±
s.e
.m.
Merit treatment

DR
AFT
Implemented inequality in Luck and Efficiency
treatments
0.0
0.2
0.4
0.6
0.8
Luck Efficiencytreatment
Mea
n in
equa
lity
(Gin
i) ±
s.e.
m.

DR
AFT
Implemented inequality in Luck and Efficiency
treatments
0.0
0.2
0.4
0.6
0.8
Luck Efficiencytreatment
Mea
n in
equa
lity
(Gin
i) ±
s.e.
m.

DR
AFT
Luck: Implemented Gini
Implemented Gini coeff.0.000.250.751.00Not included
DR
AFT
Efficiency: Implemented Gini
Implemented Gini coeff.0.000.250.751.00Not included
DR
AFT
Efficiency: Implemented Gini by country
●
●
●
●
●
●
●
●
●
●
●●
●
●
●
●●
●
●
●
●
●
●
●
●
●
●
●
●
●
●
●
●
●
●
●
●
●
●
●
●
●
●
●
●
●
●
●
●
●● ●
●
●●
●
●
●
●
●
0.00
0.25
0.50
0.75
1.00
Norw
ayF
ranceN
etherlandsA
ustraliaE
gyptC
anadaS
witzerland
Morocco
Argentina
Hungary
Chile
Philippines
Brazil
JordanM
alawi
United K
ingdomIsraelP
ortugalC
olombia
Venezuela
Bolivia
TurkeyE
thiopiaZ
imbabw
eJapanU
nited States
ItalyG
reeceB
angladeshS
outh Korea
IranR
ussiaS
painG
ermany
Thailand
Peru
Sri Lanka
Cam
eroonK
azakhstanTanzaniaK
enyaE
cuadorM
exicoC
roatiaR
wanda
Czechia
Ukraine
Estonia
Zam
biaC
ambodia
IndonesiaN
igeriaA
fghanistanU
gandaS
outh Africa
Pakistan
Algeria
IndiaC
hinaV
ietnam
Country
Mea
n im
plem
ente
d G
ini ±
s.e
.m.
Efficiency treatment

DR
AFT
Treatment effects
The empirical specification is
ei = α + αMMi + αEEi + γXi + εi ,
where ei is the income inequality implemented by spectator i ,Mi and Ei are indicator variables for spectator i being in theMerit or the Efficiency treatment, and Xi is a vector of controlvariables.

DR
AFT
Treatment effects Table 9: Main treatment effects
Implemented Gini
Merit (d) 0.259∗∗∗ 0.259∗∗∗
(0.004) (0.004)
Efficiency (d) 0.050∗∗∗ 0.051∗∗∗
(0.004) (0.004)
Rich (d) 0.007(0.006)
Poor (d) 0.007∗
(0.004)Female (d) −0.013∗∗∗
(0.004)Age (Z-score) 0.015∗∗∗
(0.002)Married (d) −0.008∗
(0.004)
# children (Z-score) −0.014∗∗∗
(0.003)
Middle edu (d) −0.003(0.004)
High edu (d) −0.008(0.006)
Working (d) −0.011∗∗∗
(0.004)
Urban (d) −0.011∗∗
(0.004)
Country FE No YesObservations 64,784 63,714
5

DR
AFT
Treatment effect by country, Merit
●
●
● ●
●
●
●
●
●
●
●●
●
●
●●
●
●
●
●
●
●●
●●
●
●●
●
●
●
●
●
●
●
●
●
●
●
●
●
● ●●
●
●●
●
●
●
●
●
●
●
●
●●
●
●
0.0
0.2
0.4
0.6
IndiaC
hinaB
angladeshA
fghanistanU
gandaIndonesiaP
akistanC
ambodia
Algeria
TanzaniaC
roatiaC
ameroon
South A
fricaT
hailandV
ietnamN
igeriaIsraelP
hilippinesK
enyaZ
ambia
Sri Lanka
Spain
Czechia
Malaw
iU
kraineZ
imbabw
eK
azakhstanG
ermany
Venezuela
Ecuador
Mexico
Estonia
Ethiopia
Peru
Rw
andaA
rgentinaC
hileH
ungaryIranB
razilC
olombia
South K
oreaB
oliviaJapanM
oroccoR
ussiaU
nited Kingdom
France
Sw
itzerlandU
nited States
JordanTurkeyG
reeceE
gyptItalyN
etherlandsN
orway
Portugal
Australia
Canada
Country
Coe
ffici
ent o
n 'm
erit'
± s
.e.
Coefficients from country−by−country regressions of gini on treatment indicators.

DR
AFT
Treatment effect by country, Efficiency
●
●
●
●
●●
●
● ●
●
●
●
●
●
●
●
●
●
●
●
●
●
●
●
●
●
●
●●
●
●
●
●
●
●
●●
●
●
●
●
●
●●
●●
●
●
●
●
●
●
●
●
●
●
●
●
●
●
0.0
0.2
0.4
0.6
Spain
Bangladesh
Uganda
France
China
Zim
babwe
Hungary
Croatia
Philippines
Czechia
IranM
oroccoC
hileIsraelK
enyaG
ermany
Cam
bodiaM
exicoC
ameroon
Peru
Russia
Venezuela
Estonia
IndiaM
alawi
Colom
biaA
ustraliaV
ietnamU
nited Kingdom
Netherlands
IndonesiaZ
ambia
Pakistan
Sw
itzerlandE
gyptB
oliviaK
azakhstanA
lgeriaU
nited States
Nigeria
JapanR
wanda
Ecuador
Brazil
Argentina
Norw
ayS
outh Africa
Thailand
Greece
Ukraine
TurkeyTanzaniaE
thiopiaS
ri LankaItalyA
fghanistanS
outh Korea
Canada
JordanP
ortugal
Country
Coe
ffici
ent o
n 'e
ffici
ency
' ± s
.e.
Coefficients from country−by−country regressions of gini on treatment indicators.
DR
AFT
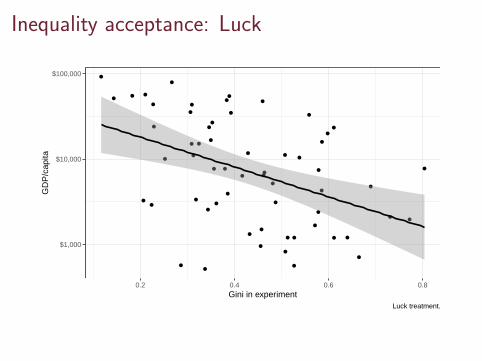
Inequality acceptance: Luck
$1,000
$10,000
$100,000
0.2 0.4 0.6 0.8Gini in experiment
GD
P/c
apita
Luck treatment.

DR
AFT
Inequality acceptance: Merit
$1,000
$10,000
$100,000
0.6 0.7 0.8 0.9Gini in experiment
GD
P/c
apita
Merit treatment.
DR
AFT
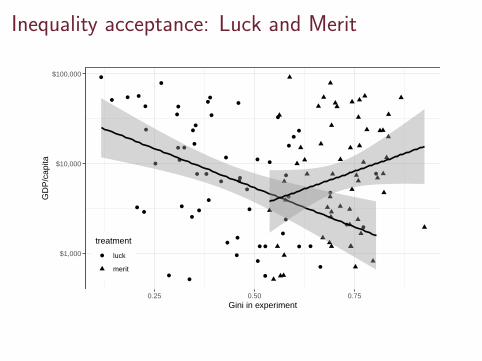
Inequality acceptance: Luck and Merit
$1,000
$10,000
$100,000
0.25 0.50 0.75Gini in experiment
GD
P/c
apita
treatment
luck
merit

DR
AFT
Rich countries are more meritocratic
$1,000
$10,000
$100,000
0.0 0.2 0.4 0.6Share meritocrats
GD
P/c
apita

DR
AFT
Rich countries are not more efficiency-seeking
$1,000
$10,000
$100,000
−0.1 0.0 0.1Treatment effect on Gini in experiment (Efficiency vs luck)
GD
P/c
apita
DR
AFT
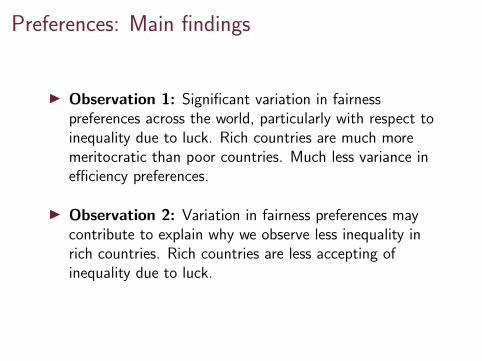
Preferences: Main findings
I Observation 1: Significant variation in fairnesspreferences across the world, particularly with respect toinequality due to luck. Rich countries are much moremeritocratic than poor countries. Much less variance inefficiency preferences.
I Observation 2: Variation in fairness preferences maycontribute to explain why we observe less inequality inrich countries. Rich countries are less accepting ofinequality due to luck.
DR
AFT
Results: Beliefs

DR
AFT
Choice beliefs (means)
1
2
3
4
Hard work Risk preferences Time preferences Selfishness Illegal activitiesBelief question
Mea
n be
lief ±
s.e
.m.

DR
AFT
Background beliefs (means)
1
2
3
4
Luck Abilities OpportunitiesBelief question
Mea
n be
lief ±
s.e
.m.

DR
AFT
Beliefs: Choice versus Background
Difference in beliefs: Choice (3 var) − Background−0.50.00.5Not included

DR
AFT
Beliefs: Efficiency
Efficiency12345Not included

DR
AFT
Rich countries believe more in background factors
$1,000
$10,000
$100,000
2.5 3.0 3.5 4.0Belief in choice (3 var)
GD
P/c
apita

DR
AFT
Rich countries believe less in a large efficiency cost
$1,000
$10,000
$100,000
2.5 3.0 3.5Belief in efficiency
GD
P/c
apita

DR
AFT
Beliefs: Main findings
I Observation 3: Significant variation in beliefs across theworld, both with respect to the source of the inequalityand the cost of redistribution
I Observation 4: Variation in beliefs may contribute toexplain why we observe less inequality in rich countries.Rich countries agree more that inequality is due tobackground factors and less that there are efficiency costswith redistribution.

DR
AFT
Results: Policy Attitudes
DR
AFT
The most divided country?

DR
AFT
The most divided country

DR
AFT
Is inequality in your country unfair?
12345Not in sample

DR
AFT
Should government in your country aim to reduce
inequalities?
12345Not in sample

DR
AFT
Government should aim to reduce inequality?
Zambia Zimbabwe
Rwanda Tanzania Uganda Ukraine Vietnam
Malawi Morocco Nigeria Pakistan Philippines
Egypt Ethiopia India Indonesia Kenya
Afghanistan Bangladesh Bolivia Cambodia Cameroon
1 2 3 4 5 1 2 3 4 5
1 2 3 4 5 1 2 3 4 5 1 2 3 4 5
0.000.250.500.75
0.000.250.500.75
0.000.250.500.75
0.000.250.500.75
0.000.250.500.75
Agreement that government should aim to reduce inequality (1−5)
Fra
ctio
n

DR
AFT
Government should aim to reduce inequality?
United Kingdom United States Venezuela
South Africa South Korea Spain Sri Lanka Switzerland Thailand Turkey
Kazakhstan Mexico Netherlands Norway Peru Portugal Russia
Greece Hungary Iran Israel Italy Japan Jordan
Colombia Croatia Czech Republic Ecuador Estonia France Germany
Algeria Argentina Australia Brazil Canada Chile China
1 2 3 4 5 1 2 3 4 5 1 2 3 4 5
1 2 3 4 5 1 2 3 4 5 1 2 3 4 5 1 2 3 4 5
0.00.20.40.60.8
0.00.20.40.60.8
0.00.20.40.60.8
0.00.20.40.60.8
0.00.20.40.60.8
0.00.20.40.60.8
Agreement that government should aim to reduce inequality (1−5)
Fra
ctio
n
DR
AFT
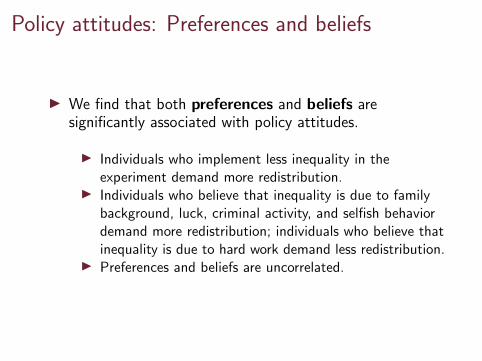
Policy attitudes: Preferences and beliefs
I We find that both preferences and beliefs aresignificantly associated with policy attitudes.
I Individuals who implement less inequality in theexperiment demand more redistribution.
I Individuals who believe that inequality is due to familybackground, luck, criminal activity, and selfish behaviordemand more redistribution; individuals who believe thatinequality is due to hard work demand less redistribution.
I Preferences and beliefs are uncorrelated.

DR
AFT
Actual inequality: Preferences and beliefs
I We find that inequality acceptance in the experiment isclosely associated with actual inequality in society.
I People from societies with more inequality implementmore inequality in the experiment.
I Find the same pattern if we exploit regional variation.

DR
AFT
Results: Concluding remarks
DR
AFT
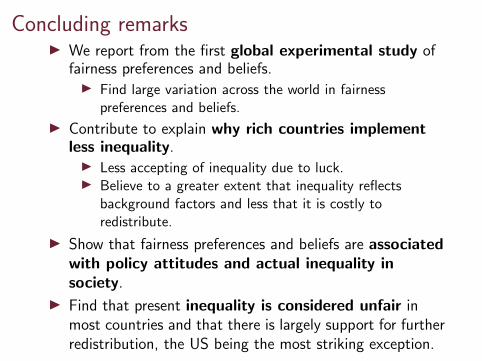
Concluding remarksI We report from the first global experimental study of
fairness preferences and beliefs.I Find large variation across the world in fairness
preferences and beliefs.
I Contribute to explain why rich countries implementless inequality.I Less accepting of inequality due to luck.I Believe to a greater extent that inequality reflects
background factors and less that it is costly toredistribute.
I Show that fairness preferences and beliefs are associatedwith policy attitudes and actual inequality insociety.
I Find that present inequality is considered unfair inmost countries and that there is largely support for furtherredistribution, the US being the most striking exception.

DR
AFT
Thank you!

DR
AFT
Fairness and moral motivation - work in progressI Understanding meritocracy
I What is a morally relevant choice? (Cappelen, Fest,Sørensen, and Tungodden)
I Why do people reward talent, but not other types ofluck? (Bartling, Cappelen, Skarpeid, Sørensen, andTungodden)
I Fairness in winner-takes-all markets (Bartling, Cappelen,Eckstrom, Sørensen, and Tungodden)
I Merit with limited information? (Cappelen, de Haan, andTungodden)
I Second-best fairness (Cappelen, Cappelen, and Tungodden)
I The moral mind - a global studyI Selfishness (Cappelen and Tungodden)I Moral universalism (Cappelen, Enke, and Tungodden)I Freedom and paternalism (Bartling, Cappelen, Hermes, and
Tungodden)
I Socialization of moral views - a global study, (Cappelen, Falch,Sørensen, and Tungodden)
DR
AFT
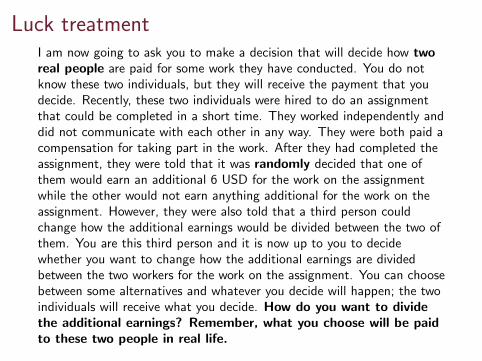
Luck treatmentI am now going to ask you to make a decision that will decide how tworeal people are paid for some work they have conducted. You do notknow these two individuals, but they will receive the payment that youdecide. Recently, these two individuals were hired to do an assignmentthat could be completed in a short time. They worked independently anddid not communicate with each other in any way. They were both paid acompensation for taking part in the work. After they had completed theassignment, they were told that it was randomly decided that one ofthem would earn an additional 6 USD for the work on the assignmentwhile the other would not earn anything additional for the work on theassignment. However, they were also told that a third person couldchange how the additional earnings would be divided between the two ofthem. You are this third person and it is now up to you to decidewhether you want to change how the additional earnings are dividedbetween the two workers for the work on the assignment. You can choosebetween some alternatives and whatever you decide will happen; the twoindividuals will receive what you decide. How do you want to dividethe additional earnings? Remember, what you choose will be paidto these two people in real life.