Aspects of Investor Psychology -...
22
Aspects of Investor Psychology Beliefs, preferences, and biases investment advisors should know about. Daniel Kahneman, Ph.D. Eugene Higgins Professor of Psychology Princeton University Woodrow Wilson School of Public and International Affairs Robertson Hall Princeton, NJ 08544-1013 Mark W. Riepe Vice President Investment Products and Mutual Fund Research Charles Schwab & Co., Inc. The Schwab Building 101 Montgomery Street San Francisco, CA 94104 Reprinted with permission from Journal of Portfolio Management, Vol. 24 No. 4, Summer 1998, copyright Institutional Investor, Inc. For reprints of article or subscription information call (212) 224-3185.
-
Upload
nguyenthien -
Category
Documents
-
view
221 -
download
2
Transcript of Aspects of Investor Psychology -...

Aspects of Investor PsychologyBeliefs, preferences, and biases investment advisors should know about.
Daniel Kahneman, Ph.D.Eugene Higgins Professor of Psychology
Princeton UniversityWoodrow Wilson School of Public and International Affairs
Robertson HallPrinceton, NJ 08544-1013
Mark W. RiepeVice President
Investment Products and Mutual Fund ResearchCharles Schwab & Co., Inc.
The Schwab Building101 Montgomery Street
San Francisco, CA 94104
Reprinted with permission from Journal of Portfolio Management, Vol. 24 No. 4,Summer 1998, copyright Institutional Investor, Inc. For reprints of article orsubscription information call (212) 224-3185.

1
INTRODUCTION
Decision theorist Howard Raiffa [1968] introduces useful distinctions amongthree approaches to the analysis of decisions. Normative analysis is concernedwith the rational solution to the decision problem. It defines the ideal that actualdecisions should strive to approximate. Descriptive analysis is concerned withthe manner in which real people actually make decisions. Prescriptive analysis isconcerned with practical advice and help that people could use to make morerational decisions.
Financial advising is a prescriptive activity whose main objective shouldbe to guide investors to make decisions that best serve their interests. To adviseeffectively, advisors must be guided by an accurate picture of the cognitive andemotional weaknesses of investors that relate to making investment decisions:their occasionally faulty assessment of their own interests and true wishes, therelevant facts that they tend to ignore, and the limits of their ability to acceptadvice and to live with the decisions they make. Our article sketches some partsof that picture, as they have emerged from research on judgment, decision-making and regret over the last three decades.
The biases of judgment and decision making have sometimes been calledcognitive illusions. Like visual illusions, the mistakes of intuitive reasoning arenot easily eliminated. Consider the example of Exhibit 1. Although you can use aruler to convince yourself that the two horizontal lines are of equal length, youwill continue to see the second line as much longer than the other. Merelylearning about illusions does not eliminate them.
EXHIBIT 1VISUAL ILLUSION
The goal of learning about cognitive illusions and decision-making is todevelop the skill of recognizing situations in which a particular error is likely. Insuch situations, as in the case of Exhibit 1, intuition cannot be trusted and itmust be supplemented or replaced by more critical or analytical thinking – theequivalent of using a ruler to avoid a visual illusion.
Providing timely warnings about the pitfalls of intuition should be one ofthe responsibilities of financial advisors. More generally, an ability to recognizesituations in which one is likely to make large errors is a useful skill for anydecision-maker.
We follow a long tradition in discussions of decision-making, whichdistinguishes two elements: beliefs and preferences. Decisions theorists arguethat any significant decision can be described as a choice between gambles,because the outcomes of possible options are not fully known in advance. A

2
gamble is characterized by the range of its possible outcomes and by theprobabilities of these outcomes. People make judgments about the probabilities;they assign values (sometimes called utilities) to outcomes; and they combinethese beliefs and values in forming preferences about risky options.
Judgments can be systematically wrong in various ways. Systematicerrors of judgment are called biases. We start by dealing with a selection ofjudgment biases. Then we discuss errors of preference, which arise either frommistakes that people make in assigning values to future outcomes or fromimproper combinations of probabilities and values. In both cases, we introduceeach bias with a question that illustrates the bias and conclude withrecommendations for financial advisors to help mitigate the harmful effects ofthese biases.
We conclude the article with a checklist that advisors can use to measuretheir effectiveness at dealing with these biases.
Biases of Judgment
Financial decisions are made in situations of high complexity and highuncertainty that preclude reliance on fixed rules and compel the decision-makerto rely on intuition. Intuitions play a crucial role in most decisions.
We first discuss a cluster of related biases and cognitive illusions inintuitive judgment that are most likely to affect investment decisions. Investorswho are prone to these biases will take risks that he does not acknowledge,experience outcomes that they did not anticipate, will be prone to unjustifiedtrading, and may end up blaming themselves or others when outcomes are bad.
Overconfidence
If you carry out the instructions in the question, your probability that theDow will be even higher than your high estimate should be 1%, and yourprobability that the Dow Jones will be lower than your low estimate should alsobe 1%. You have now determined your 98% subjective confidence interval forthe value of the Dow one month from today. You could repeat this exercise formany other variables that concern investors (e.g., the rate of inflation over thenext five years, the price of a particular stock, the general level of interest rates).Indeed, decision analysts recommend that decision-makers should always thinkof uncertain quantities in terms of confidence intervals, rather than pointestimates or best guesses.
Question 1. What is your best estimate of the value of the Dow Jones onemonth from today? Next pick a high value, such that you are 99% sure (but notabsolutely sure) that the Dow Jones a month from today will be lower than thatvalue. Now pick a low value, such that you are 99% sure (but no more) that theDow Jones a month from today will be higher than that value.
3
Suppose that you have made such judgments on a large set of unrelatedpropositions, and have waited for all outcomes to be known. For eachproposition there are three possibilities:
1. The real outcome could be even higher than your high estimate (intechnical terms, this is a high surprise).
2. The outcome could be lower than your low estimate (a low surprise).3. The outcome could be inside your confidence interval.
If your judgments are not biased in particular ways and if you are a goodjudge of the limits of your knowledge, you should expect to encounterapproximately 1% of high surprises and 1% of low surprises. In 98% of cases,the true value should fall inside your confidence interval. Individuals who setconfidence intervals that satisfy this requirement are said to be well-calibrated intheir judgments of probability.
Unfortunately, few people are well-calibrated. A vast amount of researchdocuments a highly systematic bias in subjective confidence intervals; there arefar too many surprises, indicating that the intervals were set too tightly. A typicaloutcome in many studies is a surprise rate of 15-20%, where accuratecalibration would yield 2%. This phenomenon, known as overconfidence, iswidespread and robust. Overconfidence has been confirmed even when it is inthe best interest of the research subjects to be well-calibrated.
Calibration can also be measured when people accompany theirstatements by numerical probabilities. For example, when someone tells you thatshe is "99% sure" that an event will occur, what probability should you assign tothat event? In general, if you are told that someone is 99% sure, you might bewell-advised to assume that the relevant probability is 85%. Perhaps mostpainful, this advice applies even to your own intuitive feelings of confidence!
Two groups of professionals have been found to be reasonably well-calibrated: meteorologists and handicappers at race tracks. Individuals in theseprofessions learn to be well calibrated because of three characteristics of theirtrade: they face similar problems every day; they make explicitly probabilisticpredictions; and they obtain swift and precise feedback on outcomes. Whenthese conditions are not satisfied, overconfidence should be expected, for bothexperts and non-experts.
These conditions for good calibration may be satisfied for some financeprofessionals; they are never satisfied for non-professional investors, who aretherefore prone to display overconfidence.

4
Recommendation 1:
Optimism
Another powerful bias exists which has asymmetric effects: Most people’sbeliefs are biased in the direction of optimism. Optimists exaggerate theirtalents: this is why more than 80% of drivers believe they are, like all thechildren of Lake Woebegon, above average. Many of them must be mistaken.
Optimists also underestimate the likelihood of bad outcomes over whichthey have no control. Most undergraduates, for example, believe that they areless likely than their roommates to develop cancer or to have a heart attackbefore the age of fifty.
Finally, optimists are also prone to an illusion of control (i.e., theyexaggerate the degree to which they control their fate). They tend tounderestimate the role of chance in human affairs and to misperceive games ofchance as games of skill.
The combination of overconfidence and optimism is a potent brew, whichcauses people to overestimate their knowledge, underestimate risks andexaggerate their ability to control events. It also leaves them vulnerable tostatistical surprises. As we see next, however, people are often not as surprisedas they should be by events they have failed to predict.
• Keep track of instances of your own overconfidence.• Be mindful of your propensity for overconfidence when making statements to clients.
Bold statements may help attract clients, but failure to live up to them will come backto haunt the advisor.
• Make clients aware of the uncertainty involved with investment decisions.• Do not let clients project their own overconfidence onto you. If you do, you will create
an unreasonably high standard of performance that will lead to short-lived clientrelationships.
Question 2. How good a driver are you? Compared to the drivers youencounter on the road, are you above average, average, or below average? Ifan acquaintance purchased a stock that later did badly, do you think of this as amistake, or as a case of bad luck?

5
Recommendation 2:
Hindsight
Are you sure that you can accurately recollect your beliefs of the daybefore the event? If you can perform this task accurately, you are in a minority.Psychological evidence indicates that people can rarely reconstruct, after thefact, what they thought about the probability of an event before it occurred. Mostare honestly deceived when they exaggerate their earlier estimate of theprobability that the event would occur. This is one of the manifestations of acollection of hindsight biases.
Because of another hindsight bias, events that the best-informed expertsdid not anticipate often appear almost inevitable after they occur. Financialpunditry provides an unending source of examples. Within an hour of the marketclosing every day, experts can be heard on the radio explaining with highconfidence why the market acted as it did. A listener could well draw theincorrect inference that the behavior of the market was so reasonable that itcould have been predicted earlier in the day.
If the behavior had been predictable, of course, the event would havecaused many people to change what they were doing – and the market wouldhave behaved differently. Everyone who deals with market events is familiar withthis chain of reasoning, but the fascination with interpretations of the pastpersists.
Hindsight errors are pernicious in two ways. First, hindsight tends topromote overconfidence, by fostering the illusion that the world is a morepredictable place than it is. Second -- and this is a lesson that financial advisorsoften learn painfully -- hindsight often turns reasonable gambles into foolishmistakes in the minds of investors. After a stock has dropped in value, its fallappears to have been inevitable. So why didn’t the advisor suggest selling itearlier?
• Resist the natural urge to be overoptimistic about the courses of action yourecommend for your clients. Think, for example, of things that could go wrong.
• Because you are more likely to remember your successes, keep a list of pastrecommendations you made that were not successful.
• Communicate realistic odds of success to your clients.• When presenting historical data to clients, resist the temptation to focus on the
upside.• Optimists who are also regret-prone have the worst combination of traits, both for
themselves and for the professionals who try to help them. Early identification ofsuch tendencies is therefore useful.
Question 3. Recall the latest action of the Fed about which there wasspeculation in the press. On the day before the event, what was your estimate ofthe probability that the Fed would act as it did?

6
Hindsight is an important element of investor regret, an unfortunate fact oflife to which we return later.
Over-Reaction to Chance Events
The two sequences in this question are equally likely to occur when a fair coin istossed. Only one of the sequences in the question appears random, however;the other appears systematic. Most people erroneously believe that the secondsequence is more likely than the first. More important, many people will be fartoo quick to perceive causal regularity in random sequences of events. Thisobservation is sometimes called the “hot hand” fallacy, because it was mostextensively documented by Gilovich, Vallone, and Tversky [1985] in their classicstudy of professional basketball players.
Observers and participants in the game are universally convinced thatplayers are sometimes “hot” and sometimes “cold” relative to their long-termaverage. Gilovich, Vallone, and Tversky analyzed the outcomes of players’shots, both from the field and from the free throw line, in hundreds of games. Anextensive analysis failed to turn up more deviations from a player’s long-termshooting percentage than one would expect to occur purely from chance.
At least in professional basketball, the hot hand is an illusion. The humanmind is a pattern-seeking device, and it is strongly biased to adopt thehypothesis that a causal factor is at work behind any notable sequence ofevents.
The hot hand fallacy is ubiquitous in the world of finance, where it lendsunfounded credibility to the claims of fund managers who have been successfulfor a few years in a row. The tendency to attribute causal significance to chancefluctuations also leads investors to overreact to any information to which theirattention is drawn. In the context of basketball, the hot hand fallacy may causecoaches to overreact to fluke sequences of hits or misses by directing playtoward a “hot” player or by prematurely benching a “cold” player. In the contextof finance, the same psychological quirk causes investors to perceive trendswhere none exist, and to take action on these erroneous impressions.
Odean [1998b] reports a striking pattern of results in his analysis ofhundreds of thousands of individual transactions made with a brokerage firm. Hefinds that when individual investors sold a stock and quickly bought another, thestock they sold outperformed the stock they bought by 3.4 percentage points inthe first year, on average (excluding the costs of transactions). This costlyovertrading may be explained in terms of two of the biases that we havediscussed: people perceive patterns where none exist, and they have too muchconfidence in their judgments of uncertain events.
Question 4. Which of the following sequences is more likely to occur when a coin istossed – HHHTTT or HTHTTH?
7
Recommendation 3:
ERRORS OF PREFERENCE
Students of decision-making analyzed all decisions under uncertainty as if theyinvolved a choice among gambles or bets. This framework is particularlyappropriate in analyzing financial decisions. We have discussed some of theways in which investors (and their advisors) may be wrong in judging theprobabilities associated with different options. Now we present some evidenceabout the way in which people use probability information in evaluating riskyprospects, assign values to outcomes, and combine values and probabilities intopreferences.
Non-Linear Weighting of Probabilities
Question 5.
The theory of rational choice tells us that uncertain prospects should beevaluated by a weighted average of the utilities of possible outcomes, eachweighted by its probability. Weighting by probability implies that a possibleoutcome that has a probability of 1% should be weighted ten times as much asan outcome that has a probability of 0.1%. Another implication is that anincrement of 1 percentage point in the probability of an event should have thesame effect on the weighting of outcomes, whether the initial probability is 0%,41%, or 99%.
As the reader will surely discover in considering Question 5, intuitionsabout risks and opportunities do not obey this rule. People will pay more to raisethe probability of a desirable event from 0 to 1%, or from 99% to 100%, thanthey will pay to increase the probability from 41% to 42%.
People deviate from the principle of weighting by probability in highlysystematic ways. Relative to the weight assigned to a certainty (which isassumed to be 1), people overweight low probabilities and underweight
• Ask yourself whether you have real reasons to believe that you know more thanthe market.
• Before making an active decision, consider the possibility that the trade is based onrandom factors. List the reasons why it isn’t before making the trade.
You are facing a chance for a gain of $20,000. You do not know the exactprobability. Consider the three pairs of outcomes:A. The probability is either 0 or 1%B. The probability is either 41% or 42%C. The probability is either 99% or 100%Are the three differences, A, B and C, equally significant to a decision-maker?Could you order them by their impact on preferences?

8
moderate and high probabilities; the underweighting of high probabilities isespecially pronounced.
This rule explains much of what we know about decision-making underrisk and uncertainty. In particular, it explains why people like long shots betterthan other gambles of equal expected value; long shots are preferred becauselow probabilities of winning are greatly overweighted. Thus, most people will finda 1% chance to win $1,000 more attractive than a $10 gift. And most peoplewho have a 99% chance to win $1,000 will be willing to pay much more than $10to eliminate the possibility of missing the prize. In general, the non-proportionalweighting of probabilities makes people like both lottery tickets and insurancepolicies.1
People Value Changes, not States
If you are like most other people, then 1) you probably paid very little attention tothe initial statement about being richer than you are by a specified amount; 2)you probably feel that the two problems are quite different; and 3) if you cho0sethe gamble in one of the problems and the sure thing in the other, you probablychose the gamble in Question 7 and the sure thing in Question 6.
This way of thinking about the two problems, although it feels entirelynatural, violates an important rule of rational decision making. A fully rationaldecision-maker would treat the two decision problems as identical, because theyare identical when formulated in terms of states of wealth. In both problems, youhave a choice between being $25,000 richer than you are today or taking agamble in which you could end up richer by $20,000 or by $30,000, with equalprobabilities.
The argument is simple: what matters to a perfectly rational decision-maker is where he or she gets to in the end, not the gains or losses along theway. Such a decision-maker will choose either the gamble or the sure thing inboth Questions 6 and 7, instead of flipping preferences as most people do. Inthis analysis, a decision-maker who makes different choices in the two problemsmust have been influenced by the irrelevant emotions associated with gains andlosses, instead of keeping in mind the more important goal of maximizing theutility of wealth.
Question 6. Imagine that you are richer by $20,000 than you are today, andthat you face a choice between options:
A. receive $5,000 or B. a 50% chance to win $10,000 and a 50% chance to winnothing.
Question 7. Now imagine that you are richer by $30,000 than you are today,and that you are compelled to choose one of two options:
C. lose $5,000 or D. a 50% chance to lose $10,000 and a 50% chance to losenothing.

9
The logical argument for the equivalence of Questions 6 and 7 iscompelling, but hardly transparent. No one would ever go through the seeminglypointless exercise of adding his or her wealth to all outcomes of the gamble.Indeed, most readers probably sail past the initial statement about their changedwealth, because such a change of wealth would be very unlikely to change theirpreferences. It is a universal practice to simplify decision problems byconsidering only the gains and losses that depend directly on the choice that isto be made. However, this universal practice is a source of errors, because itcauses people to make inconsistent choices in alternative formulations of “thesame” problem.
There are several important morals to be drawn from this story. First, it isalways possible to frame the same decision problem in broader terms (such aswealth) or in narrower terms (such as gains and losses); broad and narrowframes often lead to different preferences. Second, rationality is best served byadopting broad frames, and by focusing on states (such as wealth) rather thanon changes (such as gains and losses). We admit, however, narrow framing iseasier, more natural, and much more common.
Recommendation 4:
Value Function
Exhibit 2 summarizes much of what has been learned about how peoplevalue gains and losses. The value function takes a value of zero for a neutraloutcome, which is called the reference point. The reference point is often equalto the status quo (e.g., the current state of wealth), but in some cases, thereference point corresponds to an outcome that the individual had reason toexpect, sometimes because other people have obtained it. In other situations,which we discuss later, the reference point is determined by the framing of theproblem.
Two characteristics of the value function are important in understandingmany decisions.
• When presenting alternative courses of action to clients, do so using the broadestavailable frame.
• Make sure the frame chosen has relevance for the client (e.g., wealth).• For clients whose primary goal is retirement, consider converting the level of
wealth into the amount of annuity income that can be expected during retirement.

10
1. The function is steeper for losses than for gains, a feature called lossaversion.
2. The two limbs of the function are each described by a particularmathematical relationship, which implies a result that we will call near-proportionality of risk attitudes.
The answers to Question 8 typically fall in the range $200 to $250 – anextraordinarily high ratio of gain to loss. This number reflects the sharpasymmetry between the values that people put on gains and losses. Thisasymmetry, called loss aversion, explains decisions in many domains.
For example, an important recent article by Benartzi and Thaler (1995)explores the role of loss aversion in the pricing of stocks and bonds. The authorsstart from the observation that the historical annual real return on stocks hasbeen 7%, while the return to T-bills has been less than 1%. The market for thetwo classes of assets is in equilibrium in spite of this striking discrepancy.
Their solution to this equity-premium puzzle is that people consider theprobability distributions of annual returns for both assets, and weight possiblelosses 2.5 times more heavily than possible gains, as in the value function ofExhibit 2. The probability of loss is, of course, higher for stocks, and theextra weighting of negative outcomes requires the full compensation of thehigher return to match the attractiveness of a safer asset.
The cash-equivalent of a risky prospect is the sure amount of gain or lossthat is as attractive or repellant as the prospect. Most people will set a cash-equivalent of less than $400 for the gamble of Question 9.
Now answer the same question, assuming that the amount that could begained is $5,000, then $20,000. You are likely to find that your cash equivalentgrows almost proportionately with the size of the prize— although probably a littlemore slowly than the prize. A robust finding in the study of cash-equivalents isthat, when all the possible outcomes of a prospect are increased by a smallmultiple, the cash-equivalent is multiplied by almost the same factor. This
Question 8. Someone offers you a bet on the toss of a coin. If you lose, youlose $. 100. What is the minimal gain that would make this gamble acceptable?
Recommendation 5:
• Some individuals may be more loss averse than others. Assess how lossaverse your client is.
• Do not recommend very risky investments to loss-averse clients. They willaccept such investments only if they optimistically underestimate the risks
Question 9. What sure gain is just as attractive as this risky prospect— a 50%chance to gain $1,000 or a 50% chance to gain nothing?

11
observation is known as near-proportionality of risk attitudes. As we shall seelater, it is a source of some important errors in financial decision-making.
Risk proportionality is present in advisors as well. Kahneman and Thaler,in an training exercise, presented a group of financial consultants at a majorinstitution with a scenario of a wealthy family seeking global financial advice.Half of the advisors were told that the family had assets of $30 million, andyearly expenditures of $200,000. The other advisors considered a scenarioidentical in all particulars, except for assets ($6 million) and expenditures($120,000). The proportion of assets that the advisors recommended should beplaced in equities was almost exactly the same for the two scenarios: 66% forthe wealthier family, 65% for the less wealthy. When the same advisors wereasked to consider both scenarios and to determine whether they wouldrecommend the same proportion of equities to both, a substantial majoritythought they would recommend more equity holdings for the wealthier family.
The Shape and Attractiveness of Gambles
EXHIBIT 3RELATIVE ATTRACTIVENESS OF GAMBLESWITH AN EQUAL EXPECTED VALUE.
Gamble Payoff 1Probability ofPayoff 1(%) Payoff 2
Probability ofPayoff 2(%)
A $5,000 95 $105,000 5B $5,000 50 $15,000 50C $1,000 10 $11,000 90D $1,000 90 $91,000 10E $2,000 50 $18,000 50F $0 50 $20,000 50G ($2,000) 90 $118,000 10H ($5,000) 50 $25,000 50
Note: Each gamble has a similar form. For example, in gamble A, the individualis faced with a gamble that has a 95% chance of returning $5,000 and a 5%chance of returning $105,000.
All the gambles in Exhibit 3 have two possible outcomes, and all have anexpected value of $10,000, but they differ in their "shape"; the two outcomes canhave equal or very unequal probabilities, and the low-probability outcome can beeither better or worse than the more probable outcome. Some of the gamblesinvolve possible losses, others do not.
Question 10. Consider the eight gambles shown in Exhibit 3. Are they orderedin descending order of attractiveness?

12
The order of the gambles in Exhibit 3 was determined by a group offinancial analysts, who were asked to rank the gambles according to theirattractiveness to investors. Individual deviations from the average ordering weregenerally small.
It is evident in Table 1 that the ideal gamble is one that combines a highprobability of a moderate gain and a small probability of a very large gain. Lopes[1987] points out that individuals like gambles that combine a high level ofsecurity with some upside potential; these prospects are associated with muchhope and little fear. In the terms introduced the ideal gamble combines theattractiveness of a lottery ticket (due to overweighting of the small probability ofa large gain) and the attractiveness of a sure, smaller gain.
THE PURCHASE PRICE AS A REFERENCE POINT
Most readers will agree that B is more upset than A. The reason for thisintuition is that investor A will probably treat the bad news as a reduction in again, while B will experience the same news as an increased loss. Because thevalue function is steeper for losses than for gains (see Exhibit2) the difference of$10 in share price is more significant for B than for A.
As this example illustrates, we generally expect investors to be aware ofthe price at which they made a substantial investment in a stock, and to continuefor some time to use this price as a reference point. Thus, the initial pricedetermines whether selling the stock now will yield a gain or a loss.
Recommendation 6:
• Sophisticated advisors should consider using derivatives overlays that limit thedownside while retaining at least some upside participation.
• Higher net worth clients are also likely to be receptive to many of the equity-linkedstructured notes that are becoming increasingly popular with institutionalinvestors.
• For lower-end clients, equity-linked annuities are likely to be an attractive option.• Advisors should, of course, shop around and compare prices for these
instruments; the ratio of upside to downside is likely to vary substantially fromissuer to issuer.
Question 11. Investor A owns a block of a stock, which he originally bought at$100 per share. Investor B owns a block of the same stock for which she paid$200 per share. The value of the stock was $160 per share yesterday, andtoday it dropped to $150 per share. Who is more upset?

13
An important consequence of this psychological fact is known as thedisposition effect: a marked reluctance of investors to realize their losses. Forexample, consider an investor who needs cash and must sell one of two stocksthat she owns; one of the stocks has gone up and the other has gone down.Odean [1998a] studied trade records for 10,000 individual investors and showsthat investors are much more likely to sell the stock that went up.
Narrow Framing
A large majority of people (even when they have been warned to avoidnarrow framing) choose A in decision 12-1 and D in decision 12-2. In Decision12-1, the sure thing seems most attractive. In decision 12-2, the sure loss isrepellant and the chance to lose nothing induces a preference for the gamble.
Most decision makers find it natural to follow their preference on eachproblem— what could be wrong with that? Now consider the following decisionproblem.
Question 13 is easy. Everybody correctly prefers option B to option A. Ifyou return to the previous problem, however, you will quickly discover that theinferior option A is obtained by choosing A and D, in Question 12, which is what
Recommendation 7:
• Risk of loss is an important aspect of risk for most investors, but loss is a relativeterm. Determine the reference point from which a gain or loss will be calculated.• Since the disposition effect is a powerful bias, provide the client with specificreal-life examples of where it was better to “let winners run” and “cut losses.”• Before a purchase decision is made, discuss the conditions under which a salewould be made.• In the education process, be careful not to inadvertently reinforce the tendencytowards overreaction to chance events.
Question 12. Imagine that you face the following pair of concurrentdecisions. First examine both decisions, then indicate the option you prefer.
Decision 12-1: Choose between:A. A sure gain of $2,400.B. 25% chance to gain $10,000 and 75% chance to gain nothing.
Decision 12-2: Choose betweenC. a sure loss of $7,500.D. 75% chance to lose $10,000 and 25% chance to lose nothing.
Question 13. Choose between:
A. 25% chance to win $2,400 and 75% chance to lose $7,600.B. 25% chance to win $2,500 and 75% chance to lose $7,500.

14
you probably did— most people do. The dominating option B in Question 13 isobtained by conjoining the two options that most people reject in the previousformulation.
A fully rational decision-maker would adopt an inclusive view of decisions12-1 and 12-2. Indeed, this decision-maker would immediately incorporate thecombined decision into an even broader view of his financial options, alldenominated in terms of final states of wealth. An inclusive view would allow thedecision-maker to avoid the dominated option in the first pair of problems— andin many other decisions of the same type— but few humans can match that feat.
There is an abundance of real-world examples of investors consideringdecision problems one at a time instead of adopting a broader frame. Some ofthese are simply mistakes, in which the investor misses an opportunity todiversify, hedge or self-insure. In other cases, narrow framing arises from thecommon practice of maintaining multiple mental accounts . There might be abudget for current expenses; there may be a special account of saving for avacation, which is kept separate from saving for the children’s education, and soon. Attitudes toward spending, saving and risk are quite different for differentaccounts. Thus, people may simultaneously save for the children’s educationand borrow to buy a car; they may invest in a risky venture if the cash is drawnfrom a windfall gain, but not if it is drawn from the savings earmarked forretirement.
Recommendation 8:
Repeated Gambles and Risk Policies
• Encourage clients to adopt as broad a frame as possible when makinginvestment decisions.
• When developing a client’s investment policy, follow a top-down process, whichaccounts for all of the investor’s objectives simultaneously. Avoid the commonbottom-up approach in which a separate policy is set up for each investorobjective.
• Alert the client the costs of narrow frames (e.g., the costs involved withsimultaneous saving and borrowing).
• Don’t go overboard. While broad frames are preferable, using mental accounts isprobably the better option for those investors who use mental accounting as aninstrument of self-control or who would suffer undue stress from losing moneyfrom a “safe” account.
Question 14. What is your cash-equivalent for one play of the following gamble:50% chance to win $1,000 ,or a 50% chance to win nothing
Question 15. What is your cash-equivalent for five plays of the following gamble:a 50% chance to win $1,000, or a 50% chance to win nothing.

15
Most readers will set a cash equivalent for Question 15 that is more thanfive times higher than their cash equivalent in Question 14. There is a goodargument for doing so: because of statistical aggregation the second propositionis relatively less risky than the first. Now consider:
A decision-maker who frames options narrowly will not distinguishbetween Questions 14 and 16, and will set the same cash-equivalent in both.This is a potentially costly mistake, because it fails to take advantage of the factthat statistical aggregation will reduce the relative risk of a series of gambles. Adecision-maker who fails to consider future risky opportunities always acts as ifhis current decision problem is the last one he will ever make. Except for death-bed decisions, this assumption is rarely appropriate.
Most decision-makers, as we have seen, adopt narrow frames, considertheir decision problems one at a time, and are guided by the attractiveness ofthe options immediately available in making their decisions. In contrast, arational decision-maker adopts a broader frame for evaluating outcomes, andmakes particular decisions in light of a general risk policy. A sound policy alsoincorporates considerations of the frequency with which further riskyopportunities are likely to be encountered.
In general, of course, life offers many more opportunities to play smallgambles than large ones. A risk policy that is sensitive to this fact of life willtolerate substantially more risk for small gambles than for large ones. Decisionsbased on narrow frames tend to exhibit near-proportionality of risk taking; thisnormally means too little tolerance for risk with small gambles and too much risktaking with large ones.
Recommendation 9:
Question 16. You are offered one play of the gamble: a 50% chance to win$1,000, or a 50% chance to win nothing
More opportunities to play this gamble may be available later. What is your cashequivalent for the present opportunity?
• Encouraging clients to adopt and to follow a sensible risk policy is one of theimportant tasks of financial advisors.
• Part of that policy is to identify the client’s degree of aversion to the differentaspects of risk (e.g., shortfall risk, volatility, risk of loss).
• Drawing the investor’s attention to the role of statistical aggregation is perhaps thebest remedy to unreasonable loss aversion (i.e., you win a few and lose a few, butin the long run, you’ll come out ahead).

16
Short and Long Views
Investors who own risky assets must commit themselves psychologicallyto stay with their investments for some time. The amount of time probably variesgreatly for different individuals. One expression of this commitment is thefrequency with which the investor monitors the investment and checks how wellit has done. Some nervous investors check very frequently; others are lessconcerned with short-term fluctuations. As Benartzi and Thaler [1995] show thatthis characteristic of investors is reflective of their experience in the market andit may determine their preferences for risk.
For an extreme case, imagine an observer who chooses an allocation ofassets to stocks once a month, on the basis of the experience of the past monthand expectations for the immediate future. Stocks made money during 62% ofthe months over the last seventy-one years, and the average loss was 97% aslarge as the average gain. A loss-averse investor with a one-month horizon willnot like this gamble and will keep all his money in a safer asset one month at atime, forever.
Now imagine an investor who decides to be committed to an allocation forthe next five years. The review of the same seventy-one-year history will lookmuch better from the point of view of this investor: stocks made money during90% of five-year periods, and the average loss was only 63% of the averagegain.1 Even a loss-averse investor will invest in stocks, if only she is willing toadopt a long-term view.2
Benartzi and Thaler [1995] apply this idea to an analysis of financialmarkets. They assume that investors are myopically loss averse, and use theobserve difference in returns between stocks and bonds to derive the investmenthorizon for which such investors will find the two forms of investment to beequally attractive. It turns out to be about a year. One important conclusion fromtheir analysis is that an investor who considers a longer horizon will be willing totake risks that a more myopic investor will reject, even if their underlyingaversion to risk is the same.
Question 17. In what percentage of months during the last seventy-one yearsdid stocks make money? What was the ratio of the average loss to the averagegain? Also answer the same questions for the percentage of consecutive five-year periods (starting at the beginning of a month)?

17
Recommendation 10:
LIVING WITH THE CONSEQUENCES OF DECISIONS
The anticipation, diagnosis, and the management of investor discomfortand regret are central elements of responsible financial advising and thereforepart of the financial advisor’s job description. The following are some of thereasons:
1. Investment decisions have both emotional and financial consequences overtime. There is potential for worry and for pride, for elation and for regret, andsometimes for guilt (such as when one has gambled and lost money that wassaved for a purpose). A financially optimal decision (the one that a fullyrational investor would make) is of little use to an investor who cannot livecomfortably with uncertainty. And the optimal decision is certainly irrelevant ifit is one that means the investor is likely to change course at the wrong time.
2. No one likes to lose, but regret makes losing hurt more. Clearly, the losinginvestor who believes that he should have anticipated the poor performanceof his investment feels worse than if he believes the failure could not havebeen predicted.
3. Those prone to regret are also likely to blame their financial advisors for whatthey perceive as mistakes. The combination of hindsight bias and regretcreates a powerful toxin. With the benefit of hindsight all things thathappened are obvious, so why did the advisor fail to give good advice?
• Teach the investor the importance of taking a long-term view.• Many clients like to talk long term and act short term. Pay more attention to what
investors have done in the past than what they say they’ll do in the future.• Recognize early which clients will find it most difficult to stay the course and to live
with a long-term commitment.• Don’t let account statements reinforce short-term thinking. Design statements that
give less prominence to the most recent quarter, and more to what has happenedover the lifetime of the account.
• The advisor and investor should agree ahead of time on a set of procedures tofollow in the event that the investor is tempted to make a portfolio alteration basedon a hunch, or knee-jerk reactions to recent events.
• If the investor does cave in and drastically alter a portfolio based on short-termconsiderations and the trades do not turn out well, the advisor should tactfully pointout the consequences of these actions the next time the urge arises.
18
Recommendation 11:
Regrets of Omission and Commission
Almost everyone agrees that Ms. George was probably more upset thanMr. Paul, although in economic terms their outcomes are the same. Theessential difference between them is that Ms. George suffers from a regret ofcommission: she regrets something she did. In contrast, Mr. Paul suffers theweaker regret of omission: he regrets failing to do something that would havemade him better off. The difference between the two occasions for regret isrelated to the well-documented difference between losses (which people feelacutely) and opportunity costs (failures to gain), which seem to cause relativelylittle pain.
In general, people tend to ruminate on the unusual aspects of the eventsthat led to bad outcomes, and to focus their regrets on such unusual or abnormalaspects. In particular, people are most likely to regret actions (or even failures toact) that they perceive as being "out of character" for them. If they followedsomeone’s recommendations in straying from their normal path, the regret willeasily turn into resentment and anger.
• Maximize the client’s overall well-being (which includes their emotional as well asfinancial health). If you don't, then the client will ultimately thwart your attempts toundertake the steps that would maximize financial health.
• Objective factors (e.g., investment horizon, liquidity needs) as opposed toemotional factors (e.g., aversion to risk, irrational fear of certain asset classes,propensity for regret) should receive greater weight, but relative weights need notbe the same for all clients.
• In most cases, we believe that objective factors should receive the greater weight.However, recommendations designed to minimize regret and loss. are appropriateto fearful or regret-prone clients.
• When there is an extreme mismatch between the client’s goals and what actionsthe client’s emotional state will allow, the advisor should consider ending therelationship.
Question 18. Mr. Paul owned shares in company A. During the past year heconsidered switching to the stock of company B, but he decided against it. Henow finds that he would have been better off by $20,000 if he had switched tocompany B. sr. George owned shares in company B. During the past year heswitched to the stock of company A. She now finds that she would have beenbetter off by $20,000 if she had kept her shares of company B. Who is moreupset?
19
Regret and Risk-Taking
Although most people feel more regret about things they did than aboutthings they did not do, there are exceptions, and these exceptions appear to besignificant in the context of investment. Kahneman and Thaler, in anunpublished survey, asked more than a hundred wealthy investors to bring tomind the financial decision that they regretted the most, and to identify whetherthe decision they regretted had been to do something or not to do something. Asin other groups, most of these wealthy people reported that their worst regretwas about some action they had taken. The minority of individuals who reporteda regret of omission tended to have another characteristic in common: theygenerally held an unusually high proportion of their portfolio in stocks. This studyshows that people who regret the opportunities they missed tend to take morerisks than people who regret attempts that failed.
Another characteristic of risk-takers concerns their views about the role ofluck. All respondents were asked about the degree to which they attributed twooutcomes to luck: one of which they were proud, the other an occasion forregret. The risk takers tended to assign little role to luck as a cause of bothoutcomes. In the terms we have discussed, the illusion of control helps peopletake risks and live with them. A short list of questions on these topics predictsthe equity exposure of wealthy individuals with substantial accuracy— muchbetter than conventional indicators such as wealth, age, or current income.
Recommendation 12:
Question 19. Think of a bad financial decision that you made which you nowregret. Was it a decision to do something, or to refrain from doing something?What was the role of chance in the outcome?
• Encourage investors to confront their propensity for regret.• Determine the type of regret to which your client is most susceptible. Ask the
investor "Will you feel like a fool if this stock shoots up and you don’t buy it now?"or "If you buy, it goes up and then goes down, will you tell yourself I should havefollowed my instincts to get out in time after it had risen?"
• If clients are particularly prone to regret errors of commission, a radical change intheir investment policy or decisions that are out of character for them should betaken with special caution, because the client may not be able to stay the coursewhen bad things happen.
• Involve the client in the decision process so that the decisions are "ours" not theadvisor’s alone.
• Broad framing helps, because it often allows one to point out gains that offset thelosses that are the current focus of regret. Redesign statements to give greaterprominence to the performance of the overall portfolio.
20
A CHECKLIST FORFINANCIAL ADVISORS
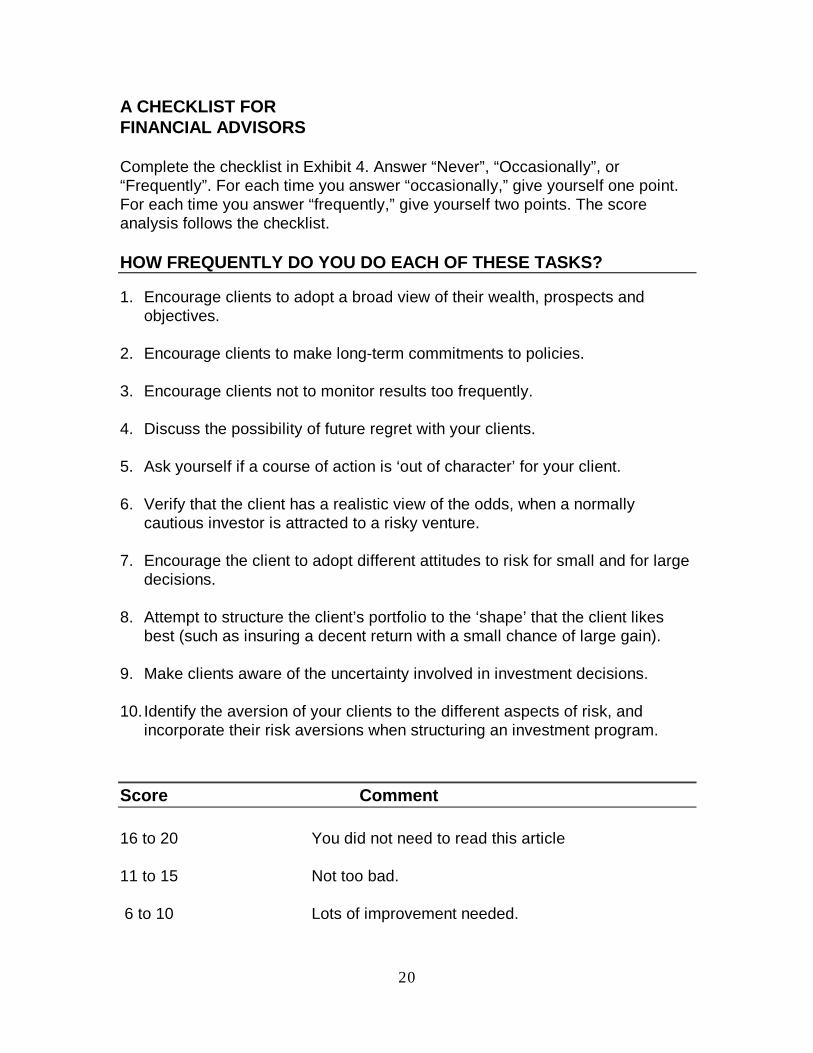
Complete the checklist in Exhibit 4. Answer “Never”, “Occasionally”, or“Frequently”. For each time you answer “occasionally,” give yourself one point.For each time you answer “frequently,” give yourself two points. The scoreanalysis follows the checklist.
HOW FREQUENTLY DO YOU DO EACH OF THESE TASKS?
1. Encourage clients to adopt a broad view of their wealth, prospects andobjectives.
2. Encourage clients to make long-term commitments to policies.
3. Encourage clients not to monitor results too frequently.
4. Discuss the possibility of future regret with your clients.
5. Ask yourself if a course of action is ‘out of character’ for your client.
6. Verify that the client has a realistic view of the odds, when a normallycautious investor is attracted to a risky venture.
7. Encourage the client to adopt different attitudes to risk for small and for largedecisions.
8. Attempt to structure the client’s portfolio to the ‘shape’ that the client likesbest (such as insuring a decent return with a small chance of large gain).
9. Make clients aware of the uncertainty involved in investment decisions.
10. Identify the aversion of your clients to the different aspects of risk, andincorporate their risk aversions when structuring an investment program.
Score Comment
16 to 20 You did not need to read this article
11 to 15 Not too bad.
6 to 10 Lots of improvement needed.

21
0 to 5 You appear to be a financial advisor in name only.
ENDNOTES
Preparation of this article was supported by Ibbotson Associates.The authors thank Paul D. Kaplan, Lori Lucas, Terrance Odean, Amy Ost and Tina Riepe fortheir helpful comments.
1This is not to say that non-proportional weightings of probabilities are the only reasonwhy people buy insurance, only that it is potentially a contributing factor.
2 Five-year results were computed using overlapping time periods (e.g., the first periodwas January 1926 to December 1930, the second was February 1926 to January 1931, and soon).
REFERENCESBenartzi, Shlomo, and Richard H. Thaler. "Myopic Loss Aversion and the Equity
Premium Puzzle." Quarterly Journal of Economics, February 1995, pp. 73-92.
Gilovich Tom, Robert Vallone, and Tversky, Amos. “The Hot Hand in Basketball:On the Misperception of Random Sequences.” Cognitive Psychology,1985, pp. 295-314.
Lopes, Lola, “Between Hope and Fear: The Psychology of Risk,” Advances inExperimental Social Psychology, 1987, pp. 255-295.
Odean, Terrance. “Are Investors Reluctant to Realize Their Losses?” HaasSchool of Business Research Program in Finance Working Paper Series,No. 269, November 1996.
----. “Do Investors Trade Too Much?” Working paper, University of California atDavis, April 1998b.
Raiffa, Howard. Decision Analysis. Reading, MA: Addison-Wesley, 1968
Tversky, Amos, and Daniel Kahneman. “Advances in Prospect Theory:Cumulative Representation of Uncertainty.” Journal of Risk and Uncertainty,1992, pp. 297-323