Concerns for Fairness and Preferences for Organic Food
24
Concerns for Fairness and Preferences for Organic Food Jae Bong Chang Ph.D. candidate and Graduate Research Assistant Department of Agricultural Economics, Oklahoma State University Jayson L. Lusk Professor and Willard Sparks Endowed Chair Department of Agricultural Economics, Oklahoma State University Contact: Jayson L. Lusk Department of Agricultural Economics, 411 Ag Hall Oklahoma State University Stillwater, OK 75078 Phone: (405) 744-7465 Fax: (405) 744-8210 E-mail: [email protected] Selected Paper prepared for presentation at the American Agricultural Economics Association Annual Meeting, Orlando, FL, July 27-29, 2008. Copyright 2008 by Jae Bong Chang and Jayson L. Lusk. All rights reserved. Readers may make verbatim copies of this document for non-commercial purpose by any means, provided that this copyright notice appears on all such copies.
Transcript of Concerns for Fairness and Preferences for Organic Food

Concerns for Fairness and Preferences for Organic Food
Jae Bong Chang Ph.D. candidate and Graduate Research Assistant
Department of Agricultural Economics, Oklahoma State University
Jayson L. Lusk Professor and Willard Sparks Endowed Chair
Department of Agricultural Economics, Oklahoma State University
Contact: Jayson L. Lusk Department of Agricultural Economics, 411 Ag Hall
Oklahoma State University Stillwater, OK 75078
Phone: (405) 744-7465 Fax: (405) 744-8210
E-mail: [email protected]
Selected Paper prepared for presentation at the American Agricultural Economics Association Annual Meeting, Orlando, FL, July 27-29, 2008.
Copyright 2008 by Jae Bong Chang and Jayson L. Lusk. All rights reserved. Readers may make verbatim copies of this document for non-commercial purpose by any means, provided that this copyright notice appears on all such copies.

1
Concerns for Fairness and Preferences for Organic Food
Abstract: Recent findings from behavioral economics suggest people are concerned about the fairness and inequality in simple distribution experiments. This study sought to determine whether such considerations also carry over to food choice. A conjoint-type experiment was developed and administered to a random sample of the U.S. population via mail survey to determine whether consumers, when purchasing food products, are concerned about the distribution of benefits across the participants in the agricultural supply chain (small farmers, large farmers, agribusiness, supermarkets, and the consumer) and to determine the extent to which the fairness models proposed in the general economics literature (and variants on these models) explain food choice. Results indicate that, aside from themselves, people prefer small farmers to receive the largest benefit from food purchase. The inequality aversion models proposed in the general economics literature do not exhibit much explanatory power, unless modified in non-trivial ways to fit the context of food. Finally, we find that preferences for distribution of benefits, along with measured beliefs about the relative distribution of benefits accruing to producers of organic and conventional foods, is a significant factor explaining consumer willingness-to-pay a premium for organic food.
A common assumption in economic analysis is that people are perfectly rational and
completely selfish. Psychologists and sociologists, however, have argued that such
assumptions fail to explain people’s actual behavior in laboratory experiments and in the
field. These observations have led economists to develop alternative models of
individual behavior. Developments in behavioral economics suggest people care about
fairness and this particular concept has been conceptualized in a variety of different ways,
e.g., see Fehr and Schmidt (1999) and Bolton and Okenfels (2000). In an abstract
experimental setting, Engelmann and Strobel (2004) show that such theories, in addition
to efficiency concerns and maximin preferences, can rationalize most people’s choices
between allocations of money to themselves and other two anonymous people. To date,
such findings have primarily been limited to abstract, experimental games. It is unclear
whether these same findings will hold up when the decision context is moved to a less
2
neutral setting such as the field or when money allocations are no longer anonymous (e.g.,
see List, 2006). Nevertheless, the findings on people’s preferences for fairness are thus
far convincing enough to raise the question of whether people’s food consumption
behavior might be driven, at least partially, by concerns about fairness and inequality.
Recent years have witnessed pronounced differentiation of food products, ranging
from organic to non-genetically modified (GM) food products. The recent growth in
food markets such as organics and farmers markets, which often claim to support small
farmers, may partially be a result of preferences for fairness. For example, it is often
argued that organic products yield larger benefits to farmers (especially small farmers) as
compared to agribusiness firms. One of key principles of organic agriculture is the
concern of fairness which emphasizes the relationships between all parties in the food
chain – farmers, processors, distributors, traders and consumers (International Federation
of Organic Agriculture Movements (IFOAM)).1
Many studies have examined consumer willingness to pay a premium for organic
products (e.g., Govindasamy and Italia, 1999; Loureiro and Hine, 2002) and have
investigated underlying consumers’ motivations for purchasing organic foods (e.g.,
Durham and Andrade, 2005; Grebitus et al, 2007; Johnston et al, 2001; Zepede and Li,
2007; Zhang et al, 2006). These studies have found that demand for organic foods is
primarly explained by environmental and health motivations (e.g., Cicia et al, 2006;
Durham and Andrade, 2005; Johnston et al, 2001) and quality and safety concerns (e.g.,
1 ‘Fairness’ has many meanings in different contexts. For example, the principle of fairness of organic agriculture defined by IFOAM argues that organic farming should provide not only to all levels and parties involved in supply and marketing channels with a good quality of life and reduction of poverty, but also to animals with the living condition that accord with natural behavior and well-being, and natural and environmental resources with socially and ecologically just manages. In this study, we focus on the former meaning which ensures equity and loyalty of benefits in the organic supply chain.

3
Naspetti and Zanoli, 2006). Despite the arguments by some that fairness and support for
small farms is a key benefit of organic products, we are unaware of any empirical
research actually linking fairness motivations with consumer demand for organic food.
In this study, we determine whether consumers, when purchasing food products,
are concerned about the distribution of benefits across the participants in the agricultural
supply chain. In addition to people’s concerns for particular participants in the supply
chain (small farmers, large farmers, agribusinesses, supermarkets, and the consumer), we
investigate the following fairness motives: a) the standard concept of distribution of
benefits represented by standard deviation, b) aversion to deviations from the average
payoff as suggested by Bolton and Okenfels (2000), c) the two-dimensional inequity
aversion model proposed by Fehr and Schmidt (1999), and d) efficiency concerns. Most
of these models entail a comparison of how well off the consumer is as compared to other
participants in the supply chain; however, in a food purchasing context, where the
consumer’s benefit is less transparent (i.e., the consumer surplus), we also investigate
variations on these models that omit the relative comparisons. In addition to these
underlying preferences, we also determine consumers’ beliefs about the distribution of
benefits for organic and conventional food and determine the extent to which preferences
for the distribution of benefits can explain preferences for organic food vs. conventional
food.
Background
It has been observed that people often act altruistically and are concerned about equity.
Evidence of such “social preferences” have been found in field (e.g., Andreoni, Erard,

4
and Feinstein, 1998; Babcock, Wang, and Loewenstein, 1996; Blinder and Choi, 1990),
in experiment (e.g., Camerer, 2003; Charness, 2004; Fehr, Kirchsteiger, and Riedl, 1993;
Güth, Schmittberger, and Schwarze, 1982), and in both environments (e.g., List, 2006;
Levitt and List, 2007). List (2006) conducted a series of gift change games in both
laboratory and filed environments to explore the behavioral differences across two
environments and found that social preferences is more likely observed in laboratory
experiments than in fields.
Such findings have led to the development of theoretical models which
incorporate preferences over the distribution of consequences or outcomes. Fehr and
Schmidt (1999) modeled fairness as self-interested inequality aversion whereby people
get disutility from unequal allocation of outcomes. Their model is two dimensional in
these sense that one parameter characterizes disutility from others being better off than
self, and another parameter that characterizes disutility from others being worse off than
self. Bolton and Ockenfels (2000) developed more parsimonious model of inequality
aversion. They assumed disutility is caused by differences between one’s own and the
average payoff. In this model, disutility from inequity is at a minimum when people
received the average payoff. Engelmann and Strobel (2004) conducted simple
distribution experiments to compare the relative performance of these fairness theories.
They compared the relative importance of efficiency concerns, maximin preferences, and
inequality aversion and showed that these motivations, together, can explain most of
people’s behavior.
In this study, we investigate consumer preferences for the distribution of benefits
across the food supply chain. Like Engelmann and Strobel (2004), we compare the

5
relative performance of fairness concerns – simple deviation, inequality aversion, and
efficiency concerns.
Methods and Procedures
To determine the effect of fairness concerns on consumers’ behavior for food products, a
mail survey was developed. The survey was designed to people to determine the extent
to which people perceive foods from alternative production practices as having different
effects on participants in the food supply chain and to provide evidence on consumers’
preferences for distribution of benefits across the marketing channel. In April 2007, a
total of 2,000 surveys were mailed to a random sample of consumers in the U.S.
Addresses and names which were randomly selected from the telephone directory were
purchased from a private company. 219 completed surveys were returned. After
accounting for undeliverable addresses, a response rate of 11.5% was achieved. Several
people did not completely answer all the questions required to complete our analysis, and
as such, our final analysis is carried out on 207 observations.
Valuation of Preferences for Foods with Fairness Concerns
To determine people’s preferences for the distribution of outcomes across the food supply
chain, a conjoint experiment was conducted where people were asked to rate the relative
desirability of several loafs of bread that differed by price and the amount of profit
resulting from the purchase that went to the following parties in the food supply chain:
small farmer, large farmer, agribusiness, and grocery stores. In the survey, small and
large farmers are defined as those farming less than 500 acres and 500 or more acres,

6
respectively, agribusiness processors represent wheat millers and bakers. In each of the
conjoint experiment questions, people were asked to indicate how likely they were (to
buy a loaf of bread at varying price and profit levels on a scale of 0 to 10 where 0 means
no chance of purchase, 50/50 chance of purchasing, and 10 meant 100% chance of
purchasing.. Prices of a loaf of bread were varied between $1.99, $2.99, and $3.99.
Profits to each link in the food production system were varied between $0.01, $0.07, and
$0.15. Each people answered 12 questions, where the prices and dollar amounts assigned
to each participant in the food supply chain were randomly varied across survey. Two
sample questions are illustrated in figure 1.
A random utility model is utilized to determine whether people care about the
distribution of benefits and which participant people most cared about including
consumers’ profit. Ignoring preferences for fairness or inequality, the utility from the
purchase a loaf of bread can be written as
(1) ,5
43210
grocery
ssagribusinefarmerlargefarmersmall
ProfitProfitProfitProfitPriceU
α
ααααα
+
+++−=
where α1 is the marginal utility of income. To determine the purely selfish value of bread
to consumers, , we need to find the Price that makes a person indifferent to buying when
all other parties in the food supply chain do not benefit (α2=α3=α4=α5=0). Given tour
scale, a person is indifferent to buying when a rating of 5 is given. Thus, willingness to
pay for a loaf of bread when α2=α3=α4=α5=0 is WTP = (α0 – 5) / α1 or α0 = α1WTP + 5.
Substituting this expression into equation (1) and re-arranging yields the following:
(2) groceryssagribusine
farmerlargefarmersmall
ProfitProfitProfitProfitUIPriceWTPU
54
321 )(
αα
ααα
++
+++−=
7
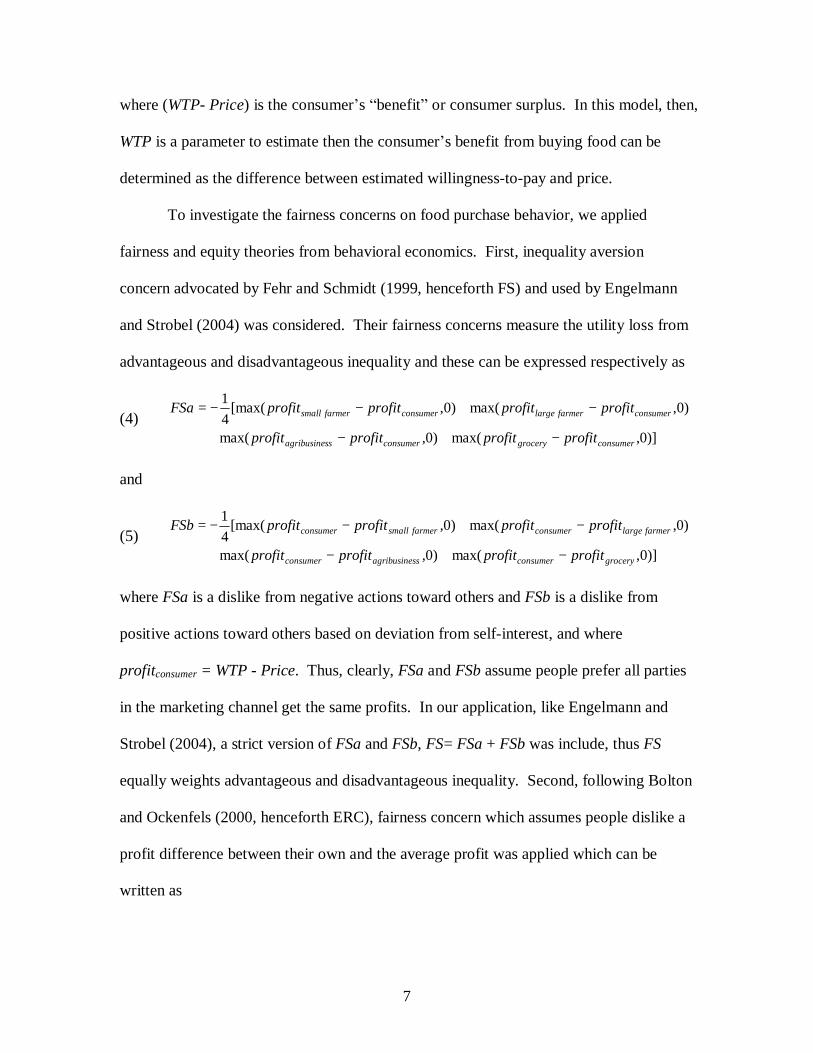
where (WTP- Price) is the consumer’s “benefit” or consumer surplus. In this model, then,
WTP is a parameter to estimate then the consumer’s benefit from buying food can be
determined as the difference between estimated willingness-to-pay and price.
To investigate the fairness concerns on food purchase behavior, we applied
fairness and equity theories from behavioral economics. First, inequality aversion
concern advocated by Fehr and Schmidt (1999, henceforth FS) and used by Engelmann
and Strobel (2004) was considered. Their fairness concerns measure the utility loss from
advantageous and disadvantageous inequality and these can be expressed respectively as
(4) )]0,max()0,max(
)0,max()0,[max(41
consumergroceryconsumerssagribusine
consumerfarmerlargeconsumerfarmersmall
profitprofitprofitprofit
profitprofitprofitprofitFSa
−+−+
−+−−=
and
(5) )]0,max()0,max(
)0,max()0,[max(41
groceryconsumerssagribusineconsumer
farmerlargeconsumerfarmersmallconsumer
profitprofitprofitprofit
profitprofitprofitprofitFSb
−+−+
−+−−=
where FSa is a dislike from negative actions toward others and FSb is a dislike from
positive actions toward others based on deviation from self-interest, and where
profitconsumer = WTP - Price. Thus, clearly, FSa and FSb assume people prefer all parties
in the marketing channel get the same profits. In our application, like Engelmann and
Strobel (2004), a strict version of FSa and FSb, FS= FSa + FSb was include, thus FS
equally weights advantageous and disadvantageous inequality. Second, following Bolton
and Ockenfels (2000, henceforth ERC), fairness concern which assumes people dislike a
profit difference between their own and the average profit was applied which can be
written as
8
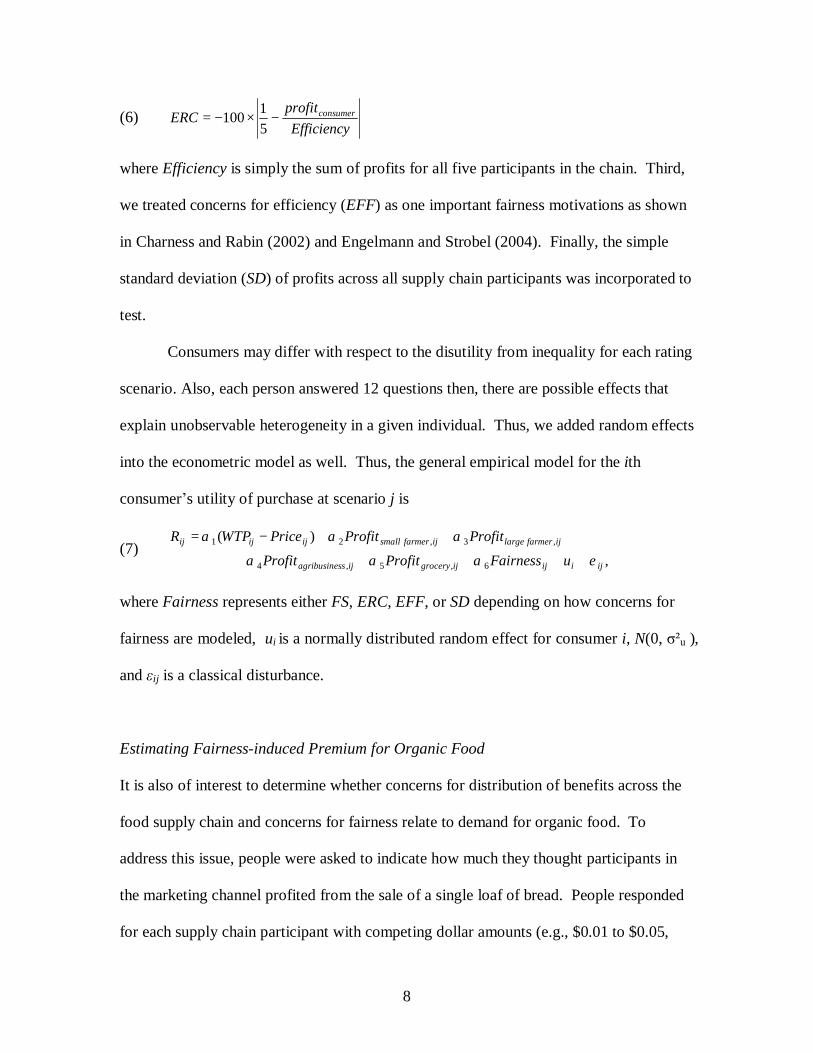
(6) Efficiency
profitERC consumer−×−=
51100
where Efficiency is simply the sum of profits for all five participants in the chain. Third,
we treated concerns for efficiency (EFF) as one important fairness motivations as shown
in Charness and Rabin (2002) and Engelmann and Strobel (2004). Finally, the simple
standard deviation (SD) of profits across all supply chain participants was incorporated to
test.
Consumers may differ with respect to the disutility from inequality for each rating
scenario. Also, each person answered 12 questions then, there are possible effects that
explain unobservable heterogeneity in a given individual. Thus, we added random effects
into the econometric model as well. Thus, the general empirical model for the ith
consumer’s utility of purchase at scenario j is
(7) ,
)(
6,5,4
,3,21
ijiijijgroceryijssagribusine
ijfarmerlargeijfarmersmallijijij
uFairnessProfitProfitProfitProfitPriceWTPR
εααα
ααα
+++++
++−=
where Fairness represents either FS, ERC, EFF, or SD depending on how concerns for
fairness are modeled, ui is a normally distributed random effect for consumer i, N(0, σ²u ),
and εij is a classical disturbance.
Estimating Fairness-induced Premium for Organic Food
It is also of interest to determine whether concerns for distribution of benefits across the
food supply chain and concerns for fairness relate to demand for organic food. To
address this issue, people were asked to indicate how much they thought participants in
the marketing channel profited from the sale of a single loaf of bread. People responded
for each supply chain participant with competing dollar amounts (e.g., $0.01 to $0.05,

9
$0.06 to $0.10, and $0.11 to $0.15) for both organic and conventional bread. Survey
participants also were asked to indicate the largest premium they were willing to pay for
organic bread over conventional bread and the price they would expect to pay for both
organic and conventional, non-organic bread.
With estimated coefficients from the conjoint task, equation (7) for both organic
and conventional bread can be written as
(8) oo
grocery
ossagribusine
ofarmerlarge
ofarmersmall
ooo
FairnessProfit
ProfitProfitProfitPriceWTPR
65
4321
ˆˆ
ˆˆˆ)(ˆˆ
αα
αααα
++
+++−=
and
(9) cc
grocery
cssagribusine
cfarmerlarge
cfarmersmall
ccc
FairnessProfit
ProfitProfitProfitPriceWTPR
65
4321
ˆˆ
ˆˆˆ)(ˆˆ
αα
αααα
++
+++−=
where o and c superscript mean organic and conventional bread. The price difference,
(Priceo – Pricec), which generates the same utility for organic and conventional bread
(i.e., co RR ˆˆ = ) is:
(10)
)](ˆ)(ˆ
)(ˆ
)(ˆ
)(ˆ[ˆ1)()(
65
4
3
21
ocogrocery
cgrocery
ossagribusine
cssagribusine
ofarmerlarge
cfarmerlarge
ofarmersmall
cfarmersmall
coco
FairnessFairnessProfitProfit
ProfitProfit
ProfitProfit
ProfitProfitWTPWTPPricePrice
−+−+
−+
−+
−−−=−
αα
α
α
αα
This is the estimated consumer premium for organic bread over conventional bread.
Equation (10) can be decomposed into two parts. First part of right hand side of equation
(10), (WTPo – WTPc), represents the premium for organic bread that results from
concerns for motivations such as the environment, health, and quality, and the second
term is the premium for organic bread that results solely from fairness and distributional

10
concerns. We can calculate the portion that how much of the organic premium can be
explained by the consumers’ fairness motivation as
(11)
)](ˆ)(ˆ
)(ˆ)(ˆ
)(ˆ[ˆ1)(
)](ˆ)(ˆ
)(ˆ)(ˆ
)(ˆ[ˆ1
65
43
21
65
43
21
ocogrocery
cgrocery
ossagribusine
cssagribusine
ofarmerlarge
cfarmerlarge
ofarmersmall
cfarmersmall
co
ocogrocery
cgrocery
ossagribusine
cssagribusine
ofarmerlarge
cfarmerlarge
ofarmersmall
cfarmersmall
FairnessFairnessProfitProfit
ProfitProfitProfitProfit
ProfitProfitWTPWTP
FairnessFairnessProfitProfit
ProfitProfitProfitProfit
ProfitProfit
portion
−+−+
−+−+
−−−
−+−+
−+−+
−−
=
αα
αα
αα
αα
αα
αα
Reconsidering Fairness Motivations
The FS, ERC, EFF, and SD were included in our estimation model as fairness concern
variables. These variables contain all profits across the marketing channel. That is, FS
and ERC measure inequality aversion between consumers’ own outcome and others. SD
measures the spread of the outcomes about the mean value and EFF is the sum of all
outcomes including consumer own payoff. Although, however, people care about the
fairness and equity in purchasing foods, people may give more weight to their own. Thus,
we excluded ‘self-interest’ value, consumers’ outcome, from each fairness concerns.
Instead of self-interest, now, FS assumes consumer dislike a profit difference to small
farmer’s profits and ERC assumes consumers like the average profit of large farmers,
agribusiness, and grocery stores to be as close as possible to small farmers’ profit. EFF
is just aggregate amount of profits of four participants, small farmers, large farmers,
agribusiness, and grocery stores and SD is the standard deviation of profits of these four
participants.

11
To test the relative performance of the fairness models, we calculate the mean
squared error (MSE) and the out-of-sample log likelihood function (OSLLF) values
(Norwood, Lusk, and Brorsen 2004). The MSE is the average of the square of the
difference between the estimated rate and the actual rate for desirability of bread. The
OSLLF ranks models by likelihood function values observed at out of sample
observations and the highest values are preferred. The sample is randomly divided by
two parts and each set of sample is used as out of sample observations. Using one set of
observation we estimate the parameters of each model and calculate the probability
density function for each model at each out-of-sample observation. To get improved
statistical fit, we use cross validation method. Thus, we use the aggregated values of
MSE and OSLLF from two sets to compare the models.
Results
Table 1 reports summary statistics and variable definitions. 38% of the survey
respondents were male and 56 years of age on average. 55% of the sample had a
bachelor’s degree and 17% had children under the age of 12 in the household.
Respondents who had near family member who farmed or ranched for a living were 15%
and population in the county in which they live was on average less than 100,000 people.
People’s beliefs about how the distribution of profits across the supply chain
differed for organic and conventional, non-organic loaves of bread are shown in table 2.
People believe small farmers, as a whole, to receive the least profit of all participants in
the supply chain and the more downstream the marketing channel, the more profit that is
made. That is, grocery store chains are believed to be more profitable than agribusiness

12
processors, who are in turn believed to be more profitable than large farmers. Results in
table 2 also suggest that people believe that all supply chain participants benefit more
from selling organics than conventional, non-organics. People believe that small farmers
are the greatest beneficiaries from selling organic by increasing their profit by $0.014 per
loaf of bread, implying a 23.73% increase over selling non-organics.
Table 3 reports estimates for four fairness models, specified as originally
proposed in the literature, with inequity concerns relating to comparisons of self to others
payoffs For each model, the self coefficient is positive, except for FS, meaning
consumers care about their own benefit or “profit.” Parameters for small farmer are all
positive and statistically significant, meaning people primarily care about the benefits to
small farmers. However, all coefficients for large farmers and grocery stores are negative,
implying consumers dislike for these participants to receive large returns. The variance
of random effect is significant in each model, indicating between-subject heterogeneity.
Although it is not statistically significant, only fairness concern of FS model provides
evidence that preferences for fairness affect consumers’ preferences for food.
Table 3 also represents the premium for organic bread over conventional bread,
which results from fairness and distributional concerns only and other motivations. The
portion of premium by fairness or equity is relatively high, and ranges from 39.7% to
43.2%. One might question why these values are so large when none of the fairness
parameters are statistically significant. The answer is because people care about small
farms (and this parameter is large) and they perceive small farms to derive a large benefit
from organic foods. Two criteria, MSE and OSLLF, are used to compare models. For
MSE values, ERC model has lowest, 9.596 and FS has highest, 9.610. For the OSLLF
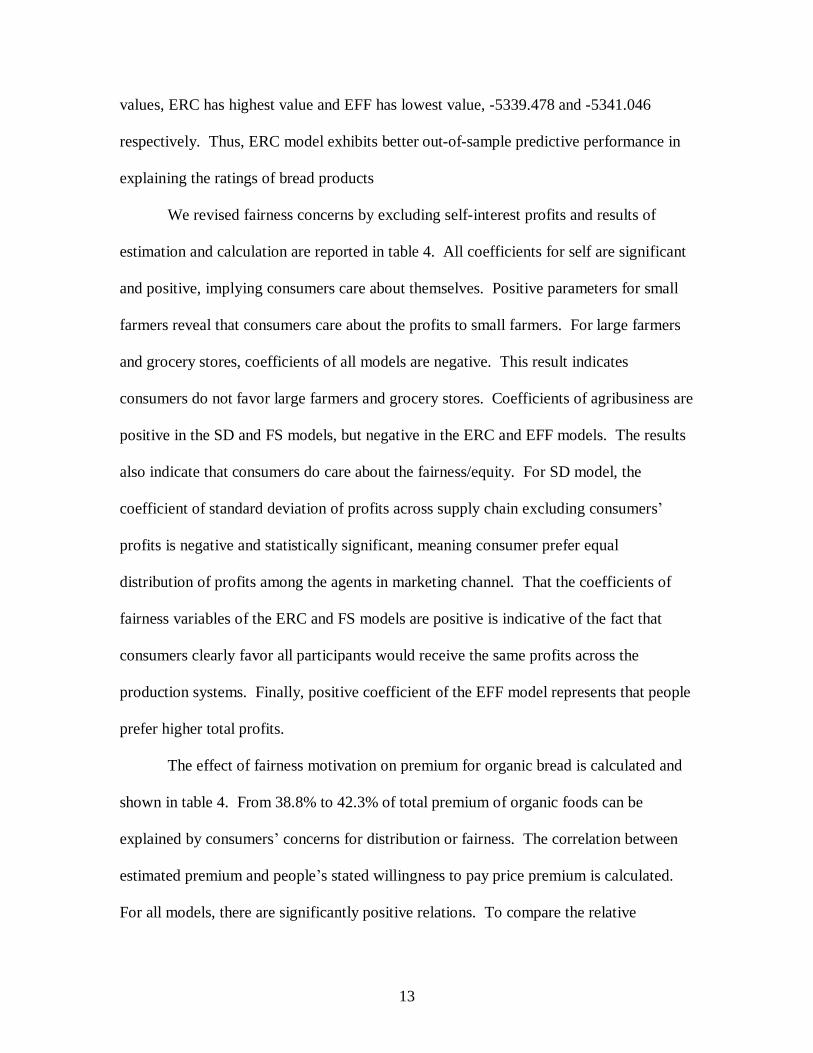
13
values, ERC has highest value and EFF has lowest value, -5339.478 and -5341.046
respectively. Thus, ERC model exhibits better out-of-sample predictive performance in
explaining the ratings of bread products
We revised fairness concerns by excluding self-interest profits and results of
estimation and calculation are reported in table 4. All coefficients for self are significant
and positive, implying consumers care about themselves. Positive parameters for small
farmers reveal that consumers care about the profits to small farmers. For large farmers
and grocery stores, coefficients of all models are negative. This result indicates
consumers do not favor large farmers and grocery stores. Coefficients of agribusiness are
positive in the SD and FS models, but negative in the ERC and EFF models. The results
also indicate that consumers do care about the fairness/equity. For SD model, the
coefficient of standard deviation of profits across supply chain excluding consumers’
profits is negative and statistically significant, meaning consumer prefer equal
distribution of profits among the agents in marketing channel. That the coefficients of
fairness variables of the ERC and FS models are positive is indicative of the fact that
consumers clearly favor all participants would receive the same profits across the
production systems. Finally, positive coefficient of the EFF model represents that people
prefer higher total profits.
The effect of fairness motivation on premium for organic bread is calculated and
shown in table 4. From 38.8% to 42.3% of total premium of organic foods can be
explained by consumers’ concerns for distribution or fairness. The correlation between
estimated premium and people’s stated willingness to pay price premium is calculated.
For all models, there are significantly positive relations. To compare the relative

14
performance of models, the model selection criteria, MSE and OSLLF, are applied again.
For the MSE values, the FS model has lowest value (9.537) and the EFF model has
highest value (9.609). For the OSLLF method, the FS model has highest and the EFF
model has lowest values, -5331.771 and -5341.041 respectively. The simple
distributional model, SD, relatively performs well (the MSE and OSLLF values are 9.557
and -5334.278 respectively). Overall, the FS model is better model of distributional
concerns.
In general, our findings suggest consumers care about themselves and small
farmers. For inequality aversion, fairness, and distribution concern, we found some
interesting results. If consumers consider the distribution of returns including their own
benefits, fairness concerns do not have important effects. However, if they take into
account only others, consumers actually care about fairness and equality issues. This
might be reasonable to explain the real consumer behavior. They care about themselves
with more weight, but also they do care about social preferences.
Conclusions
This study investigates whether people do care about the distribution of benefits across
the food marketing channel and which fairness and equity concerns may be important
stimulus of food consumption. A nationwide mail survey was conducted and a total of
207 completed data was used.
Results of this study provide that consumers place premium on organic foods and
both self-interest and fairness/equity concerns are significantly affect people’s
preferences for food choice. That is, when people make decisions in buying food they

15
care about not only themselves but also small farmers. They clearly prefer that all
participants, excluding themselves, of the food production chain get the same outcomes.
Results also suggest that the FS model which assumes that people despise a benefit
difference between any other stakeholders in the food marketing channel exhibits the best
fit to explain consumer shopping behavior. The simple distributional model which
incorporates the standard distribution performs well.
Although this study provides initial evidence and better understanding of
consumers’ food consumption with respect to fairness and equity concerns, consumer
preferences might be distorted in the hypothetical mail survey. Future research might be
necessary in non-hypothetical environments. Also, future study might focus on different
farm types, for example, farms based on location, income sources, and crops.
16
References
Andreoni, J., B. Erard, and J. Feinstein. 1998. “Tax Compliance.” Journal of Economic
Literature 36:818-60.
Babcock, L., X. Wang, and G. Loewenstein. 1996. “Choosing the Wrong Pond: Social
Comparisons in Negotiations that Reflect a Self-Serving Bias.” Quarterly Journal
of Economics 111:1-19.
Blinder, A.S., and D.H. Choi. 1990. “A Shred of Evidence on Theories of Wage
Stickiness.” Quarterly Journal of Economics 105:1003-15.
Bolton, G.E., and A. Ockenfels. 2000. “ERC: A Theory of Equity, Reciprocity, and
Competition.” American Economic Review 90:166-93.
Camerer, C.F. 2003. Behavioral Game Theory: Experiments in Strategic Interaction.
New York: Princeton University Press.
Charness, G., and M. Rabin. 2002. “Understanding Social Preferences with Simple
Tests.” Quarterly Journal of Economics 117:817-869.
Cicia, G., T. Del Giudice, I. Ramunno, and C. Tagliafierro. 2006. Paper presented at
EAAE seminar, Chania, Crete, Greece, 29 June-2 July.
Durham, C.A., and D. Andrade. 2005. “Health vs. Environmental Motivation in Organic
Preferences and Purchases.” Paper presented at AAEA annual meeting, Portland,
OR, 29 July-1 August.
Engelmann, D., and M. Strobel. 2004. “Inequality Aversion, Efficiency, and Maximin
Preferences in Simple Distribution Experiments.” American Economic Review
94:857-69.

17
Fehr, E., G. Kirchsteiger, and A. Riedl. 1993. “Does Fairness Prevent Market Clearing:
An Experimental Investigation.” Quarterly Journal of Economics 108:437-59.
Fehr, E., and K.M. Schmidt. 1999. “A Theory of Fairness, Competition, and
Cooperation.” Quarterly Journal of Economics 114:817-68.
Govindasamy, R., and J. Italia. 1999. “Predicting Willingness to Pay a Premium for
Organically Grown Fresh Produce.” Journal of Food Distribution Research
30:44-53.
Grebitus, C., C. Yue, M. Bruhn, and H. Jensen. 2007. “What Affects Consumption
Patterns of Organic and Conventional Products?” Paper presented at AAEA
annual meeting, Portland, OR, 29 July-1 August.
Güth, W., R. Schmittberger, and B. Schwarze. 1982. “An Experimental Analysis of
Ultimatum Bargaining.” Journal of Economic Behavior and Organization 3:367-
88.
International Federation of Organic Agriculture. Available at http://www.ifoam.org,
accessed 14 April 2008.
Johnston, R.J., C.R. Wessells, H. Donath, and F. Asche. 2001. “A Contingent Choice
Analysis of Ecolabeled Seafood: Comparing Consumer Preferences in the United
States and Norway.” Journal of Agricultural and Resource Economics 26:20-39.
Kahneman, D., J.L. Knetsch, and R. Thaler. 1986. “Fairness as a Constraint on Profit
Seeking: Entitlements in the Market.” American Economic Review 76:728-41.
Kahneman, D., and A. Tversky. 1979. “Prospect Theory: An Analysis of Decision under
Risk.” Econometrica 47:263-91.
18
Levitt, S.D., and J.A. List. 2007. “What Do Laboratory Experiments Tell US About the
Real World?” Journal of Economic Perspectives 71:153-74.
List, J.A. 2006. “The Behavioralist Meets the Market: Measuring Social Preferences and
Reputation Effects in Actual Transaction.” Journal of Political Economy 114:1-37.
Loureiro, M.L., and S. Hine. 2002. “Discovering Niche Markets: A comparison of
Consumer Willingness to Pay for Local (Colorado Grown), Organic, and GMO-
Free Products.” Journal of Agricultural and Applied Economics 34:477-487.
Naspetti, S., and R. Zanoli. 2006. “Organic Food Quality and Safety Perception
throughout Europe.” Paper presented at EAAE seminar, Chania, Crete, Greece, 29
June-2 July.
Norwood, F.B., J.L. Lusk, and B.W. Brorsen. 2004. “Model Selection for Discrete
Dependent Variables: Better Statistics for Better Steaks.” Journal of Agricultural
and Resource Economics 29:404-19.
Zepeda, L., and J. Li. 2007. “Characteristics of Organic Food Shoppers.” Journal of
Agricultural and Applied Economics 39:17-28.
Zhang, F., C.L. Huang, B.-H. Lin, and J.E. Epperson. 2006. “National Demand for Fresh
Organic and Conventional Vegetables: Scanner Data Evidence.” Paper presented
at AAEA annual meeting, Long Beach, CA, 23-26 July.

19
Product Definitely
Would Not Buy
Equal Chance of Buying and
Not Buying
Definitely Would
Buy Price of bread loaf: $2.99 Profit to small farmers: $0.01 Profit to large farmers: $0.15 0 1 2 3 4 5 6 7 8 9 10
Profit to agribusinesses: $0.01
Profit to grocery store: $0.15
Price of bread loaf: $1.99
Profit to small farmers: $0.15
Profit to large farmers: $0.01 0 1 2 3 4 5 6 7 8 9 10
Profit to agribusinesses: $0.01 Profit to grocery store: $0.15
Figure 1. Example conjoint experiment questions

20
Table 1. Variable Definitions and Summary Statistics Variable Definition Mean Gender 1 if female; 0 if male 0.38
(0.49)a
Age Age in years 56.15 (15.27)
Education 1 if Bachelor’s degree; 0 otherwise 0.55 (0.50)
Income Household income level 1.5 = less than $20,000; 3 = $20,000 to $39,999; 5 = $40,000 to $59,999; 7 = $60,000 to $79,999; 9 = $80,000 to $99,999; 11 = $100,000 or more
3.79 (1.64)
Family 1 if immediate family member farm or ranch for a living; 0 otherwise
0.15 (0.36)
Population Population in the county 1 = fewer than 10,000 people; 2 = between 10,000 and 99,999 people; 3 = between 100,000 and 499,999 people; 4 = more than 500,000 people
2.75 (0.93)
Child 1 if children under the age of 12 in the household; 0 = otherwise
0.17 (0.37)
Number of respondents 207 a The numbers in parentheses are standard deviations.

21
Table 2. Consumer’s Beliefs about the Distribution of Profits across the Supply Chain Resulting from the Sale of a Single Organic and Non-Organic Loaf of Bread
Supply Chain Participants
Conventional Non-Organic Organic
Difference in Organic and Non-Organic
Percent Increase from Non-Organic
to Organic
Small farmers $0.059 $0.073 $0.014 23.73%
Large farmers $0.079 $0.089 $0.010 12.66%
Agribusiness $0.089 $0.094 $0.005 5.62%
Grocery store $0.100 $0.108 $0.008 8.00%

22
Table 3. Model Estimates by Fairness Models with Self-Interest Models Variables SD ERC FS EFF Self 1.596
(1.888)a 1.280** (0.055)
-2.404 (3.343)
2.261** (0.841)
WTP 1.475** (0.145)
1.422** (0.019)
1.474** (0.145)
1.474** (0.145)
Small farmer 14.298** (0.956)
13.981** (0.824)
15.301** (1.180)
15.301** (1.180)
Large farmer -0.993 (0.936)
-1.344 (0.835) - -
Agribusiness -0.554 (1.226)
-0.465 (0.491)
0.538 (0.959)
0.538 (0.959)
Grocery -1.499 (0.975)
-1.768** (0.817)
-0.491 (1.170)
-0.491 (1.170)
Fairnessb 0.604 (4.253)
-0.001* (0.000)
3.732 (3.345)
-0.933 (0.836)
2uσ 2.729**
(0.312) 2.734** (0.312)
2.729** (0.312)
2.729** (0.312)
Portionc 0.410 0.488 0.397 0.432 Part A 0.407 0.404 0.407 0.404 Part B 0.140 0.114 0.260 0.184 Correlationd 0.324**
(0.000) -0.026 (0.727)
0.104 (0.160)
0.251** (0.001)
MSEe 9.609 9.596 9.610 9.609 OSLLFf -5340.913 -5339.478 -5341.041 -5341.046 No. of Respondents 207 207 207 207 Note: * and ** represents statistical significance at the 10% and 5% levels, respectively. a Numbers in parentheses are asymptotic standard errors. b SD = standard deviation(self, small farmer, large farmer, agribusiness, grocery store), EFF = self + small farmer + large farmer + agribusiness + grocery store, ERC = -100×|(1/5)-(self/EFF)|, FS = FSa + FSb = -1/4[max(small farmer–self, 0) + max(large farmer–self, 0) + max(agribusiness–self, 0)
+ max(grocery store–self, 0)] -1/4[max(self-small farmer, 0) + max(self-large farmer, 0) + max(self-agribusiness, 0) + max(self-grocery store, 0)]. c Numbers are the trimmed mean of portion of estimated people’s premiums on organic over conventional that result solely from fairness concerns (part B) versus other factors, such as safety, health, or environmental concerns (part A) by discarding the five lowest and highest values. d Correlation between calculated people’s premium for organic versus conventional and stated people’s willingness-to-pay for organic. e MSE is mean squared error between predicted and stated rate. f OSLLF is the estimated likelihood function value observed at stated rate values.

23
Table 4. Model Estimates by Fairness Model without Self-Interest Models Variables SD ERC FS EFF Self 1.340**
(0.058)a 1.326** (0.057)
1.333** (0.057)
1.328** (0.058)
WTP 1.587** (0.146)
1.756** (0.162)
1.644** (0.147)
1.474** (0.145)
Small farmer 14.565** (0.819)
14.280** (0.817)
14.686** (0.820)
13.815** (0.709)
Large farmer -0.854 (0.835)
-1.717** (0.864)
-0.896 (0.833)
-1.486** (0.713)
Agribusiness 1.350* (0.736)
-0.620 (0.500)
0.789 (0.574)
-0.948* (0.492)
Grocery -1.113 (0.827)
-2.040** (0.840)
-1.136 (0.823)
-1.977** (0.706)
Fairnessb -5.655** (1.764)
0.016** (0.005)
5.727** (1.406)
0.553* (0.301)
2uσ 2.741**
(0.313) 2.731** (0.312)
2.738** (0.312)
2.729** (0.312)
Portionc 0.405 0.423 0.415 0.388 Part A 0.407 0.407 0.407 0.407 Part B 0.136 0.122 0.143 0.122 Correlationd 0.300**
(0.000) 0.306** (0.000)
0.286** (0.000)
0.315** (0.000)
MSEe 9.557 9.592 9.537 9.609 OSLLFf -5334.278 -5338.985 -5331.771 -5341.041 No. of Respondents 207 207 207 207 Note: * and ** represents statistical significance at the 10% and 5% levels, respectively. a Numbers in parentheses are asymptotic standard errors. b SD = standard deviation(small farmer, large farmer, agribusiness, grocery store), EFF = small farmer + large farmer + agribusiness + grocery store, ERC = -100×|(1/4)-(small farmer/EFF)|, FS = FSa + FSb = -1/3[max(large farmer–small farmer, 0) + max(agribusiness–small farmer, 0) +
max(grocery store–small farmer, 0)] -1/3[max(small farmer-large farmer, 0) + max(small farmer-agribusiness, 0) + max(small farmer-grocery store, 0)]. c Numbers are the trimmed mean of portion of estimated people’s premiums on organic over conventional that result solely from fairness concerns (part B) versus other factors, such as safety, health, or environmental concerns (part A) by discarding the five lowest and highest values. d Correlation between calculated people’s premium for organic versus conventional and stated people’s willingness-to-pay for organic. e MSE is mean squared error between predicted and stated rate. f OSLLF is the estimated likelihood function value observed at stated rate values.