Fairchild Semiconductor International,...
65
www.fairchildsemi.com 1 Fairchild Semiconductor International, Inc. January 2010 Investor Presentation
Transcript of Fairchild Semiconductor International,...

www.fairchildsemi.com
1
Fairchild Semiconductor
International, Inc.
January 2010
Investor Presentation

www.fairchildsemi.com2
Notes on Forward Looking Statements
and Non-GAAP Measures
• Comments in this presentation other than statements of historical fact may constitute forward looking statements and are based on Fairchild’s management’s estimates and projections and are subject to various risks and uncertainties
• These risks and uncertainties are described in the Company’s periodic reports and other filings with the Securities and Exchange Commission (see the Risk Factors section) and are available at http://sec.gov and investor.fairchildsemi.com
• Actual results may differ materially from those projected in the forward looking statements
• Some data in this presentation may include non-GAAP measures that we believe provide useful information about the operating performance of our businesses that should be considered by investors in conjunction with GAAP measures that we also provide. You can find a reconciliation of non-GAAP to comparable GAAP measures at the Investor Relations section of our web site at http://investor.fairchildsemi.com
Recent additions to our website at http://investor.fairchildsemi.com
Updated Financials (through 2009 Q4, with segment revenue/gross margin breakouts)
• Quarterly Fact Sheet with 2009 Q4 highlights
• This investor presentation

www.fairchildsemi.com3
Sales were $355m, up 7% QoQ and 11% YoY... Solid performance in what is typically at flat sales quarter
Demand was higher across a broad range of end markets and regions
Under-shipped POS to reduce channel inventory 7% QoQ or >1 week to record low 8.3 weeks supply
Internal inventory decreased 3 days to 69 DOI…higher sales more than offset the $7m increase
Generated $43m in free cash flow (cash from operation – capex) due to significant cost reductions, aggressive
AR control, lower capex and strong asset management…FCF for all of 2009 is a record level $129m
Adjusted gross margin was 30.3%, up >3 points QoQ, due to better mix for new products and our focus on
higher value sockets as well as firmer pricing, lower costs and higher factory loadings
Pricing moderated to down <1% QoQ as customers are increasingly focused on product availability
Lead times extended to the low teens providing us excellent demand visibility
Analog switches, HF regulators, SPMs, HV MOSFETs along with analog power conversion products
recorded the strongest sales driven by market share gains in analog and strength in PCs, industrial and
consumer
Highlights of the Quarter – Q4 2009
www.fairchildsemi.com4
Current Status of Q1 Business
• Current shippable backlog is about $369m, up $33m from last qtr, $20m of fill QTD as of the
earnings call
• Sales expected to be roughly $370m
• Gross margin planning range is 31 – 32%
• R&D and SG&A expenses expected to be about $78m
• Interest expense forecast at roughly $3m
• Expect $2m in restructuring charges and $2m of accelerated depreciation
• We assume no obligation to update this information although we may choose to do so before
we announce Q1 results.

www.fairchildsemi.com
5
Fairchild Overview

www.fairchildsemi.com6
• Wireless Convergence and Energy
Efficiency mega-trends
• Power silicon content grows
faster than end market sales –
premium paid for efficiency
• Segment structure increases our
apps knowledge and ability to
sell solutions
• Large customers dominate these
markets and align well with
Fairchild’s strengths in SCM,
global presence and wide product
breadth
Markets That Drive Our Business

www.fairchildsemi.com7
0
200
400
600
800
1,000
1,200
1,400
1,600
1,800
2007 2008 2009 2010 2011 2012
M U
nit
s
0
500
1,000
1,500
2,000
2,500
3,000
3,500
M $
Handset Units (LHS) Voltage Regulator/Reference Sales (RHS)
Power Silicon Content GrowthHandsets
• Handset growth slows gradually as market hits 1.6B units in 2012
• Voltage regulator CAGR of 13% reflects greater power management value in the handset to support new features, better resolution displays and 3G/4G
Source: iSuppli, July 2008
6% Handset Unit CAGR
13% Voltage Reg Sales CAGR
Handset Units vs Handset Voltage Reg Sales

www.fairchildsemi.com8
Power Silicon Content Growth Notebook PC
• Notebook unit growth projected to be very strong through 2012
• Power transistor/FET sales growth inline with unit sales as advances in power management drive value through improved battery life
Source: iSuppli, July 2008
0
50,000
100,000
150,000
200,000
250,000
2007 2008 2009 2010 2011 2012
M U
nit
s
0
200
400
600
800
1,000
1,200
M $
Notebook Units (LHS) Power Transistor/FET (RHS)
18% Notebook Unit CAGR
17% Pwr Trans/FET Sales CAGR
Notebook Units vs Power Transistor/FET Sales

www.fairchildsemi.com9
Power Silicon Content GrowthAppliances
• Appliance sales growth projected to grow at 7% CAGR through 2012
• Power analog & transistor sales CAGR of 10% in the same time reflects greater content of power management silicon as manufacturers adopt variable speed motors for greater efficiency and longer service life
Source: iSuppli, July 2008
0
20,000
40,000
60,000
80,000
100,000
120,000
2007 2008 2009 2010 2011 2012
M $
0
200
400
600
800
1,000
1,200
M $
Appliance Sales (LHS) Pwr Analog & Trans Sales (RHS)
7% Appliance Sales CAGR
10% Pwr Analog & Trans Sales CAGR
Consumer Appliance Sales vs Pwr Analog & Trans Sales

www.fairchildsemi.com10
Power Silicon Content GrowthLCD TV
• LCD TVs expected to continue strong growth
• Power analog & transistor sales forecasted to grow even faster as screen resolution and backlighting requirements advance and concern over energy efficiency of these devices increases
Source: iSuppli, July 2008
0
50,000
100,000
150,000
200,000
250,000
2007 2008 2009 2010 2011 2012
M U
nit
s
0
200
400
600
800
1,000
1,200
1,400
1,600
1,800
2,000
M $
LCD TV Units (LHS) Pwr Analog & Trans Sales (RHS)
22% LCD TV Unit CAGR25% Pwr Analog & Trans Sales CAGR
LCD TV Units vs Pwr Analog & Trans Sales
www.fairchildsemi.com11
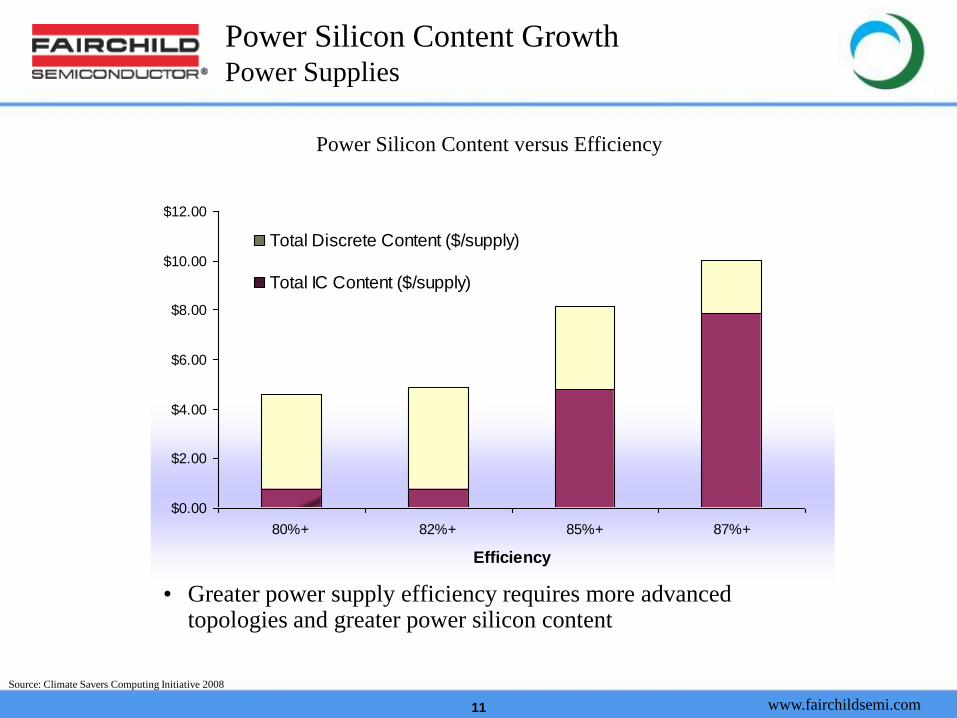
Power Silicon Content GrowthPower Supplies
• Greater power supply efficiency requires more advanced topologies and greater power silicon content
Source: Climate Savers Computing Initiative 2008
$0.00
$2.00
$4.00
$6.00
$8.00
$10.00
$12.00
80%+ 82%+ 85%+ 87%+
Efficiency
Total Discrete Content ($/supply)
Total IC Content ($/supply)
Power Silicon Content versus Efficiency

www.fairchildsemi.com12
Capitalizing on these Market Trends
• Engage with industry-leading customers in key markets to build our
applications expertise (ex. Handsets, power supplies)
• Leverage our technology leadership in analog switches, µSerDes™ and now
HF Voltage Regs to expand content and increase integration level in
handsets & ultra-portable apps
• Maintain/achieve silicon-based technology leadership in power MOSFETs
and IGBTs to deliver industry-leading margins
• Expand SPM business beyond Japan to support transition to variable speed
motors in appliances
• Greater package in-sourcing for better control and higher margins

www.fairchildsemi.com13
Acquisition Landscape
Small Privates
Carve outs
<$1B Public
Large Public
Combination
Technology/IP, Key
Personnel Talents,
Emerging Products
Easy path to profitability,
Complementary Products
Change Competitive
Structure
Enter new markets
Financial Leverage, Cost
reduction possibilities,
Complementary Products
Low, mostly around
keeping talent
Low to High, very
situation dependent
Med to High. Mgmt &
change of control issues.
Risks of culture clash
High, if priced right and
strategy fits
Pricing power elusive.
Must have strategic
synergies
Banks/sponsors and
investors who flip shares
will make the most
Reason to Pursue Integration Risk
Likelihood of Value to
FCS Shareholders
Med to High. Mgmt &
change of control issues.
Risks of culture clash
High, if priced right and
integration is crisp. Needs
strategic value beyond
beating DCF
Increasing Focus
www.fairchildsemi.com14
Fairchild Semiconductor Solid Progress, Exciting Potential
• Transition to a higher value company is well underway
• Tier 1 customer sales growing at highest rate in the company
• HF Voltage Regulators ramping rapidly
• Analog Switches growing strongly as we leverage leadership
technology
• Ramping new silicon-based MOSFET & IGBT technologies
• Segment focus drives greater application and customer intimacy –
Enables us to become a more important supplier
• Package cost reductions & tight spending controls increase confidence
in ability to achieve target model

www.fairchildsemi.com
15
Mobile, Computing, Consumer &
Communications (MCCC) Group
Overview

www.fairchildsemi.com16
MCCC Strategy Summary
Package
Technology
Leadership
Dedicated
Field
Marketing and
Applications
Teams
High Quality,
Low Cost
Manufacturing
and SCM
Focused
Product Line
Teams
Building Capabilties to enable profitable growth
Foundation
Focus
Areas
Anticipating Customer and Global Trends
MobileAnalog
Smart & Feature
Phones
ComputingMOSFET
Notebook
ConsumerMOSFET & Analog
Display
Set top Box
Networking
Focus on Mobile and
Power Efficiency
Process
Technology
Leadership

www.fairchildsemi.com17
MCCC Mobile ProductsExtend Battery Life, Enable Greater Functionality
• MOSFET
• IntelliMAX™
• Building Block Regulators
• ASSP Regulators
• Analog Switches
• USB
• µSerDes™
• Mixed Signal ASSP
Base Band and
Application Processor
PMIC
Memory
Display
Sub Display
LMU
Camera
Audio DataVideo
Display &
Camera
“uSerDes
Signal Path
Subsystems
GPSPower
SubsystemsLMU
DC:DC
RF
SD cardHDMI
Camera
DC:DC
Microphone
Power
PM
IC

www.fairchildsemi.com18
Growing Our Content in Mobile
6,000
7,000
8,000
9,000
10,000
11,000
12,000
13,000
14,000
15,000
2005 2006 2007 2008 2009 2010 2011
($M
)
$0.00
$1.00
$2.00
$3.00
$4.00
$5.00
$6.00
$7.00
2005 2006 2007 2008 2009
Addressable Content Has
Doubled in 3 years
• Signal Path
• Power Management
•Tier 1, Tier 2, China
Smart + Feature Phone SAM 15% CAGR*
Lots of room for SOM expansion
Source: iSuppli Q108
Product SAM
Smart and Feature Phone – Fairchild SAM

www.fairchildsemi.com19
Smarter Phones More Functions
• Feature & smart phone=
Fairchild opportunity
• 60% going to 80% (2011)
of phones are upgrades.
• Additional Functions are
being constrained by power
requirements.
• Top five suppliers have
>80% market share
-
200
400
600
800
1,000
1,200
2005 2006 2007 2008 2009 2010 2011
Un
its
M
Smartphone
Feature Phone
Entry Level
ULCH
PC Card
-
200
400
600
800
1,000
1,200
1,400
1,600
2005 2006 2007 2008 2009 2010 2011
Un
its
M
Music Playback
FM Radio
GPS
Application Software
Video Playback/ Streaming
Video Calling
TV Reception
Source: iSuppli Q108
><
Handset Category
Multimedia Functions

www.fairchildsemi.com20
Increasing Power Consumption
3G 3.5G Pre 4G 4G2.75G2G
GPRS
UMTS
WCDMA
TD-SCDMA
HSDPA
HSPAGSM
WiMax / WiFi
WiBroLTEEDGE
70M172M
14Mbps
384K180k56k9.6k
DATA RATE (bps)
VOICE
SMS
Internet
Browsing
Video call
Video Download
Interactive Gaming
Video Conference
Video Broadcast
VOIP
HDTV
Multiview Video
Digital TV
10hr 5hr 2:30hr 1:00hr ?hr
Talk / Connection time
www.fairchildsemi.com21
USB Switch
WLAN
Module
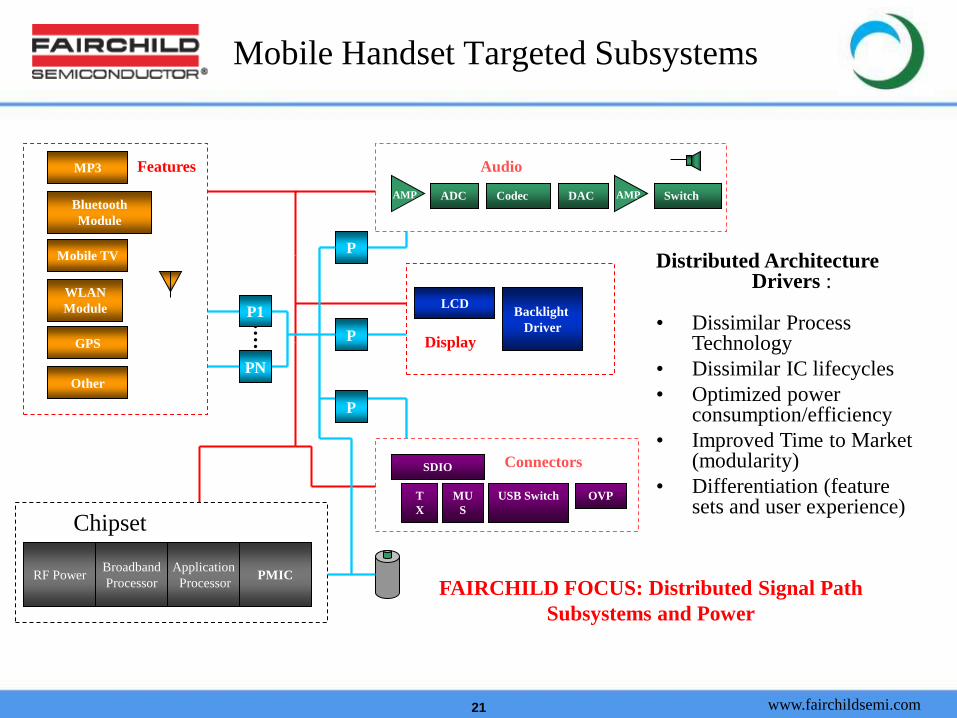
Mobile Handset Targeted Subsystems
Audio
Connectors
Distributed Architecture Drivers :
• Dissimilar Process Technology
• Dissimilar IC lifecycles
• Optimized power consumption/efficiency
• Improved Time to Market (modularity)
• Differentiation (feature sets and user experience)
FAIRCHILD FOCUS: Distributed Signal Path
Subsystems and Power
OVPT
X
MU
S
Bluetooth
Module
SDIO
SwitchDACCodecADCAMPAMP AMP
Application
ProcessorPMIC
Broadband
ProcessorRF Power
Chipset
LCDBacklight
Driver
DisplayGPS
Mobile TV
FeaturesMP3
Other
P
P
P1
PN
P

www.fairchildsemi.com22
Mobile Power Solutions
We strive for excellence in electrical performance:
• Ultra Low standby current
• Highest Efficiency
• Fast transient response
• Low EMI
• High precision regulation
• Digital control

www.fairchildsemi.com23
IP migrated from consumer Applications
Second generation portable video filter
• 3 Channel Video Filter / Driver
• Ideal for handsets, Personal media players (PMP), and other mobile platforms
Low power / small size
• 30% lower power than existing solutions
• Utilizes FCS SOI process
• <2mm2 Chip Scale Package
Supports (SD) and (ED) Enhanced Definition
(up to 480p)
Composite and Component outputs
Ultra-Portable Video Filter Driver

www.fairchildsemi.com24
USB Opportunity
USB is the standardized Data and Power Interface for Mobile
•Data: 1.5Mb/s, 12Mb/s, 480Mb/s, 4.8Gb/s
•Power: 500mA 5V
USB is the wired Interface for Mobile products
•85% of handsets today support USB
What’s changing?
•Mechanical standardization
•System repartitioning
•Migration from 2.0 to OTG and USB 3.0
The Opportunity?
•FSC provides a complete USB solution (less the integrated controller)
•Leverages the our power and signal capabilities
•Improve our ASP per port
•Integrated and Block Solutions
Micro
Mini

www.fairchildsemi.com25
Intellimax™: Features at a Glance
Under Voltage Lock
Out
Thermal Shutdown
At 140C with Hysteresis
Current Limit
w/ Fast Response Time(Polyfuse Competition Acts in
Tenths of Seconds to Seconds)
Error Flag
Current Limit
UVLO
Thermal
Switch
ESD
Protection at Electronic Speed
(response time)
3 to 5 µS For Over-current
20 ns For Hard Shorts
PowerGood
Slew rate contol and output
discharge

www.fairchildsemi.com26
2002 2003 2004 2005 2006 2007 2008 E
Mobile Strategy Drivers
1) More Functionality Power & Signal Path Optimization
2) Distributed Architecture
3) Manufacturing and Supply Chain Strengths
4) Business Model
5 yr CAGR: UP IC 38%
Mobile Customer MixMobile Revenue
LV UP MOSFET UP IC

www.fairchildsemi.com27
LV MOSFET Strategy
• Process Technology Leadership
• Package Technology Leadership
• Target Market Segments

www.fairchildsemi.com28
Technology Driven Cost Reduction
1998 2000 2002 2003 2005 2006 2007 2008 2009 2010 2011
• Process technology learning curve
rejuvenated
• Scale learning curve resumed
• Move to next-gen packages lower
costs and improves performance
• Technology leverage is greater
than scale leverage
$-
$10
$20
$30
$40
$50
$60
$70
0 1 2 3 4 5 6 7Volume Scenario
Pa
cka
ge
Co
st
Next Gen
Current Pkg
Current Pkg
Next Gen
Next Gen
Long Term Die Cost Trends
Relative Package Cost Curve

www.fairchildsemi.com29
Summary
• Our focused investment in Analog for mobile is working
• LV MOSFET is a great EPS growth driver

www.fairchildsemi.com
30
Power Conversion,
Industrial & Auto (PCIA)
Group Overview

www.fairchildsemi.com31
What Drives our Business?
“Green Power” needs will fuel future growth
FCS provides key technology solutions to both convert and save energy
• PFC, PWM IC’s, Low Resistivity MOSFET’s, and IGBT’s improve conversion efficiency in power supplies
• PSR controllers minimize standby energy consumption of small chargers
• LED power supplies and electronic ballast controllers drive Solid State and Compact Florescent Lighting
• Controllers, Modules and MOSFET’s/IGBT’s spin Brushless DC Motors
• IGBT’s and High Voltage Drivers invert power
• IGBT’s start a car and Modules steer it
We are a complete solutions provider in the segments that we serve
• Full family of products: discrete switches, and IC’s
• Leverage our packaging expertise to sell integrated modules (SPM, FPS, EZ family)
US Residential Energy Consumption per capita, 1990-2030,
source: EIA, Annual Energy Outlook 2008
(index, 1990 = 1)
0.800
0.850
0.900
0.950
1.000
1.050
1.100
1990 2000 2010 2020 20302006
Projected consumption with
2008 technology
Projected consumption with
improved technology
Historical consumption
www.fairchildsemi.com32
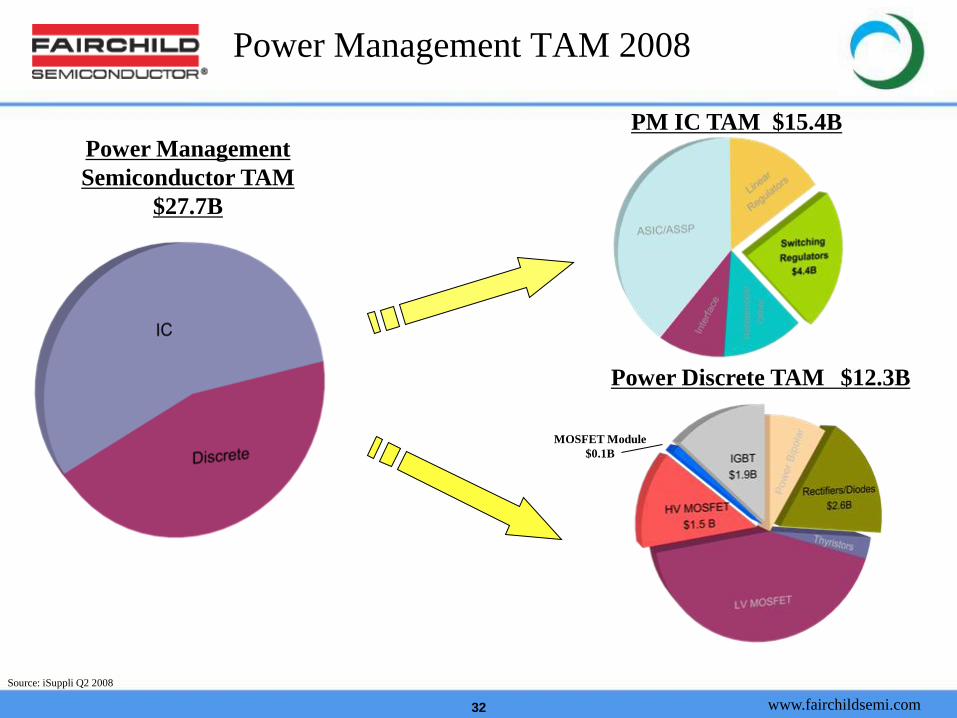
Power Management TAM 2008
Source: iSuppli Q2 2008
MOSFET Module
$0.1B
Power Management
Semiconductor TAM
$27.7B
PM IC TAM $15.4B
Power Discrete TAM $12.3B

www.fairchildsemi.com33
PCIA SAM by Segment
2008 = $7.6B
2011 = $9.8B
CAGR = 9%
• Great combination of markets where there is synergy between the product lines
• Energy efficiency will drive growth
– IGBT, SPM markets expected to have double digit CAGR over next 4 years
– Computing power supply IC CAGR expected to be >20% even though units will only
grow by 8.5%Source: iSuppli, IMS, Displaybank, Dataquest, Fuji Chimera Institute, Darnell, Fairchild

www.fairchildsemi.com34
PCIA Snapshot
Estimated 2008 PCIA
Revenue by Region
Estimated 2008 PCIA
Revenue by Segment

www.fairchildsemi.com35
Product Line Focus
HV Discretes
• Focus on margins has driven significant improvements
• Margin and revenue growth will be driven by new products and operating leverage
Automotive
• Capitalize on other FCS technology developments
Power Conversion
• System General gaining momentum
• Significant cost reduction opportunities
• New products and applications knowledge driving increased value
Transition to a segment based structure while retaining product line expertise
• Sales aligning to this structure
• Common customer and application base

www.fairchildsemi.com36
Energy Efficiency Will Fuel
Our Growth
• In desktop computing total units are projected to be flat, but more demanding efficiency
requirements (80+ 82+ 85+ 87+) drive newer technology and increased content
• For lighting, LED’s and CFL’s are expected to grow substantially, while more traditional
technologies will shrink or maintain share
LED Incandescent Halogen CFL LF
Lighting efficiency
(lm/W)59 10 20 50 75
Efficiency of
lighting equip (%)80~90 30~50 30~50 50~60 50~70
Total efficiency
(lm/W)42 4 8 23 38
Life expectancy
(Hr)10K~50K 1k 3k 10k 15k
(Source : LEDs Magazine, 2007 May)
LED Incandescent Halogen CFL LF
Lighting efficiency
(lm/W)59 10 20 50 75
Efficiency of
lighting equip (%)80~90 30~50 30~50 50~60 50~70
Total efficiency
(lm/W)42 4 8 23 38
Life expectancy
(Hr)10K~50K 1k 3k 10k 15k
(Source : LEDs Magazine, 2007 May)
Efficiency (%) 80+ 82+ 85+ (1) 85+ (2) 87+
Total IC ($/set) 0.78 0.78 1.43 4.80 7.90
Total Discrete ($/set) 3.85 4.09 6.13 3.35 2.15

www.fairchildsemi.com37
Improving Efficiency Through SiliconPC Power Supply Example
Fairchild is positioned to provide the total solution
+12VAC Input
+3.3V
+5V
PFC +
PWM
SR + MOS
SR + MOS
AHB
+
MOS
Buck +
MOSx2
Integrated Synchronous Rectifier (SR) IC
improves efficiency +2% over traditional
Schottky diodes
Integrated DC/DC Buck regulator IC
improves efficiency +1.5% efficiency
over traditional (Mag Amplifier + Diode)
Integrated
Asymmetrical Half
Bridge (AHB) IC
improve efficiency
+1.2% over
traditional Double
Forward topology
PFC+PWM combo IC
improves efficiency
+1% at light load
condition
Total efficiency improvement = +5.7%
+5VStandby
Innovative FPS IC reduces standby
power below 100mW with no load

www.fairchildsemi.com38
Complexity Increases with PowerWe Provide Solutions Across this Range
watts
100
500
1000
50
10
Induction
Heating
Complexity
Desk Top
PC
Game
Console
Server/
Telecom
Air-Con/
Inverters &
Indus system
Cell Phone
Chargers
DVD/STB
Consumer
CFL
Lighting
LFL
Lighting
LED
Lighting
HID
Lighting
LCDTV
(> 46”)
PDP TVWashing
Machine
Note PC,
LCDTV
(< 45”)
Flyback QR Flyback /
Forward
Resonant
LLC
Soft
Switching
Multi-phase
Bridge
Hig
h E
fficiency
So
lutio
ns -
5W
to K
Ws
www.fairchildsemi.com39
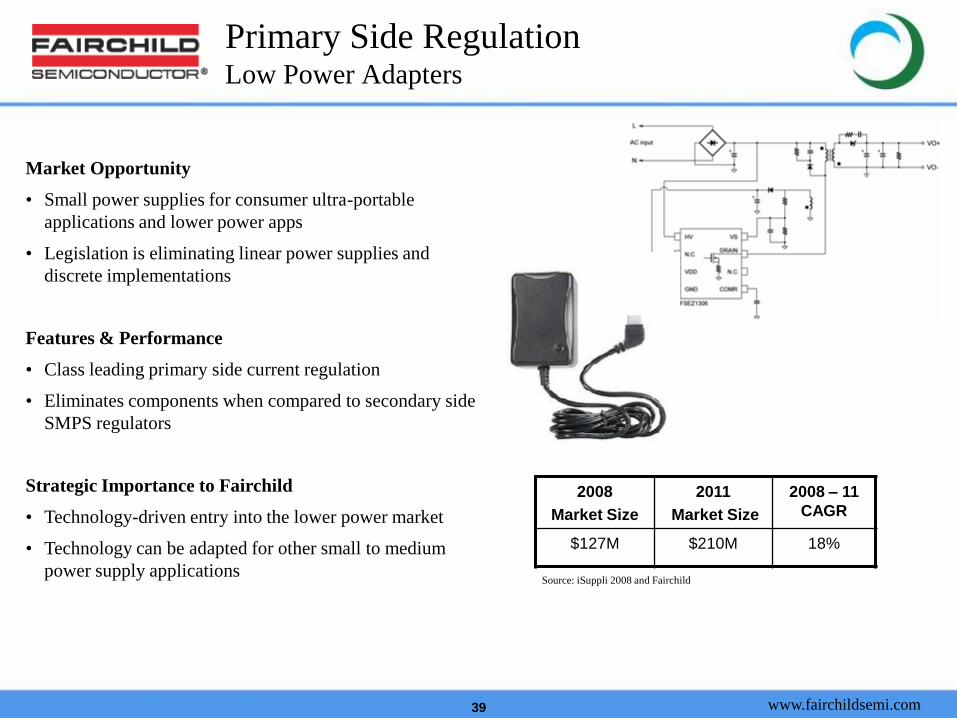
Primary Side RegulationLow Power Adapters
2008
Market Size
2011
Market Size
2008 – 11
CAGR
$127M $210M 18%
Market Opportunity
• Small power supplies for consumer ultra-portable
applications and lower power apps
• Legislation is eliminating linear power supplies and
discrete implementations
Features & Performance
• Class leading primary side current regulation
• Eliminates components when compared to secondary side
SMPS regulators
Strategic Importance to Fairchild
• Technology-driven entry into the lower power market
• Technology can be adapted for other small to medium
power supply applicationsSource: iSuppli 2008 and Fairchild

www.fairchildsemi.com40
LCD TV
FPS ($0.50-$1.50)
T-series & E-series
PFC IC ($0.20-$0.50)
CRM/CCM PFC IC
Interleaved PFC IC
BACKLIGHT IC ($0.30-$0.90)
CCFL PP/PN/NN Half bridge
CCFL PN Full bridge
LED Backlight control IC
BACKLIGHT MOSFET ($0.40-$0.90)
HV Ultra FRFET™ & FRFET®
LV MOSFET
PFC DIODE ($0.15-$0.30)
Hyperfast II & Stealth II
Total FSC Content $1.85-$5.10
PFC MOSFET ($0.30-$1.00)
SupreMOS™, SuperFET™
& UniFET™
SAM: $257M in 2008
$335M in 2011
CAGR: 9%
Source: Displaybank, Dataquest, Fuji Chimera Institute

www.fairchildsemi.com41
HV MOSFET – SupreMOSTM
PFC Switching
Source: iSuppli 2008
2008
Market Size
2011
Market Size
2008 – 11
CAGR
117M units 208M units 21%
AC Input
PFC
HV BLU
Switch
DC-DC
HV BLU
Driver
& FB
[LCD TV PSU & BLU board]
Market Opportunity
• Address the PFC switching needs in the LCD
TV market and other high power/efficiency
applications such as Servers
Features and Performance
• World-class deep Trench Super-junction
technology
Strategic Importance to Fairchild
• Next generation super-junction MOSFET
improves both cost and performance
www.fairchildsemi.com42
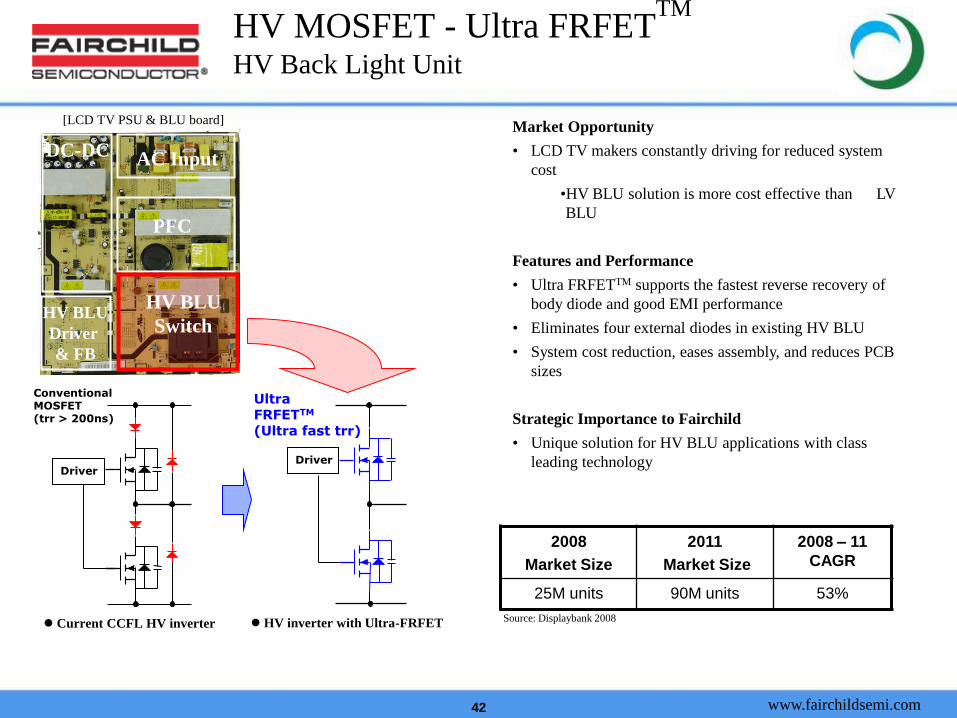
HV MOSFET - Ultra FRFETTM
HV Back Light Unit
Source: Displaybank 2008
2008
Market Size
2011
Market Size
2008 – 11
CAGR
25M units 90M units 53%
ConventionalMOSFET(trr > 200ns)
UltraFRFETTM
(Ultra fast trr)
AC Input
HV inverter with Ultra-FRFET Current CCFL HV inverter
DriverDriver
PFC
HV BLU
Switch
DC-DC
HV BLU
Driver
& FB
[LCD TV PSU & BLU board]Market Opportunity
• LCD TV makers constantly driving for reduced system
cost
•HV BLU solution is more cost effective than LV
BLU
Features and Performance
• Ultra FRFETTM supports the fastest reverse recovery of
body diode and good EMI performance
• Eliminates four external diodes in existing HV BLU
• System cost reduction, eases assembly, and reduces PCB
sizes
Strategic Importance to Fairchild
• Unique solution for HV BLU applications with class
leading technology
AC Input

www.fairchildsemi.com43
Advanced Packaging Solutions
Extend Our Reach

www.fairchildsemi.com44
BLDC Fan Motor
Drive
Compressor
Drive
Motion-SPM™
Market Opportunity
• Home appliance market is rapidly adopting inverter
technology to improve efficiency
Features and Performance
• Simple to Design
–Optimized footprint
–Built-in protection functions
–Matched component performance
• Simple to Assemble
–Reduced components
–Increases productivity and reliability
–Eliminates additional insulation material
Strategic Importance to Fairchild
• Key component in an inverter system
• Value solutions
• Growth driver for HV organization
2008
Market Size
2011
Market Size
2008 – 11
CAGR
$238M $408M 20%
Source: IMS, Fuji Chimera Institute, Fairchild

www.fairchildsemi.com45
Smart Power Integrated ModuleSystem Air Conditioning
Market Opportunity
• New energy regulations driving rapid increase
in variable speed drives
Features and Performance
• 3 phase IGBT inverter using HVIC reduces
auxiliary power parts
• Higher reliability
• Advanced IGBT technology
• Built-in sensing
Strategic Importance to Fairchild
• Increased functionality evolution of SPM
• Flexible structure easily modified
2008
Market Size
2011
Market Size
2008 – 11
CAGR
$42M $97M 32%
Source: IMS, Fuji Chimera Institute, Fairchild

www.fairchildsemi.com46
Engine Control
Ignition
Fuel Injection
Glow Plug
BLDC Motor Control
EPS
Cooling
Pumps
Body Load Control
HID
PTC-Heater
HEV
Full Hybrid
Mild Hybrid
Micro Hybrid (Start/Stop)
Transmission Control
Engine Control
Ignition
Fuel Injection
Glow Plug
BLDC Motor Control
EPS
Cooling
Pumps
Body Load Control
HID
PTC-Heater
HEV
Full Hybrid
Mild Hybrid
Micro Hybrid (Start/Stop)
Transmission Control
Automotive
Power Modules ($8.00 – $14.28)
• EPS/EHPS Modules
• Auxiliary VSD’s
Discrete Power($0.07 – $0.35)
• Low Voltage MOSFET’s
• Mid Voltage MOSFET’s
• High Efficiency Diode
Ignition ($0.30 – $4.00)
• Current Limit IGBTs
• Smart IGBT
SAM: $2.1B in 2008
$2.8B in 2011
CAGR: 10%
Functional Drivers ($0.30 – $2.15)
• Smart Switches
• Gate Drivers
• Motor Controls
Source: IMS Research 2007, Fairchild
2003 2004 2005 2006 2007 2008 YTD
Total Revenue Gross Profit%

www.fairchildsemi.com47
Advanced Automotive Power ModulesElectric Power Steering (EPS/EHPS) Modules
2008
Market Size
2011
Market Size
2008 – 11
CAGR
$71.1M $118.2M 19%
Source: IMS Research, 2007
Market Opportunity
• Automotive auxiliaries are being electrified for
improved MPG and CO2 emissions
Features & Performance
• Inverter module with enhanced electrical and thermal
characteristics enabling higher power handling and
improved EMI
• Compact design, integrating MOSFET’s, filters and
sensors
• EPS module enables customer to provide higher
torque output, expanding the field of application of
their EPS systems.
Strategic Importance to Fairchild
• EPS use increasing and moving into heavier vehicles,
requiring module functionality
• Leverage SPM® technology where its added value is
the highest
www.fairchildsemi.com48
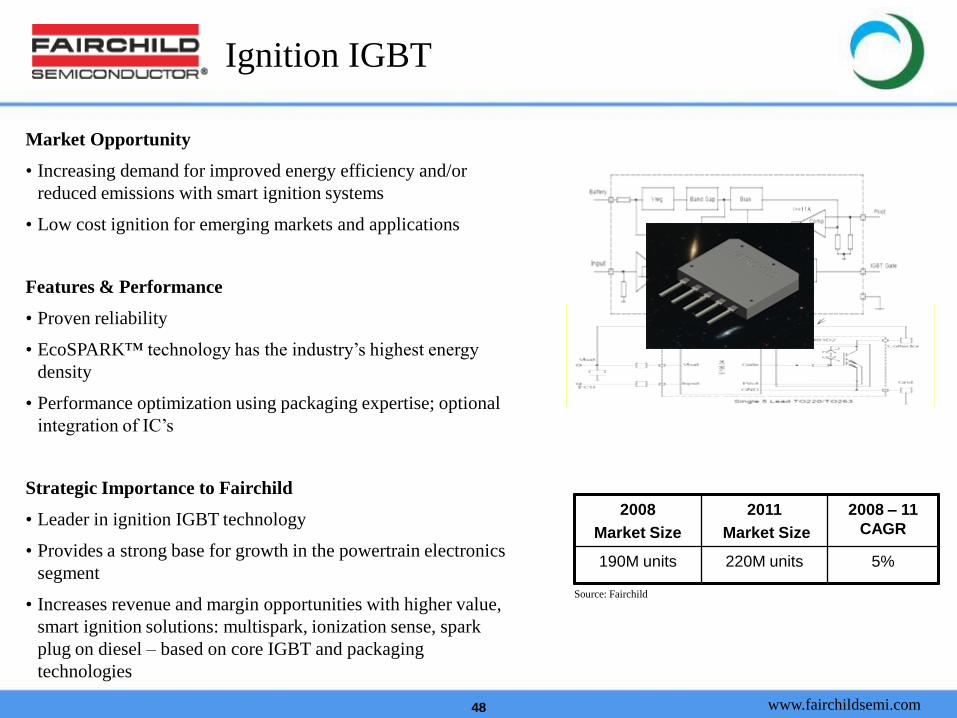
Ignition IGBT
Market Opportunity
• Increasing demand for improved energy efficiency and/or
reduced emissions with smart ignition systems
• Low cost ignition for emerging markets and applications
Features & Performance
• Proven reliability
• EcoSPARK™ technology has the industry’s highest energy
density
• Performance optimization using packaging expertise; optional
integration of IC’s
Strategic Importance to Fairchild
• Leader in ignition IGBT technology
• Provides a strong base for growth in the powertrain electronics
segment
• Increases revenue and margin opportunities with higher value,
smart ignition solutions: multispark, ionization sense, spark
plug on diesel – based on core IGBT and packaging
technologies
2008
Market Size
2011
Market Size
2008 – 11
CAGR
190M units 220M units 5%
Source: Fairchild

www.fairchildsemi.com49
Improving Margins Through TechnologyHV MOSFET Area x RDS(on) Trend
• 5% annual resistivity reduction
in planar devices
• Significant change with
introduction of charge balance
devices
• Costs roughly scale with Area x
RDS(on)
Charge Balance
Technology
Planar
Technology1995 1997 1999 2001 2003 2005 2007 2009
Introduction Year
Planar
Charge Balance

www.fairchildsemi.com50
Summary
• Energy efficiency demands will drive demand for our products
• The new segment based structure is optimized to capitalize on these
opportunities at our power supply customers
• Revenue and margin progression will occur through a combination
of new product/technology introductions and cost reductions
• Automotive is positioned for profitable growth

www.fairchildsemi.com
51
Finance Overview

www.fairchildsemi.com52
Financial Highlights
• Focus on asset management, cash generation and maintaining a lean
cost structure
• Adj GM at high end of guidance range at 30.3%
• 80% fall through of incremental sales to gross profit
• Internal inventory decreased 3 days QoQ to 69 DOI…higher sales
more than offset $7m increase
• Channel inventory decreased 7% QoQ, record low 8.3 weeks
• Other working capital reductions and aggressive cost controls
enabled $43m in FCF in Q4 and a record $129m in 2009

www.fairchildsemi.com53
Adjusted Revenue & GM%
0.0%
5.0%
10.0%
15.0%
20.0%
25.0%
30.0%
35.0%
200.0
250.0
300.0
350.0
400.0
450.0
500.0
Gro
ss M
argi
n %
Re
ven
ue
(M$
)

www.fairchildsemi.com54
8 Qtr Rolling Adj. Revenue & GM%
0.0%
5.0%
10.0%
15.0%
20.0%
25.0%
30.0%
35.0%
200.0
250.0
300.0
350.0
400.0
450.0
500.0
8 Q
tr R
olli
ng
Gro
ss M
argi
n %
8 Q
tr R
olli
ng
Re
ven
ue
(M
$)
www.fairchildsemi.com55Note : Includes Equity Comp
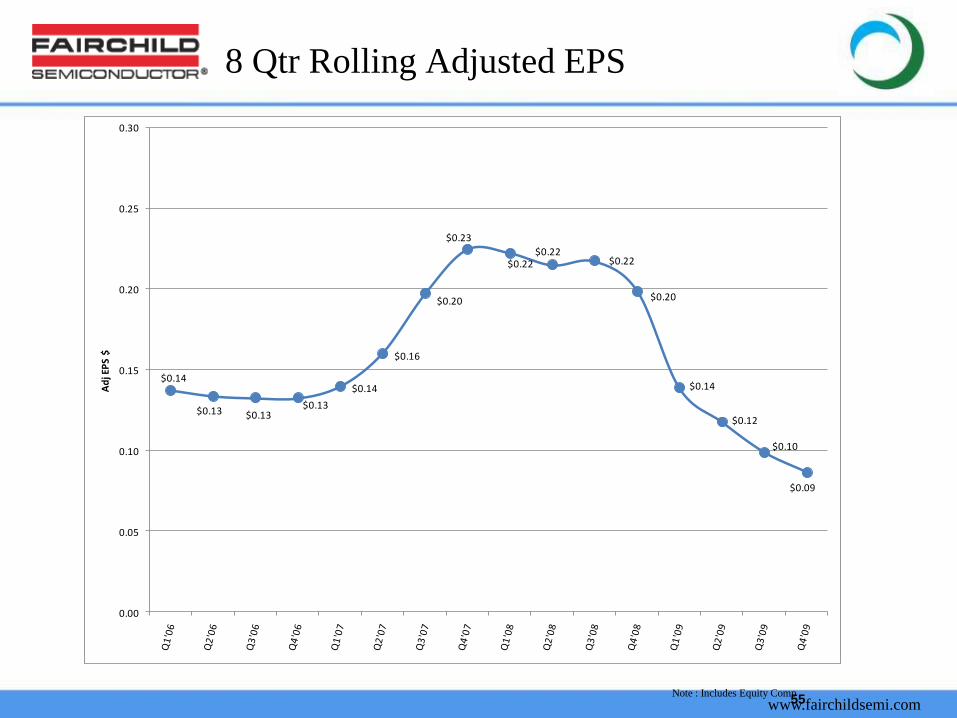
8 Qtr Rolling Adjusted EPS
$0.14
$0.13 $0.13 $0.13
$0.14
$0.16
$0.20
$0.23
$0.22 $0.22 $0.22
$0.20
$0.14
$0.12
$0.10
$0.09
0.00
0.05
0.10
0.15
0.20
0.25
0.30
Ad
j EP
S $

www.fairchildsemi.com
56
Increasing Gross Margins

www.fairchildsemi.com57
Gross Margin ImprovementKey Drivers
Growth of new product families with higher margins
• µSerDes™, Analog Switches, HF Voltage Regulators, System General, SupreMOS, integrated power systems (SPM), IntelliMAX™, DrMOS, Digital Power
Divest / Reduce low margin business
• Divest = Motor ICs, LEDs, RF
• Reduce = Planar MOSFETs, small signal and bipolar transistors
Manufacturing cost reductions and product redesigns
• Package in-sourcing
• 8” upgrade in Maine
• Fab process upgrades/shrinks for HV & LV MOSFETs, IGBTs and Power Conversion

www.fairchildsemi.com58
Margin Drivers
Growing Profitable New Product Families
MCCC Growth Drivers
-Switches USB and multimedia applications
-High Frequency Voltage Regulators Highly efficient regulators for handsets
-Power Trench Technology Potentially best figure of merit for low
voltage applications
-µSerDes™ Proliferation to top 5 cell phone suppliers
-Digital Power Flexible power mgmt for high-end POL and
power supply applications
PCIA
-Power Conversion System General acquisition, driver for
energy efficiency
-SupreMOS/FS IGBT Potentially best figure of merit for high
voltage applications
-HF Voltage Regulators New high performance platform addresses
emerging needs
-SPM Highly efficient package-level integrated
power management solutions

www.fairchildsemi.com59
$0
$200
< 0 0 > 10 10 > 20 20 > 30 30 > 40 40 > 50 50 >
Mil
lio
ns $
0%
40%
% o
f T
ota
l
Margin Drivers
Shifting Our Margin Profile
Decrease Population I
• Minimize through lead time
• Obsolete / exit / divest
• Cost reductions / product
redesigns
Manage Population II
• Cost reduction
• Pricing
• Technology migrations
Grow Population III
• New product design wins
• Responsive supply chains
Low Margin Average Margin High Margin
www.fairchildsemi.com60
Margin DriversProcess Upgrades will Drive Front End Savings
• Maine 8” conversion will increase die capacity by ~70% with
minimal impact to fixed and variable overhead
• Migration of System General and other Bucheon processes to
Maine fab on 0.5µm or lower will increase Power Conversion
margins by ~600 bps
• SupreMOS and FS Trench IGBT processes in Bucheon drive
30% to 40% die shrink while maintaining RDS on performance
• PT7 & PT9 processes in Salt Lake to increase die per wafer by
30% to 45%

www.fairchildsemi.com
61
Strong Cash Flow and Balance Sheet
www.fairchildsemi.com62
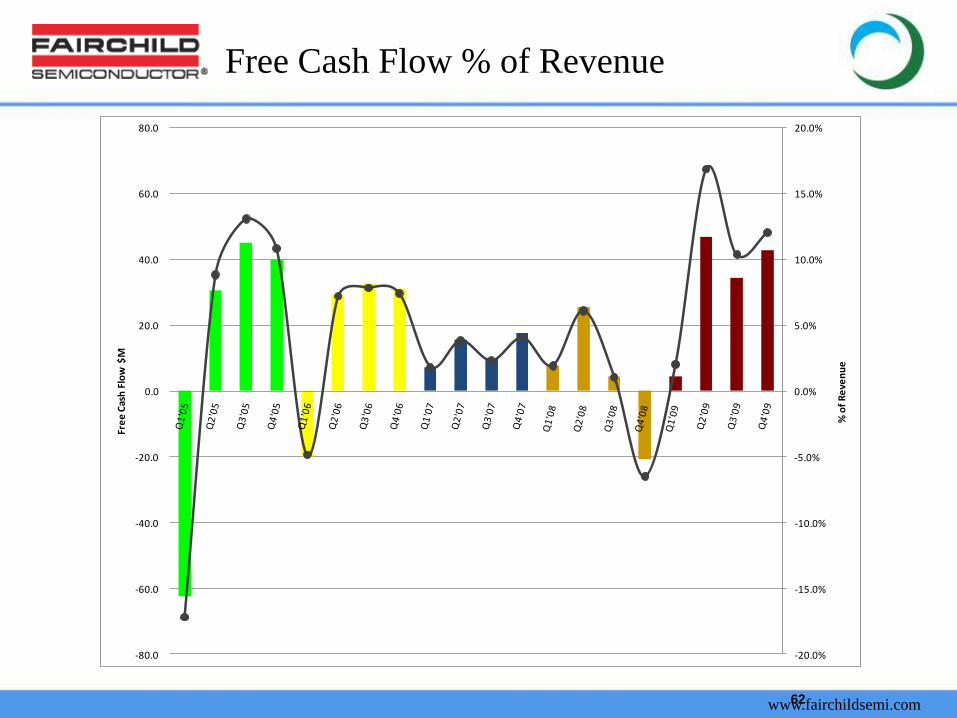
Free Cash Flow % of Revenue
-20.0%
-15.0%
-10.0%
-5.0%
0.0%
5.0%
10.0%
15.0%
20.0%
-80.0
-60.0
-40.0
-20.0
0.0
20.0
40.0
60.0
80.0
% o
f R
eve
nu
e
Fre
e C
ash
Flo
w $
M

www.fairchildsemi.com63
8 Qtr Rolling Free Cash Flow
-10.0
-5.0
0.0
5.0
10.0
15.0
20.0
25.0
30.0
35.0
40.0
8Q
tr R
olli
ng
Fre
e C
ash
Flo
w M
illio
ns
$

www.fairchildsemi.com64
Fairchild: The Power Franchise®
• Better cycle management has enabled rapid inventory correction and solid asset management results through a very challenging macro-economic environment
• Top priority going forward is margin growth through:
• Profitable sales growth in analog and functional power products
• Better mix of products due to more new products and reduction/divestiture of low margin business
• Product cost reduction driven by increased A&T in-sourcing, fab shrinks, fab consolidation and new processes
• Reduced D&A due to consolidations and long term lower CAPEX spending
• Structural changes to reduce OPEX and improve earnings
• Expect improved cash flow as we improve EBIT and maintain low CAPEX
We’re making solid progress at transitioning Fairchild to be a premier power management company…not only in sales but also profitability!

www.fairchildsemi.com
Follow us on Twitter twitter.com/fairchildSemi
View product and company videos, listen to podcasts and comment on our blog @ www.fairchildsemi.com/engineeringconnections
Visit us on Facebook @ www.facebook.com/FairchildSemiconductor