Diabetes: controversies and newsedg1.vcall.com/docs/170278/New/2.pdf · Diabetes: Diagnosis,...
107
TURNING PEPTIDES INTO DRUGS Diabetes: Classification, management and treatment goals – Controversies and News by/ Dr. Leonid Poretsky, MD, Chief, Division of Endocrinology and Metabolism; Director, Gerald J. Friedman Diabetes Institute Capital Markets Day, NYC ─ 29 November 2012
Transcript of Diabetes: controversies and newsedg1.vcall.com/docs/170278/New/2.pdf · Diabetes: Diagnosis,...

T U R N I N G P E P T I D E S I N T O D R U G S
Diabetes: Classification, management and treatment goals – Controversies and News by/ Dr. Leonid Poretsky, MD, Chief, Division of Endocrinology and Metabolism; Director, Gerald J. Friedman Diabetes Institute
Capital Markets Day, NYC ─ 29 November 2012

Diabetes:Diagnosis, Classification, Management
Controversies and News
Leonid Poretsky, MDChief, Division of Endocrinology and MetabolismDirector, Gerald J. Friedman Diabetes InstituteGerald J. Friedman Chair in EndocrinologyProfessor of Medicine, Albert Einstein College of Medicine
Bianca Alfonso, MD Endocrinology Fellow, Year 1
Marina Krymskaya, ANP, CDE Diabetes Nurse Educator
Jill Gregory Medical Illustrator

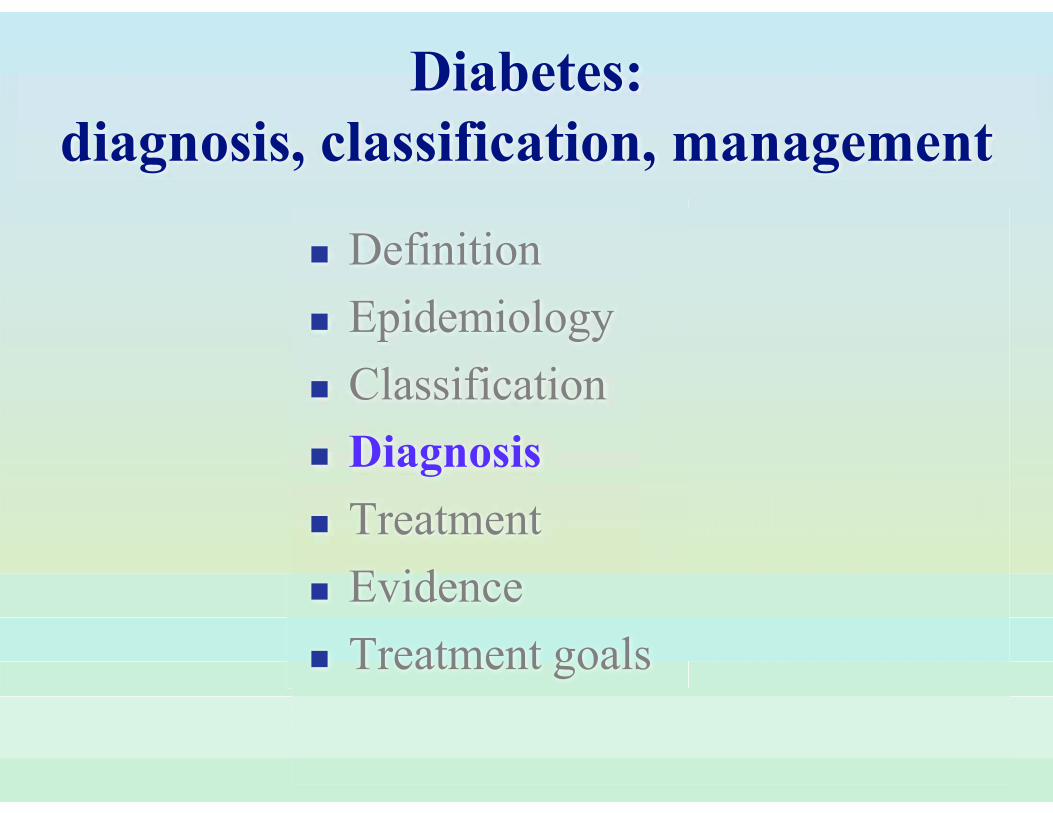
Diabetes:diagnosis, classification, management
� Definition� Epidemiology� Classification� Diagnosis� Treatment� Evidence� Treatment goals

� Definition� Epidemiology� Classification� Diagnosis� Treatment� Evidence� Treatment goals
Diabetes:diagnosis, classification, management

Definition
� Diabetes mellitus is a group of metabolic diseases characterized by hyperglycemia resulting from defects in insulin secretion, insulin action, or both.*
� The name 'diabetes mellitus' derives from:Greek: 'diabetes' – “siphon” or “to pass through”Latin: 'mellitus' – “honeyed” or “sweet”**
* Diagnosis and Classification of Diabetes Mellitus. ADA 2009.** http://science.jrank.org/pages/2044/Diabetes-Mellitus.html

� Definition� Epidemiology� Classification� Diagnosis� Treatment� Evidence� Treatment goals
Diabetes:diagnosis, classification, management
Epidemiology
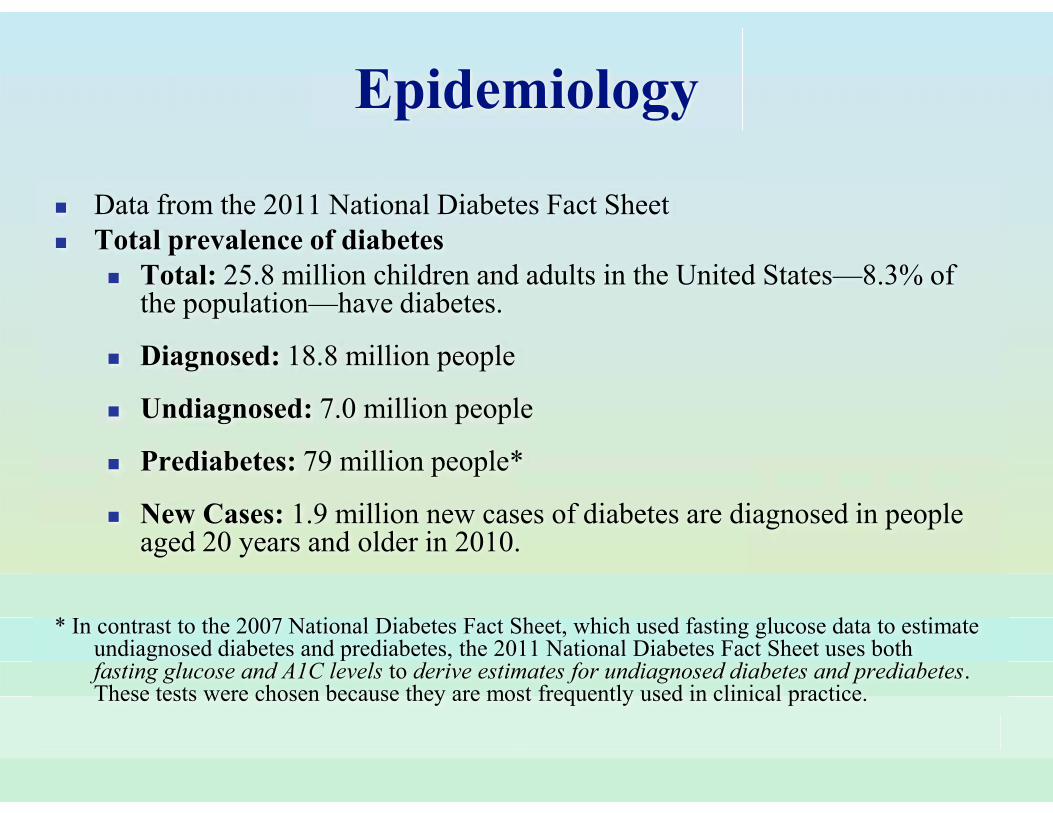
� Data from the 2011 National Diabetes Fact Sheet� Total prevalence of diabetes
� Total: 25.8 million children and adults in the United States—8.3% of the population—have diabetes.
� Diagnosed: 18.8 million people
� Undiagnosed: 7.0 million people
� Prediabetes: 79 million people*
� New Cases: 1.9 million new cases of diabetes are diagnosed in people aged 20 years and older in 2010.
* In contrast to the 2007 National Diabetes Fact Sheet, which used fasting glucose data to estimate undiagnosed diabetes and prediabetes, the 2011 National Diabetes Fact Sheet uses both fasting glucose and A1C levels to derive estimates for undiagnosed diabetes and prediabetes. These tests were chosen because they are most frequently used in clinical practice.

Diabetes:diagnosis, classification, management
� Definition� Epidemiology� Classification� Diagnosis� Treatment� Evidence� Treatment goals

Classification
� Type 1 diabetes� Type 2 diabetes� Other
1. Genetic defects of beta cell function2. Genetic defects in insulin action3. Diseases of the exocrine pancreas4. Endocrinopathies5. Drug/ chemical - induced 6. Infections7. Uncommon forms of immune-mediated diabetes8. Genetic syndromes sometimes associated with diabetes
� Gestational diabetes mellitus

Type 1 diabetes
� A. Immune-mediated� B. Idiopathic
� Type 1 diabetes is characterized by β-cell destruction, usually leading to absolute insulin deficiency.*
* Diagnosis and Classification of Diabetes Mellitus. ADA 2009.

Type 1 diabetes mellitus – immune mediated
� Absolute insulin deficiency
� Usually due to autoimmune destruction of the pancreatic beta cells
� Islet-cell antibodies (ICA) or other autoantibodies (antibodies to glutamic acid decarboxylase [anti-GAD] and anti-insulin)

Type 2 diabetes
� Hyperglycemia
� Insulin resistance
� Relative impairment in insulin secretion.

��-cell dysfunction and insulin resistance produce hyperglycemia in type 2 diabetes
Pancreas
Insulin Resistance
Liver
Hyperglycemia
Islet �-Cell Degranulation;Reduced Insulin Content
Muscle Adipose Tissue
Decreased Glucose Transport & Activity
(expression) of GLUT4
Increased Lipolysis
↑GlucoseProduction
↓GlucoseUptake
ReducedPlasma Insulin
Increased Glucose Output
�-Cell Dysfunction
Elevated Plasma FFA

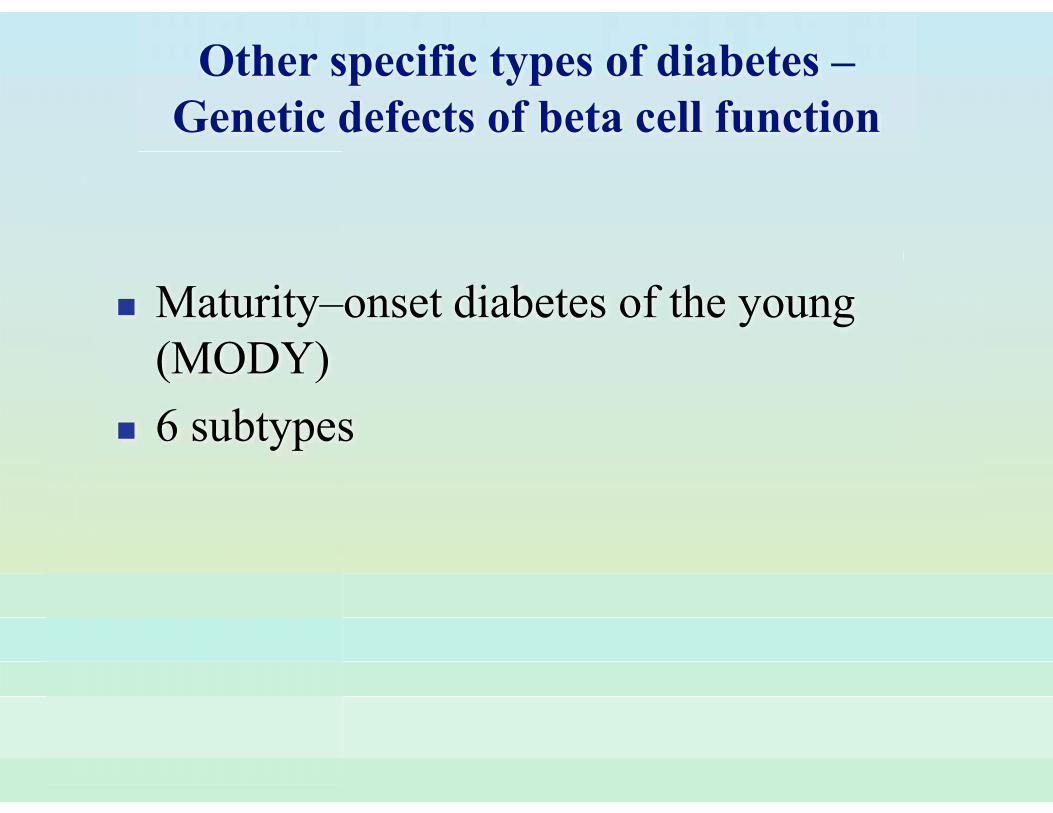
Other specific types of diabetes –Genetic defects of beta cell function
� Maturity–onset diabetes of the young (MODY)
� 6 subtypes

Maturity:Onset diabetes of the young (MODY)
� MODY 1 - Mutation in HNF-4-alpha (transcription factor), chromosome 20
� MODY 2 - Mutation in glucokinase gene, chromosome 7
� MODY 3 - Mutation in HNF-1-alpha (transcription factor), chromosome 12 (most common form)
� MODY 4 - Mutation in insulin promoter factor-1 (IPF-1), chromosome 13
� MODY 5 - Mutation in HNF-1-beta, chromosome 17
� MODY 6 - Mutation in Neurogenic Differentiation Factor-1 (NEUROD1) , chromosome 2
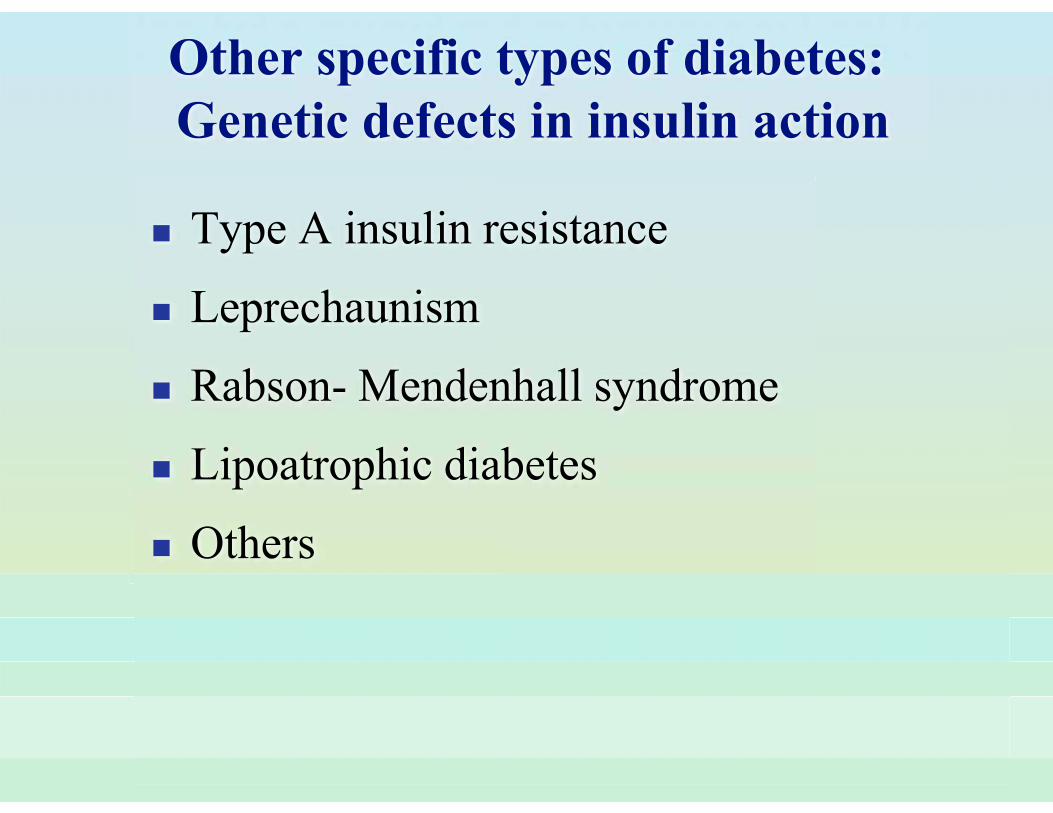
Other specific types of diabetes:Genetic defects in insulin action
� Type A insulin resistance
� Leprechaunism
� Rabson- Mendenhall syndrome
� Lipoatrophic diabetes
� Others

*A clinical screening tool identifies autoimmune diabetes in adults. Fourlanos S; Perry C; Stein MS; Stankovich J; Harrison LC; Colman PG. Diabetes Care. 2006 May;29(5):970-5
Latent Autoimmune Diabetes in Adults (LADA)
� Adult-onset diabetes with circulating islet antibodies but not requiring insulin therapy initially
� Adults who should be considered for antibody testing*: � age of onset <50 years� acute symptoms� BMI <25 kg/m2
� personal or family history of autoimmune disease

Gestational DMDefinition� Any degree of impaired glucose tolerance with onset or first
recognition during pregnancy� Gestational diabetes (GDM) occurs when pancreatic function
is not sufficient to overcome the insulin resistance created by changes in diabetogenic hormones during pregnancy
� Most have impaired glucose tolerance that begins in pregnancy� Some have previous undiagnosed type 2 diabetes mellitus� 10% have circulating islet cell antibodies
Diabetes:diagnosis, classification, management
� Definition� Epidemiology� Classification� Diagnosis� Treatment� Evidence� Treatment goals
Diagnosis
� Diabetes mellitus
� Impaired fasting glucose (IFG)
� Impaired glucose tolerance (IGT)
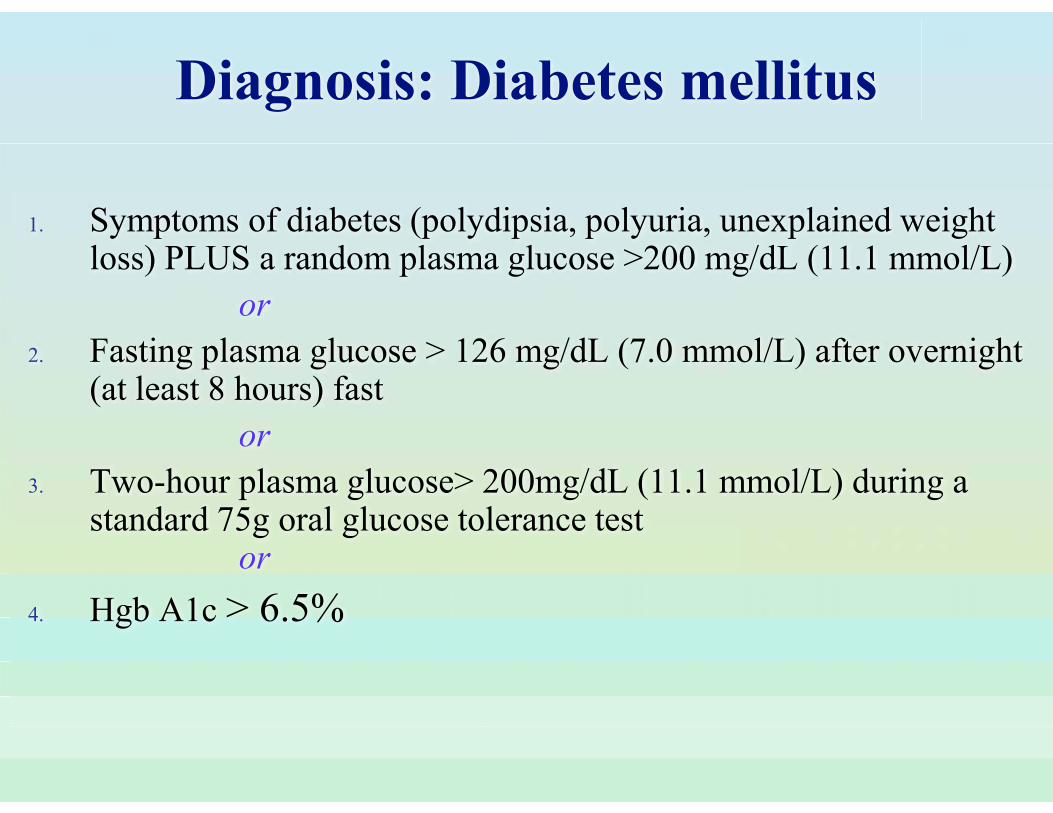
Diagnosis: Diabetes mellitus
1. Symptoms of diabetes (polydipsia, polyuria, unexplained weight loss) PLUS a random plasma glucose >200 mg/dL (11.1 mmol/L)
or2. Fasting plasma glucose > 126 mg/dL (7.0 mmol/L) after overnight
(at least 8 hours) fastor
3. Two-hour plasma glucose> 200mg/dL (11.1 mmol/L) during a standard 75g oral glucose tolerance test
or4. Hgb A1c > 6.5%

Diagnosis: Impaired fasting glucose (IFG)
� Fasting plasma glucose (FPG) < 100 mg/dl (5.6 mmol/l) = normal
� FPG 100-125 mg/dl (5.6-6.9 mmol/l) = impaired fasting glucose (IFG)

� Oral glucose tolerance test (OGTT) – glucose load containing the equivalent of 75 g anhydrous glucose dissolved in water
� 2-h postload glucose < 140 mg/dl (7.8 mmol/l) = normal
� 2-h postload glucose 140 - 199 mg/dl (7.8 – 11.1 mmol/l) = impaired glucose tolerance (IGT)
Diagnosis: Impaired glucose tolerance (IGT)

Diagnosis: Gestational Diabetes Mellitus (GDM)
1. Unequivocal hyperglycemia(confirmed on a subsequent day)
2. Diagnostic OGTT
Fasting plasma glucose > 126 mg/dL (7.0 mmol/L)
Random plasma glucose >200 mg/dL (11.1 mmol/L)
OR
100-g glucose loadmg/dl mmol/l
Fasting 95 5.3
1-h 180 10.0
2-h 155 8.6
3-h 140 7.8

Diabetes:diagnosis, classification, management
� Definition� Epidemiology� Classification� Diagnosis� Treatment� Evidence� Treatment goals
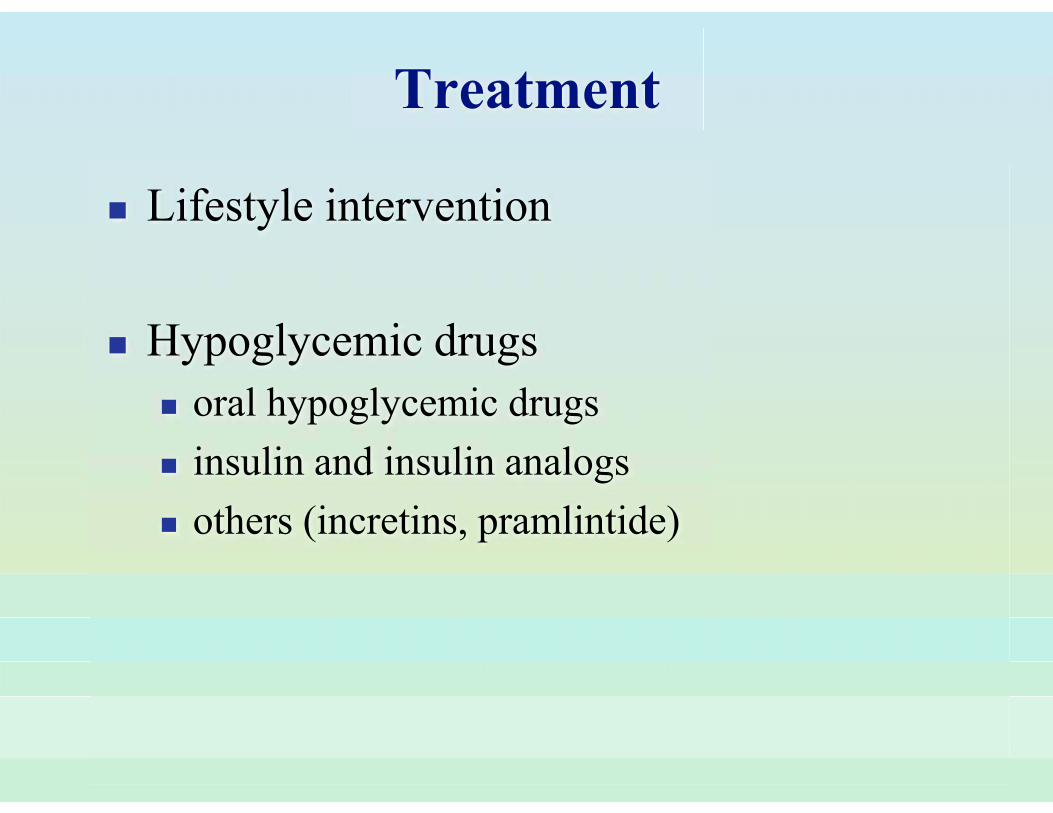
Treatment
� Lifestyle intervention
� Hypoglycemic drugs� oral hypoglycemic drugs� insulin and insulin analogs� others (incretins, pramlintide)

Treatment:Lifestyle Interventions
� Weight loss
� Increased exercise

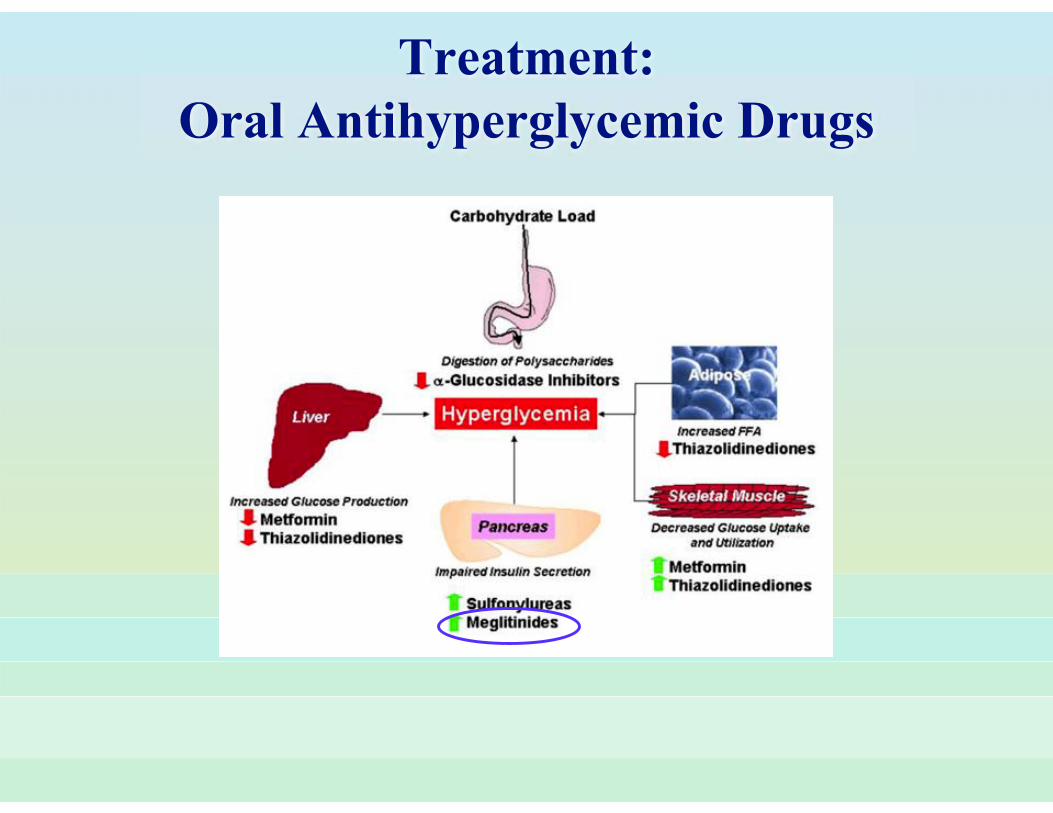
Treatment:Oral Antihyperglycemic Drugs
� Biguanides� Sulfonylureas� Meglitinide analogs� Thiazolidinediones� �-Glucosidase Inhibitors� DPP-4 Inhibitors

Treatment:Oral Antihyperglycemic Drugs

Oral antihyperglycemic drugs: Biguanides
� Metformin (Glucophage)� Extended-release metformin (Glucophage-XR)
� decrease hepatic glucose output� lower fasting glycemia� reduce HbA1c by 1.5%� adverse effects: lactic acidosis, gastro-
intestinal disturbances

AMPK - adenosine monophosphate-activated protein kinase, ACC - acteyl-CoA carboxylase, SREPB-1 - sterol-regulatory-element-binding-protein-1.
Diagram adapted from Alice Y.Y. Cheng, I. George Fantus, 'Oral antihyperglycemic therapy for type 2 diabetes mellitus' Canadian Medical Association Journal172(2),2005 pp213-226
Oral antihyperglycemic drugs: Metformin

Treatment:Oral Antihyperglycemic Drugs

Oral antihyperglycemic drugs: Sulfonylureas
� 1st generation : Tolbutamide (Orinase), Tolazamide (Tolinase), Acetohexamide (Dymelor), Chlorpropamide (Diabinese)
� 2nd generation : Glyburide (DiaBeta, Glynase) Glipizide (Glucotrol), Glimepiride (Amaryl)
� enhance insulin secretion� lower HbA1c by 1.5 %� side effects: hypoglycemia, weight gain
Treatment:Oral Antihyperglycemic Drugs

Black C, Donnelly P, McIntyre L et al. Meglitinide analogues for type 2 diabetes mellitus. Cochrane Database Syst Rev. 2007 Apr 18;(2):CD004654.
Oral antihyperglycemic drugs: Meglitinide analogs
� Repaglinide (Prandin)� Nateglinide (Starlix)
� enhance insulin secretion (early-phase insulin release) � lower HbA1c by 0.1- 2.1% (repaglinide) and by 0.2-
0.6% (nateglinide)� side effects: weight gain, hypoglycemia
Treatment:Oral Antihyperglycemic Drugs

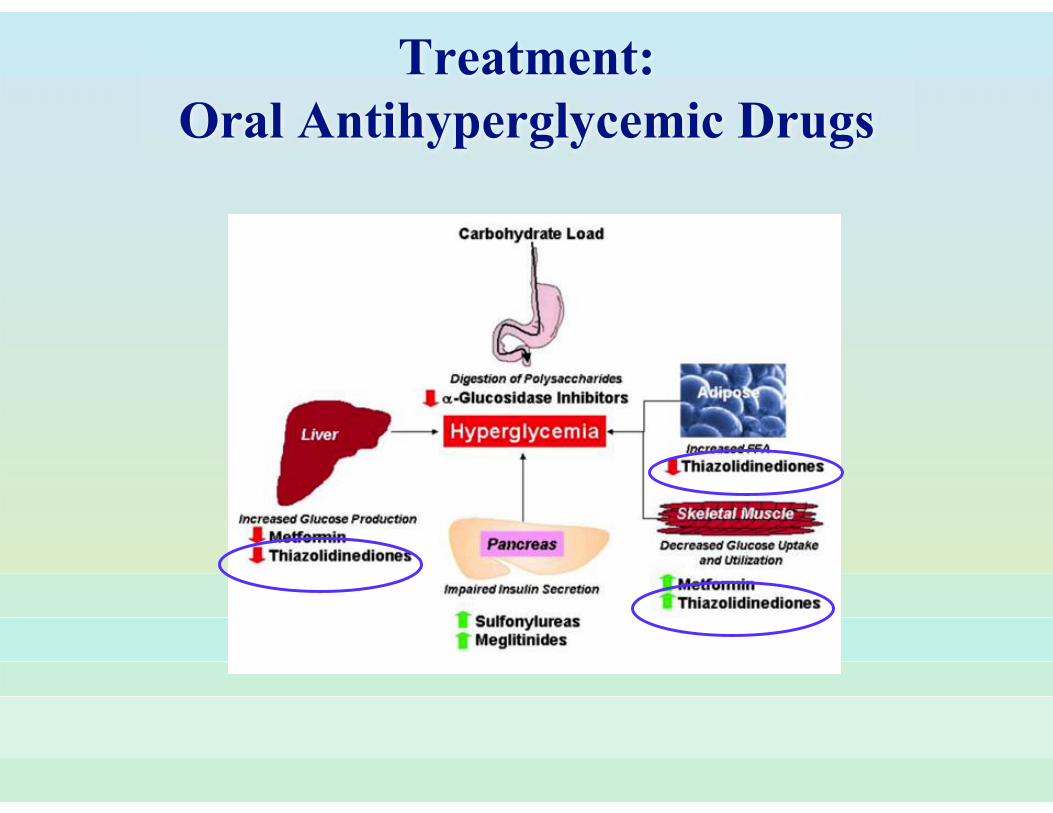
Oral antihyperglycemic drugs: Thiazolidinediones (TZDs)
� Rosiglitazone (Avandia) � Pioglitazone (Actos)
� peroxisome proliferator-activated receptor γmodulators (PPAR γ)
� insulin sensitizers (increase the sensitivity of muscle, fat and liver to endogenous and exogenous insulin)
� lower HbA1c by 0.5 - 1.4 %� adverse effects: weight gain, fluid retention

Treatment:Oral Antihyperglycemic Drugs
Oral antihyperglycemic drugs:��-Glucosidase Inhibitors
� Acarbose (Precose) � Miglitol (Glyset)
� reduce the rate of digestion of polysaccharides in the proximal small intestine, primarily lowering post-prandial glucose levels
� lower HbA1c by 0.5 – 0.8 %� side effects: increased gas production and gastro-
intestinal symptoms

Oral antihyperglycemic drugs:DPP-IV inibitors
� Sitagliptin (Januvia) : DPP-IV inhibitor� Dipeptidyl peptidase IV (DPP-IV) is a ubiquitous
enzyme that deactivates a variety of bioactive peptides, including GIP and GLP-1
Oral antihyperglycemic drugs -Sitagliptin (Januvia)
� Used alone or in combination with metformin or TZDs
� Reduces HbA1c by 0.5 – 0.7 %
� Side effects: increased rate of respiratory infections, headaches

"Januvia" by Byron Rubin� Sculpture was installed at the West Point
Pennsylvania Merck location.

Other antihyperglycemic drugs: Incretins
� Exenatide (Byetta)� glucagon-like peptide 1 (GLP-1) agonist

Antihyperglycemic drugs: Exenatide (Byetta)

Glucagon-like Peptide - 1� The majority of GLP-1 producing cells are in the terminal
ileum and proximal colon.
� GLP-1 levels in the blood increase rapidly after a meal.
� Half-life being very short, approximately one minute.
� GLP-1 binding to its G-protein coupled receptor on ß-cells increases glucose stimulated insulin secretion
� GLP-1 infused into healthy subjects decreases gastric emptying, causes a sensation of satiety, and decreases appetite.
� Effects:
� enhances insulin secretion
� limits postprandial hyperglycemia.

Figure 1. Insulin levels following oral vs IV glucose administration in healthy individuals. Despite identical glucose concentrations, plasma insulin levels peaked much earlier and were greater in response to an oral vs IV dose of glucose.
Figure 2. Insulin levels following oral vs IV glucose administration in patients with type 2 diabetes. The markedly reduced early peak of insulin after oral glucose, along with the smaller differences in insulin levels in response to oral and IV glucose doses, illustrate the diminished incretin effect.
Data extrapolated from Perley, et al. @ http://www.byettahcp.com/hcp/hcp_incretin_effect.jsp
Incretin Effect

Antihyperglycemic drugs:Exenatide (Byetta)
� active ingredient in Exenatide (Byetta) is a synthetic version of a protein present in the saliva of the Gila monster

Antihyperglycemic drugs:Exenatide (Byetta)
� Added to metformin or sulfonylureas will reduce HbA1c by 0.4-0.6 %
� Side effects:� nausea (dose-depended, declines with time) � acute pancreatitis (some necrotizing or hemorrhagic
pancreatitis cases reported as well)

Antihyperglycemic drugs:Exenatide (Byetta)

Antihyperglycemic drugs: Others
� Pramlintide (Symlin) � synthetic analog of amylin

Amylin� Stored in insulin secretory granules in the ß-
cells� Co-secreted with insulin� Decreases glucagon� Satiety signal?� Decreases GI motility
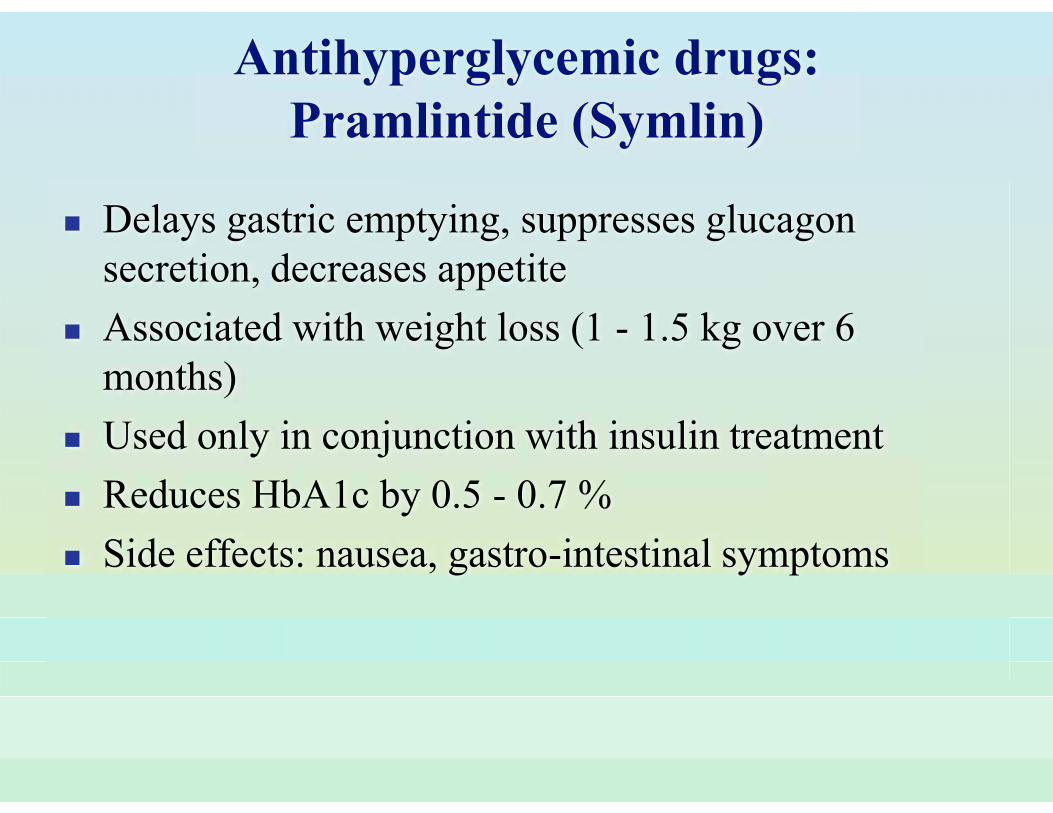
Antihyperglycemic drugs:Pramlintide (Symlin)
� Delays gastric emptying, suppresses glucagon secretion, decreases appetite
� Associated with weight loss (1 - 1.5 kg over 6 months)
� Used only in conjunction with insulin treatment� Reduces HbA1c by 0.5 - 0.7 %� Side effects: nausea, gastro-intestinal symptoms

Antihyperglycemic drugs:Pramlintide (Symlin)

Product (Manufacturer) Form
Rapid Acting (Onset 15-30 min, duration hrs 3-4)
Insulin AnalogAspart - Novolog (Novo Nordisk)Lispro - Humalog (Lilly)Glulisine – Apidra (Aventis)
Analog**Analog**
Short Acting (Onset 0.5-1 hr, duration hrs 5-7)*
Human InsulinNovolin R (Rugular) (Novo Nordisk)Humulin R (Regular) (Lilly)
Human**Human**
Purified InsulinRegular Iletin II (Lilly) Pork
Intermediate Acting (Onset 1-4 hrs, duration hrs 18-24)*
Human InsulinNovolin N (NPH) (Lilly)Humulin N (NPH) (Lilly)Humulin L (Lente) (Lilly)
Human**Human**Human**
Purified InsulinNPH Iletin III (Lilly) Pork
Long Acting (Onset 4-6 hrs, duration hrs 24-34)*
Human InsulinHumulin Ultralente (Lilly) Human**
Basal Peakless InsulinGlargine-Lantus (Aventis)Detemir – Levemir (Novo Nordisk)
Analog**Analog**
Mixed Insulins
70/30 InsulinNovolin 70/30 (Novo Nordisk)Humulin 70/30 (Lilly)Humulin 50/50 (Lilly)Humalog 50/50
Human**Human**Human**Analog**
Product (Manufacturer) Form
Analog MixHumalog 75/25 MixNovolog Mix 70/30 (combination of fast and
intermediate acting insulin with action similar to that of Humalog 75/25 mix)
Analog**Analog**
Insulin for Special Use
Buffered Insulin (for pumps)Humulin BR
Refills for Novolin PenNovolin R PenFillNovolin N PenFillNovolin 70/30 PenFillNovolog Mix 70/30 PenFill
Prefilled PensNovolin RNovolin NNovolin 70/30NovologNovolog Mix 70/30HumalogHumalog Mix 75/25Humalog Mix 50/50Humulin NApidra
Human**Human**Human**Analog**
Human**Human**Human**Analog**Analog**Analog**Analog**Analog**Human**Analog**
* Onset and duration are rough estimates. They can vary greatly within the range listed and from person to person
** Human insulin is made by recombinant DNA technology
AVAILABLE INSULIN PREPARATIONS

Initiation and adjustment of insulin regimens. Insulin regimens should be designed taking lifestyle and meal schedule into account. The algorithm can only provide basic guidelines for initiation and adjustment of insulin. See reference 90 for more detailed instructions. aPremixed insulins not recommended during adjustment of doses; however, they can be used conveniently, usually before breakfast and/or dinner, if proportion of rapid-and intermediate-acting insulins is similar to the fixed proportions available. bg, blood glucose.
ADA Treatment Algorithm

Diabetes:diagnosis, classification, management
� Definition� Epidemiology� Classification� Diagnosis� Treatment� Evidence� Treatment goals

Evidence

ACCORD� 10,251 patients with DM2� Mean age – 62.2 yrs� Baseline A1C – 8.1%� Intensive glucose
control vs. standard control
� Median f/up 3.5 yrs� primary outcome:
� nonfatal myocardial infarction
� nonfatal stroke� death from CV causes
Intensive Standard RR reduction
A1C 6.4% 7.5%
Primary outcome 6.9% 7.2% 10%
Death from any cause
5.0% 4.0% ↑22%*
Non-fatal MI 3.6% 4.6% 24%*Severe hypoglycemia
2.7% 1.5%
The Action to Control Cardiovascular Risk in Diabetes Study Group. N Engl J Med 2008;358:2545-2559
* P-value < 0.05

ACCORD� Action to Control Cardiovascular Risk in Diabetes
(ACCORD) trial� Designed primarily to examine the effects of
glycemic control, lower than had previously been achieved, on CVD in subjects with long-standing diabetes
� 10,250 adults (mean age 62 years) with a median diabetes duration of ten years and at high risk for cardiovascular disease (diagnosed with CVD or two risk factors in addition to diabetes)
� Intensive treatment group with the aim of achieving A1C of < 6 % or a standard treatment group with a A1C goal of 7.0 to 7.9 %.

� After 3.5 years, the intensive arm was halted due to a higher number of total deaths: 257 deaths in subjects assigned to intensive therapy versus 203 deaths in patients assigned to standard treatment group.*
� The primary outcome (a composite of nonfatal myocardial infarction, nonfatal stroke, or death from cardiovascular causes) occurred in 352 and 371 patients in the intensive and standard therapy groups, respectively (HR 0.90, 95% CI 0.78-1.04).
* hazard ratio, 1.22; 95% CI, 1.01 to 1.46; P=0.04
ACCORD

� Preliminary information : extensive analyses have not identified a specific cause for the excess mortality in the intensive treatment group.
� Subjects in the intensive group rapidly achievedtarget A1C values and experienced a greater number of severe hypoglycemic events (annualized rate of 3.1 versus 1.0 percent) and more weight gain (mean 3.5 versus 0.4 kg at three years) than the standard group (median A1C 7.5 percent).
ACCORD

ADVANCE
� 11,140 patients with DM2
� Mean age – 66 yrs� Baseline A1C - 7.5%� Intensive glucose
control vs. standard control
� Median f/up 5 yrs� 1º end-points: major
macro- and micro vascular events
Intensive Standard RR reduction
A1C 6.5% 7.3%
Major microvascular 9.4% 10.9% 14% *
New/worsening nephropathy
4.1% 5.2% 21%*
New onset microalbuminuria
23.7% 25.7% 9% *
Major macrovascular
10.0% 10.6% 6%
The ADVANCE Collaborative Group. N Engl J Med 2008;358:2560-2572
* P-value < 0.05

ADVANCE
� Mean glycated hemoglobin level was lower in the intensive-control group (6.5%) than in the standard-control group (7.3%)
� Intensive control � reduced the incidence of combined major macrovascular and
microvascular events (18.1% vs 20.0% with standard control; hazard ratio 0.90, 95% confidence interval (CI), 0.82 to 0.98; p=0.01)
� reduced the incidence of major microvascular events (9.4% vs 10.9%; hazard ratio, 0.86; 95% CI, 0.77 to 0.97; p=0.01)
� This occurred primarily because of a reduction in the incidence of the nephropathy (4.1% vs 5.2%; hazard ratio, 0.79; 95% CI, 0.66 to 0.93; p=0.006) with NO effect on retinopathy (p=0.50)
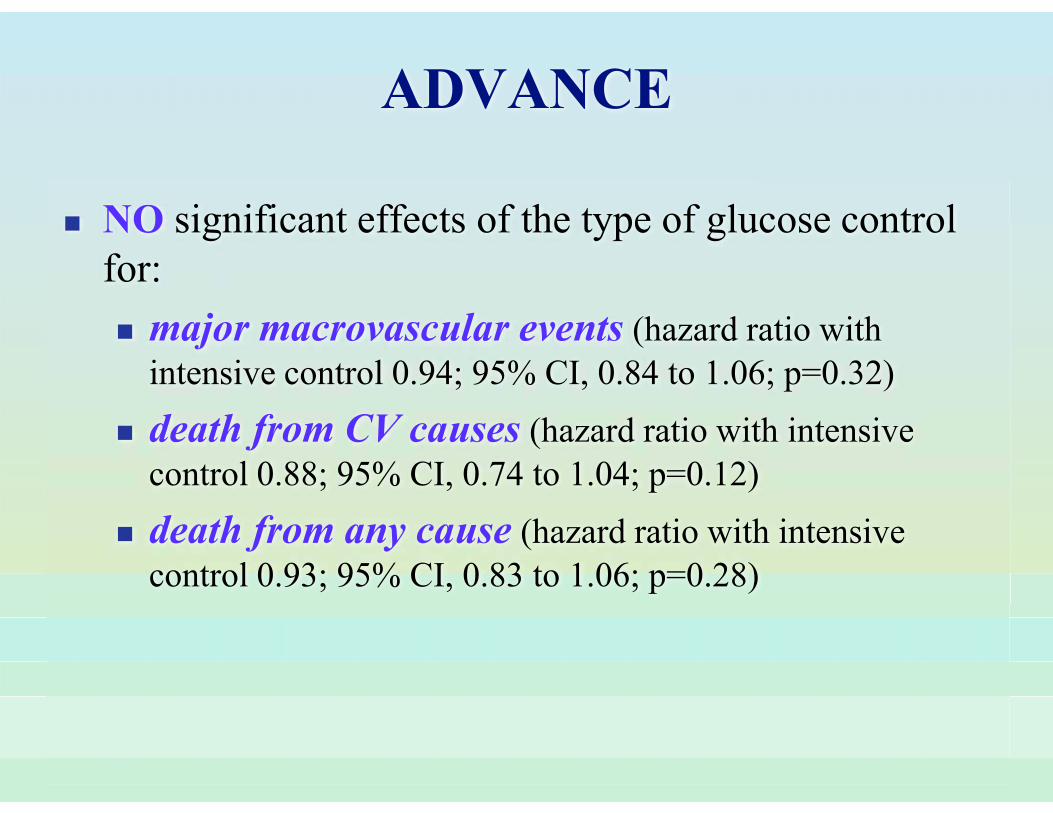
� NO significant effects of the type of glucose control for:� major macrovascular events (hazard ratio with
intensive control 0.94; 95% CI, 0.84 to 1.06; p=0.32)� death from CV causes (hazard ratio with intensive
control 0.88; 95% CI, 0.74 to 1.04; p=0.12)� death from any cause (hazard ratio with intensive
control 0.93; 95% CI, 0.83 to 1.06; p=0.28)
ADVANCE

ADVANCE
� Intensive control that resulted in HbA1c of 6.5% yielded a 10% relative reduction in the combined outcome of major macrovascular and microvascular events, primarily as a consequence of a 21% relative reduction in nephropathy

The Diabetes Control and Complications Trial Research Group. N Engl J Med 1993;329:977-986
* P-value < 0.05
DCCT
� 1441 patients with DM1� Age: 13-39� No history of
cardiovascular disease� IIT vs. conventional IT
for 6.5 yrs� 1º prevention group:
� Retinopathy� Neuropathy� Nephropathy
Intensive Standard RR reduction
A1C 7.4% 9.1%New retinopathy 1.2 per 100
pt-yr4.7 per 100 pt-yr
76%*
Microalbuminuria 2.2 per 100 pt-yr
3.4 per 100 pt-yr
34%*
Clinical neuropathy 3.1 per 100 pt-yr
9.8 per 100 pt-yr
68%*
Macrovascular disease
0.5 per 100 pt-yr
0.8 per 100 pt-yr
41%

� 93% of DCCT patients f/up for additional 11 yrs
� At the end of the DCCT:� the conventional-treatment
group intensive treatment (all participants returned totheir own health careproviders for diabetes care)
� No hx of cardiovascular disease� IIT vs. conventional IT for 6.5
yrs� 1º prevention group:
� Retinopathy� Neuropathy� Nephropathy
Year 11th of EDIC Intensive Standard RR reduction
A1C 7.9% 7.8%
Microalbuminuria 9% 17% 38%*
Cr>2.0 0% 2.0% 46%*
Progressive retinopathy
6% 21% 75%*
Major CV events 0.38 per 100 pt-yr
0.8% per 100 pt-yr
42%*
Non-fatal MI CVA, death from CVD
11 25 57%*
Epidemiology of diabetes interventions and Complications (EDIC, 1994- 2006) follow-up study
EDIC
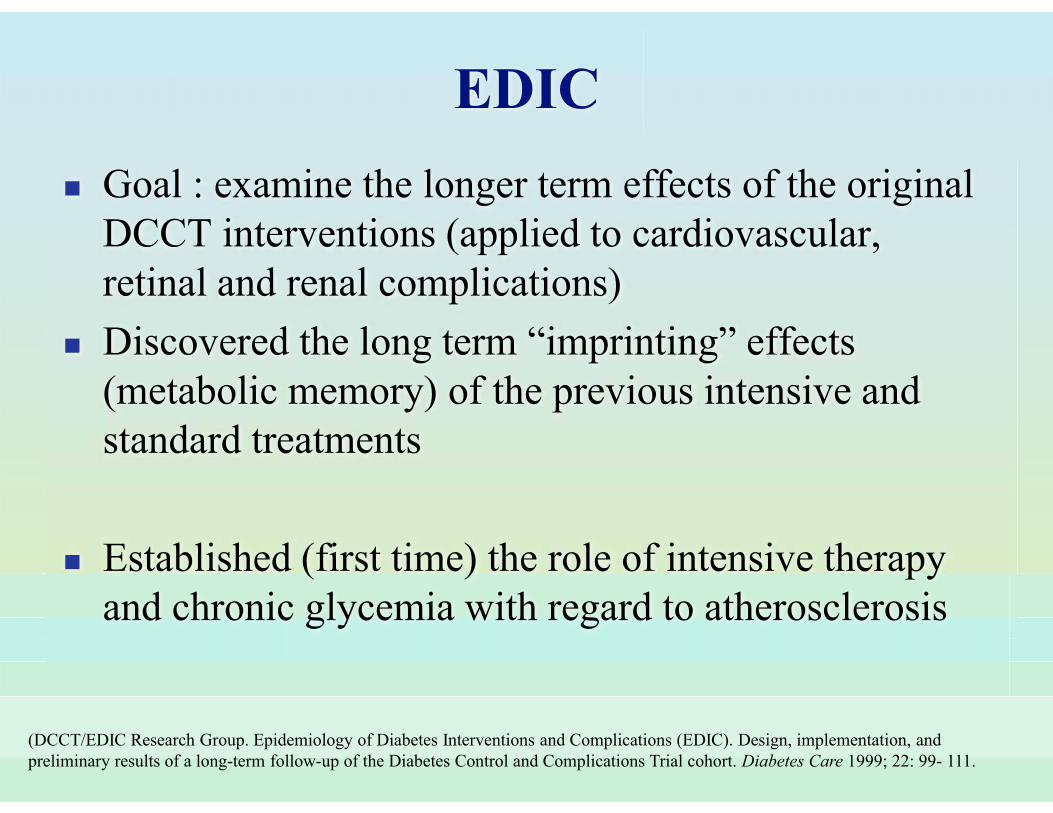
(DCCT/EDIC Research Group. Epidemiology of Diabetes Interventions and Complications (EDIC). Design, implementation, and preliminary results of a long-term follow-up of the Diabetes Control and Complications Trial cohort. Diabetes Care 1999; 22: 99- 111.
EDIC� Goal : examine the longer term effects of the original
DCCT interventions (applied to cardiovascular, retinal and renal complications)
� Discovered the long term “imprinting” effects (metabolic memory) of the previous intensive and standard treatments
� Established (first time) the role of intensive therapy and chronic glycemia with regard to atherosclerosis

Intensive blood-glucose control with sulphonylureas or insulin compared with conventional treatment and risk of complications inpatients with type 2 diabetes (UKPDS 33). UK Prospective Diabetes Study (UKPDS) Group. Lancet 1998 Sep 12;352(9131):837-53.
United Kingdom Prospective Diabetes Study (UKPDS)
� 3867 patients with newly diagnosed DM2� Randomized to conventional-therapy group (diet
alone) or intensive-therapy group: sulfonylurea (chlorpropamide, glibenclamide, glipizide) or insulin
� Metformin added to sulfonylurea if optimal control not achieved
� Insulin initiated if combination of oral agents was ineffective

United Kingdom Prospective Diabetes Study (UKPDS)
� Drugs added to conventional group if symptoms of hyperglycemia or FPG>270 mg/dl
� Goal of therapy: FPG<108 mg/dl
� Microvascular and Macrovascular complications examined

� 11 percent reduction in A1C ( 7.0% vs. 7.9%)
� 25 percent risk reduction in microvascular disease(P = 0.001) � defined as renal failure,
death from renal failure, retinal photocoagulation, or vitreous hemorrhage
UKPDS: results
UKPDS: results
� No reduction in macrovascular disease
� More hypoglycemic episodes and weight gain in the intensive therapy group
10 year follow-up of intensive glucose control in type 2 diabetes. R Holman et al. NEJM 2008;359:1577-89
10 year follow-up of intensive glucose control in type 2 diabetes
year followww- p of intensive glucose control in type 2 diabetes. R Holman et alupu l. EJMNE M 008;359:1572 777- 998
� United Kingdom Prospective Diabetes Study (UKPDS)- 4209 patients in conventional or intensive therapy
� Post-trial monitor – 3277 patients followed up:� first 5 years: annual UKPDS clinic visits (no
attempts to maintain previously assigned therapy)� years 6 – 10: annual questionnaires

10 year follow-up of intensive glucose control in type 2 diabetes. R Holman et al. NEJM 2008;359:1577-89
10 year follow-up of intensive glucose control in type 2 diabetes
Results� HbA1c: differences between groups in were lost after the first year� Sulfonylurea-insulin group:
� any diabetes-related end point- relative risk reduction persisted at 10 years (9%, p=0.04)
� microvascular disease - relative risk reduction persisted at 10 years (24%, p=0.001)
� myocardial infarction - risk reduction emerged over time (15%, p=0.01) � death from any cause - risk reduction emerged over time (13%, p=0.007)
� Metformin group: � any diabetes-related end point - significant risk reductions persisted (21%,
p=0.010)� myocardial infarction - significant risk reductions persisted (33%, p=0.005) � death from any cause - significant risk reductions persisted (27%, p=0.002)

Glucose Control and Vascular Complications in Veterans with Type 2 Diabetes. Duckworth W et al. NEJM 2009;360:129-139
Glucose Control and Vascular Complications in Veterans with Type 2 Diabetes
ucose Control and Vascular Complications in Veterans with Type 2 Diabetes. Duckworth W et al. NEJM 2009;360:129-139
� 1791 military veterans with suboptimal response to therapy for type 2 DM
� mean age: 60.4 years� Mean number of years since diagnosis with diabetes: 11.5� 40% had already had one CV event� 2 groups
� intensive glucose control� standard glucose control
� Goal: absolute reduction of 1.5 percentage points in HbA1c in intensive treatment group compared to the standard treatment
� Primary outcome: time from randomization to first major CV event
Glucose Control and Vascular Complications in Veterans with Type 2 Diabetes
� Follow-up: 5.6 years� Primary outcome occurred in 264 patients in the standard
treatment group vs 235 patients in the intensive therapy group (HR: 0.88; 95%CI, 0.74 to 1.05; p=0.14)
� Median glycated hemoglobin levels were 8.4% in the standard therapy group vs 6.9% in the intensive-treatment group.
� Rate of adverse events were 17.6% in the standard therapy group and 24.1% in the intensive therapy group (p=0.05).
� Hypoglycemia (most common side effect) occurred significantly more in the intensive treatment group than in the standard treatment group (p<0.001)
Glucose Control and Vascular Complications in Veterans with Type 2 Diabetes
� Results� NO significant difference between the 2 groups in any
component of the primary outcome (the time from randomization to a major CV event) or in the rate of death from any cause.
� NO difference between the 2 groups was observed for microvascular complications
� Note! Correction: progression of microalbuminuria favors intensive therapy group (9.1% vs. 13.8 % in a standard group, P=0.04).*
* NEJM 361;10, September 3, 2009

Effect of a Multifactorial Intervention on Mortality in Type 2 Diabetes
Effect of a Multifactorial Intervention on Mortality in Type 2 Diabetes. Gæde P, M.D., D.M.Sc., Lund-Andersen H, M.D., D.M.Sc.,
Parving H, M.D., D.M.Sc., and Pedersen O, M.D., D.M.Sc. N Engl J Med. 2008 Feb 7;358(6):580-91.
160 patients with type 2 diabetes mellitus and persistent microalbuminuria
Intensive, target-driven treatment Conventional multifactorial treatment
Followed for a mean of 5.5 years
Targets:- HbA1c < 6.5% - fasting serum total cholesterol < 175 mg/dl (4.5 mmol/l)- fasting serum triglyceride < 150 mg/dl (1.7 mmol per liter)- blood pressure: systolic <130 mm Hg, diastolic < 80 mm Hg.
Effect of a Multifactorial Intervention on Mortality in Type 2 Diabetes: End points
1. Primary end point: � time to death from any cause
2. Secondary end points: � death from cardiovascular causes � a composite of cardiovascular disease events (death from
cardiovascular causes, nonfatal stroke, nonfatal myocardial infarction, coronary-artery bypass grafting, percutaneous coronary intervention or revascularization for peripheral atherosclerotic arterial disease, and amputation because of ischemia)
3. Tertiary end points:� incident diabetic nephropathy� development or progression of diabetic retinopathy or neuropathy

Effect of a Multifactorial Intervention on Mortality in Type 2 Diabetes: Results
Intensive group
� 24 patients died (30%) vs 40 patients (50%) in the conventional treatment group (hazard ratio for death in the intensive group vs conventional group: 0.54; 95% confidence interval, 0.32 to 0.89; p=0.02)

Effect of a Multifactorial Intervention on Mortality in Type 2 Diabetes: Results
� Lower risk of death from cardiovascular causes (HR 0.43; 95% CI, 0.19 to 0.94; p=0.04) compared to conventional treatment group
� Lower risk of cardiovascular events (HR 0.41; 95% CI, 0.25 to 0.0.67; p<0.001) vs conventional treatment group
� 1 patient had progression to end-stage renal disease vs 6 patients in the conventional treatment group (p=0.04)
� Fewer patients required retinal photocoagulation (relative risk, 0.45; 95% CI, 0.23 to 0.86; p=0.02) compared to the other group
S.E. Nissen, M.D., and K. Wolski, M.P.H. Effect of Rosiglitazone on the Risk of Myocardial Infarction and Death from Cardiovascular Causes. NEJM 2007; 356:2457-2471
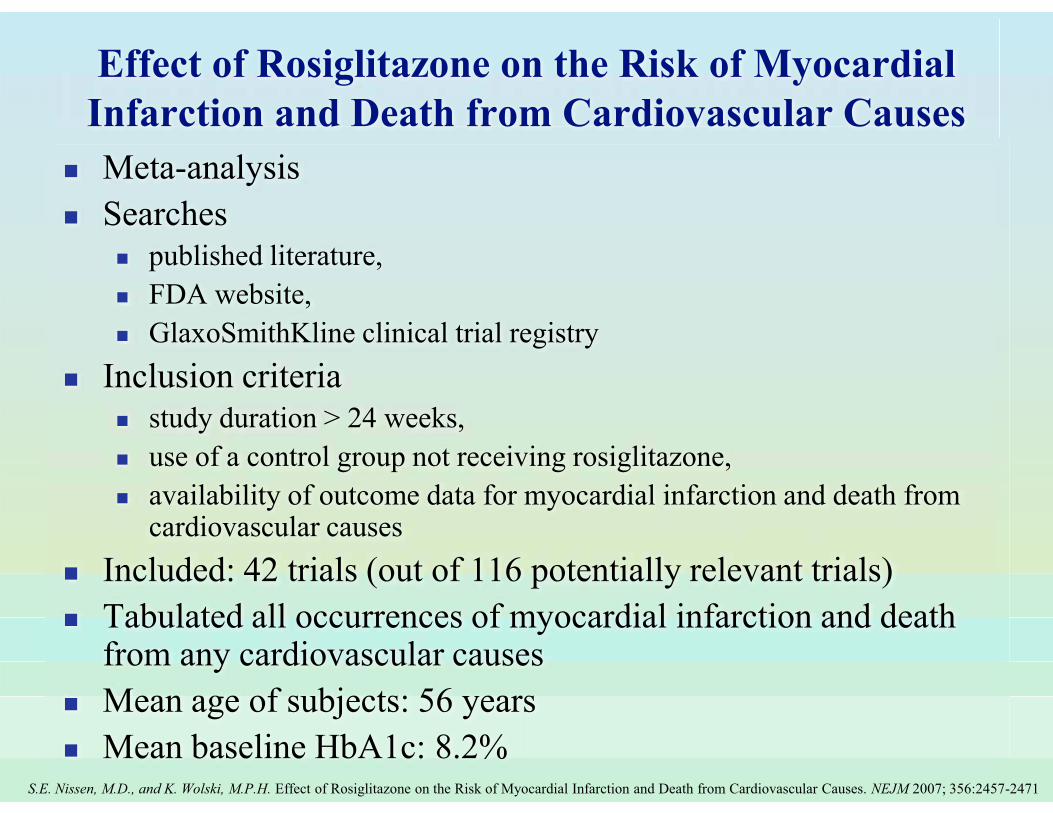
Effect of Rosiglitazone on the Risk of Myocardial Infarction and Death from Cardiovascular Causes
� Meta-analysis � Searches
� published literature, � FDA website, � GlaxoSmithKline clinical trial registry
� Inclusion criteria� study duration > 24 weeks, � use of a control group not receiving rosiglitazone, � availability of outcome data for myocardial infarction and death from
cardiovascular causes� Included: 42 trials (out of 116 potentially relevant trials)� Tabulated all occurrences of myocardial infarction and death
from any cardiovascular causes� Mean age of subjects: 56 years� Mean baseline HbA1c: 8.2%

S.E. Nissen, M.D., and K. Wolski, M.P.H. Effect of Rosiglitazone on the Risk of Myocardial Infarction and Death from Cardiovascular Causes. NEJM 2007; 356:2457-2471
Effect of Rosiglitazone on the Risk of Myocardial Infarction and Death from Cardiovascular Causes
Results� Myocardial infarction: OR=1.43 in the
rosiglitazone group compared with the control group (95% CI, 1.03 to 1.98; p=0.03)
� Death from cardiovascular causes: OR=1.64 in the rosiglitazone group compared with the control group (95% CI, 0.98 to 2.74; p=0.06)

Glycemic durability of rosiglitazone, metformin, or glyburide monotherapy. S E Kahn et al. NEJM 2006;355:2427-43
Glycemic durability of rosiglitazone, metformin, or glyburide monotherapy
ADOPT - A Diabetes Outcome Progression Trial
� Evaluate rosiglitazone, metformin and glyburide as initial treatment for recently diagnosed type 2 diabetes
� Double-blind, randomized, controlled clinical trial� 4360 patients enrolled� Median treatment time: 4.0 years

Glycemic durability of rosiglitazone, metformin, or glyburide monotherapy
Outcomes� Primary outcome: time to monotherapy failure (FPG> 180
mg/dl) for rosiglitazone, as compared to metformin or glyburide
� Secondary outcomes: FPG levels, glycated hemoglobin, insulin sensitivity, and beta-cell function

Glycemic durability of rosiglitazone, metformin, or glyburide monotherapy
Results� 5 years cumulative incidence of monotherapy failure: 15%
with rosiglitazone, 21% with metformin, 34% with glyburide. This represents a risk reduction of 32% for rosiglitazone as compared with metformin and 64% as compared with glyburide (p<0.01 for both)
� Risk of cardiovascular (CV) events: glyburide was associated with lower CV risk than rosiglitazone (p<0.05) and risk was similar between the rosiglitazone group and metformin group
� Rosiglitazone was associated with more weight gain and edema than either glyburide or metformin; less hypoglycemia than glyburide and less GI effects than metformin (p<0.001 for all)
� Rosiglitazone was associated with a higher rate of fractures in women

Rosiglitazone Evaluated for Cardiac Outcomes and Regulation of Glycemia in Diabetes (RECORD)
Design� To evaluate long-term impact of rosiglitazone on
cardiovascular outcomes and blood glucose control, compared to the conventional medications metformin and sulfonylureas
� 338 centers in 23 countries,� 5.5 years duration� randomized 4447 people with type 2 diabetes who
were already taking metformin or sulfonylurea alone

Rosiglitazone Evaluated for Cardiac Outcomes and Regulation of Glycemia in Diabetes (RECORD)
� 4447 people with type 2 diabetes with mean HbA1c: 7.9%, who were already taking metformin or sulfonylurea alone
1. Add-on rosiglitazone 2. Combination of metformin and sulfonylurea
Goal: HbA1c: 7.0 or less
If HbA1c >8.5
Add a third oral glucose-lowering agent Add insulin

Rosiglitazone Evaluated for Cardiac Outcomes and Regulation of Glycemia in Diabetes (RECORD)
� On the composite outcomes of cardiovascular death, stroke and heart attack the result was slightly but not statistically significant in favor of rosiglitazone
� Rosiglitazone was shown to be superior in controlling blood glucose than older metformin and sulfonylurea therapies
� Found a double risk for heart failure� Found an increased risk of arm and lower leg
fractures in women

A Randomized Trial of Therapies for Type 2 Diabetes and Coronary Artery Disease.The BARI 2D Study Group. NEJM, 360:2503-2515
Angioplasty Revascularization Investigation in Type 2 Diabetes (BARI 2D) study
� Evaluated the cardiovascular treatment approach compared to a diabetes control approach in persons with type 2 diabetes and stable coronary artery disease to reduce deaths or deaths and cardiovascular events (MI, stroke) combined
� 2368 people with stable heart disease and type 2 diabetes
� 5 years average follow up

Angioplasty Revascularization Investigation in Type 2 Diabetes (BARI 2D) study
� Prompt bypass surgery or angioplasty does NOT lower mortality risk compared to drug therapy in people with type 2 diabetes and stable heart disease.
� No difference in mortality risk between drugs that reduce insulin resistance and drugs that provide insulin

Angioplasty Revascularization Investigation in Type 2 Diabetes (BARI 2D) study
� No increase in heart attacks was observed in the rosiglitazone group
� Prompt CABG had significantly better outcomes when compared to medical treatment alone when CV events were considered in addition to death (non-fatal MI)
� Among the subgroup of patients pre-identified as candidates for CABG, the subgroup that received prompt surgery had fewer heart attacks or strokes compared to those receiving intensive medical therapy alone

Diabetes:diagnosis, classification, management
� Definition� Epidemiology� Classification� Diagnosis� Treatment� Evidence� Treatment goals

* Postprandial measurements should be made 1-2 h after the beginning of the meal, generally peak levels in patients with diabetes.
Standards of Medical Care in Diabetes–2009. ADA Position Statement. Diabetes Care;32:S13-S61.
Glycemic goals: non-pregnant adults with diabetes
* Postprandial measurements should be made 1-2 h after the beginning of the meal, generally peak levels in patients with diabetes.
� HbA1c < 7.0%� Preprandial capillary plasma glucose 70-130 mg/dl (3.9-7.2 mmol/l) � Peak postprandial capillary plasma glucose < 180 mg/dl (< 10.0 mmol/l)*� Key concepts in setting glycemic goals� HbA1c is the primary target for glycemic control� Goals should be individualized based on:
� duration of diabetes� age/life expectancy� comorbid conditions� known CVD or advanced microvascular complications� hypoglycemia unawareness� individual patient considerations
� More or less stringent glycemic goals may be appropriate for individual patients
� Postprandial glucose may be targeted if HbA1c goals are not met despite reaching preprandial glucose goals

Road Maps to Achieve Glycemic ControlIn Type 2 Diabetes Mellitus
ACE/AACE Diabetes Road Map Task Force
ChairpersonsPaul S. Jellinger, MD, MACE, Co-Chair
Jaime A. Davidson, MD, FACE, Co-Chair
Task Force MembersLawrence Blonde, MD, FACP, FACEDaniel Einhorn, MD, FACP, FACE
George Grunberger, MD, FACP, FACEYehuda Handelsman, MD, FACP, FACE
Richard Hellman, MD, FACP, FACEHarold Lebovitz, MD, FACE
Philip Levy, MD, FACEVictor L. Roberts, MD, MBA, FACP, FACE
© 2008 AACE. All rights reserved. No portion of the Roadmap may be altered, reproducedor distributed in any form without the express permission of AACE.
Revision April 2008
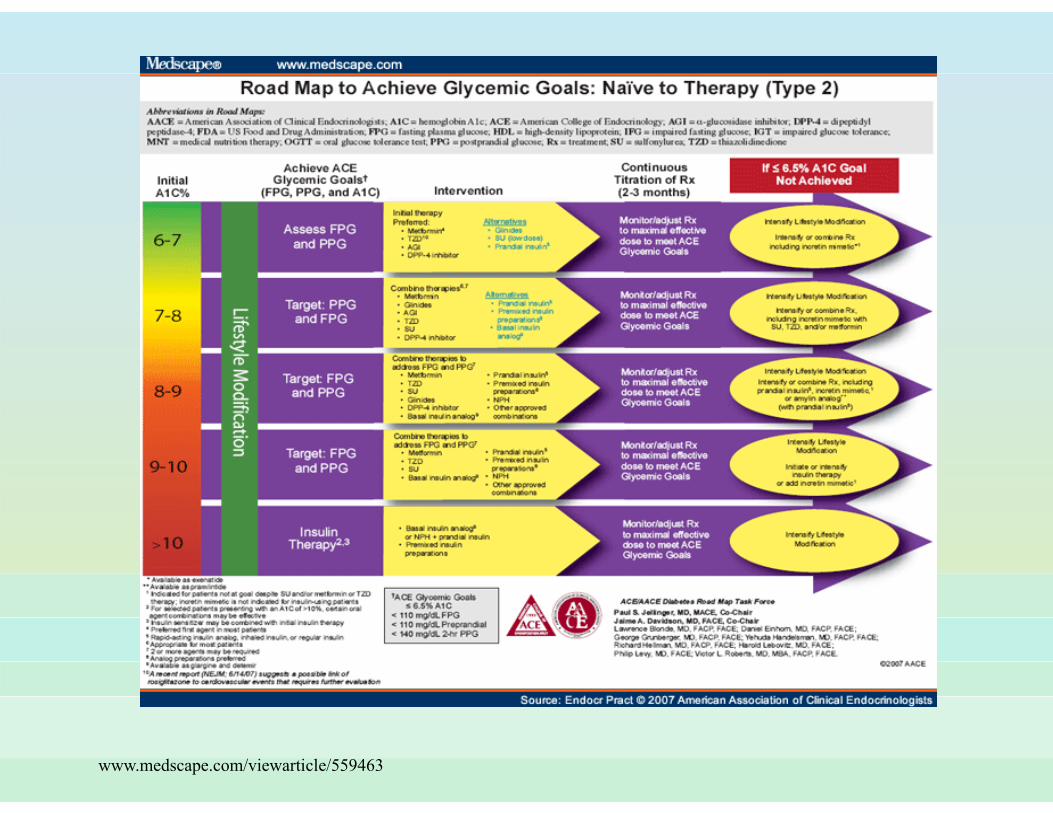
www.medscape.com/viewarticle/559463

Algorithm for the metabolic management of type 2 diabetes; Reinforce lifestyle interventions at every visit and check A1C every 3 months until A1C is <7% and then at least every 6 months. The interventions should be changed if A1C is ≥7%. a)Sulfonylureas other thanglybenclamide (glyburide) or chlorpropamide. b)Insufficient clinical use to be confident regarding safety.
ADA Treatment Algorithm

Medications used for weight loss*
* http://www.uptodate.com/contents/drug-therapy-of-obesity?source=search_result&search=obesity+drug+therapy&selectedTitle=1%7E150
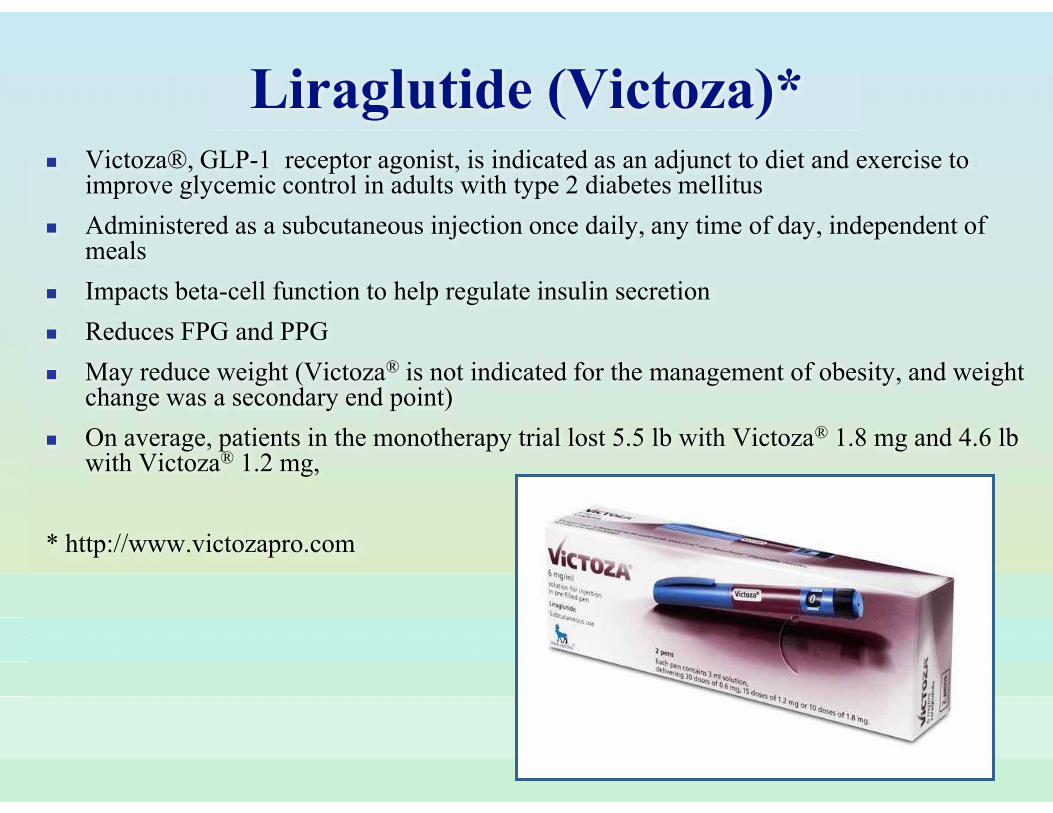
Liraglutide (Victoza)* � Victoza®, GLP-1 receptor agonist, is indicated as an adjunct to diet and exercise to
improve glycemic control in adults with type 2 diabetes mellitus � Administered as a subcutaneous injection once daily, any time of day, independent of
meals � Impacts beta-cell function to help regulate insulin secretion� Reduces FPG and PPG� May reduce weight (Victoza® is not indicated for the management of obesity, and weight
change was a secondary end point) � On average, patients in the monotherapy trial lost 5.5 lb with Victoza® 1.8 mg and 4.6 lb
with Victoza® 1.2 mg,
* http://www.victozapro.com

Exenatide (Byetta, Bydureon)*� Long-acting synthetic peptide that is a GLP-1 receptor agonist, is available for adjunctive
therapy for patients with type 2 diabetes who are inadequately controlled on oral agents.� Exenatide in its Byetta form is administered as a subcutaneous injection any time within the
60 minutes before the first and last meal of the day. � A once-weekly injection has been approved as of January 27, 2012 under the trademark
Bydureon.� Dose-dependent weight loss has been reported in trials of exenatide in patients with type 2
diabetes not well controlled on oral agents.� Whether this weight loss was related to nausea, a common side effect of exenatide, is not
known. However, in one of the trials, a post-hoc analysis showed no correlation between change in body weight and duration of nausea. Weight loss after 18 months was 4.5 kg without any dietary or exercise program.
*http://www.nytimes.com/2012/01/28/health/bydureon-a-diabetes-drug-from-amylin-wins-fda-approval.html.

Pramlinide (Symlin)� Antihyperglycemic drug for use in patients with diabetes treated with
insulin, is a synthetic analog of human amylin, anaturally occurring neuroendocrine hormone synthesized by pancreatic beta cells that contributes to glucose control during the postprandial period.
� Administered as a subcutaneous injection within 15 min before breakfast, lunch and dinner.
� Associated with modest weight loss. In a meta-analysis of eight randomized trials, pramlintide reduced weight compared with placebo (mean difference -2.57 and -2.27 kg, in patients with and without diabetes, respectively).

Orlistat (Xenical)� Lipase inhibitor, used for management of
obesity, including weight loss and weight management, when used in conjunction with a reduced-calorie and low-fat diet;
� Reduces the risk of weight regain after prior weight loss;
� Indicated for obese patients with an initial body mass index (BMI) ≥30 kg/m2 or ≥27 kg/m2 in the presence of other risk factors (eg, diabetes, dyslipidemia, hypertension)
� Pooled data from five clinical trials indicated that the overall mean weight loss from randomization to the end of 1 year of treatment in the intent-to-treat population was 13.4 lbs in the patients treated with XENICAL and 5.8 lbs in the placebo-treated patients.*
*http://www.gene.com/gene/products/information/xenical/pdf/pi.pdf
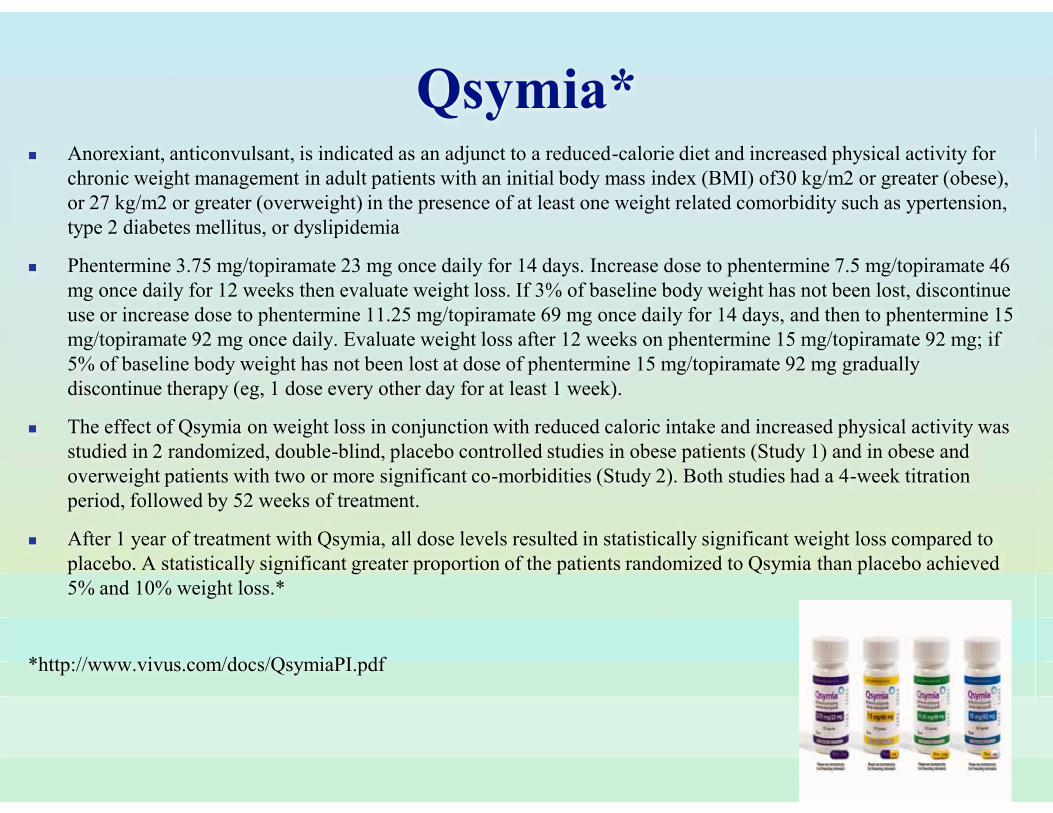
Qsymia*� Anorexiant, anticonvulsant, is indicated as an adjunct to a reduced-calorie diet and increased physical activity for
chronic weight management in adult patients with an initial body mass index (BMI) of30 kg/m2 or greater (obese), or 27 kg/m2 or greater (overweight) in the presence of at least one weight related comorbidity such as ypertension, type 2 diabetes mellitus, or dyslipidemia
� Phentermine 3.75 mg/topiramate 23 mg once daily for 14 days. Increase dose to phentermine 7.5 mg/topiramate 46 mg once daily for 12 weeks then evaluate weight loss. If 3% of baseline body weight has not been lost, discontinue use or increase dose to phentermine 11.25 mg/topiramate 69 mg once daily for 14 days, and then to phentermine 15 mg/topiramate 92 mg once daily. Evaluate weight loss after 12 weeks on phentermine 15 mg/topiramate 92 mg; if 5% of baseline body weight has not been lost at dose of phentermine 15 mg/topiramate 92 mg gradually discontinue therapy (eg, 1 dose every other day for at least 1 week).
� The effect of Qsymia on weight loss in conjunction with reduced caloric intake and increased physical activity was studied in 2 randomized, double-blind, placebo controlled studies in obese patients (Study 1) and in obese and overweight patients with two or more significant co-morbidities (Study 2). Both studies had a 4-week titration period, followed by 52 weeks of treatment.
� After 1 year of treatment with Qsymia, all dose levels resulted in statistically significant weight loss compared to placebo. A statistically significant greater proportion of the patients randomized to Qsymia than placebo achieved 5% and 10% weight loss.*
*http://www.vivus.com/docs/QsymiaPI.pdf

Lorcaserin (Belviq®)� Serotonin 5-HT2C Receptor Agonist
� Product Availability Belviq®: FDA approved June 2012; anticipated availability is first quarter of 2013. Consult prescribing information for additional information.
� Use Chronic weight management, as an adjunct to a reduced-calorie diet and increased physical activity, in patients with either an initial body mass index (BMI) of ≥30 kg/m2 or an initial BMI of ≥27 kg/m2 and at least one weight-related comorbid condition (eg, hypertension, dyslipidemia, type 2 diabetes).
� In the BELVIQ placebo-controlled clinical database of trials of at least one year in duration, of 6888 patients (3451 BELVIQ vs. 3437 placebo; age range 18-66 years, 79.3% women, 66.6% Caucasians, 19.2% Blacks, 11.8% Hispanics, 2.4% other, 7.4% type 2 diabetics), a total of 1969 patients were exposed to BELVIQ 10 mg twice daily for 1 year and 426 patients were exposed for 2 years.
� Approval was based on data from three double-blind, randomized, placebo-controlled trials lasting 52 to 104 weeks. The studies included patients with (n = 499) and without (n = 6,136) type 2 diabetes. Lorcaserin, along with diet and exercise, was more effective than diet and exercise alone in helping patients lose 5% or more of their body weight after 1 year and managing the weight loss for up to 2 years*.
* http://www.pharmacist.com/node/29402

Name Pharmacologic Category Dose
Route of
administration
Image
Liraglutide (Victoza)
GLP-1 Receptor agonist
0.6mg1.2 mg1.8 mg SC
Exenatide (Byetta, Bydureon)
GLP-1 receptor agonist
5 mcg10 mcg2mg
SC
Pramlinide (Symlin)
synthetic analog of human amylin
15 mcg 60 mcg30 mcg 120 mcg45 mcg
SC
Orlistat (Xenical) Lipase inhibitor 120 mg PO
Phentermine and topiramate(Qsymia)
anorexiant, anticonvulsant
3.75 mg/23mg7. 5 mg/46mg15mg/92mg PO
Lorcaserin (Belviq®)
serotonin 5-HT2C Receptor Agonist
10 mg PO

Thank you
11/29/2012