FAILURE MODES AND FAILURE MECHANISMS OF FIBER REINFORCED ... · PDF fileFAILURE MODES AND...
10
1 FAILURE MODES AND FAILURE MECHANISMS OF FIBER REINFORCED POLYMER COMPOSITE BRIDGE DECKS Aixi Zhou, Virginia Polytechnic Institute and State University, Blacksburg, VA John J. Lesko, Virginia Polytechnic Institute and State University, Blacksburg, VA Jason T. Coleman, Virginia Polytechnic Institute and State University, Blacksburg, VA Thomas E. Cousins, Virginia Polytechnic Institute and State University, Blacksburg, VA Abstract A systematic testing program was conducted to investigate the failure modes and failure mechanisms of multi-cellular FRP composite bridge decks. To compare loading patch effects on deck local failure, a steel patch made according to AASHTO specifications and a special rubber-stuffed truck tire patch were used in lab testing. The testing results showed that the failure of FRP deck using steel patch was local punching and shear cracking; while the deck failure using tire patch was local bending failure. Deck–loading patch contacting analyses were also conducted using Finite Element Method. This research showed that the failure modes of the investigated multi-cellular FRP deck systems were related to the stiffness and deformability of the loading patches. Key Words FRP bridge deck, multi-cellular deck, failure mode, failure mechanism, finite element analysis Introduction Fiber-Reinforced Polymer (FRP) composite is a subdivision of the composite fields in which the matrix is a polymer and the reinforcement is a fiber. FRP composites were first demonstrated to reinforce concrete structures in the mid-1950s [1]. In 1976, the first FRP composite bridge was constructed in Israel. The first all-composites pedestrian bridge was installed in 1992 in Scotland. In the U.S., the first FRP composite vehicular bridge deck was installed in Kansas in 1996. Today, there are hundreds of finished and underway FRP bridge projects all over the world. In these applications, the using of FRP composites can be summarized as two categories: 1) Bridge Renewals: bridge structures rehabilitation (repair, strengthening and seismic retrofitting) and bridge superstructures (decks, girders) replacement; 2) New Bridge Constructions: bridge structures made entirely of FRP composites; concrete bridges with FRP rebar reinforcement and external FRP cable stays; protective or secondary structural systems (e.g., FRP-wrapped components). The attraction of FRP composites for bridge applications comes from the fight against the deteriorating and deficiency of existing bridges. Of all the elements in a bridge, the bridge deck perhaps requires the maximum maintenance. It’s estimated that bridges in the U.S. on an average last 68 years, whereas their decks last only 35 years [2]. In addition to the problem of deterioration and deficiency, renewing bridges today often requires increased load rating over their initial designs to accommodate increased traffic live loads. Furthermore, bridge owners are seeking to repair or replace their bridges at lower costs, with faster installation to reduce the impact to the traveling public. These demands have resulted in a significant deck replacement market and created tremendous opportunities for FRP bridge
Transcript of FAILURE MODES AND FAILURE MECHANISMS OF FIBER REINFORCED ... · PDF fileFAILURE MODES AND...
1
FAILURE MODES AND FAILURE MECHANISMS OF FIBER REINFORCED POLYMER COMPOSITE BRIDGE DECKS
Aixi Zhou, Virginia Polytechnic Institute and State University, Blacksburg, VA
John J. Lesko, Virginia Polytechnic Institute and State University, Blacksburg, VA Jason T. Coleman, Virginia Polytechnic Institute and State University, Blacksburg, VA Thomas E. Cousins, Virginia Polytechnic Institute and State University, Blacksburg, VA
Abstract
A systematic testing program was conducted to investigate the failure modes and failure mechanisms of multi-cellular FRP composite bridge decks. To compare loading patch effects on deck local failure, a steel patch made according to AASHTO specifications and a special rubber-stuffed truck tire patch were used in lab testing. The testing results showed that the failure of FRP deck using steel patch was local punching and shear cracking; while the deck failure using tire patch was local bending failure. Deck–loading patch contacting analyses were also conducted using Finite Element Method. This research showed that the failure modes of the investigated multi-cellular FRP deck systems were related to the stiffness and deformability of the loading patches.
Key Words
FRP bridge deck, multi-cellular deck, failure mode, failure mechanism, finite element analysis
Introduction
Fiber-Reinforced Polymer (FRP) composite is a subdivision of the composite fields in which the matrix is a polymer and the reinforcement is a fiber. FRP composites were first demonstrated to reinforce concrete structures in the mid-1950s [1]. In 1976, the first FRP composite bridge was constructed in Israel. The first all-composites pedestrian bridge was installed in 1992 in Scotland. In the U.S., the first FRP composite vehicular bridge deck was installed in Kansas in 1996. Today, there are hundreds of finished and underway FRP bridge projects all over the world. In these applications, the using of FRP composites can be summarized as two categories: 1) Bridge Renewals: bridge structures rehabilitation (repair, strengthening and seismic retrofitting) and bridge superstructures (decks, girders) replacement; 2) New Bridge Constructions: bridge structures made entirely of FRP composites; concrete bridges with FRP rebar reinforcement and external FRP cable stays; protective or secondary structural systems (e.g., FRP-wrapped components).
The attraction of FRP composites for bridge applications comes from the fight against the deteriorating and deficiency of existing bridges. Of all the elements in a bridge, the bridge deck perhaps requires the maximum maintenance. It’s estimated that bridges in the U.S. on an average last 68 years, whereas their decks last only 35 years [2]. In addition to the problem of deterioration and deficiency, renewing bridges today often requires increased load rating over their initial designs to accommodate increased traffic live loads. Furthermore, bridge owners are seeking to repair or replace their bridges at lower costs, with faster installation to reduce the impact to the traveling public. These demands have resulted in a significant deck replacement market and created tremendous opportunities for FRP bridge
2
decks. FRP bridge decks are believed to have improved corrosion resistance, high strength-to-weight ratio, and easy installation.
FRP bridge deck systems possess many complicated physical, chemical and other types of properties, but there exist at least two principle characteristics that are of primary importance in deck design, namely stiffness and strength. The stiffness of an FRP deck is the ability of the deck to resist changes in shape. Deck strength is the quality or state of being strong, i.e., the ability to resist loads. The development of design codes and guidelines is primarily based on the comprehension of the stiffness and strength characteristics of FRP deck systems. Other issues on the use of FRP decks, such as durability, efficiency and structural optimization, are also related to the understanding of the stiffness and strength of FRP deck. As a continued research on the stiffness characterization of FRP decks by Zhou et al. [3], this study investigates the failure modes and failure mechanisms of the thin-walled multi-cellular FRP deck systems. The study was conducted by examining two FRP deck panels. One deck panel was tested and loaded to failure using a steel loading patch. This loading patch was made according to ASSHTO design and testing specifications for concrete bridge decks. The other deck panel was tested and loaded to failure using a special loading patch made of real truck tire stuffed with silicon rubber. Finite element analyses were also carried out to model the effects of loading patch–deck contacting on local stress/strain distributions.
Bridge Deck Configurations
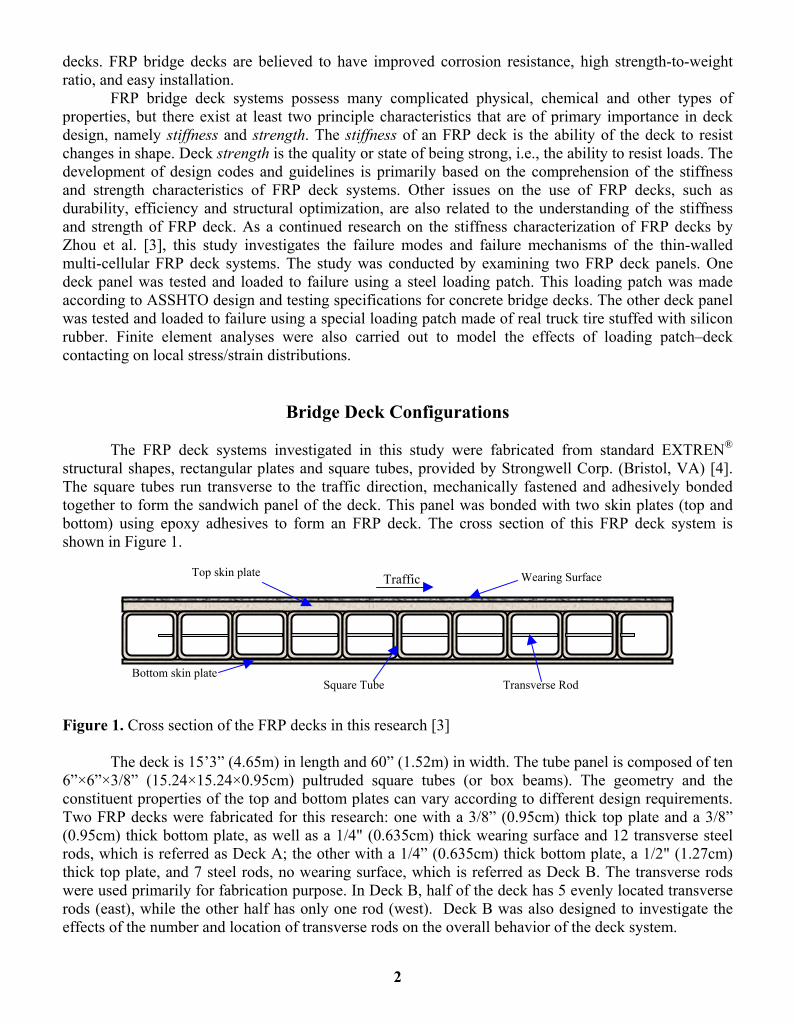
The FRP deck systems investigated in this study were fabricated from standard EXTREN® structural shapes, rectangular plates and square tubes, provided by Strongwell Corp. (Bristol, VA) [4]. The square tubes run transverse to the traffic direction, mechanically fastened and adhesively bonded together to form the sandwich panel of the deck. This panel was bonded with two skin plates (top and bottom) using epoxy adhesives to form an FRP deck. The cross section of this FRP deck system is shown in Figure 1.
Figure 1. Cross section of the FRP decks in this research [3] The deck is 15’3” (4.65m) in length and 60” (1.52m) in width. The tube panel is composed of ten
6”×6”×3/8” (15.24×15.24×0.95cm) pultruded square tubes (or box beams). The geometry and the constituent properties of the top and bottom plates can vary according to different design requirements. Two FRP decks were fabricated for this research: one with a 3/8” (0.95cm) thick top plate and a 3/8” (0.95cm) thick bottom plate, as well as a 1/4" (0.635cm) thick wearing surface and 12 transverse steel rods, which is referred as Deck A; the other with a 1/4” (0.635cm) thick bottom plate, a 1/2" (1.27cm) thick top plate, and 7 steel rods, no wearing surface, which is referred as Deck B. The transverse rods were used primarily for fabrication purpose. In Deck B, half of the deck has 5 evenly located transverse rods (east), while the other half has only one rod (west). Deck B was also designed to investigate the effects of the number and location of transverse rods on the overall behavior of the deck system.
Wearing Surface Top skin plate
Bottom skin plate Square Tube Transverse Rod
Traffic
3
Testing Specifications And Laboratory Testing Setup
Though there are no official specifications specially proposed for FRP bridge superstructure design and testing, the design loads and tire contact area specified in AASHTO’s Standard Specifications for Highway Bridges [5] and the AASHTO LRFD Specifications [6] have been used for lab testing by most FRP deck researchers. When designing the superstructure members of a bridge, the specified loads are applied in critical locations to produce the maximum load effect. The load that produces the largest stress is considered to be the design load. According to AASHTO specifications [5], designer can apply the design wheel load over a finite surface area of the deck in computing the load effects in a reinforced concrete bridge deck. This area is defined as the “tire contact area” and the equation used to compute it is given in the specification. The AASHTO LRFD Specifications [6] proposes a different equation to compute the tire contact area. Although the specifications state that the above method of analysis is to be used for reinforced concrete bridge decks, most researchers have chosen to apply HS20 truck loads to FRP decks using the tire contact area method since there are currently no provisions related to FRP decks in any of AASHTO’s specifications [7]. Some researchers have also used the equivalent of an HS25 design wheel when applying load to their FRP decks. (An HS25 design truck is the same as an HS20 truck except that all loads have been increased by 25%.) In this research, the design load HS25 was used for stiffness testing. While in the failure tests, the decks were loaded till to failure, and the failure loads were reported as decks’ ultimate loads.
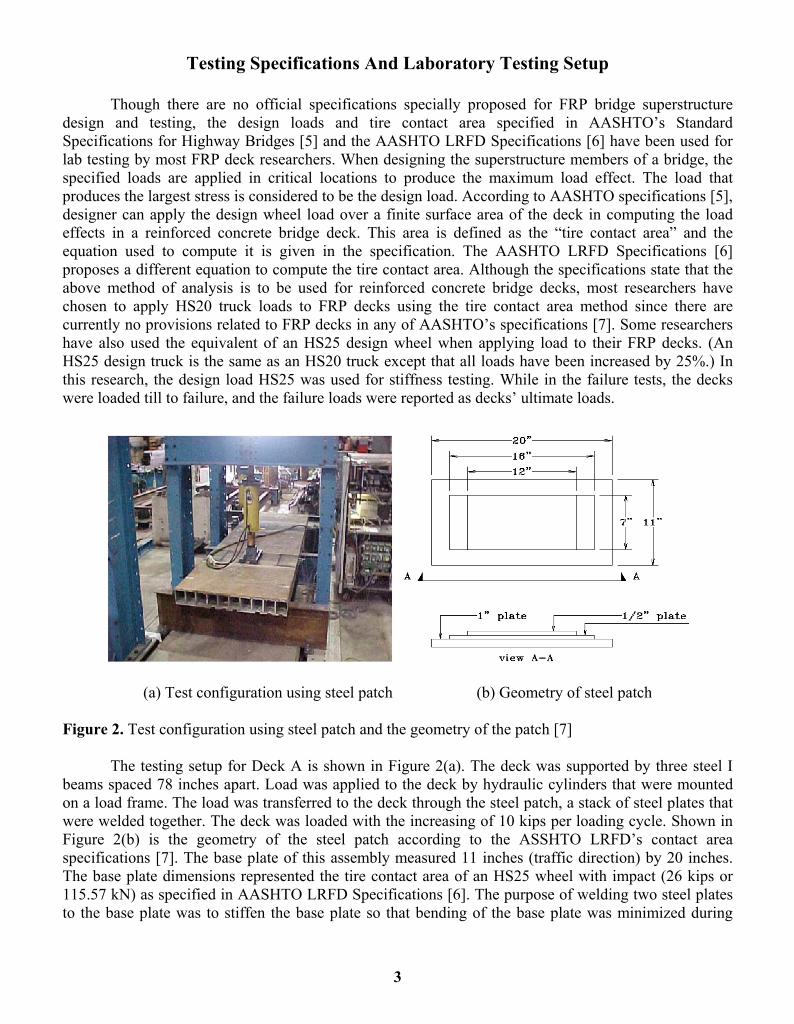
(a) Test configuration using steel patch (b) Geometry of steel patch Figure 2. Test configuration using steel patch and the geometry of the patch [7]
The testing setup for Deck A is shown in Figure 2(a). The deck was supported by three steel I
beams spaced 78 inches apart. Load was applied to the deck by hydraulic cylinders that were mounted on a load frame. The load was transferred to the deck through the steel patch, a stack of steel plates that were welded together. The deck was loaded with the increasing of 10 kips per loading cycle. Shown in Figure 2(b) is the geometry of the steel patch according to the ASSHTO LRFD’s contact area specifications [7]. The base plate of this assembly measured 11 inches (traffic direction) by 20 inches. The base plate dimensions represented the tire contact area of an HS25 wheel with impact (26 kips or 115.57 kN) as specified in AASHTO LRFD Specifications [6]. The purpose of welding two steel plates to the base plate was to stiffen the base plate so that bending of the base plate was minimized during
4
loading, thereby ensuring a nearly uniform distribution of load over the base plate contact area [7]. Neoprene rubber pads were inserted in between the steel plate and the surface of the deck to prevent the steel plate from locally damaging the wearing surface of the deck during testing.
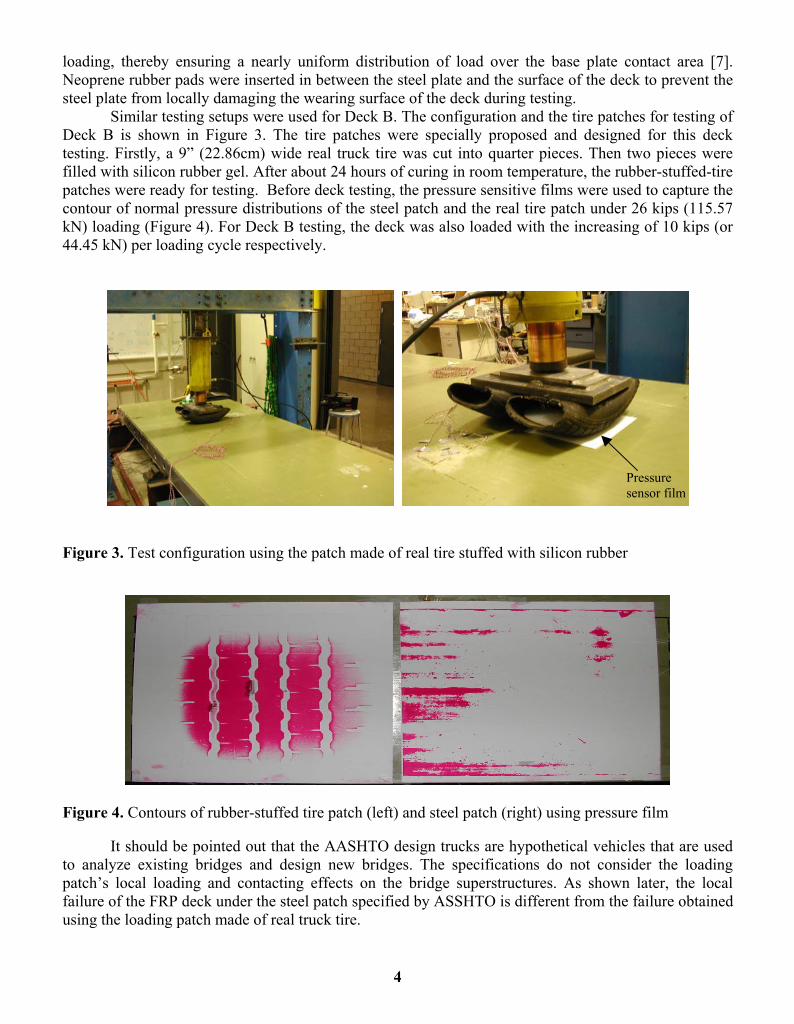
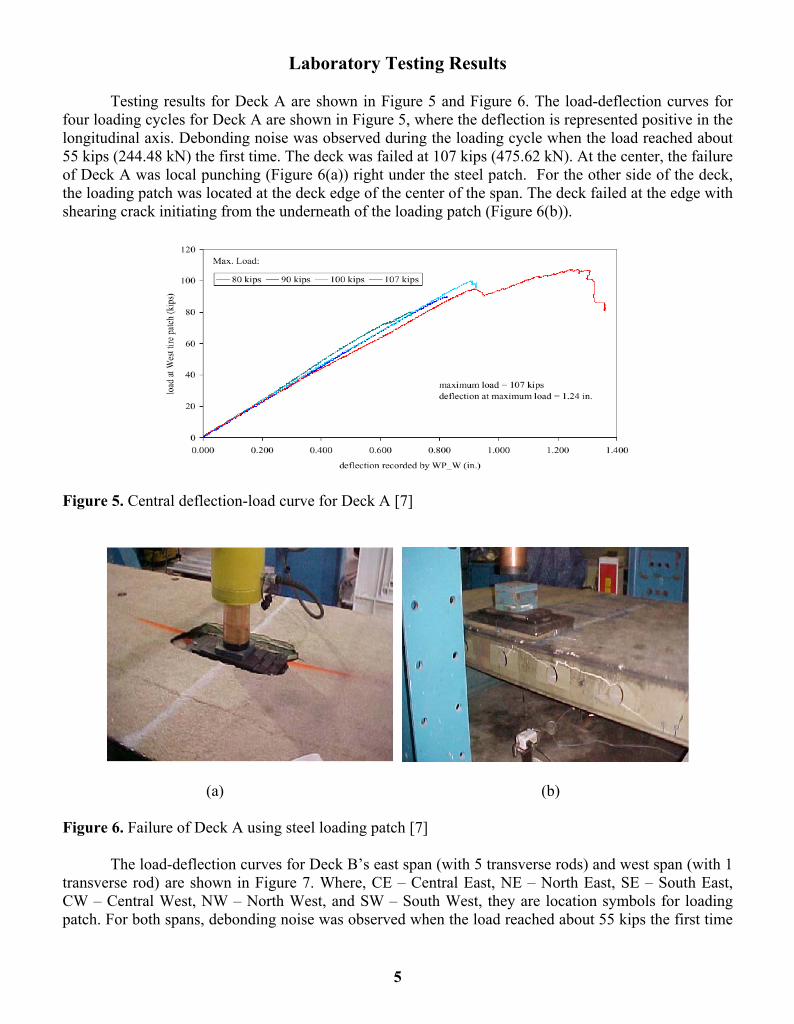
Similar testing setups were used for Deck B. The configuration and the tire patches for testing of Deck B is shown in Figure 3. The tire patches were specially proposed and designed for this deck testing. Firstly, a 9” (22.86cm) wide real truck tire was cut into quarter pieces. Then two pieces were filled with silicon rubber gel. After about 24 hours of curing in room temperature, the rubber-stuffed-tire patches were ready for testing. Before deck testing, the pressure sensitive films were used to capture the contour of normal pressure distributions of the steel patch and the real tire patch under 26 kips (115.57 kN) loading (Figure 4). For Deck B testing, the deck was also loaded with the increasing of 10 kips (or 44.45 kN) per loading cycle respectively.
Figure 3. Test configuration using the patch made of real tire stuffed with silicon rubber
Figure 4. Contours of rubber-stuffed tire patch (left) and steel patch (right) using pressure film
It should be pointed out that the AASHTO design trucks are hypothetical vehicles that are used
to analyze existing bridges and design new bridges. The specifications do not consider the loading patch’s local loading and contacting effects on the bridge superstructures. As shown later, the local failure of the FRP deck under the steel patch specified by ASSHTO is different from the failure obtained using the loading patch made of real truck tire.
Pressure sensor film
5
Laboratory Testing Results
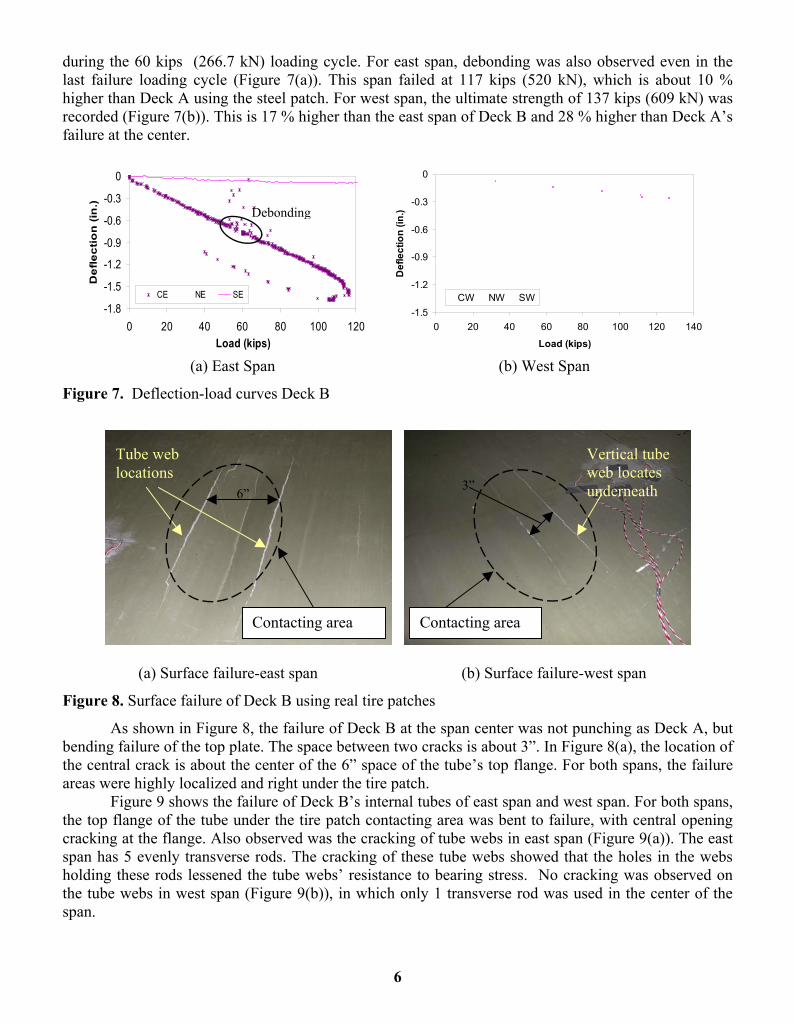
Testing results for Deck A are shown in Figure 5 and Figure 6. The load-deflection curves for four loading cycles for Deck A are shown in Figure 5, where the deflection is represented positive in the longitudinal axis. Debonding noise was observed during the loading cycle when the load reached about 55 kips (244.48 kN) the first time. The deck was failed at 107 kips (475.62 kN). At the center, the failure of Deck A was local punching (Figure 6(a)) right under the steel patch. For the other side of the deck, the loading patch was located at the deck edge of the center of the span. The deck failed at the edge with shearing crack initiating from the underneath of the loading patch (Figure 6(b)).
Figure 5. Central deflection-load curve for Deck A [7]
(a) (b) Figure 6. Failure of Deck A using steel loading patch [7]
The load-deflection curves for Deck B’s east span (with 5 transverse rods) and west span (with 1 transverse rod) are shown in Figure 7. Where, CE – Central East, NE – North East, SE – South East, CW – Central West, NW – North West, and SW – South West, they are location symbols for loading patch. For both spans, debonding noise was observed when the load reached about 55 kips the first time
6
during the 60 kips (266.7 kN) loading cycle. For east span, debonding was also observed even in the last failure loading cycle (Figure 7(a)). This span failed at 117 kips (520 kN), which is about 10 % higher than Deck A using the steel patch. For west span, the ultimate strength of 137 kips (609 kN) was recorded (Figure 7(b)). This is 17 % higher than the east span of Deck B and 28 % higher than Deck A’s failure at the center.
-1.8
-1.5
-1.2
-0.9
-0.6
-0.3
0
0 20 40 60 80 100 120Load (kips)
Def
lect
ion
(in
.)
CE NE SE
-1.5
-1.2
-0.9
-0.6
-0.3
0
0 20 40 60 80 100 120 140
Load (kips)
Def
lect
ion
(in.)
CW NW SW
(a) East Span (b) West Span
Figure 7. Deflection-load curves Deck B
(a) Surface failure-east span (b) Surface failure-west span
Figure 8. Surface failure of Deck B using real tire patches
As shown in Figure 8, the failure of Deck B at the span center was not punching as Deck A, but bending failure of the top plate. The space between two cracks is about 3”. In Figure 8(a), the location of the central crack is about the center of the 6” space of the tube’s top flange. For both spans, the failure areas were highly localized and right under the tire patch.
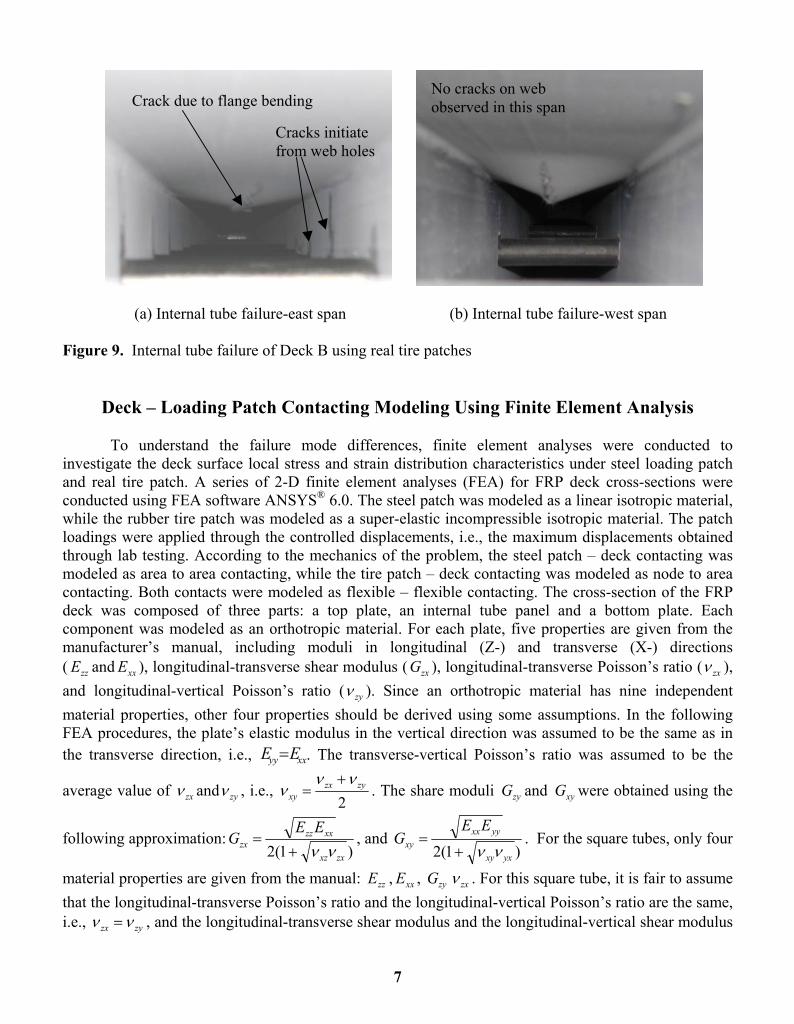
Figure 9 shows the failure of Deck B’s internal tubes of east span and west span. For both spans, the top flange of the tube under the tire patch contacting area was bent to failure, with central opening cracking at the flange. Also observed was the cracking of tube webs in east span (Figure 9(a)). The east span has 5 evenly transverse rods. The cracking of these tube webs showed that the holes in the webs holding these rods lessened the tube webs’ resistance to bearing stress. No cracking was observed on the tube webs in west span (Figure 9(b)), in which only 1 transverse rod was used in the center of the span.
Debonding
6”
Tube web locations
Vertical tube web locates underneath 3”
Contacting area Contacting area
7
(a) Internal tube failure-east span (b) Internal tube failure-west span Figure 9. Internal tube failure of Deck B using real tire patches
Deck – Loading Patch Contacting Modeling Using Finite Element Analysis
To understand the failure mode differences, finite element analyses were conducted to investigate the deck surface local stress and strain distribution characteristics under steel loading patch and real tire patch. A series of 2-D finite element analyses (FEA) for FRP deck cross-sections were conducted using FEA software ANSYS® 6.0. The steel patch was modeled as a linear isotropic material, while the rubber tire patch was modeled as a super-elastic incompressible isotropic material. The patch loadings were applied through the controlled displacements, i.e., the maximum displacements obtained through lab testing. According to the mechanics of the problem, the steel patch – deck contacting was modeled as area to area contacting, while the tire patch – deck contacting was modeled as node to area contacting. Both contacts were modeled as flexible – flexible contacting. The cross-section of the FRP deck was composed of three parts: a top plate, an internal tube panel and a bottom plate. Each component was modeled as an orthotropic material. For each plate, five properties are given from the manufacturer’s manual, including moduli in longitudinal (Z-) and transverse (X-) directions ( zzE and xxE ), longitudinal-transverse shear modulus ( zxG ), longitudinal-transverse Poisson’s ratio ( zxν ), and longitudinal-vertical Poisson’s ratio ( zyν ). Since an orthotropic material has nine independent material properties, other four properties should be derived using some assumptions. In the following FEA procedures, the plate’s elastic modulus in the vertical direction was assumed to be the same as in the transverse direction, i.e., xxyy EE = . The transverse-vertical Poisson’s ratio was assumed to be the
average value of zxν and zyν , i.e., 2
zyzxxy
ννν
+= . The share moduli zyG and xyG were obtained using the
following approximation:)1(2 zxxz
xxzzzx
EEG
νν+= , and
)1(2 yxxy
yyxxxy
EEG
νν+= . For the square tubes, only four
material properties are given from the manual: zzE , xxE , zyG zxν . For this square tube, it is fair to assume that the longitudinal-transverse Poisson’s ratio and the longitudinal-vertical Poisson’s ratio are the same, i.e., zyzx νν = , and the longitudinal-transverse shear modulus and the longitudinal-vertical shear modulus
Crack due to flange bending
Cracks initiate from web holes
No cracks on web observed in this span
8
are equal, i.e., zxzy GG = . For a real material, the stress-strain matrix is required to be positive definite in the procedure of Finite Element Analysis. Being positive definite means that the following equation must hold for the material constants of the plates and the square tubes:
1- HnyzL2*EzzEyy - HnxzL2 *
ExxEzz -HnxyL2 *
ExxEyy - 2 nxy * nxz* nyz*
ExxEyy > 0
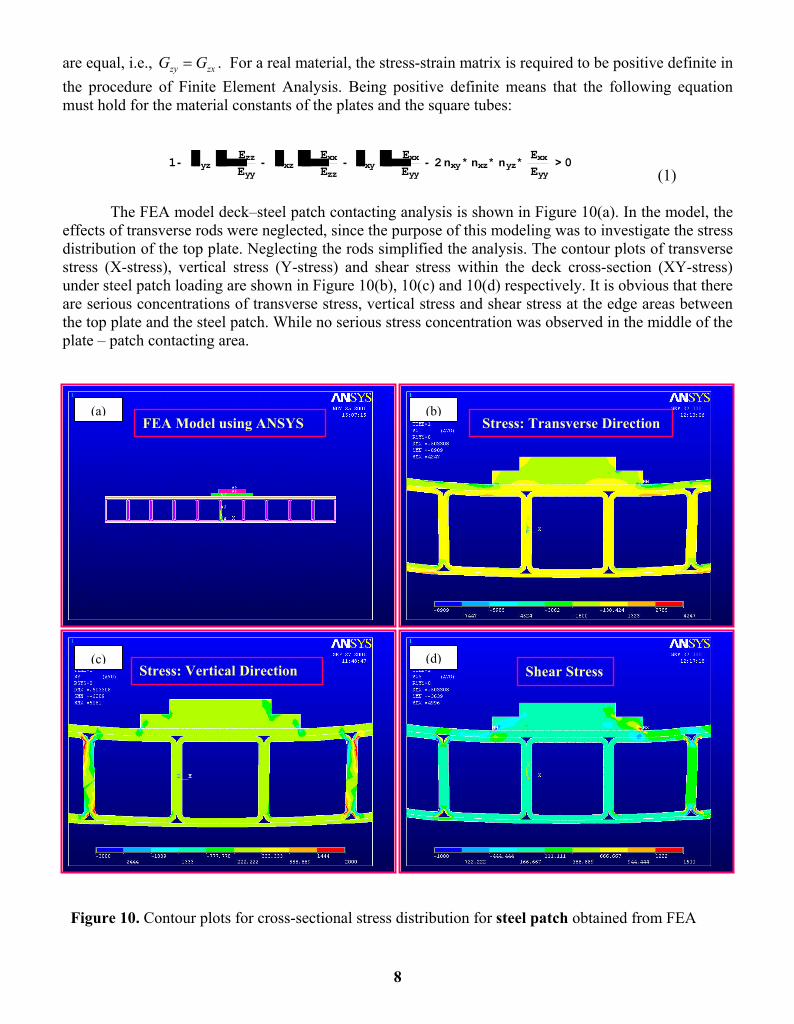
(1) The FEA model deck–steel patch contacting analysis is shown in Figure 10(a). In the model, the
effects of transverse rods were neglected, since the purpose of this modeling was to investigate the stress distribution of the top plate. Neglecting the rods simplified the analysis. The contour plots of transverse stress (X-stress), vertical stress (Y-stress) and shear stress within the deck cross-section (XY-stress) under steel patch loading are shown in Figure 10(b), 10(c) and 10(d) respectively. It is obvious that there are serious concentrations of transverse stress, vertical stress and shear stress at the edge areas between the top plate and the steel patch. While no serious stress concentration was observed in the middle of the plate – patch contacting area.
Figure 10. Contour plots for cross-sectional stress distribution for steel patch obtained from FEA
FEA Model using ANSYS Stress: Transverse Direction
Stress: Vertical Direction Shear Stress
(a) (b)
(c) (d)
9
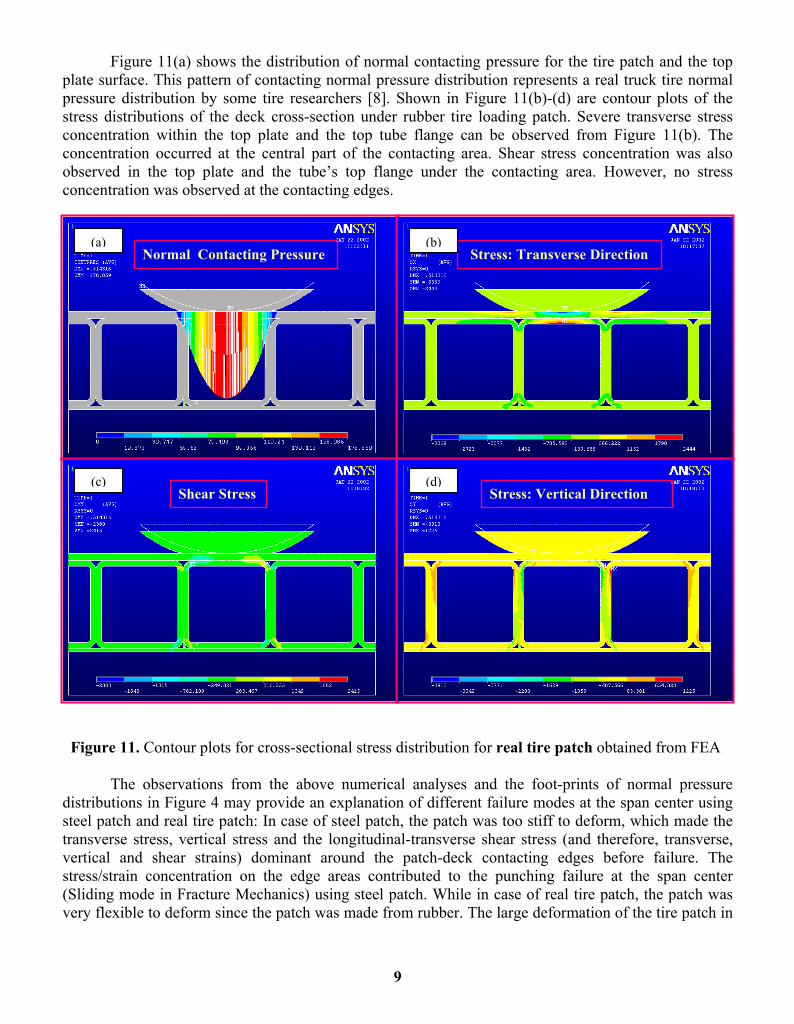
Figure 11(a) shows the distribution of normal contacting pressure for the tire patch and the top plate surface. This pattern of contacting normal pressure distribution represents a real truck tire normal pressure distribution by some tire researchers [8]. Shown in Figure 11(b)-(d) are contour plots of the stress distributions of the deck cross-section under rubber tire loading patch. Severe transverse stress concentration within the top plate and the top tube flange can be observed from Figure 11(b). The concentration occurred at the central part of the contacting area. Shear stress concentration was also observed in the top plate and the tube’s top flange under the contacting area. However, no stress concentration was observed at the contacting edges.
Figure 11. Contour plots for cross-sectional stress distribution for real tire patch obtained from FEA
The observations from the above numerical analyses and the foot-prints of normal pressure distributions in Figure 4 may provide an explanation of different failure modes at the span center using steel patch and real tire patch: In case of steel patch, the patch was too stiff to deform, which made the transverse stress, vertical stress and the longitudinal-transverse shear stress (and therefore, transverse, vertical and shear strains) dominant around the patch-deck contacting edges before failure. The stress/strain concentration on the edge areas contributed to the punching failure at the span center (Sliding mode in Fracture Mechanics) using steel patch. While in case of real tire patch, the patch was very flexible to deform since the patch was made from rubber. The large deformation of the tire patch in
Normal Contacting Pressure Stress: Transverse Direction
Shear Stress Stress: Vertical Direction
(a) (b)
(c) (d)
10
the transverse direction and the friction between the tire patch and the deck surface made the transverse stress/strain dominant before failure. The transverse stress and strain concentration contributed to the opening cracking (opening mode in Fracture Mechanics) of the top plate. Therefore, the stiffness and deformability of loading patches contributed to the deck’s local failure modes.
Discussions
The experimental results from this research showed that the local behavior, especially contacting, is an important characteristic for the behavior of the think-walled multi-cellular FRP deck systems. The local failure modes of FRP decks were different for the steel loading patch specified by AASHTO specifications and the loading patch made from a rubber-stuffed truck tire. The numerical analyses for the deck–loading patch contacting by FEA indicated that the local stress/strain distribution of the top plate and the top tube flange was related to the stiffness and deformability of the loading patch used in testing. High stiffness steel patch leaded to local punching and shear cracking failure, while the rubber-stuffed tire patch made the deck surface plate and the top tube flange failed in bending mode. The ultimate strength using tire patch was higher (10 % and 28%) than the ultimate strength using steel patch. The effects of local failure modes on the design and the serviceability, durability and fatigue behavior of the FRP decks have not been investigated yet. Since the FRP decks will endure traffic loadings through real truck tires, the failure testing using real tire patch in laboratory would be more realistic to simulate the failure of FRP decks in field.
Reference
1. (MDA) Market Development Alliance (2000), “Product selection guide: FRP composite products for bridge applications”, edited by J. P. Busel and J. D. Lockwood. Market Development Alliance, Harrison, New York, USA.
2. Vistasp M. K., Wang, D., and Gao, Y. (2001), “Processing and performance of bridge deck subcomponents using two schemes of resin infusion” Composite Structures (51), pp.257-271.
3. Zhou, A., Coleman, J.T., Lesko, J.J. and Cousins, T.E. (2001), “Structural Analysis of FRP Bridge Deck Systems From Adhesively Bonded Pultrusions”, FRP Composites in Civil Engineering. (Proceedings of the International Conference on FRP Composites in Civil Engineering), December 12-15, 2001, Hong Kong, China, pp.1413-1420.
4. Stronwell Corp. (1998), “Design Manual for Extren® Fiberglass Structure Shapes and Plate”, Bristol Division, Bristol, Virginia, USA.
5. AASHTO (1996), “Standard Specifications for Highway Bridges (16th edition)”, Washington, D. C., USA
6. AASHTO (1998), “AASHTO LRFD Bridge Design Specifications (2nd edition)”, Washington, D. C., USA.
7. Temeles, A.B. (2001), “Field and Laboratory Tests of a Proposed Bridge Deck Panel Fabricated from Pultruded FRP Components”, Master’s Thesis, Virginia Polytechnic Institute & State University, Blacksburg, Virginia, USA.
8. Pottinger, M.G. and McIntyre, J.E. (1999), “Effect of Suspension Alignment and Modest Cornering on the Footprint Behavior of Performance Tires and Heavy Duty Radial Tires”, Tire Science and Technology. TSTCA, Vol. 27, No.3, July-Sept., pp. 128-160.