Facts about Helsinki - Helsingin kaupunki · Facts about Helsinki. ... Capital cities around the...
24
Facts about Helsinki
Transcript of Facts about Helsinki - Helsingin kaupunki · Facts about Helsinki. ... Capital cities around the...

Facts about Helsinki

Helsinki ...................................................................................... 2Geography and environment ........................................... 4Capital cities around the Baltic Sea ................................. 5Population ................................................................................ 6Housing ..................................................................................... 8Construction ............................................................................ 9Health care .............................................................................10Social welfare......................................................................... 11Culture and leisure ..............................................................12Education ................................................................................14Municipal service .................................................................16Economic aspects ................................................................17Trade and tourism ................................................................18Transport and communications .....................................19Universities .............................................................................20City administration ..............................................................21City economy.........................................................................22
By decree of King Gustav Vasa of Sweden in 1550, the city was founded at the mouth of river Vantaa. From there, the city was moved further south to its present location in 1643. Helsinki has been the capital city since 1812, three years after Finland became an autonomous Grand Duchy of the Russian Empire.
Helsinki continued as the capital after Finland gained its independence in 1917. Today, Helsinki is the centre of the Helsinki Region,a functional urban re-gion of about 1.4 million inhabitants and 751,000 jobs.
Contents

Helsinki
Tallinn
RigaMoscow
StockholmOslo
Copenhagen
Vilnius
BerlinWarsaw
Prague Kiev
ViennaBudapest
Bucharest
Brussels
Paris
London
Dublin
RomeMadrid
Athens
Lisbon
Reykjavik
Helsinki Metropolitan AreaHelsinki Region
St. Petersburg
Helsinki
Vantaa
Espoo
KauniainenKirkkonummi
Vihti
Nurmijärvi
Tuusula
Järvenpää
Kerava
Sipoo
Pornainen
Population 1st January 2013Helsinki 603,968Espoo 256,824Hyvinkää 45,592Järvenpää 39,646Kauniainen 8,910Kerava 34,491Kirkkonummi 37,567Mäntsälä 20,478Nurmijärvi 40,719Pornainen 5,137Sipoo 18,739Tuusula 37,936Vantaa 205,312Vihti 28,674Total 1,383,993
Hyvinkää Mäntsälä

Geography and Environment
Geography and environment Helsinki Helsinki Region Total area on 1st January 2013 716 5,518Sea 503 1,677Land 213 3,841
Population density on 1st January 2013 Inhabitants per km2 land 2,841 360l Shoreline (mainland), km 123 l Islands 315 l Number of vascular plants 1,064 l Number of nesting bird species 164 l Helsinki’s symbol plant maple l Helsinki’s symbol animal squirrel
Mean temperature 2012 l Whole year 5.9°C l Warmest month July, mean temperature 17.7°C l Coldest month January, mean temperature –6.8°C Helsinki Metropolitan Area
2012Water consumption per inhabitant, litres per 24 h (HSY1) 240
Waste management (HSY1) 2011 2012
l Waste received, 1,000 tons 633.4 590.0l Waste per inhabitant, tons per annum 0.6 0.5
1 HSY=Helsinki Region Environmental Services Authority.
4

Capital Cities around the Baltic Sea
Tallinn
Helsinki
St. Petersburg
Riga
Vilnius
Copenhagen
Oslo
Stockholm
Baltic Sea
Finland
Sweden
Norway
Russia
Belarus
Estonia
Latvia
Lithuania
PolandGermany
Denmark
Russia
Berlin Varsova
Vital statistics
Population total Proportion of Population City Region under over with a tertiary
15 yo 65 yo education1
Helsinki 603,968 1,383,993 13.6 15.8 38Stockholm 864,324 2,091,473 16.4 14.2 35Oslo 613,285 1,169,539 17.2 12.0 39Copenhagen 549,050 1,909,612 15.3 10.4 36Tallinn 402,166 529,898 15.5 16.0 35Riga 650,478 650,478 13.2 18.9 26Vilnius 534,056 806,935 15.0 15.2 35Berlin 3,460,725 3,460,725 12.0 19.1 25St. Petersburg 4,953,219 4,953,219 11.3 14.7 32
1 % of working age.
5

Population 1950 1970 1980 2012/2013
Helsinki 368,519 523,677 483,675 603,968l % of Finnish population 9.2 11.1 10.1 11.1Helsinki Region 496,517 827,400 930,368 1,383,993l % of Finnish population 12.3 17.6 19.5 25.5 Population structure Helsinki % Helsinki Finland2012/2013 Region
Total population 603,968 1,383,993 5,426,674Age groups l 0–6 42,224 7.0 8.3 7.8l 7–15 45,182 7.5 9.6 9.7l 16–64 421,182 69.7 67.6 63.7l 65–74 54,439 9.0 8.7 10.4l 75–84 28,934 4.8 4.3 6.1l 85+ 12,007 2.0 1.5 2.3Men 284,562 47.1 48.4 49.1Women 319,406 52.9 51.6 50.9Finnish-speaking 494,627 81.9 84.1 89.7Swedish-speaking 35,674 5.9 5.9 5.4Other languages 73,667 12.2 10.1 5.0Finnish nationality 553,307 91.6 93.0 96.4Other nationalities 50,661 8.4 7.0 3.6
Population
6
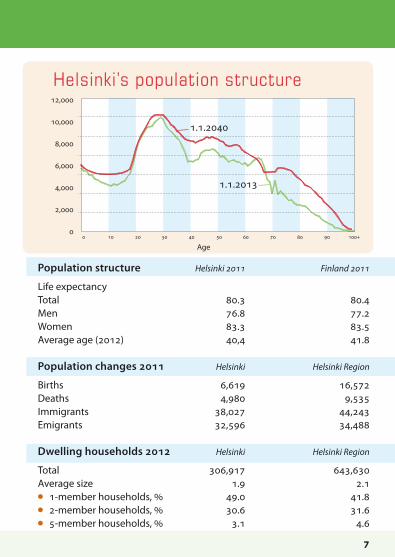
Helsinki’s population structure
Population structure Helsinki 2011 Finland 2011 Life expectancy Total 80.3 80.4Men 76.8 77.2Women 83.3 83.5Average age (2012) 40,4 41.8 Population changes 2011 Helsinki Helsinki Region
Births 6,619 16,572Deaths 4,980 9,535Immigrants 38,027 44,243Emigrants 32,596 34,488
Dwelling households 2012 Helsinki Helsinki Region
Total 306,917 643,630Average size 1.9 2.1l 1-member households, % 49.0 41.8l 2-member households, % 30.6 31.6l 5-member households, % 3.1 4.6
Age
12,000
10,000
8,000
6,000
4,000
2,000
0
1.1.2013
1.1.2040
7

0
5.0
10.0
15.0
20.0
25.0
30.0
35.0
40.0
1960 1970 1980 1990 2000 2005 20102009 2011
Housing
Housing stock 2011 Helsinki Helsinki Region Finland
Dwellings total 331,485 688,574 2,835,639l Detached houses, % 13.2 31.9 54.1l Dwellings owned by occupier, % 44.4 52.8 59.0l Rented dwellings, % 44.7 36.6 29.1 Number of rooms, %
l 1 room 23.1 16.5 14.5l 2 rooms 36.4 32.3 29.9l 3 rooms 21.8 23.2 22.2l 4 rooms 12.0 16.2 18.2l 5 or more rooms 6.2 11.2 14.1
Housing standards 2011
Housing density, m2/person 34.2 35.9 39.4
Housing costs 2012
Average rent for two-room flat, €/month 835 – 670Average price of used dwellings, €/m2 3,885 – 2,245
Housing density in Helsinki
m2 /p
erso
n
8
ConstructionNew construction and extensions 2011 2012
Buildings completedFloor area completed, 1,000 m2 538 518l Residential, 1,000 m2 294 365l Other than residential, 1,000 m2 243 153
Building startsTotal floor area, 1,000 m2 536 493l Number of dwellings 4,438 4,108
Construction permits grantedTotal floor area, 1,000 m2 501 477l Number of dwellings 4,624 3,286
Dwellings completedTotal 3,656 4,643l State subsidised 820 1,453l Rental dwellings 1,562 2,520l Municipal dwelling 395 784
Construction of dwellings and business premises 31st Dec. 2010 31st Dec. 2011
Building stock, number of buildings 40,358 40,684Floor area, million m2 45 46l Residential, million m2 27 27l Other than residential, million m2 18 19
9

Health Care
Health care 2012 per 1,000 inhabitants
l Sub-district health centres of the city 26 l Hospitals of the city1 6 Primary health care
Health centre physicians 326 0.5Visits 4,217,716 6,983of which l to community care physicians 445,214 737l to public health nurses 412,714 683l at health centre 24 h duty 124,055 205l within home care 2,365,367 3,916l within dental care 382,366 633Medical care in the city´s hospitals l Hospital beds 1,125 2l Nursing days 399,122 661
Specialised medical care
Visits at 244,969 406l Units for community psychiatric care 153,609 254l Outpatient departments for other specialities 91,360 151Hospital care at city’s hospitals l Hospital beds (psychiatric) 290 0.5l Nursing days 94,249 156
1Hospitals: Herttoniemi, Laakso, Malmi, Suursuo, Haartman, Aurora.
10

Social Welfare
Children in municipal day care1 2011 2012
l 1–6 year olds on 31st December 22,400 22,698l Per hundred 1–6 year olds 64.8 63.8
Number of municipal playgrounds on 31st Dec 68 65
Child home care allowance
l Families receiving the benefit on 31st Dec 6,950 7,277
Child welfare clients 10,564 10,773
l Per hundred 0 –17 year olds 10.8 10.9
Social assistance
Households having received social assistance 41,575 42,480l among which single households, % 78.1 84.9Percentage of recipitiens in the population 10.1 10.2
Persons having received service by virtue of the law on care for the handicapped 12,017 12,455
Persons having received transport benefits2 11,197 11,577
Places at elderly care institutions on 31st Dec 2,142 2,017
l Per hundred 75 year olds and older 5.3 4.9
Places in service housing for the elderly 2,679 2,737l Per hundred 75 year olds and older 6.7 6.7
1 Includes municipal daycare centres, family centres and daycare centres with contract of purchase. 2 Includes transport benefit according to the law on care for the handicapped.
11

Culture and Leisure
National Opera 2010 2011
l Perfomances 301 292l Visits 228,518 208,930
Professional theatres 11 11
l Perfomances 3,107 3,009l Visits 729,203 727,065
Dance theatres 3 3
l Perfomances 290 318l Visits 57,441 63,329
Number of concerts 2011 2012
l Helsinki Philharmonic Orchestra 90 137l Radio Symphony Orchestra 57 81
Number of cinema auditoria 35 35
l Visits per inhabitant 3.4 3.3
City Library, lending outlets 49 49l Number of books on 31st December (1,000) 1,590 1,565l Other material (1,000) 311 315l Loans (1,000) 9,514 9,272l Visits (1 000) 6,782 6,783l Visits per inhabitant 11.4 11.2
Youth work premises, m2 40,671 41,963
l m2 per 7–18 year old 0.7 0.7
Linnanmäki amusement park, number of visitors 1,000,000 1,000,000
Korkeasaari Zoo, number of visitors 489,621 488,369
12

2011 2012
Museums 67 64
Number of visitors at
Helsinki City Museum 163,835 156,644 Helsinki Art Museum 114,353 104,658 The Finnish National Gallery l Ateneum Art Museum 178,683 400,079 l The Museum of Contemporary Art Kiasma 182,154 182,170 l Sinebrychoff Art Museum 25,762 25,308 National Museum of Finland 116,376 118,752 Finnish Museum of Art and Desing 85,669 98,706 Seurasaari Open Air Museum 46,828 49,291 Museum of Finnish Architecture 11,778 25,300
Recreational trails and jogging tracks, km 216 216
Indoor sports facilities and fitness gyms 32 32
Swimming halls 13 13
Ice stadiums 12 12
Natural skating rinks 66 66
Beaches 28 28
Boat moorings 12,022 11,955
31st Dec 2010 31st Dec 2011
Restaurants 1,075 1,092
l Guest capacity (seats) 358,479 366,995
13

Education
Education in Helsinki for 7-18 year olds 2011 2012 Comprehensive schools (7-16 year olds) 151 150Pupils, total 46,278 46,532In city’s schools 36,584 36,785l of which in Swedish-language schools 3,264 3,203In private schools 7,326 7,280In state schools 2,368 2,467Upper secondary schools (16-18 year olds) 37 38Pupils, total 13,839 13,893In city schools 8,461 8,391l of which in in Swedish-language schools 1,205 1,220In private schools 4,625 4,697In state schools 753 805Adult secondary 3 3Pupils, total 6,406 5,978
Number of students 20.9.2011 Helsinki Helsinki Region Finland
Basic education for 7–16 year olds 46,064 132,434 541,931Secondary education for 16–18 year olds 16,947 33,607 109,046Vocational training 34,874 65,142 279,266Polytechnics 21,605 35,533 139,857Universities 46,152 59,546 168,983
Educational structure on 31st December 2011
% of 15 years olds and older withBasic education or education unknown 29 30 32Secondary education total 33 34 40l Baccalaureat-level 13 11 7l Vocational secondary 20 23 32Tertiary education total 38 37 28l Lowest tertiary 9 10 10l Lower tertiary 12 11 9l Higher tertiary 15 13 8l Researcher education 2 2 1
14

Educational structure
10 20 30 40 50 60 70 80 90 1000%
Helsinki
Basic education only or education unknown
Helsinki Region
Finland
Secondary education
Tertiary education
15 year olds and older by education on 31st December 2011
15
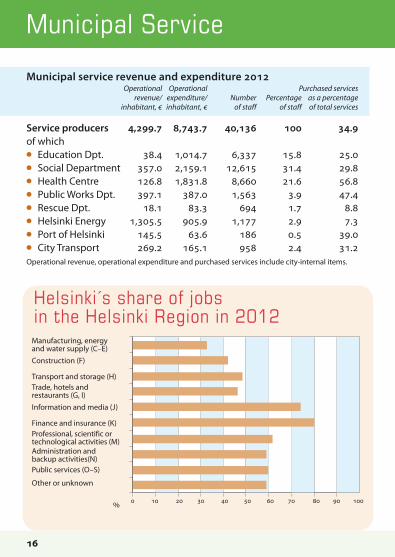
Service producers 4,299.7 8,743.7 40,136 100 34.9of whichl Education Dpt. 38.4 1,014.7 6,337 15.8 25.0l Social Department 357.0 2,159.1 12,615 31.4 29.8l Health Centre 126.8 1,831.8 8,660 21.6 56.8l Public Works Dpt. 397.1 387.0 1,563 3.9 47.4l Rescue Dpt. 18.1 83.3 694 1.7 8.8l Helsinki Energy 1,305.5 905.9 1,177 2.9 7.3l Port of Helsinki 145.5 63.6 186 0.5 39.0l City Transport 269.2 165.1 958 2.4 31.2Operational revenue, operational expenditure and purchased services include city-internal items.
Municipal Service
Operational Operational Purchased services revenue/ expenditure/ Number Percentage as a percentage inhabitant, € inhabitant, € of staff of staff of total services
Municipal service revenue and expenditure 2012
Helsinki´s share of jobs in the Helsinki Region in 2012
Manufacturing, energy and water supply (C–E)
Construction (F)
Transport and storage (H)Trade, hotels and restaurants (G, I)
Information and media (J)
Finance and insurance (K)Professional, scientific or technological activities (M)Administration and backup activities(N)Public services (O–S)
Other or unknown
% 0 10 20 30 40 50 60 70 80 90 100
16

Economic Aspects Helsinki Helsinki Region Finland
GNP per capita 2010 (PPS, EU27=100) 159.1 114.0
Jobs in 2012
All industries total 412,661 751,357 2,483,028l Primary production (A–B) 0.1 0.4 4.4l Processing (C–F) 10.3 15.6 22.4l Services total (G–S) 88.6 83.2 72.4l Market services (G–N) 54.6 52.1 39.0l Public services (O–S) 34.0 31.1 33.4l Other or unknown (T–X) 1.0 0.8 0.8 Information and media sectors’ share of jobs in 2012, %
10.2 7.6 4.1 Workplace self-sufficiency 2012, %
132.4 105.8 100
Enterprises total 2011
l Number 39,962 80,033 322,368l Turnover, 1,000 euro 73,283,983 167,565,352 382,850,306l Staff, total 254,093 485,982 1,489,117 Labour force, 2012, 15–74 year olds
l Employed 311,684 710,057 2,483,240l Unemployed 23,603 48,059 206,841l Unemployment rate, % 7.0 6.3 7.7 Economic activity rate, 2012
Among 15–64 year olds 73.4 73.7 69.0l Number of employed 305,266 697,077 2,431,034
17

Trade and Tourism
Goods traffic through the Port of Helsinki (1,000 tons) 2011 2012
International goods traffic 11,074 10,688l Imports 6,171 5,869l Exports 4,903 4,819Coastal trade 152 143Total goods traffic 11,226 10,831
Retail trade 2010 2011
l Sales outlets 3,244 3,232l Employees 16,659 17,159l Turnover, million euros 4,280 4,497
Wholesale trade
l Sales outlets 3,228 3,235l Employees 17,982 18,102l Turnover, million euros 26,323 30,119
2011 2012
Passangers (million) 72 74
l Via Helsinki–Vantaa Airport 15 15l Via Port of Helsinki 11 11l Via Helsinki main railway station 46 48 International congresses and events 111 254
Hotels 52 53
l Overnight stays, total (million) 3,2 3,2
18

Transport and Communications
Transport and communications Helsinki Finland
Registered cars on 31st December 2012 244,178 3,057,484l per 1,000 inhabitants 404 563Registered motorcycles on 31st December 2012 16,250 244,968l per 1,000 inhabitants 27 45
Number of mobile phones per 100 inhabitants, 2012 172
Internet users (15–74 year olds), 2012l Percentage of the population, % 90 Helsinki 2011 Helsinki 2012
Public transport within the city
Journeys total (million) 205.2 209.7l Buses 88.4 88.6l Trams 53.7 57.2l Metro 61.4 62.2l Ferries 1.7 1.6
Local traffic of the State Railways, million journeys 41.9
Traffic at the Port of Helsinki, vessel calls 8,776 8,733 Traffic at Helsinki–Vantaa Airport
l Domestic freight, tons 795 1,747l International freight, tons 136,351 180,420
19

Universities
Universities
Polytechnics
Etelä-Suomi Province
HelsinkiFinland
Helsinki
Espoo
Vantaa
Kauniainen
20

City Council 2013–2016 Number of members 85l National Coalition Party (Conservatives) 23l Green League of Finland 19l Social Democratic Party of Finland 15l Left-wing Alliance 9l The Finns 8l Swedish People´s Party in Finland 5l Centre Party of Finland 3l Christian Democrats in Finland 2l The Communist Party of Finland 1
City Personnel 31st Dec 2011 31st Dec 2012
Total 39,438 40,136l Permanent 32,801 33,399l Temporary 6,637 6,737% by Department l Mayor’s sector 5.8 5.7l Social affairs and public health 52.3 53.0l City planning and real estate 2.4 2.3l Environmental authority 17.1 17.1l Cultural and personnel affairs 22.4 21.9
City Administration
21

City Economy
Expenditure 2011 million € 2012 million € €/inhabitant
Social affairs and public health 2,103.2 2,198.4 3,635City planning and real estate 307.9 354.7 586Environmental authority 865.1 874.8 1,446Cultural and personnel affairs 709,1 741,0 1,225Energy, port and general administration 723.1 791.7 1,309Expenditure for loans, credits etc. 27.1 25.4 42Other expenditure 0.0 1.8 3Manufacturing for own use –159.2 –138.7 –229Total 4,576.3 4,849.1 8,017
Revenue 2011 million € 2012 million € €/inhabitant
Tax revenue 2,740.0 2,759.0 2,877Operational revenue 1,693.1 1,740.2 4,562Loans, credits etc. 95.9 93.4 154Other income 302.3 401.5 664Total 4,831.2 4,994.1 8,257 The City’s €/inhabitant
Interest-bearing loans per inhabitant 1,986 The Business Group’s €/inhabitant
Loans per inhabitant 6,905
Tax rate (2012) 18.5
Figures according to the city’s external profit and loss account.Manufacturing for own use is deducted from expenses as an item of its own.
22
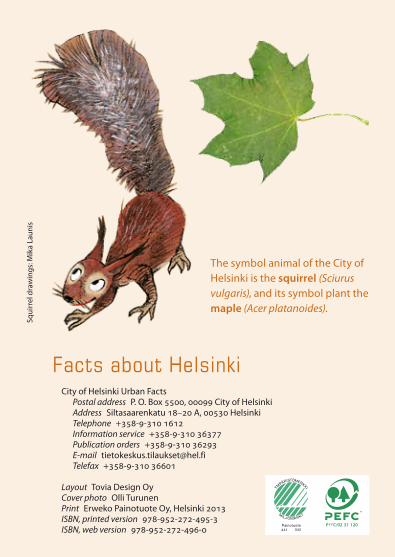
City of Helsinki Urban Facts Postal address P. O. Box 5500, 00099 City of Helsinki Address Siltasaarenkatu 18–20 A, 00530 Helsinki Telephone +358-9-310 1612 Information service +358-9-310 36377 Publication orders +358-9-310 36293 E-mail [email protected] Telefax +358-9-310 36601
Layout Tovia Design OyCover photo Olli TurunenPrint Erweko Painotuote Oy, Helsinki 2013ISBN, printed version 978-952-272-495-3ISBN, web version 978-952-272-496-0
Facts about Helsinki
Squi
rrel
dra
win
gs: M
ika
Laun
is
The symbol animal of the City of Helsinki is the squirrel (Sciurus vulgaris), and its symbol plant the maple (Acer platanoides).

english
www.hel.fi/tietokeskus
This annually published pamphlet contains
basic statistics about Helsinki and its
inhabitants. Some of tables and diagrams
contain data on the Helsinki Region and the
rest of Finland, too.
Price1 €