CITY OF HELSINKI - Helsingin kaupunki · vironmental reports are coordinated by a work-ing group...
12
CITY OF HELSINKI ENVIRONMENTAL REPORT 2008 I SUMMARY www.hel.fi/ymparistoraportti
Transcript of CITY OF HELSINKI - Helsingin kaupunki · vironmental reports are coordinated by a work-ing group...

CITY OF HELSINKIENVIRONMENTAL REPORT 2008 I SUMMARY
www.hel.fi/ymparistoraportti

Introduction . . . . . . . . . . . . . . . . . . . . . . . . . . . . . . . . . . . . . . . . . . 2
Summary from the Deputy Mayor . . . . . . . . . . . . . . . . . . . . . . . . 3
Environmental management in the City of Helsinki . . . . . . . . . 4
Climate change, energy policies and use of land . . . . . . . . . . . . 5
Water protection and waste treatment . . . . . . . . . . . . . . . . . . . . 7
Traffic and the impact of traffic . . . . . . . . . . . . . . . . . . . . . . . . . . 8
Procurement, environmental education, environmental risks 10
Environmental economy . . . . . . . . . . . . . . . . . . . . . . . . . . . . . . . 11
City of Helsinki Environmental Report 2008
The City of Helsinki environmental report is a shared report from various departments within the city organisation, describing how the environmental goals have been realised
in practice and their effects on the environment. The report is assembled by the Environment Cen-tre based on the information provided by all city departments and business units. For the first time, a short survey on the management of environmen-tal issues within various affiliate organisations was carried out for the 2008 report.
The environmental report and the materi-al produced by the administrative domains are
available on the internet (see the cover page). En-vironmental reports are coordinated by a work-ing group appointed by the mayor. The working group includes representatives from all environ-mentally relevant departments or units. The City of Helsinki both produces a significant environ-mental load, and is also an important actor in environmental protection. The City of Helsinki produces 5% of the total carbon dioxide emissions in Finland. The Viikinmäki sewage treatment plant is responsible for processing the sewage for approximately 750,000 residents.
Introduction
ASTA
EKM
AN
2 C I T Y O F H E L S I N K I

Year 2008 was the warmest year so far during the entire measurement history at Kaisanie-mi measurement station. The past year was characterised by an almost unprecedented
low amount of snow: statistically, the amount of days with snow was only half of the previous record year, 2007. Considering this, it is no wonder that the climate focus became increasingly important.
During January 2008, the city council accepted the energy policy report in which the City of Hel-sinki committed to reduce the emissions of green-house gases by 20% by the year 2020. The City of Helsinki did not stop at this, but has actively pur-sued putting the climate policy in practice. Signifi-cant actions include preparing the Helsinki Energy wind power farm together with the energy com-pany Etelä-Pohjanmaan Voima, launching several low energy construction projects and preparing the city plan for the environmentally friendly Honkas-uo city district.
On top of promoting these best practices, the city is looking into the possibility of re-organis-ing the entire energy production toward a solution with fewer emissions as well as means of improving the energy efficiency of the entire city housing base.
Helsinki also realises the climate policy through traffic planning. For example, developing cross traf-fic public transport has already provided favoura-ble results. The city budget binding requirement of increasing cross public traffic to exceed 13% has been clearly met and even exceeded to 15%, mainly due to the success of the JOKERI route. Overall, the use of public transport increased by 2% during 2008, while the amount of private cars within the city road network was decreased by approximately 2%. In conclusion, the development of traffic dur-ing 2008 can be stated to comply with the princi-ples of sustainable development.
The economic downturn that started to gain speed toward the end of the year had an effect on the reduction of traffic and the reduction of mixed waste. Also the average domestic water consump-tion decreased by three litres per resident. On the other hand, the consumption of electricity per capi-ta increased by almost 2% in comparison to the pre-vious year.
During 2008, sewage treatment faced challeng-es due to the maintenance work on the Päijänne tunnel and the high amount of sewage. Overall, processing results in the Viikinmäki treatment plant were fairly good, even though the goals set for nitrogen processing were not fully met. A ma-jor improvement in sewage treatment during 2008 was the introduction of the steam processing tech-nique. After this improvement, the soil produced during sludge composting meets the Finnish Food Safety Authority hygiene requirements.
The city strategy that was passed this spring increases the weight of the environmental focus within the city management and calls for a pio-neering role in environmental protection and cli-mate policy. In addition to the climate, the stra-tegic focus is in the preservation of the Baltic Sea and in an environmental view in procurement. Ful-filling these goals requires both new innovations and improved efficiency in the execution of exist-ing techniques. Sustainable procurement policy re-quires commitment and cooperation from all de-partments. To facilitate this, the deputy mayor has recently accepted the chair in the ICLEI Procura+ campaign that also aims to create sustainable best practices for procurement for the City of Helsinki.
The environmental work of the departments has recently picked up. This can be seen in, for example, the various environmental programmes within the city departments, the amount of 450 trained eco-supporters and the clear trend of decreasing paper consumption in city departments. Naturally, this continues to be a challenge for the city.
However, the city cannot tackle environmental challenges solely from within city management. New types of cooperation between the enterprise sector and other interest groups are needed, as rec-ommended by the environmental management peer evaluation last winter. For example, the Hel-sinki environmental award competition, organised for two consecutive years, has demonstrated that there are plenty of enterprises and organisations in Helsinki that have the prerequisites of successful environmental cooperation with the city.
The City of Helsinki has already started several initiatives for environmental cooperation with var-ious interest groups. The key initiatives are the Bal-tic Sea Challenge launched by the mayors of Hel-sinki and Turku and the EU-funded Ekokompassi (ecological compass) initiative that is targeted to-ward small- and medium-sized businesses.
Initially, the Baltic Sea Challenge has focused on municipalities, organisations, research insti-tutes and various other public bodies. However, the challenge is being extended to reach the enterprise sector through addressing the large shipping com-panies and other large enterprises. The pilot do-mains of the Ekokompassi initiative have been the printing and tourism industries and the Wholesale Food Market area, but the goal is to extend the de-velopment of environmental management to other domains as well. While extending both the Baltic Sea Challenge and the Ekokompassi initiative are the cornerstones of the new environmental coop-eration for the City of Helsinki, there is still room for new innovations as well.
Pekka Sauri
PERT
TI N
ISO
NEN
Summary from the Deputy Mayor
3E N V I R O N M E N T A L R E P O R T 2 0 0 8
The City of Helsinki has set the goal of includ-ing environmental management as an inte-gral part of the entire city government. This goal has been realised by several individual
methods (see Figure below). During 2008, the city began the preparation
work for the new strategy process in which envi-ronmental issues will be included in a more com-prehensive manner. During the preparation of the process, the city council decided to update the en-vironmental policy.
2008 was the last year of the Helsinki ecological sustainability programme (HEKO). By the end of the year, 46 of the actions in the programme were realised either fully or partially, and only three were not started. Seven of the actions were consid-ered to be continuous in nature.
As a result of the HEKO programme, environ-mental management as a whole has gained new properties. According to the HEKO objectives, four thematic programmes have been set up: nature protection, preserving the diversity of urban nature, sustainable construction and small water preserva-tion. In addition, during the HEKO programme, Helsinki developed an air protection programme, a plan for noise reduction and a climate strategy for the metropolitan area. Also, in accordance with the HEKO objectives, an eco-support activity and an eco-support network were established.
The 2008 budget included eight binding envi-ronmental objectives of which all but one were re-alised. The objectives involved the share of pub-lic transportation both toward the city centre and cross traffic between city districts, concentration levels of street dust, life cycle estimates for con-struction projects, information sharing on the sta-tus of the sea and the nitrogen and phosphorus nu-trient load of processed sewage. The objective on the nitrogen load (below 600 tons) was not fully met.
Environmental management in the city admin-istrative domains is on a variable level. There are ISO 14001-standardised environmental manage-ment systems in operation in the Port of Helsin-ki and in the Helsinki Energy power plants, heat-ing plants and district heating systems. In addition, there are non-certified environmental manage-ment systems in five departments and there are ac-tive sustainable development or environment pro-grammes in seven departments. Two departments are currently developing their own environmental programmes.
Within the affiliate organisations of the city, systematic environmental management was execut-ed by only a small number of enterprises. Howev-er, a larger number of organisations actively collect-ed environmental information. On the other hand, significant resources have not been allocated so far for developing environmental management in the affiliate organisations, as the focus has been on the development of city departments.
During 2008, a peer evaluation of the impact of environmental management was carried out to-gether with the city of Rotterdam. In the evalua-tion, Helsinki was considered to have a number of key strengths: functional public transportation, high quality of drinking water and sewage treat-ment, having a good air protection programme and environmental education in public schools. The evaluation recommended further development in the areas of executing the air protection and noise reduction programmes, improving the energy effi-ciency requirements of residential areas, techniques for restoring polluted soil, removing the incoher-ence of water area management and building a cul-ture of cooperation in environmental management.
Environmental management in the City of Helsinki
City Council City Board The Departments
Environmentalsystems
HEKO implement-ation plans or programmes
Environmental objectives
in the budget
Environmental Reports and
Annual Reports
HEKO-programme
Sector programmes
Budget Guidelines
Environmental Policy
Environmental Report of the City and Sustainable
Development Indicators
SustainableDevelopmentProgramme
Eco-support activity
City of Helsinki Environmental Management (until 2008)
4 C I T Y O F H E L S I N K I

According to the Kaisaniemi measurement station in Helsinki, 2008 was the warmest year on record. The average temperature in 2008 was 7.6 degrees Celsius, 0.4 degrees
higher than the previous record from 1934. Ac-cording to the Intergovernmental Panel on Cli-mate Change (IPCC), avoiding the critical 2 de-gree rise in average temperature requires that in-dustrial countries reduce their emissions by at least 25 - 40% by 2020 and 80 - 95% by 2050.
The decisions made in the energy policy report accepted by the city council in January 2008 and in the climate strategy for the metropolitan area have already started to be implemented. Helsinki Energy, together with the energy company Etelä-Pohjanmaan Voima, started to prepare building two major wind power farms (500 – 1,000 MW)
in the Gulf of Finland and the Bay of Bothnia ar-eas.
A key objective of the energy efficiency agree-ment between the City of Helsinki and the Minis-try of Employment and the Economy is to save 9% in total energy consumption between 2008 and 2016. One of the key actions was to create an ac-tion plan that describes the methods of improving the energy efficiency of the City of Helsinki. Dur-ing 2008, both heat and electricity consumption increased in the city properties. Consumption of electricity increased by as much as 3%.
Helsinki also launched several pilot projects in low energy and passive energy construction. The pilot projects include both new productions and renovations. New productions include the build-ing for the Environment Centre in Viikki, the
Climate change, energy policies and use of land
0
1
2
3
4
5
6
7
8
20082007*200620031990
Waste management
Traffic
Other fuels
Electricity
Other heating
Electric heating
District heating
tons of CO2 equivalents
Target 2030
Consumption-based Greenhouse Gas Emissions
0
20
40
60
80
100
2008200720062005200420032002
%
Nuclear power
Oil
Natural gas
Coal
RenewablesTarget 2020
Share of energy sources in Helsinki Energy’s procurement
5E N V I R O N M E N T A L R E P O R T 2 0 0 8
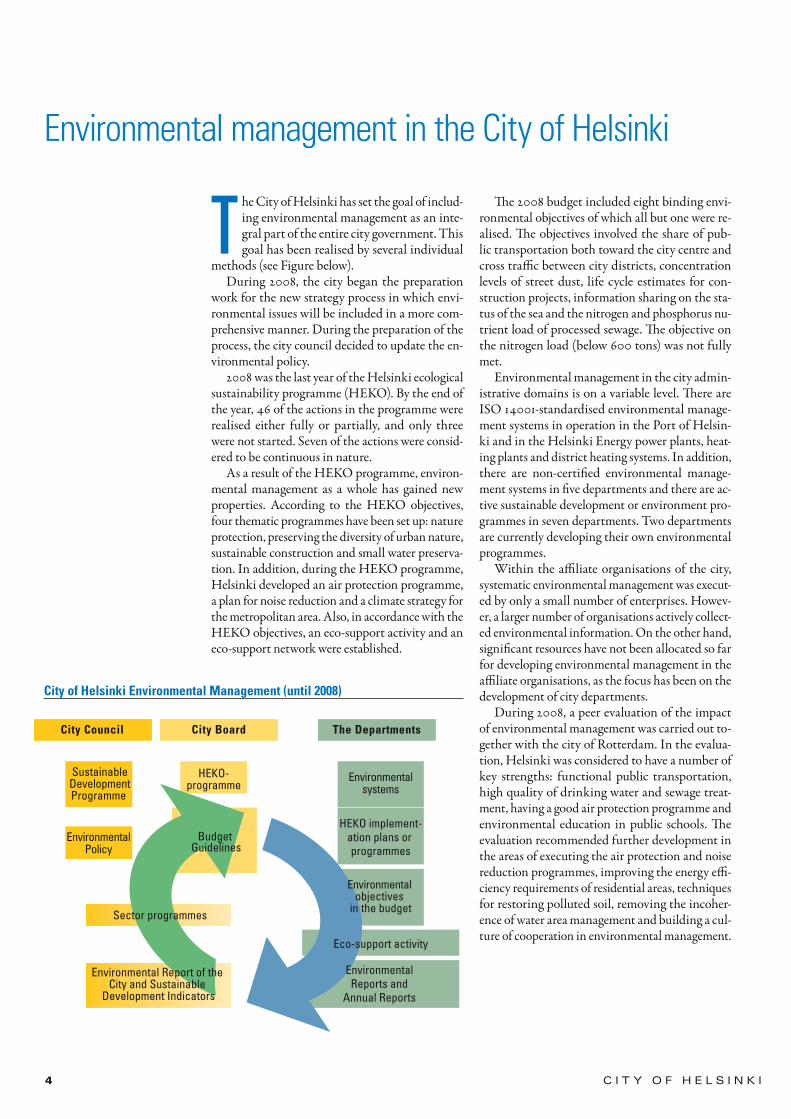
Myllypuro health centre, the Oulunkylä family support centre and the Koskela food supply cen-tre. Renovations include the Käpylä district pri-mary school. In addition, the proposal for the Honkasuo district town plan was the first to re-quire development of an environmentally friendly city district by using low energy construction and renewable energy sources.
The Helsinki Public Works Department has de-cided to focus on low energy construction and has defined separate objectives for new productions and renovations. The City Planning Department has launched the Suburban Renaissance project that aims to control climate change and reduce urban traffic through supplementary construction.
The total greenhouse gas emissions were signif-icantly reduced last year. The emissions were 14% lower than in the reference year 1990 for the ener-gy policy (objective -20%). The exceptionally low total emissions were due to lowered emissions in energy production, affordable hydroelectric pow-er, exceptionally warm temperatures during the year and the beginning of the economic down-turn. Due to these reasons, the high-emission con-densate production of electricity was lowered in the power plants in Helsinki and in Finland. De-spite the lower emissions, the electricity consump-tion per capita in Helsinki increased by 1.7% in comparison to the previous year.
The share of renewable energy for the Helsinki Energy procurement for electricity, district heat-ing and district cooling was increased to 6.2% in 2008 from 4.5% in 2007. The increase was due to the significant growth of the production of dis-trict heating and cooling in the Katri Vala heat pump plant and affordable hydroelectric power.
The proposal for the ecological construction
programme in Helsinki was finalised and circu-lated for comments in 2008. The comments were appended and the programme was approved by the city council in June 2009.
The City of Helsinki has committed to system-atically carrying out energy efficiency reviews for city-owned buildings and thus investigating eco-nomically viable methods for saving energy. By the end of 2008, energy efficiency reviews had been carried out for 80% of the public service proper-ties owned by the City of Helsinki.
In connection to the reviews, applicable public service properties are provided with an energy cer-tificate (Display certificate for energy and emis-sions). During 2008, 700 new certificates were given, bringing the total number of certificates to 800 at the end of 2008.
A total of 150,000 tons of polluted soil or land was processed or moved to disposal areas during 2008. The largest processing sites were in the Or-muspellontie industrial area where the area was being transformed into residential use. Equally large sites were in the former Viikinmäki district shooting range and in the engineering district in Pasila, both of which are being transformed into residential areas. Re-use of polluted soil in various construction sites has clearly increased.
During 2008, the programmes for securing the biodiversity (LUMO programme) and a na-ture conservation programme were prepared. The nature conservation programme was accepted by the Environmental Committee for the years 2008 to 2017. The programme proposes conserving 29 new areas (total 267 hectares). Environmentally significant forests are the largest part of the pro-gramme. The LUMO programme is discussed by the city council during 2009.
0
10
20
30
40
50
60
70
80
20082007200620052004200320022001200019991998199719961995199419931992199119901989
KWh/m2
Consumption of electricity in city-owned buildings (kWh/m2)
6 C I T Y O F H E L S I N K I

The load on the water system caused by the Vi-ikinmäki district sewage processing plant re-mained low and within required levels even though the amount of sewage was at peak
levels. The average processing efficiency was near-ly on the same level as in previous years but the nu-tritional releases to the sea increased. The levels were 25,000 kg/year for phosphorus and 610,000 kg/year for nitrogen.
The sludge from sewage treatment is further processed by composting the sludge to soil used in landscaping. During 2008, a new technique of steam processing was introduced. After this im-provement, the soil produced during sludge com-posting meets the Finnish Food Safety Authority hygiene requirements.
The Baltic Sea Challenge, launched by the may-ors of Helsinki and Turku in 2007, has continued to expand. The actions defined for the City of Hel-sinki are in progress. By the end of 2008, 120 out of 600 organisations that were involved have accepted the challenge. In addition, 15 international organi-sations have joined the challenge.
The Ämmässuo waste processing plant received a total of 850,000 tons of waste and soil. Mixed waste amounted to 267,000 tons, over 16,000 tons less than the year before. Mixed waste was reduced mainly because some of the waste was processed outside the metropolitan area.
The use of recycling stations for domestic waste continued to increase. There was a 15% increase in the number of domestic users. According to a sur-vey by the Metropolitan Area Council (YTV), do-mestic recycling has become more popular overall. Over 90% of the residents state that they recycle paper, nearly 80% recycle cardboard and approxi-mately 70% recycle glass waste on a regular basis. Domestic recycling has been a steadily increasing trend during the entire 2000’s.
The YTV incineration plant project took a step forward in December when the YTV administra-tive board chose Vantaa Energy Ltd as the suppli-er of the plant. The plant will be built in the Lång-mossebergen area in Vantaa.
Water protection and waste treatment
EEVA
PO
UKK
A
7E N V I R O N M E N T A L R E P O R T 2 0 0 8
0
50
100
150
200
250
20082007*2006
Train inside city borders
Regional buslines inside city borders
TramMetro
Bus
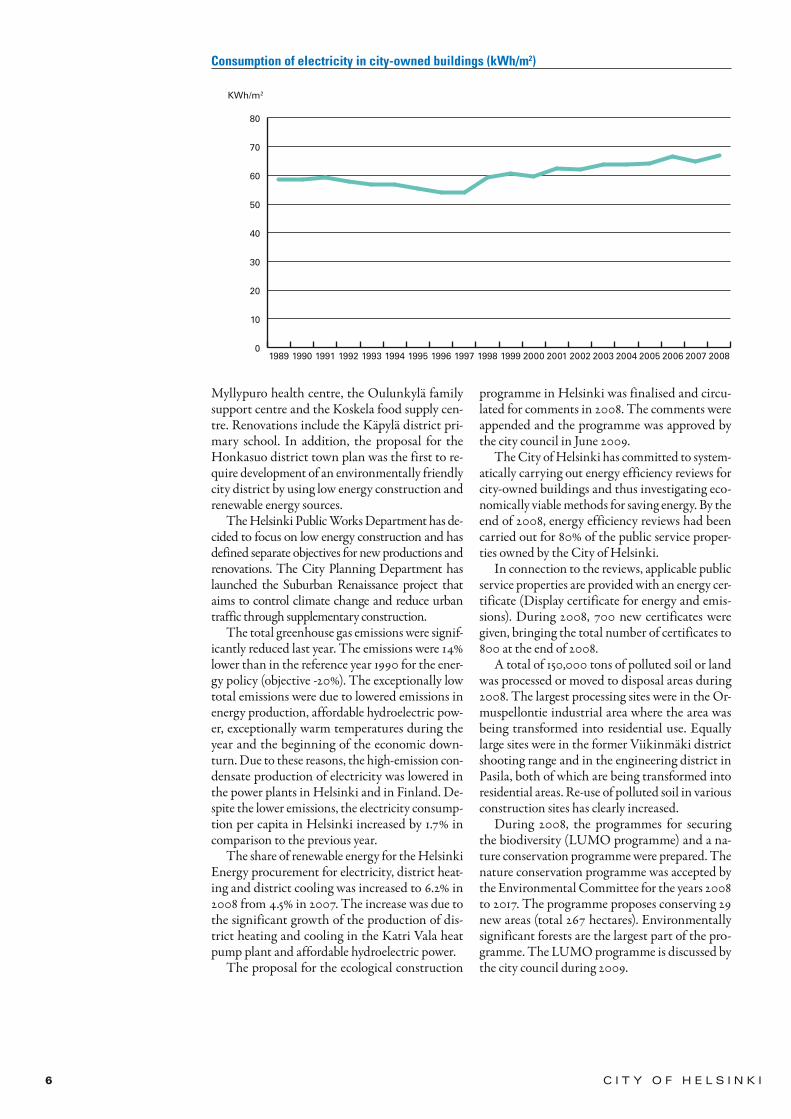
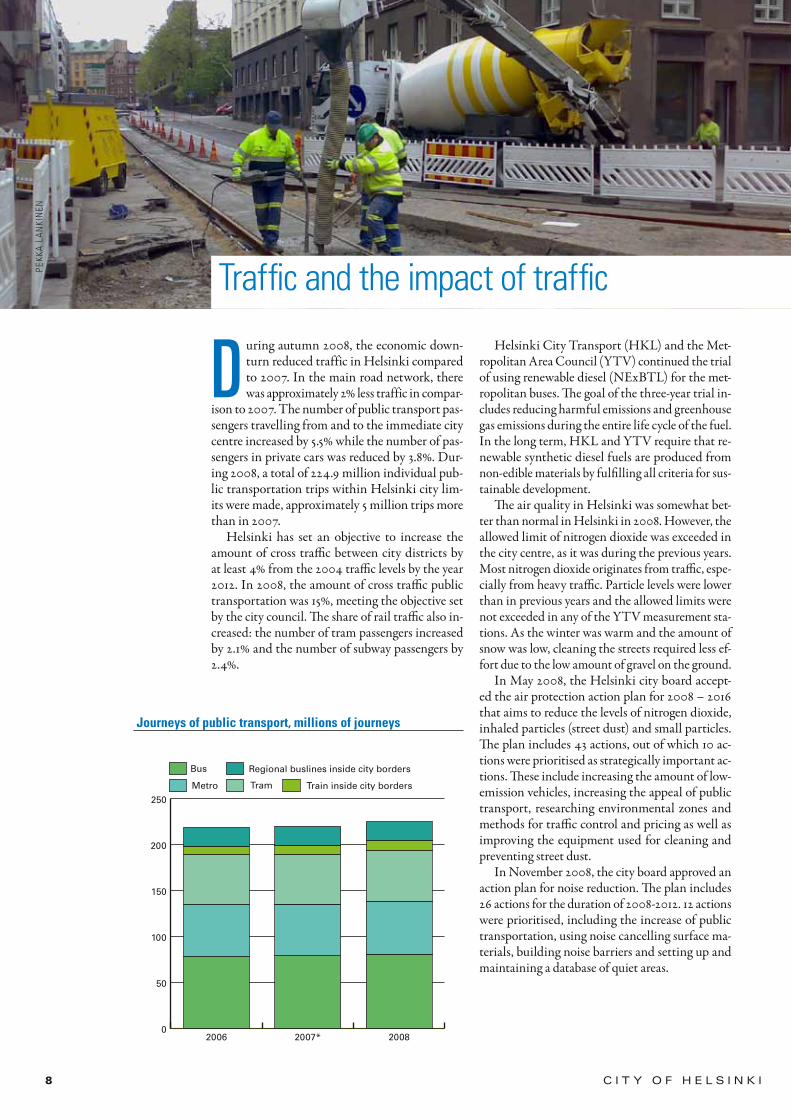
During autumn 2008, the economic down-turn reduced traffic in Helsinki compared to 2007. In the main road network, there was approximately 2% less traffic in compar-
ison to 2007. The number of public transport pas-sengers travelling from and to the immediate city centre increased by 5.5% while the number of pas-sengers in private cars was reduced by 3.8%. Dur-ing 2008, a total of 224.9 million individual pub-lic transportation trips within Helsinki city lim-its were made, approximately 5 million trips more than in 2007.
Helsinki has set an objective to increase the amount of cross traffic between city districts by at least 4% from the 2004 traffic levels by the year 2012. In 2008, the amount of cross traffic public transportation was 15%, meeting the objective set by the city council. The share of rail traffic also in-creased: the number of tram passengers increased by 2.1% and the number of subway passengers by 2.4%.
Helsinki City Transport (HKL) and the Met-ropolitan Area Council (YTV) continued the trial of using renewable diesel (NExBTL) for the met-ropolitan buses. The goal of the three-year trial in-cludes reducing harmful emissions and greenhouse gas emissions during the entire life cycle of the fuel. In the long term, HKL and YTV require that re-newable synthetic diesel fuels are produced from non-edible materials by fulfilling all criteria for sus-tainable development.
The air quality in Helsinki was somewhat bet-ter than normal in Helsinki in 2008. However, the allowed limit of nitrogen dioxide was exceeded in the city centre, as it was during the previous years. Most nitrogen dioxide originates from traffic, espe-cially from heavy traffic. Particle levels were lower than in previous years and the allowed limits were not exceeded in any of the YTV measurement sta-tions. As the winter was warm and the amount of snow was low, cleaning the streets required less ef-fort due to the low amount of gravel on the ground.
In May 2008, the Helsinki city board accept-ed the air protection action plan for 2008 – 2016 that aims to reduce the levels of nitrogen dioxide, inhaled particles (street dust) and small particles. The plan includes 43 actions, out of which 10 ac-tions were prioritised as strategically important ac-tions. These include increasing the amount of low-emission vehicles, increasing the appeal of public transport, researching environmental zones and methods for traffic control and pricing as well as improving the equipment used for cleaning and preventing street dust.
In November 2008, the city board approved an action plan for noise reduction. The plan includes 26 actions for the duration of 2008-2012. 12 actions were prioritised, including the increase of public transportation, using noise cancelling surface ma-terials, building noise barriers and setting up and maintaining a database of quiet areas.
Traffic and the impact of traffic
Journeys of public transport, millions of journeys
PEKK
A L
AN
KIN
EN
8 C I T Y O F H E L S I N K I

During 2008, noise barriers were built on a number of streets: Itäväylä near the Vartiokylä district, Lahdenväylä near the Koskelantie junc-tion and the Alppikylä district, Hakamäentie and Hämeenlinnanväylä near the Etelä-Haaga and
Kivihaka districts. Street work began on Itäväylä near the Herttoniemi district to clear the street for noise barriers. Noise cancelling surface materials were used on two streets in the Tapanila and Mal-mi districts.
20
25
30
35
40
45
50
200820072006200520042003200220012000199919981997199619951994199320
25
30
35
40
45
50NO2 targetNO2 MannerheimintieNO2 Töölö
© Helsingin kaupunki, Kaupunkimittausosasto 061/2008
42
kilometriä
0
VARTIOKYLÄ
ALPPIHARJUVALLILA
TAKA-TÖÖLÖKULOSAARI
KALLIO
REIJOLA
ITÄ-PAKILA
PUKINMÄKI
MYLLYPURO
MELLUNKYLÄ
LAAJASALO
MUNKKINIEMI
MALMI
ULLANLINNA
KAARELA
VUOSAARI
ÖSTERSUNDOM
JAKOMÄKI
LÄNSI-PAKILA
MAUNULA
VIRONNIEMI
PASILA
SUUTARILA
OULUNKYLÄ
HAAGA
VANHAKAUPUNKI
PITÄJÄNMÄKI
KAMPINMALMI
PUISTOLA
HERTTONIEMI
TUOMARINKYLÄ
LAUTTASAARI
LATOKARTANO
Residential area
District border
Green area (incl. military area)
© Helsingin kaupunki, Kaupunkimittausosasto 061/2008
42
kilometriä
0
VARTIOKYLÄ
ALPPIHARJUVALLILA
TAKA-TÖÖLÖKULOSAARI
KALLIO
REIJOLA
ITÄ-PAKILA
PUKINMÄKI
MYLLYPURO
MELLUNKYLÄ
LAAJASALO
MUNKKINIEMI
MALMI
ULLANLINNA
KAARELA
VUOSAARI
ÖSTERSUNDOM
JAKOMÄKI
LÄNSI-PAKILA
MAUNULA
VIRONNIEMI
PASILA
SUUTARILA
OULUNKYLÄ
HAAGA
VANHAKAUPUNKI
PITÄJÄNMÄKI
KAMPINMALMI
PUISTOLA
HERTTONIEMI
TUOMARINKYLÄ
LAUTTASAARI
LATOKARTANO
Industrial area
Residential area
District border
Green area (incl. military area)
Average annual nitrogen dioxide levels at Töölö and Mannerheimintie measurement stations (µg/m3)
Green areas, residental areas and industrial areas in Helsinki
9E N V I R O N M E N T A L R E P O R T 2 0 0 8

Environmental focus in the city procurement processes was given more resources in 2008 when the city Procurement Centre launched the Sustainable procurement campaign. The
objective of the campaign is to analyse all prod-uct and service segments handled by the Procure-ment Centre by evaluating the possibility of im-
posing criteria related to environmental or social sustainability.
Environmental crite-ria were introduced for the first time in 2008, for example, for public school equipment.
The consumption of paper in the city offic-es clearly decreased dur-ing 2008. The average consumption was 2,905 sheets of paper per em-ployee, nearly 20% less than in 2007. At the
same time, the goal of a 10% decrease compared to 2002 set in the Helsinki ecological sustainabili-ty programme (HEKO) was successfully met. Ap-proximately one fourth of the reduction during 2008 was due to the shutdown of the digital print-ing service in the city. Another reason was the in-troduction of several new web-based data systems.
A total of 23,900 Helsinki residents (4.2% of all residents) participated in city events related to en-vironmental education. The number is somewhat larger than during the previous year. The largest events were the Easter Island event in the Helsin-ki Zoo in Korkeasaari and nature schooling events in the Harakka, Gardenia and Young People’s Na-ture houses.
A joint strategy for preventing and reducing damage caused from floods was finalised at the end of 2008. An action plan set to realise the strategy identifies key development areas: building flood protection constructions, evaluating the recom-mended minimum construction heights on coast-al areas and mapping the underground locations with a risk of being flooded.
Procurement, environmental education, environmental risks
Environmental economy indicators (1000 euros) 2008 2007
Environmental income total 61,255 70,111
Air protectionWater conservation & sewage treatmentWaste managementSoil protectionNature conservationOtherEnvironmental administrationEnvironmental educationEnvironmental managementActivity to improve eco-efficiency
19251,944
5,775493
0
1852,065
111,490
10,532 53,049
4,50244
0
238,1694
175
Environmental income, euros/residentShare of the city’s operational income
1073.8 %
1244.7 %
Environmental costs total 106,381 95,697
Air protectionWater conservation & sewage treatmentWaste managementSoil protectionNoise preventionNature conservationEnvironmental taxes and chargesEnvironmental administrationOtherEnvironmental educationEnvironmental managementActivity to improve eco-efficiency
12,84538,04215,049
1,813364
2,55524,042
4,131
2,3921,0604,133
11,50030,82013,544
2,497379
2,27527,209
4,152
1,098554
2,388
Environmental costs, euros/residentShare of the city’s operational costs
1862.8 %
1702.7 %
Environmental investments total 37,871 39,297
Air protectionWater conservation & sewage treatmentWaste managementSoil protectionNoise preventionNature conservationOther
29420,415
37410,188
7721,4174,411
21619,198
94912,605
891,1295,309
Environmental investments, euros/residentShare of the city’s total investments
665 %
696 % 0
500
1000
1500
2000
2500
3000
3500
4000
2008200720062005200420032002200120001999199819971996 target
Sheets/employee
Copy paper consumption of city employees (sheets / employee)
SAR
I KO
SKIN
EN
10 C I T Y O F H E L S I N K I

The total expenses, as reported by city depart-ments, for various environmental actions in Helsinki were 106.4 million euro, 2.8% of the total city expenses. The largest individ-
ual expenses were environmental taxes on electric-ity and fuels, as well as expenses from sewage treat-ment. The total environmental expenses increased by 11.2% compared to 2007, and for the first time exceeded 100 million Euros. The largest increase was in the expenses for sewage treatment, air pro-tection, climate policy, environmental manage-ment and environmental education.
The total environmental incomes for 2008, as re-ported by the administrative domains, were 61.3 mil-lion Euros, covering 3.8% of all city incomes. The in-comes decreased slightly, mainly because there was no income from global emission trading during 2008. The largest incomes came from sewage fees that produced 84% of all environmental incomes.
Environmental investments for the City of Hel-sinki during 2008 were 37.9 million Euros. The ma-jor investments were the expansion and upgrade of the sewer network and cleaning of contaminated land.
The 2008 financial statement includes fund res-ervations for the renovation of the old waste dump in the Myllypuro district and for the reuse of the Hanasaari A power plant area (18.8 million Euros). Helsinki Water has presented a 3.4 million euro conditional environmental debt in its appendix to the financial statement. The item pertains to the soil polluted by sediment pools and ground level oil containers in the Pitkäkoski water treatment plant. The conditional debt of 0.1 million Euros for the Helsinki Public Works Department pertains to the removal of soil polluted by iron cyanide on a play-ground in the Herttoniemi district. ■
Environmental investmentsEnvironmental costs
Other 12%
Nature conservation 4%
Noise prevention 2%
Soil protection 27%
Waste management 1%
Water conservation & sewage treatment 54%
Air and climate protection 1%
Other 7%
Environmental taxes and charges 23%
Environmental administration 4%
Nature conservation 2%
Soil protection 2%
Waste management 14%
Water conservation & sewage treatment 36%
Air and climate protection 12%
Breakdown of Environmental costs and investments 2008
Environmental economy
PEKK
A L
AN
KIN
EN
E N V I R O N M E N T A L R E P O R T 2 0 0 8 11

SUMMARY OF THE CITY OF HELSINKI ENVIRONMENTAL REPORT 2008Publication of the City of Helsinki Administration Centre
Contact informationCamilla v. Bonsdorff, telephone + 358 9,310 31583Markus Lukin, telephone + 358 9,310 31606City of Helsinki Environment Centree-mail: [email protected]: environmental reporting, environmental management, environmental economy
Layout: Tommi Luhtanen, Vihreä Peto OyYear of publication 2009Print run 1000 copiesPrint house: Priimus Paino OyISSN 1976-475XISBN 978-952-223-454-4
The Helsinki sustainable development indicators (joint indicators for the six cities1)
Indicator 2008 2007 2006
Resident satisfaction with city services (index from 1-5) 3.45 3.46 (v. 2005)
Greenhouse gas emissions, tons/resident/year 5.6 6.4 6.5
Share of buildings and housing built on area defined by the city plan 100% 100% 100%
Share of existing and planned nature reservation areas from land area 3.7% 3.7% 3.7%
Share of existing and planned nature reservation areas from total area (water and land)
0.9% 0.9% 0.9%
Community energy consumption, kWh/resident/year 8,152 8,014 8,026
Community water consumption, litres/resident/year 261 258 256
District heating production, by coal by natural gas by oil by sewage thermal energy
35%60%
2%3%
48%48%
3%1%
54%42%
4%0.1%
Share of district heating in housing area 86% 86% 86%
Consumption of heat in properties owned by the city, kWh/built m2 155.6 154.3 155.0
Consumption of electricity in properties owned by the city, kWh/built m2 66.8 64.9 66.4
Communal air quality, number of times of exceeding PM10 daily limits (35 allowed), measurement location Mannerheimintie
35 33 37
Yearly average for nitrogen dioxide, location Mannerheimintie (limit 40 µg/m3) 41 42 42
Communal sewage load, phosphorus, grams/resident/day 0.09 0.08 0.09
Communal sewage load, nitrogen, grams/resident/day 2.1 1.9 1.7
Communal sewage load, BOD7, grams/resident/day 2.7 2.6 2.5
Amount of non-recyclable communal waste (Ämmässuo dump), kg/resident/year 362 352 376
Amount of mixed waste (Ämmässuo), kg/resident/year 255 281 293
Amount of recycled biological waste, kg/resident/year 51.0 37.2 33.3
Private cars, cars/1000 residents 384 372 373
Number of public transport journeys/ resident/day 1.08 1.06 1.06
Cycle road network, metres/resident 2.1 2.0 2.0
Consumption of sheets of copy paper in city departments, A4 sheets/employee/year 2,905 3,625 3,681
Schools and day care centres with environmental certificates 22 16 15
Percentage of Helsinki residents participating in environmental education provided by the city 4.2% 3.4% 6.8%1 Helsinki, Espoo, Vantaa, Turku, Tampere, Oulu