Helsinki Energy Challenge - Helsingin kaupunki
40
Helsinki Energy Challenge Background material – Heating system in Helsinki energychallenge.hel.fi www.hel.fi
Transcript of Helsinki Energy Challenge - Helsingin kaupunki

Helsinki Energy ChallengeBackground material – Heating system in Helsinki
energychallenge.hel.fi www.hel.fi
Helsinki Energy ChallengeContentsGlossary 3Foreword 4Executive summary 5
1 Introduction 71.1 Background 71.2 Heat demand and other natural circumstances in Helsinki 7
2 Heat consumption characteristics 102.1 Total energy and heat consumption in Helsinki 102.2 The annual profile of heat demand 122.3 Heat consumption drivers and their impact on demand 132.4 District heating customers 18
3 Current district heating system in Helsinki 193.1 Principles of district heating system design 193.2 District heating network in Helsinki 203.3 Current production capacity in Helsinki 22
4 Cost of district heat production 304.1 Cost components of district heating production 304.2 Comparison of district heating and some alternative heating methods 32
5 Regulation impacting the district heating sector 335.1 Regulation of district heating in Finland 335.2 Energy taxation 345.3 Policy impacting heat demand 345.4 Land use and permitting procedures 34
6 Further studies and data sources 37

Glossary
Abbreviation DefinitionCAGR Compound annual growth rateCapex Capital expenditureCCGT Combined cycle gas turbineCHP Combined heat and powerCO2 Carbon dioxideCOP Coefficients of performanceDH District heatingDHC District heating and coolingDSO Distribution system operatorEED Energy Efficiency DirectiveEPBD Energy performance of buildingsEU European UnionEU ETS EU Emissions Trading SystemGHG Greenhouse gasGSHP Ground source heat pumpGT HP Geothermal heat pumpGWh Gigawatt hoursHFO Heavy fuel oilHOB Heat only boilerkm KilometrekWh Kilowatt hoursLCOE Levelised cost of energyLFO Light fuel oilLULUCF Land Use, Land-Use Change, and Forestrymm MillimetreMW MegawattMWh Megawatt hoursn. a. Not availableOpex Operational expenditureRED Renewable Energy DirectiveRES Renewable energy sourceTWh Terawatt hoursVAT Value added taxWACC Weighted average cost of capital
Helsinki Energy Challenge3

This background report has been prepared by Pöyry Management Consulting Oy to support the Helsinki Energy Challenge organised by the City of Helsinki. Helsinki Energy Challenge is a global challenge competition that seeks to answer the question: How can we decarbonise the heating of Helsinki, using as little biomass as possible?
Foreword
Helsinki Energy Challenge4

Space and domestic hot water heating in Helsinki is currently mostly based on the district heating system. The heat production for the district heat system is based on several energy sources and fuels, but coal is one of the main sources. Due to Helsinki’s aim of being carbon-neutral by 2035, as well as the banning of coal for energy production purposes in Finland from 2029 onwards, new solutions are needed to supply Helsinki’s heat demand.
The volume of district heat demand in Helsinki is approximately 7 TWh, which is about 20% of the total district heat demand in Finland. Helsinki is located on the south coast of Finland, and the population of the city is concentrated in the coastal area. Due to the cold climate, heat demand is strongly correlated to weather, and the capacity needed to produce heat on cold winter days is substantial. The volume, variation, and the location of the heat demand means that it has been challenging to find a replacement for fossil fuels in Helsinki. Fossil fuels are mainly used in cogeneration of heat and elec-tricity or in trigeneration of heating, cooling, and electricity. Current district heating pro-duction by unit type and fuel use in Helsinki is presented in Figure 1.
Helen, the owner and operator of the district heat system in Helsinki, needs to re-place its coal plants by 2029 at the latest due to the phase-out of coal regulation. In 2018, Helen used some 6.5 TWh of coal, producing both heat and electricity from it. Helen plans on implementing the coal phase-out in two stages, where the first stage involves the closure of a coal CHP plant in Hanasaari by
2024 followed by the second stage where another coal CHP unit in Salmisaari is shut down or converted to other fuels by 2029. Coal phase-out results the loss of a total of 920 MW of heat production capacity and there is a need for a replacement of the capacity, particularly to ensure sufficient, reliable capacity during cold winter periods. In heat production terms, this amounts to some 3.5 TWh of heat.
Helen’s current plan for the first stage of replacements comprises a new biomass heat-only boiler plant investment, increasing waste heat recovery and heat pump capacity, geothermal heat, locality-level heating solu-tions, as well as increased heat procurement from the adjacent district heating networks in Espoo and Vantaa.
In Finland, district heating business is not directly regulated and customers are free to select their own heating method and also switch away from district heating. On the other hand, the change of heating method can require investments.
In heating supply, there is an obligation to maintain high security of supply of heating during normal conditions as well as emer-
Executive summary
Helsinki Energy Challenge5

gency conditions, which is also to be taken into account when considering new solutions. Furthermore, the time requirements of land use and permitting procedures need to be considered. All of these aspects set challeng-ing prerequisites for new solutions for the replacement of coal in Helsinki.
Figure 1 District heat production by unit type and energy source in Helsinki, 2018.
5 950
580 63040
0
1 000
2 000
3 000
4 000
5 000
6 000
7 000
CHP Heat pumps Heat boilers Purchased heat
GWh
DH production by unit type
53 %35 %
8 %
3 % 1 %DH production by energy source
CoalNatural gasHeat pumpsBio fuels
Fuel oil
Source: Finnish Energy (2019), Helen website
Helsinki Energy Challenge6
1.1 BackgroundHelsinki’s goal is to be carbon-neutral by the year 2035. Currently, about 56% of Helsinki’s carbon dioxide emissions originate from the production of energy used for heating. In order to reach the carbon-neutrality goal, Helsinki needs to reduce the emissions originating from the production of heat, in addition to other actions.
In the densely populated Helsinki, the main source of space heating and domestic hot water heating is district heating, with a share of around 92% of total heat demand. The total district heat demand in Helsinki is about 7 TWh, which is approximately 20% of the entire district heat demand in Fin-land. The location of Helsinki is presented in Figure 2.
In Helsinki, the city-owned energy com-pany Helen is in charge of the production, distribution, and sale of district heat. In 2018, coal accounted for 53% of the district heat produced by Helen. Coal is used mainly in cogeneration of power and heat and in tri-generation, where power, heat, and cooling is produced in one process. The coal-fired power plants are located in Hanasaari and Salmisaari close the city centre. The shut-down of Hanasaari by 2024 has already been approved, and due to the Finnish govern-ment’s decision to ban energy use of coal as of 2029, coal-based production in Salmisaari must also cease before 2029. The current indicative plan to replace coal indicates that a substantial part of current coal use would be replaced with biomass which could result in up to 1.5–3 TWh of biomass (incl. biomass
1 Finnish Meteorological Institute (FMI). Available at: https://en.ilmatieteenlaitos.fi/climate
pellets) being used in the production of heat in Helsinki in 2030. This corresponds to ap-proximately 20% of all the biomass fractions used in the production of district heat in the whole Finland in 2018.
1.2 Heat demand and other natural circumstances in HelsinkiThe northern location of Helsinki means that the temperature levels vary considerably and the heat demand is large in the winter months. Average temperature and precipita-tion information at Helsinki Kaisaniemi (cen-tral Helsinki) is presented in Figure 3.
Further temperature-related graphics can be found at the FMI webpage, with in-formation on other factors such as typical maximum and minimum temperature range as well as typical Helsinki snow depth1.
The heat demand can be measured in heating degree days, a measurement quan-tifying the demand for energy needed to heat a building. It is the number of degrees that a day’s average temperature is below the temperature where buildings need to be heated (17°Celsius in Finnish measurement). On average, there were 3,878 heating degree days in Helsinki in the latest long-term refer-ence period 1981–2010. Table 1 summarises average heating degree days in Helsinki for each month during the reference period. Annual heating degree days in the period of 2008–2018 are depicted in Figure 4. During this period, the heating degree days in the Helsinki area have been around 7% lower than the reference period average.
1 Introduction
Helsinki Energy Challenge7

Figure 3 Average precipitation and temperature information, 1960–2018, Helsinki Kaisaniemi measurement point.
Figure 2 Map of Finland and Helsinki.
HELSINKI INNOVATION CHALLENGE
September 2019
5
PÖYRY MANAGEMENT CONSULTING
Figure 3 – Average precipitation and temperature information, 1960-2018, Helsinki Kaisaniemi measurement point
Source: Finnish Meteorological Institute (FMI)
Further temperature-related graphics can be found at the FMI webpage, with information on other factors such as typical maximum and minimum temperature range as well as typical Helsinki snow depth1.
The heat demand can be measured in heating degree days, a measurement quantifying the demand for energy needed to heat a building. It is the number of degrees that a day's average temperature is below the temperature where buildings need to be heated (17 °Celsius in Finnish measurement). On average, there were 3 878 heating degree days in Helsinki in the latest long-term reference period 1981–2010. Table 1 summarises average heating degree days in Helsinki for each month during the reference period. Annual heating degree days in the period of 2008–2018 are depicted in Figure 4. During this period, the heating degree days in the Helsinki area have been around 7 % lower than the reference period average.
The annual demand for heating can vary rather considerably due to the variation in the outdoor temperatures. Demand volumes are thus often temperature-normalised by heating companies and organisations working in the heating markets. With temperature-normalisation, the influence of the temperature on the amount of consumed heat can be projected and the heat demand variation between years can be better estimated and analysed. In this report, the normalisation is based on the normal year, based on the reference period of 1981–2010.
Table 1 – Monthly heating degree days in Helsinki, reference period 1981-2010
Jan Feb Mar Apr May Jun July Aug Sep Oct Nov Dec
Helsinki 647 612 566 383 153 11 1 12 125 316 464 588 Source: Finnish Meteorological Institute (FMI)
1 The information is available in English at https://en.ilmatieteenlaitos.fi/climate
-10
-5
0
5
10
15
20
0102030405060708090
Janu
ary
Februa
ryMarc
hApri
lMay
June Ju
ly
Augus
t
Septem
ber
Octobe
r
Novem
ber
Decem
ber
Tem
pera
ture
(°C)
Prec
ipita
tion
(mm
)
Monthly average precipitation (mm) Monthly average air temperature(°C)
Source: Pöyry
Helsinki Energy Challenge8

Figure 4 Annual heating degree days in Helsinki in the period of 2008–2018.
HELSINKI INNOVATION CHALLENGE
September 2019
6
PÖYRY MANAGEMENT CONSULTING
Figure 4 – Annual heating degree days in Helsinki in the period of 2008–2018
Source: FMI2
2 More information and data regarding heating degree days in the 2010s can be found at the FMI webpage at https://ilmatieteenlaitos.fi/lammitystarveluvut
3878
3244
3737
4376
3493
3797
35923464 3118
3589 3549
3552
0
500
1 000
1 500
2 000
2 500
3 000
3 500
4 000
4 500
5 000
2008 2009 2010 2011 2012 2013 2014 2015 2016 2017 2018
Reference period average (1981-2010)Annual heating degree days 2008-2018
Annual heating degree days
Source: FMI. More information and data regarding heating degree days in the 2010s can be found at: https://en.ilmatieteenlaitos.fi/heating-degree-days
Table 1 Monthly heating degree days in Helsinki, reference period 1981–2010.
Jan Feb Mar Apr May Jun July Aug Sep Oct Nov DecHelsinki 647 612 566 383 153 11 1 12 125 316 464 588
Source: Finnish Meteorological Institute (FMI).
Helsinki Energy Challenge9

2 Heat consumption characteristics
Figure 5 Total energy consumption in Helsinki, 2017, GWh.
HELSINKI INNOVATION CHALLENGE
September 2019
8
PÖYRY MANAGEMENT CONSULTING
2. HEAT CONSUMPTION CHARACTERISTICS
2.1 Total energy and heat consumption in Helsinki Heat consumption represents half (50.5 %) of the total energy consumption in Helsinki and is in the range of ca. 7 TWh in a year. This corresponds to ca. 10 % of Finland’s heating demand. District heating, consumed electricity and transport represent 95 % of the total energy consumption in Helsinki. The normalised energy consumption shares in Helsinki in 2017 are illustrated in more detail in Figure 5.
Figure 5 – Total energy consumption* in Helsinki, 2017, GWh
*Normalised heat demand
Source: Helsinki Region Environmental Services Authority HSY at Helsinki Region Infoshare
The annual demand of energy for heating has been normalised in the above figure, as described in Section 1.2. In addition to the yearly differences, the heat consumption and need also varies significantly between months and within each day. These differences are described in more detail in Section 2.2.
The normalised total energy consumption in the city of Helsinki was ca. 13.8 TWh in 2017, where the heating consumption has been temperature-normalised by a rolling five-year average. In the same year, the actual measured energy consumption was slightly higher: ca. 14.0 TWh. The historical development of the heat demand in Helsinki is shown in Figure 6.
6 412
229331
3 977
2 734
114
District heating Oil heating Electricity heatingConsumed electricity Transport Industry and implements
Total 13 796 GWh
2.1 Total energy and heat consumption in HelsinkiHeat consumption represents half (50.5%) of the total energy consumption in Helsinki and is in the range of ca. 7 TWh in a year. This corresponds to ca. 20% of Finland’s heating demand. District heating, consumed electricity and transport represent 95% of the total energy consumption in Helsinki. The normalised energy consumption shares in Helsinki in 2017 are illustrated in more detail in Figure 5.
The annual demand of energy for heat-ing has been normalised in the figure, as described in Section 1.2. In addition to the yearly differences, the heat consumption and need also varies significantly between
months and within each day. These differenc-es are described in more detail in Section 2.2.
The normalised total energy consumption in the city of Helsinki was ca. 13.8 TWh in 2017, where the heating consumption has been temperature-normalised by a rolling five-year average. In the same year, the actual measured energy consumption was slightly higher: ca. 14.0 TWh. The historical development of the heat demand in Helsinki is shown in Figure 6.
The share of district heating of the total heat consumption in Helsinki has been stable at around 92% during past decades. Oil and electric heating represent the remaining ca. 8% of the heat demand.
Source: Helsinki Region Environmental Services Authority (HSY) at Helsinki Region Infoshare
Helsinki Energy Challenge10

Mainly due to city growth, the normalised heat demand in Helsinki has increased during 2000–2017 by a CAGR of 0.48%, which corresponds to 548 GWh. However, in the current decade (2010–2017), heat de-mand has started decreasing with a CAGR of
−0.58% (245 GWh). It can already be seen that the heat de-
mand per citizen has decreased by 0.6 MWh in 17 years.
In the long term, it is expected that the total heat consumption will further decline mostly due to energy efficiency measures and the impact of climate change. The City of Helsinki has performed a study of the future of district heating in Helsinki. The study con-cludes that district heating demand will drop from 6,331 GWh in 2015 to 4,873–5,317 GWh in 20352. The demand drivers and their impact on heat demand will be discussed in more detail in Section 2.3.
Considering the energy consumer groups in Helsinki as a whole, it is noted that housing and services covered almost 92% of the total
2 City of Helsinki (2018).The Carbon Neutral Action Plan. Available at: https://www.hel.fi/static/liitteet/kaupunkiymparisto/julkaisut/julkaisut/HNH-2035/Carbon_neutral_Helsinki_Action_Plan_1503019_EN.pdf
energy consumption in 2017. The detailed numbers are presented in Figure 7.
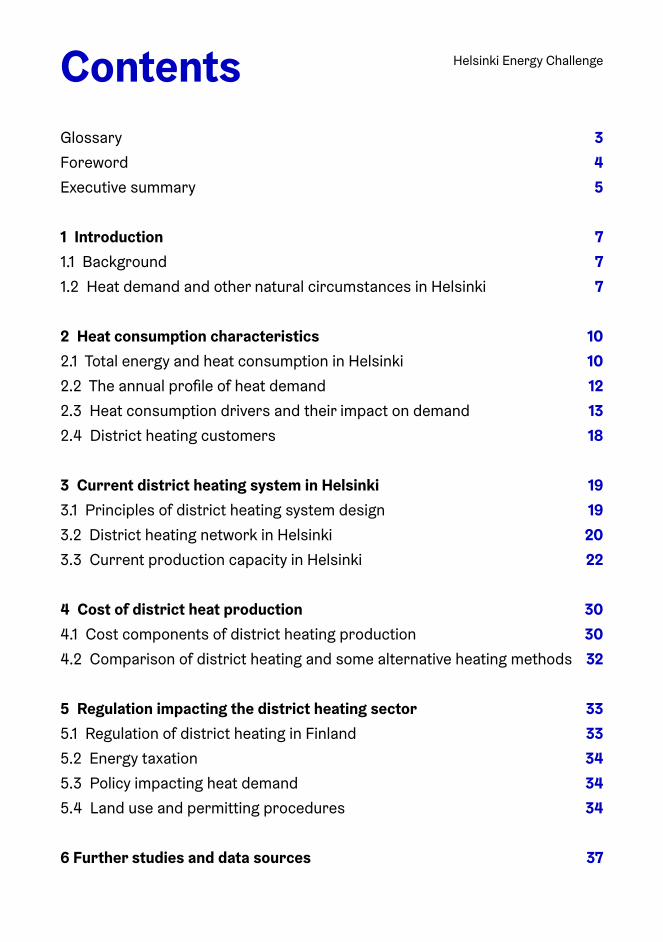
Most of the energy consumption in Hel-sinki is utilised in the heating of buildings and providing electricity to housing, services, and industry. Space heating corresponds to ca. 70%, and hot water to ca. 15% of all energy use in an average building. This is the reason for looking more closely at the building sector in Helsinki in order to better understand the demand development for the heating sector. This is discussed in more detail in Section 2.3.
The consumption split of district heating by consumer type in Helsinki in 2017 is illus-trated in Figure 8. It can be seen that the residential customer segment forms the larg-est demand, with a share of ca. 62%. Other sectors, which include different municipal buildings in e.g. health care and educational facilities, as well as other purposes such as offices and commercial buildings, represent ca. one third (34%) of the demand. Industry’s share is ca. 4% of the total district heating demand.
Figure 6 Heat consumption development in Helsinki, 2000–2017, GWh.
HELSINKI INNOVATION CHALLENGE
September 2019
9
PÖYRY MANAGEMENT CONSULTING
Figure 6 – Heat consumption development in Helsinki, 2000-2017, GWh
Source: Helsinki Region Environmental Services Authority HSY at Helsinki Region Infoshare
The share of district heating of the total heat consumption in Helsinki has been stable at around 92 % during past decades. Oil and electric heating represent the remaining ca. 8 % of the heat demand. Electric heating also includes ground-source and exhaust-air heat pumps. Over the years, electric heating has steadily increased its market share, whereas the share of oil heating has slowly decreased.
The construction of the Helsinki district heating network started in the 1950s, and larger properties like housing companies and apartment buildings are connected to the district heating network. The city-owned district heating company Helen is the main heat provider in the city as well as the biggest district heating producer and distributor in Finland. Helen’s network consists of ca. 1 300 km of district heating pipeline.
Mainly due to city growth, the normalised heat demand in Helsinki has increased during 2000–2017 by a CAGR of 0.48 %, which corresponds to 548 GWh. However, in the current decade (2010–2017), heat demand has started decreasing with a CAGR of −0.58% (245 GWh).
It can already be seen that the heat demand per citizen has decreased by 0.6 MWh in 17 years. The oil heating demand per citizen has also decreased, but this is partially explained by oil heating being replaced with other heating methods. Electric heating demand per citizen has started to decline in this decade as well.
In the long term, it is expected that the total heat consumption will further decline mostly due to climate change and energy efficiency measures. The City of Helsinki has performed a study of the future of district heating in Helsinki. The study concludes that district heating demand will drop from 6 331 GWh in 2015 to 4 873–5 317 GWh in 20357. The demand drivers and their impact on heat demand will be discussed in more detail in Section 2.2.
Considering the energy consumer groups in Helsinki as a whole, it is noted that housing and services covered almost 92 % of the total energy consumption in 2017. The detailed numbers are presented in Figure 7.
7 Hiilineutraali Helsinki 2035 -toimenpideohjelma, City of Helsinki 2019
0
1 000
2 000
3 000
4 000
5 000
6 000
7 000
8 000
2000
2001
2002
2003
2004
2005
2006
2007
2008
2009
2010
2011
2012
2013
2014
2015
2016
2017
GW
h
District heating Oil heating Electricity heating
Source: Helsinki Region Environmental Services Authority (HSY) at Helsinki Region Infoshare
Helsinki Energy Challenge11
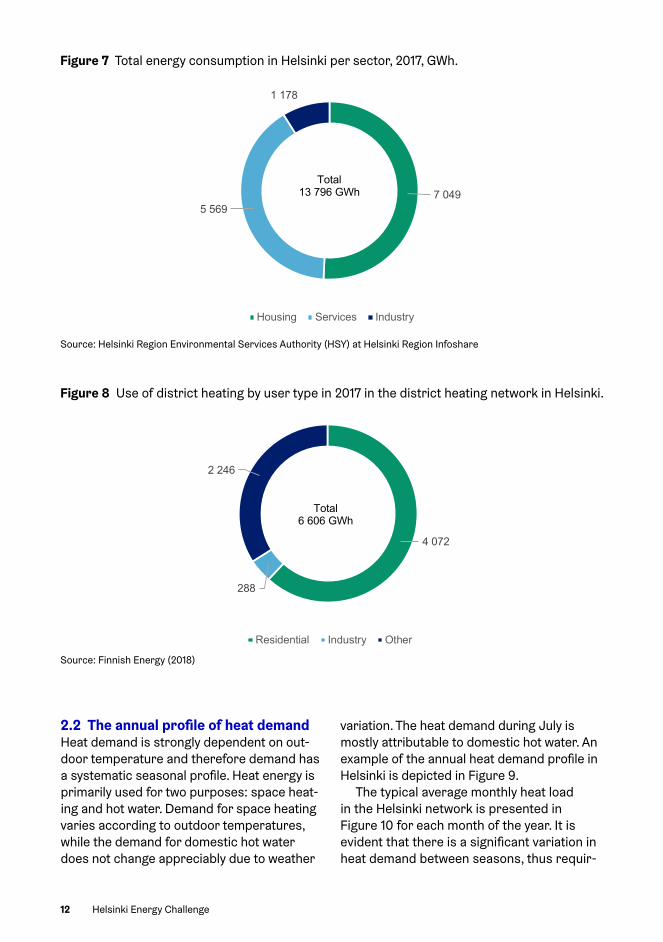
Figure 7 Total energy consumption in Helsinki per sector, 2017, GWh.
Figure 8 Use of district heating by user type in 2017 in the district heating network in Helsinki.
HELSINKI INNOVATION CHALLENGE
September 2019
10
PÖYRY MANAGEMENT CONSULTING
Figure 7 – Total energy consumption in Helsinki per sector, 2017, GWh
Source: Helsinki Region Environmental Services Authority HSY at Helsinki Region Infoshare
Most of the energy consumption in Helsinki is utilised in the heating of buildings and providing electricity to housing, services, and industry. Space and hot water heating correspond to ca. 70 % and ca. 15 % of all the energy used in an average building, respectively. This is the reason for looking more closely at the building sector in Helsinki in order to better understand the demand development for the heating sector. This is discussed in more detail in Section 2.2.
The consumption split of district heating in Helsinki in 2017 is illustrated in Figure 8. It can be seen that the residential customer segment forms the largest demand, with a share of ca. 62 %. Other sectors, which include different municipal buildings in e.g. health care and educational facilities, as well as other purposes such as offices and commercial buildings, represent ca. one third (34 %) of the demand. Industry’s share is ca. 4 % of the total district heating demand.
7 0495 569
1 178
Housing Services Industry
Total 13 796 GWh
HELSINKI INNOVATION CHALLENGE
September 2019
11
PÖYRY MANAGEMENT CONSULTING
Figure 8 – Use of district heating by user type in 2017 in the district heating network in Helsinki
Source: Finnish Energy
2.2 The annual profile of heat demand Heat demand is strongly dependent on outdoor temperature and therefore demand has a systematic seasonal profile. Heat energy is primarily used for two purposes: space heating and hot water. Demand for space heating varies according to outdoor temperatures and is therefore considered to be weather-dependent, while the demand for domestic hot water does not change appreciably due to weather variation. The heat demand during July is mostly attributable to domestic hot water. An example of the annual heat demand profile in Helsinki is depicted in Figure 9.
Figure 9 – Typical annual heat demand profile in Helsinki
4 072
288
2 246
Residential Industry Other
Total 6 606 GWh
0
500
1 000
1 500
2 000
2 500
3 000
Jan Feb Mar Apr May Jun Jul Aug Sep Oct Nov Dec
MW
2.2 The annual profile of heat demand Heat demand is strongly dependent on out-door temperature and therefore demand has a systematic seasonal profile. Heat energy is primarily used for two purposes: space heat-ing and hot water. Demand for space heating varies according to outdoor temperatures, while the demand for domestic hot water does not change appreciably due to weather
variation. The heat demand during July is mostly attributable to domestic hot water. An example of the annual heat demand profile in Helsinki is depicted in Figure 9.
The typical average monthly heat load in the Helsinki network is presented in Figure 10 for each month of the year. It is evident that there is a significant variation in heat demand between seasons, thus requir-
Source: Helsinki Region Environmental Services Authority (HSY) at Helsinki Region Infoshare
Source: Finnish Energy (2018)
Helsinki Energy Challenge12

ing that the heat production fleet be able to maintain sufficient supply, especially during the cold winter months.
Heat demand also varies significantly within a month, due to variance in weather conditions. This is shown in Figure 11, where the typical range between the maximum and minimum heat load within each month is pre-sented as a bar. The variance in heat demand is greater in the coldest months. This requires that the district heating production fleet be flexible enough that the production capacity is able to meet the heat load at every moment. As is typical for district heating systems, peak heat demand is currently met by separate peak load boilers in the Helsinki district heat-ing network.
Heat demand in the Helsinki network also follows a somewhat systematic daily profile, which is a result of large consumer masses having similar consumption profiles. Figure 12 presents an example of hourly demand for heat for an average day in January. The daily profile has an increasing trend in the morn-ing and declines in the evening. Consumption
begins to increase at around 6 AM and is primarily a result of increased hot water consumption in the mornings as well as due to ventilation systems in offices and commer-cial buildings typically turning on a couple of hours before full occupancy. Similarly to the monthly variation, this requires that the dis-trict heating system be capable of changing heat supply levels in a flexible manner.
2.3 Heat consumption drivers and their impact on demandHeat demand in Helsinki has been increasing due to the growth of the city, while at the same time improving energy efficiency is driving demand down. The main drivers for the future demand for heating include urban-isation and population development, energy efficiency, and climate change. These factors are discussed in more detail in Table 2.
Figure 9 Helsinki district heat demand profile in 2016 (MW).
Source: Helen, https://www.helen.fi/en/company/responsibility/current-topics/open-data
0
500
1000
1500
2000
2500
3000
Jan Feb Mar Apr May Jun Jul Aug Sep Oct Nov Dec
MW
Helsinki Energy Challenge13

Figure 10 Average monthly heat load in Helsinki network in 2016 (MW).
Figure 11 Range of maximum and minimum monthly heat load in 2016 (MW).
Figure 12 Average hourly heat demand in Helsinki DH network for a day in January (MW).
1740
1230 1160
870
430 360 290 320450
890
1260 1260
0200400600800
100012001400160018002000
Jan Feb Mar Apr May Jun Jul Aug Sep Oct Nov Dec
MW
Source: Pöyry analysis, Helen, https://www.helen.fi/en/company/responsibility/current-topics/open-data
0
500
1000
1500
2000
2500
3000
Jan Feb Mar Apr May Jun Jul Aug Sep Oct Nov Dec
MW
1450
1500
1550
1600
1650
1700
1750
1800
1850
0 1 2 3 4 5 6 7 8 9 10 11 12 13 14 15 16 17 18 19 20 21 22 23
MW
Helsinki Energy Challenge14

Table 2 Drivers impacting heat volume development in the long run.
Volume driverEffect on demand Description
Population development
↑ An increase in population will drive new building activity and heat volume demand. The capital region is expecting strong growth in the near and long term, which will impact heat demand.
Urbanisation ↑ Populations are moving from rural environments to towns and from towns to cities. It also increases the density of building stock. Helsinki and the capital region are one of the areas where urbanisation focuses.
Energy efficiency
↓ Energy efficiency is high on the agenda for the EU, and also for Finland. A number of policy measures have been integrated into the way buildings are planned, constructed, and renovated in or-der to meet energy efficiency targets. Although renovations are often not undertaken solely for energy efficiency reasons, grad-ually renovating the current building stock with more modern materials and solutions will improve energy efficiency. Building regulations also require energy efficiency improvements when major renovations are carried out. New buildings are built under more strict building codes and are more energy efficient than old buildings.
Climate change
↓ Ambient temperature is one of the main drivers of demand for heating, with cold winters increasing demand. Climate projec-tions suggest that average temperatures will increase in the future resulting in lower heat demand.
Source: Pöyry analysis
Helsinki Energy Challenge15
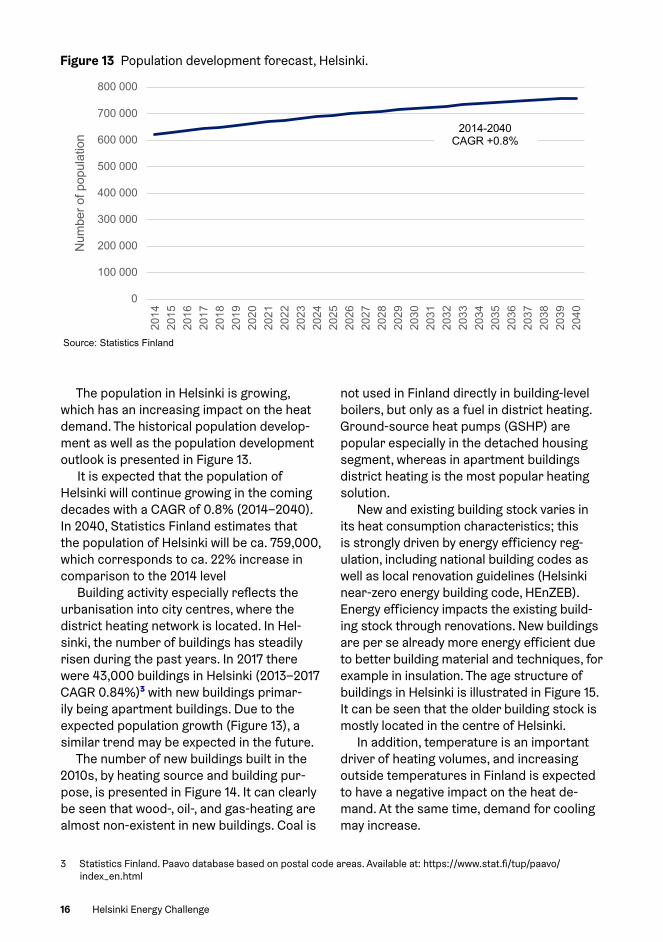
The population in Helsinki is growing, which has an increasing impact on the heat demand. The historical population develop-ment as well as the population development outlook is presented in Figure 13.
It is expected that the population of Helsinki will continue growing in the coming decades with a CAGR of 0.8% (2014–2040). In 2040, Statistics Finland estimates that the population of Helsinki will be ca. 759,000, which corresponds to ca. 22% increase in comparison to the 2014 level
Building activity especially reflects the urbanisation into city centres, where the district heating network is located. In Hel-sinki, the number of buildings has steadily risen during the past years. In 2017 there were 43,000 buildings in Helsinki (2013–2017 CAGR 0.84%)3 with new buildings primar-ily being apartment buildings. Due to the expected population growth (Figure 13), a similar trend may be expected in the future.
The number of new buildings built in the 2010s, by heating source and building pur-pose, is presented in Figure 14. It can clearly be seen that wood-, oil-, and gas-heating are almost non-existent in new buildings. Coal is
3 Statistics Finland. Paavo database based on postal code areas. Available at: https://www.stat.fi/tup/paavo/index_en.html
not used in Finland directly in building-level boilers, but only as a fuel in district heating. Ground-source heat pumps (GSHP) are popular especially in the detached housing segment, whereas in apartment buildings district heating is the most popular heating solution.
New and existing building stock varies in its heat consumption characteristics; this is strongly driven by energy efficiency reg-ulation, including national building codes as well as local renovation guidelines (Helsinki near-zero energy building code, HEnZEB). Energy efficiency impacts the existing build-ing stock through renovations. New buildings are per se already more energy efficient due to better building material and techniques, for example in insulation. The age structure of buildings in Helsinki is illustrated in Figure 15. It can be seen that the older building stock is mostly located in the centre of Helsinki.
In addition, temperature is an important driver of heating volumes, and increasing outside temperatures in Finland is expected to have a negative impact on the heat de-mand. At the same time, demand for cooling may increase.
Figure 13 Population development forecast, Helsinki.
HELSINKI INNOVATION CHALLENGE
September 2019
15
PÖYRY MANAGEMENT CONSULTING
Figure 13 – Population development forecast, Helsinki
Source: Statistics Finland
It is expected that the population of Helsinki will continue growing in the coming decades with a CAGR of 0.8 % (2014–2040). In 2040, Statistics Finland estimates that the population of Helsinki will be ca. 759 000, which corresponds to ca. 22 % increase in comparison to the 2014 level.
Population growth and urbanisation are strongly connected. Building activity especially reflects the urbanisation into city centres, where the district heating network is located. In Helsinki, the number of buildings has steadily risen during the past years. In 2017 there were 43 213 buildings in Helsinki (2013–2017 CAGR 0.84 %)8 with new buildings primarily being apartment buildings. Due to the expected population growth (Figure 13), a similar trend may be expected in the future.
The number of new buildings built in the 2010s, by heating source and building purpose, is presented in Figure 14. It can clearly be seen that wood-, oil-, and gas-heating are almost non-existent in new buildings. Coal is not used in Finland directly in building-level boilers, but only as a fuel in district heating. Ground-source heat pumps (GSHP) are popular especially in the detached housing segment, whereas in apartment buildings district heating is the most popular heating solution.
8 Statistics Finland, Paavo database based on postal code areas
0
100 000
200 000
300 000
400 000
500 000
600 000
700 000
800 000
2014
2015
2016
2017
2018
2019
2020
2021
2022
2023
2024
2025
2026
2027
2028
2029
2030
2031
2032
2033
2034
2035
2036
2037
2038
2039
2040
Num
ber o
f pop
ulat
ion
2014-2040 CAGR +0.8%
Helsinki Energy Challenge16
Figure 14 Floor space of new buildings in Helsinki from 2010 onwards, by heating source.
HELSINKI INNOVATION CHALLENGE
September 2019
16
PÖYRY MANAGEMENT CONSULTING
Figure 14 – Floor space of new buildings in Helsinki from 2010 onwards, by heating source
Note: other buildings include e.g. municipal buildings in education, fire department, and assembly functions, as well as other buildings such as warehouses
Source: Statistics Finland
New and existing building stock varies in its heat consumption characteristics; this is strongly driven by energy efficiency regulation, including national building codes as well as local renovation guidelines (Helsinki near-zero energy building code, HEnZEB). Energy efficiency impacts the existing building stock through renovations. New buildings are per se already more energy efficient due to better building material and techniques, for example in insulation. The age structure of buildings in Helsinki is illustrated in Figure 15. It can be seen that the older building stock is mostly located in the centre of Helsinki.
0
500 000
1 000 000
1 500 000
2 000 000
2 500 000
3 000 000
3 500 000
Districtheating
Oil, gas Electricity Coal Wood, peat GSHP Other andunknown
Floo
r spa
ce (m
2 )
Detached houses Row houses Apartment buildings Industrial buildingsOffice buildings Commercial buildings Other buildings HELSINKI INNOVATION CHALLENGE
September 2019
17
PÖYRY MANAGEMENT CONSULTING
Figure 15 – Age structure of Helsinki buildings on a map
Note: the map also includes other capital region cities Note: the map does not include very small buildings (smaller than 10 m²) or shelters, sheds, and other such building types without a building code Source: Urban Environment Division; City Survey Services; at Helsinki Region Infoshare
In addition, temperature is an important driver of heating volumes, and increasing outside temperatures in Finland is expected to have a negative impact on the heat demand. At the same time, demand for cooling may increase. In smaller apartments, this may increase the attractiveness of heat pumps and also drive district heating companies to increasingly offer cooling solutions to their clients.
2.4 District heating customers One of the main customer segments of district heating is large buildings, such as apartment and commercial buildings, where the housing company or the property owner is responsible for the building heating system. The usage of district heating is typically measured on building level, for example at apartment building level.
Meters are used to measure the capacity requirement as well as heat consumption, based on district heating water flows and temperature differences. Remote metering is already the industry standard in district heating. In remote metering, the consumption information is collected centrally in a data system. New remote meters are usually hourly-based, but older meters may be based on daily or monthly consumption.
Figure 15 Age structure of Helsinki buildings on a map.1
1 More information about the Helsinki building stock, ownership etc. is compiled in city-maintained archives, registers and statistics avail-able at: https://www.hel.fi/helsinki/en/housing/plots-land-buildings/building-stock
Helsinki Energy Challenge17

2.4 District heating customersCustomers are connected to district heating via heat exchangers which transfer heat from the network to building heating systems. Buildings typically have two heat exchangers: one for space heating i.e. serving the radiator network and one for domestic hot water.
Meters are used to measure the capacity requirement as well as heat consumption, based on district heating water flows and temperature differences. Remote metering is already the industry standard in district heating. In remote metering, the consump-tion information is collected centrally in a data system. New remote meters are usually hourly-based, but older meters may be based on daily or monthly consumption.
District heating customers are billed based on customer-specific heat consump-tion metering, but in many cases the end-us-
ers are not directly customers. For example in the case of apartment buildings, the hous-ing company is the district heating customer instead of the individual inhabitants. Within a property, like an apartment building, heating costs are typically distributed based on the dwelling’s square meters and dwelling-spe-cific heat measurement is only rarely used in Finland.
Due to individual end-users not being directly district heating customers and lack of user-specific measurements, demand response is not yet widespread.
Private housing companies represent a large share of district heating customers, where building ownership is allocated to the dwelling owners. Changing heating solution, or other significant changes to the heating system, in such buildings requires the major-ity vote of shareholders.
Helsinki Energy Challenge18

3 Current district heating system in Helsinki
3.1 Principles of district heating system design District heating systems are formed of the heat transfer network, heat production units, and the heat users with heat exchangers (described in the previous chapter). District heat production units are designed so that there is sufficient capacity available with reliable production to meet the heat demand all time, also during the coldest winter peri-ods. In case of the Helsinki district heating network, the design temperature the system needs to meet is −26°C.
The current production system is de-signed so that each unit has its own role in the production mix and that there are no overlapping production units. In the summer time, the city-owned energy company Helen is able to produce large amount of the heat demand with heat pumps. On the other hand, during the winter period more expensive and in current situation, also more emission-in-tensive production is needed.
District heating company is obliged to deliver heat to its customers at all times based on their demand, and the production mix needs to ensure high security of supply.
Figure 16 Map of Helsinki district heating network.
Source: Helen
Helsinki Energy Challenge19

The district heating network is designed to ensure efficient heat distribution throughout the network and to minimise distribution bottle-necks. The location of production units within the network impacts the network construction.
3.2 District heating network in HelsinkiThe construction of the Helsinki district heating network started in the 1950s, and larger properties like housing companies and apartment buildings are connected to the district heating network.
The Helsinki district heating network has about 1,400 km of pipeline and covers the entire Helsinki region (Figure 16). The total volume of the network is some 130,000 m3 and comprises two network areas that op-erate at different pressure levels. The two
network areas are the main network, cover-ing the densely populated city centre area, and the Eastern network that is located in the region of Eastern Helsinki. The pressure levels for the main and Eastern network are ca. 6 and 8 bar, respectively. The Vuosaari plant is used to maintain the pressure in the eastern network, while the Salmisaari and Hanasaari plants maintain the pressure in the main network.
The district heating network operates at temperature levels in the range of 80–115°C on the supply side and 40–60°C on the re-turn side. Temperature levels vary between seasons and according to heat demand. High temperature levels in the supply side are needed in the winter to ensure that all heat demand is covered, while lower temperature levels are sufficient during the summer sea-
! -./"0120!0113456031!7-5//.18.!
!
!
"#$%#&'#(!)*+,!
,-*9:;<;!=5158.=.16!731">/6018!
!
6?#!?#C%!#XP?CDH#(A!#DC'J#!%?#!CJ%#(DC%@U#!BO!I%@J@k@DH!?#C%!$(BEIP%@BD!O(B&!CDB%?#(!D#%SB(Q!CA!CD!CEE@%@BDCJ! ?#C%! ABI(P#! @D! %?#! -#JA@DQ@! E@A%(@P%! ?#C%@DH! D#%SB(QR! CDE! A#JJ@DH! #XP#AA! ?#C%! %B! B%?#(!D#%SB(QAT!
B&'8%5* .]* Z* <")39* (53)* #%"W8;)&"4* ;3#3;&)$* 34W* (53)* 5f;(34'5%* ;3#3;&)$* &4* )(5*;3#&)39*%5'&"4*"V*B&4934W*
!1B%#m!0D!=C(%@DJCCQAB!7-9!$JCD%!K4CD%CCD!.D#(H@CNR!C!$C(%@CJ!'@B&CAA!PBDU#(A@BD!SCA!$#(OB(&#E!@D!)*+,R!S?@P?!@A!DB%!(#OJ#P%#E!BD!%?#!E#$@P%#E!$(BEIP%@BD!PC$CP@%@#AT!`B(%I&jA!?#C%@DH!$JCD%!@D!2@(QQBDI&&@!@A!DB%!E#$@P%#E!@D!%?#!O@HI(#T!!3DJF!'CA#!JBCE!$(BEIP%@BD!ID@%A!?CU#!'##D!@JJIA%(C%#E!O(B&!%?#!4CD%CCD!.D#(H@C!E@A%(@P%!?#C%@DH!D#%SB(QT!!!"BI(P#m!`@DD@A?!.D#(HF!)*+[R!-#J#D!S#'A@%#R!9GF(F!CDCJFA@A!
PLP* !8%%54)*#%"W8;)&"4*;3#3;&)$*&4*N597&4[&*]@A%(@P%! ?#C%! $(BEIP%@BD! @D! %?#! -#JA@DQ@! D#%SB(Q! @A! $(@&C(@JF! 'CA#E! BD! PBCJc! CDE! HCAcOI#JJ#E!PBH#D#(C%@BD!K7-9N!CDE!AI$$B(%#E!'F!C!OJ##%!BO!A&CJJ#(!?#C%cBDJF!$(BEIP%@BD!ID@%AT!6?#!AFA%#&!@A!OBIDE#E!BD!%SB!PBCJ!7-9!$JCD%A!JBPC%#E!@D!"CJ&@ACC(@!CDE!-CDCACC(@!CDE!%SB!HCA!7-9!$JCD%A!@D!4IBACC(@R!C&BID%@DH!%B!C!%B%CJ!E@A%(@P%!?#C%@DH!PC$CP@%F!BO!+!\\*!=WT!6?#A#!7-9!$JCD%A!C(#!B$#(C%#E!CA! 'CA#! JBCE! ID@%A! %B! PBU#(! %?#!&CnB(@%F! BO! %?#! CDDICJ! ?#C%! E#&CDE! @D! %?#!-#JA@DQ@! D#%SB(QT! 0D!CEE@%@BDR!%?#!]-!AFA%#&!@DPJIE#A!C!D#S!$#JJ#%!'B@J#(!@D!"CJ&@ACC(@R!?#C%!$I&$!@DA%CJJC%@BDA!@D!2C%(@!4CJCR!CDE!UC(@BIA!PBCJcR!HCAcR!CDE!B@JcOI#JJ#E!?#C%!'B@J#(A!I%@J@A#E!OB(!$#CQ!JBCE!AI$$JF!CDE!CA!'CPQcI$!PC$CP@%FT!-#C%cBDJF!$(BEIP%@BD!ID@%A!C&BID%!%B!)!\**!=W!BO!%B%CJ!E@A%(@P%!?#C%@DH!PC$CP@%FT!
6?#!$(BEIP%@BD!OJ##%!@A!A$(#CE!%?(BIH?BI%!%?#!-#JA@DQ@!(#H@BDR!S@%?!C!OBPIA!BD!%?#!P#D%(CJ!P@%F!C(#C!CDE!%?#!4IBACC(@!$JCD%!K`@HI(#!+[NT!9#CQ!JBCE!'B@J#(A!C(#!JBPC%#E!S@%?@D!C!OI(%?#(!(CE@IA!BO!%?#!P@%F!P#D%(#R! CA! %?#F! C(#! BO%#D! (#VI@(#E! %B! PB&$#DAC%#! OB(! %?#! %#&$#(C%I(#! JBAA#A! @D! AI$$JF! SC%#(!E@A%(@'I%#E!O(B&!%?#!&C@D!?#C%@DH!ABI(P#A!@D!P@%F!P#D%(#T!
Figure 17 Total heat production capacity and heat exchanger capacity in the capital region of Finland.
Source: Pöyry analysis, based on Finnish Energy (2018) and Helen website
Helsinki Energy Challenge20

son. The temperature level of the network is primarily defined by the requirements and dimensioning of customer heating systems. Building stock in Helsinki can be character-ised as rather old where heating systems require high supply temperatures. Conse-quently, heating systems in new buildings are dimensioned to the prevailing network temperature levels. High supply temperature is also required due to heat losses in the large network where heat is distributed long dis-tances. According to Helen, the company has been able to lower the network mean tem-peratures and is looking into further possibili-ties for achieving lower temperature levels.4
Heat demand is greater in the densely populated city centre area than the eastern part of the network. Currently a large district heat tunnel is used to deliver heat from the Vuosaari B plant to the main network.
4 Helen website, available in Finnish: https://www.helen.fi/yritys/vastuullisuus/ajankohtaista/blogi/2018/lampomarkkinat
Helsinki is located in the capital area of Finland with Espoo and Vantaa as its neigh-bouring cities (see Figure 17). Both Espoo and Vantaa have their own district heating networks with total heat production capaci-ties of 1,500 MW and 1,000 MW, respectively. The district heating system in Espoo is operated by Fortum, and the Vantaa district heating system by Vantaan Energia. The district heat production capacity of Vantaa includes also a waste-to-energy plant, which utilises mixed waste from Helsinki region and the Uusimaa province as a fuel for heat and electricity production.
These heat networks are connected to the Helsinki district heat network through heat exchanger stations. The heat exchanger station between Helsinki and Espoo is locat-ed in Northwest Helsinki, and has a capacity of 120 MW. The heat exchanger stations
HELSINKI INNOVATION CHALLENGE
September 2019
21
PÖYRY MANAGEMENT CONSULTING
Figure 18 – Heat production units and capacities in Helsinki DH network
Data source: Finnish Energy 2018, Helen website, Pöyry analysis
730
190
600
915
1005
90100
0
500
1000
1500
2000
2500
Cogeneration Heat only
Coal Natural gasFuel oil PelletHeat pumps
MW heat
Figure 18 Heat production units and capacities in Helsinki DH network.
Source: Pöyry analysis, based on Finnish Energy (2018) and Helen website
Helsinki Energy Challenge21

between Helsinki and Vantaa are located in Northwest and Northeast Helsinki, and have capacities of 50 MW and 80 MW, respectively.
The heat exchangers enable utilising heat production from another network as an additional heat source in the Helsinki district heating network, and selling excess heat to other networks.
3.3 Current production capacity in HelsinkiDistrict heat production in the Helsinki net-work is primarily based on coal- and gas-fu-elled cogeneration (CHP) and supported by a fleet of smaller heat-only production units. The system is founded on two coal CHP plants located in Salmisaari and Hana-
saari and two gas CHP plants in Vuosaari, amounting to a total district heating capacity of 1,330 MW. These CHP plants are operat-ed as base load units to cover the majority of the annual heat demand in the Helsinki network. In addition, the DH system includes a new pellet boiler in Salmisaari, heat pump installations in Katri Vala, and various coal-, gas-, and oil-fuelled heat boilers utilised for peak load supply and as back-up capaci-ty. Heat-only production units amount to 2,500 MW of total district heating capacity.
The production fleet is spread throughout the Helsinki region, with a focus on the cen-tral city area and the Vuosaari plant (Fig-ure 18). Peak load boilers are located within a further radius of the city centre, as they are
Source: Pöyry analysis, based on Finnish Energy (2018) and Helen website
Table 3 Summary of heat production units in Helsinki network.
Unit Unit type Main fuelCommissioning
yearHeat capacity
(MW)
CHP units Salmisaari B CHP Coal 1984 300Hanasaari B CHP Coal 1974 430Vuosaari A CHP – CCGT Natural gas 1991 170Vuosaari B CHP – CCGT Natural gas 1998 430
Heat boilers Salmisaari HOB Pellet 2018 90Salmisaari HOB Coal 1986 190Hanasaari HOB Heavy fuel oil 2009 280Vuosaari HOB Natural gas 1989 120Alppila HOB Light fuel oil 1964 165Munkkisaari HOB Heavy fuel oil 1969 235Ruskeasuo HOB Heavy fuel oil 1972 280Lassila HOB Natural gas 1977 325Patola HOB Natural gas 1982 230Jakomäki HOB Heavy fuel oil 1968 45Myllypuro HOB Natural gas 1978 240Katri Vala Heat pump - 2006 100
Total heat capacity 3,630
Helsinki Energy Challenge22

HELSINKI INNOVATION CHALLENGE
September 2019
23
PÖYRY MANAGEMENT CONSULTING
Figure 19 – Heat production capacities and monthly peak loads in Helsinki
Source: Pöyry analysis, Energy Finland 2018, Helen website
3.3.1.1 CHP plants and heat-only boilers in Helsinki
Hanasaari The Hanasaari site is located on the city centre coast and comprises the Hanasaari B CHP plant and a separate heat centre used for peak capacity. Hanasaari B is a back-pressure CHP plant that consists of two identical units, each having their own boilers and turbines. The plant was commissioned in 1974 and has 430 MW of heat capacity and 220 MW of power capacity in total. The plant uses coal as its main fuel, into which small shares of biomass pellets are blended. Helen has taken the decision to shut down the plant by 202411. Currently, the plant is operated year-round with the exception of a maintenance break during the summer season12. The heat centre in the Hanasaari site includes 6 fuel oil boilers which constitute a total district heating capacity of 280 MW13.
Salmisaari Salmisaari is located on the coastline of Helsinki city centre, and the main production asset of the site is the Salmisaari B CHP plant. Salmisaari B is a back-pressure CHP plant with 300 MW of district heating capacity and 160 MW of power production capacity. It uses coal and a small share of biomass pellets as fuel sources. The unit was commissioned in 1984 and has approximately 10 years of its technical lifetime left14.
11 Helen website. Available at: https://www.helen.fi/yritys/energia/energiantuotanto/voimalaitokset/hanasaari/ 12 Pöyry analysis – based on data available from Finnish Energy (Kaukolämpötilasto 2017) 13 Helen website. Available at: https://www.helen.fi/globalassets/helen-oy/tietoa-yrityksesta/energiantuotanto/turvallisuustiedote_hanasaari_.pdf 14 Pöyry 2018, Kivihiilen kieltotyö. Available at https://tem.fi/documents/1410877/2132296/Selvitys_++Kivihiilen+kielt%C3%A4misen+vaikutukset/8fb510b4-cfa3-4d9f-a787-0a8a4ba23b5f/Selvitys_++Kivihiilen+kielt%C3%A4misen+vaikutukset.pdf
Salmisaari CHP 300 MW
Hanasaari CHP 430 MW
Vuosaari CHP-CCGT 170 MW
Vuosaari CHP-CCGT 430 MWSalmisaari HOB 90 MW
Katri Vala heat pump 100 MW
Peak boilers 2285 MW
0
500
1000
1500
2000
2500
3000
3500
4000
Jan Feb Mar Apr May Jun Jul Aug Sep Oct Nov Dec Helen capacity
MW
Peak (oil and gas)
Heat pumpPelletNatural gas
Coal
Figure 19 Heat production capacities and monthly peak loads in Helsinki.
often required to compensate for the tem-perature losses in supply water distributed from the main heating sources in city centre.
A summary of the Helsinki DH network heat production units is presented in Table 3.
The total production system capacity of the Helsinki production fleet in comparison to monthly peak heat demand is presented in Figure 19. Coal-fired units Salmisaari B, Hanasaari A, and gas-fired units Vuosaari A and B cover most of the heat demand during the winter season. It is evident that the phas-ing out of coal-fired capacity in Hanasaari B and Salmisaari B units leaves a significant gap in heat production capacity that needs to be replaced.
CHP plants and heat-only boilers in HelsinkiHanasaari. The Hanasaari site is located on the city centre coast and comprises the Hanasaari B CHP plant and a separate heat centre used for peak capacity. Hanasaari B is a back-pressure CHP plant that consists
5 Helen website. Available at: https://www.helen.fi/en/company/energy/energy-production/power-plants/hanasaari-power-plant
6 Helen website. Available in Finnish at: https://www.helen.fi/globalassets/helen-oy/tietoa-yrityksesta/energiantuotan-to/turvallisuustiedote-hanasaari.pdf
of two identical units, each having their own boilers and turbines. The plant was com-missioned in 1974 and has 430 MW of heat capacity and 220 MW of power capacity in total. The plant uses coal as its main fuel, into which small shares of biomass pellets are blended. Helen has taken the decision to shut down the plant by 20245. Currently, the plant is operated year-round with the exception of a maintenance break during the summer season. The heat centre in the Hana-saari site includes 6 fuel oil boilers which constitute a total district heating capacity of 280 MW6.
Salmisaari. Salmisaari is located on the coastline of Helsinki city centre, and the main production asset of the site is the Salmisaari B CHP plant. Salmisaari B is a back-pressure CHP plant with 300 MW of district heating capacity and 160 MW of power production capacity. It uses coal and a small share of biomass pellets as fuel sources. The unit was
Source: Pöyry analysis, based on Finnish Energy (2018) and Helen website
Helsinki Energy Challenge23

commissioned in 1984 and has approximately 10 years of its technical lifetime left7.
According to company management inter-views8, Helen has made considerable invest-ments in recent years in the modernisation of the plant in order to prolong its technical lifetime. Thus the plant would most probably have techno-economical lifetime remaining when the ban of coal use in energy produc-tion comes into effect in Finland in May 2029. The current boiler has a technical limit of a maximum share of 5–10% of pellet mixed with coal, and would require considerable investments to convert the plant to utilise other fuel sources8.
The Salmisaari CHP unit is currently oper-ated almost throughout the year. During the summer season when district heat demand is low, the excess heat produced in the plant is utilised in the production of district cooling via an absorption cooling unit instead of di-recting this heat to sea water8. This produc-tion process is also known as trigeneration, where heat generated in CHP production is used to generate district cooling.
The Salmisaari site also includes a 190 MW coal boiler (Salmisaari A, commissioned in 1986), and a new 90 MW pellet boiler (com-missioned in 2018). Salmisaari A has seen low utilisation in the recent years due to the high cost of utilising coal in heat only produc-tion. Furthermore, the boiler will be reaching the end of its technical lifetime in the late 2020’s. The new pellet boiler started opera-tion in 2018 and is primarily used to replace the use of oil and gas in peak load demand.
Vuosaari. The Vuosaari production site is located 15 km northeast of the Helsinki city centre and includes two gas-fired CHP plants, Vuosaari A and B, as well as one heat-only plant for back-up and peak load capacity.
7 Pöyry (2018). Kivihiilen kieltotyö. Available in Finnish at:https://tem.fi/documents/1410877/2132296/Selvi-tys_++Kivihiilen+kielt%C3%A4misen+vaikutukset/8fb510b4-cfa3-4d9f-a787-0a8a4ba23b5f/Selvitys_++Kivi-hiilen+kielt%C3%A4misen+vaikutukset.pdf
8 Helen website. Available in Finnish at: https://www.helen.fi/globalassets/helen-oy/tietoa-yrityksesta/energiantuotan-to/salmisaari_turvallisuustiedote_2017.pdf
9 Pöyry analysis, based on operational data from Finnish Energy (2018)
Vuosaari A started operation in 1991 and has 170 MW of heating capacity and 150 MW of power production capacity. Vuosaari B was commissioned in 1998 and is considerably larger than the A-unit, having 430 MW of heat and 450 MW of power capacity.
Both units are CCGT (combined cycle gas turbine) plants and each comprises two gas turbine units which feed steam though one steam turbine. The main fuel of both plants is natural gas. The units are equipped with auxiliary cooling, meaning that the units can maintain electricity production, even at instances of lower DH demand, by using sea water to cool the steam. However, the units are primarily operated in combined heat and power production. The site also includes a heat-only plant, comprising three 40 MW boilers that use natural gas as main fuel source. This back-up plant was commis-sioned in 1989.
The merit order, i.e. the order in which the plants are operated when not all capacity is needed, is based on market conditions. In recent years the Vuosaari CHP units have often been positioned after the Salmisaari and Hanasaari coal CHP units in the merit order due to market conditions i.e. fuel and electricity wholesale prices as well as fuel taxation and CO2 prices9.
The CCGT units have higher power-to-heat ratios and therefore produce more electric-ity per one unit of heat produced compared to Salmisaari and Hanasaari coal CHP plants. Thus as the electricity market prices have been relatively low in the recent years, the Vuosaari units have been used to mainly complement Hanasaari and Salmisaari when their capacity does not cover the entire heat demand or when electricity prices are high enough.
Helsinki Energy Challenge24

Characteristic to CCGT technology is that the units have fast ramp-up times and such plants are more flexible to operate compared to coal CHP units. Flexibility in this context refers to the ability to operate the units at varying output levels. The ramp-up time for Vuosaari A when cold started is approximately 6.5 hours10.
Other heat boiler sites. In addition to the key sites, the Helsinki district heating network includes heating plants in Alppila, Jakomäki, Lassila, Myllypuro, Munkkisaari, Patola, and Ruskeasuo. These sites are peak load and back-up boilers used in extreme weather conditions, during maintenance of base load units, and function as back-up capacity in case of malfunctions. These boilers use fuel oil and natural gas as main fuel sources.
Heat storage capacityHeat accumulators in district heating net-works are typically large storage tanks for hot water, which are charged when there is excess supply compared to demand and similarly dispatched when the heat produc-
10 Nurmi, K. (2014). Flexible operation of CCGT plant in cogeneration. Available in Finnish at:http://urn.fi/URN:NBN:fi:aalto-201412233301
tion capacity that is online does not cover the entire demand. Therefore heat accumulators provide flexibility to the district heating sys-tem and allow more economical and environ-mentally-friendly district heating production, as storage units are typically dispatched to avoid the start-up of peak load boilers.
There are currently two heat accumula-tors installed in the Helsinki district heating system, which are located at the Salmisaari and Vuosaari production sites. The two accu-mulators are approximately of the same size and have a combined storage capacity of ca. 2,250 MWh of heat, and each have 100 MW of heat dispatch capacity.
In addition to existing storage capacity, Helen has ongoing projects for two addition-al heat storage units to be placed in Mustik-kamaa and Kruunuvuorenranta. A summary of existing and planned heat storage capacity in Helsinki DH network is outlined in Table 4.
Current utilisation of waste and surplus heat sourcesWaste and surplus heat is utilised in the Helsinki district heating system via heat
Source: Helen website. Available in Finnish at:https://www.helen.fi/yritys/vastuullisuus/ajankohtaista/blogi/2019/postkivihiili
Table 4 Existing and planned heat storage capacity in Helsinki DH network.
Storage unit
Storage volume
(m3)
Storage capacity
(MWh)
Dispatch capacity
(MW)
Charging temperature
(°C)Commissioning
yearVuosaari 25,000 1,250 100 90 1998Salmisaari 20,000 1,000 100 90 1987Mustikkamaa 320,000 11,600 120 90 2021Kruunuvuorenranta 300,000 4,500 1,5 18 n. a.
Helsinki Energy Challenge25

pumps and leveraging the combined heating and cooling network infrastructure. Currently approximately 10% of all DH supply in Helsin-ki network is based on waste heat utilisation. Sources of waste heat include excess heat from buildings, businesses such as data centres, and sewage water; this waste heat is then re-used in the production of district heating.
The most notable sites for waste heat utilisation are Katri Vala heat pump station and Esplanadi cooling plant.
Katri Vala heat pump station. Katri Vala heating and cooling plant was commissioned in 2006 and is the world’s largest heat pump station with 100 MW of heating and 60 MW of cooling capacity11. The plant is located under the Katri Vala park in Sörnäinen, which is adjacent to the Hanasaari power plant site.
Katri Vala plant utilises heat recovered from the return water from the district cool-ing network and wastewater. As the district cooling water returns to the heat pump station, it recovers the heat acquired from cooling customers and transfers it to the district heating network by using the plant’s heat pumps. This combined with the waste heat from sewage water is used for district heating.
Currently the plant is used for base load but it potentially also adds flexibility to the Helsinki district heating system. The plant currently comprises 5 heat pumps which can be operated independently. During the coldest ambient temperatures, the district heating produced in Katri Vala is primed with heat from Hanasaari site to reach the required supply temperature of 115°C.12
11 Helen website. Available at: https://www.helen.fi/en/company/energy/energy-production/power-plants/katri-vala-heating-and-cooling-plant
12 Valor Partners (2016). Large Heat Pumps in District Heating Systems. Available in Finnish at: https://energia.fi/files/993/Suuret_lampopumput_kaukolampojarjestelmassa_Loppuraportti_290816_paivitetty.pdf
13 Helen website. Available at: https://www.helen.fi/en/news/2018/underground-heating-and-cooling-plant-utilises-waste-heat
Esplanadi cooling plant. The Esplanadi cool-ing plant has two heat pumps that produce both heating and cooling. The plant is located 50 meters below the Esplanadi Park in the centre of Helsinki. The plant also includes 25,000 m3 cold water storage. Esplanadi station uses heat pumps to recover heat from district cooling return water and has 20 MW of heating capacity, and a total of 50 MW of cooling capacity when including the discharge capacity of cold storage. The heat pumps started operation in 201813.
Open district heating. Helen has recently launched a new pricing model for purchas-ing waste and surplus heat from its district heating customers. This model is based on a voluntary agreement, where Helen commits to purchasing all excess heat but does not obligate the customer to sell. The producer is compensated for the supplied heat by a seasonal tariff structure, which is based on Helen’s production costs and total demand for district heating, thus valuing excess heat during heating season over the cooling season.
Helsinki Energy Challenge26
Heat generation in Helsinki with current production unitsHeat generation is mostly based on cogene-ration in Salmisaari, Hanasaari, and Vuosaari. The share of CHP generation was 85% of all heat production in 2018 (Figure 20). The Hanasaari and Salmisaari coal CHP units are operated the most. Heat pumps accounted for approximately 580 GWh of heat gener-ation and heat procurement from adjacent district heating networks (Espoo and/or Van-taa) accounted for 40 GWh. The remainder of the heat was produced with heat-only boilers.
Coal and natural gas are the main fuels of the CHP units and therefore compose the majority of the total fuel consumption. In 2017 the Helsinki district heating system fuel usage comprised: coal approximately 7,500 GWh (60%), natural gas 4,500 GWh (36%), and pellet, fuel oil, and electricity 550 GWh (4%).
The Katri Vala heat pump plant produced approximately 8% of all district heating in Helsinki and 70–75% of district cooling in 2017. According to Helen14, Katri Vala station can produce the majority of the heat demand of the city centre during the summer season, when the district cooling demand is the highest. During the period of peak cooling
14 Helen website. Available at: https://www.helen.fi/en/news/2018/newheatpump
15 Yle. Available in Finnish at: https://yle.fi/uutiset/3-9843548
demand, about 50% of Helsinki district heat demand is produced with heat pumps. However, during cold winter weather this share is 5%, which is mostly recovered from wastewater15.
Current investment plans to replace coal in HelsinkiHelen plans on implementing the coal phase-out in two stages, where the first stage in-volves the closure of the Hanasaari coal CHP by 2024, followed by the second stage where the Salmisaari coal CHP unit is shut down or converted to other fuels by 2029. Helen has been evaluating options for replacement and it is likely that the replacement solution will be a combination of different technologies and heat sources.
Helen’s current plan for the first stage of replacements consists of a new biomass heat-only boiler (HOB) plant investment, increasing waste heat recovery and heat pump capacity, geothermal heat, locality-lev-el heating solutions, as well as increased heat procurement from the adjacent district heating networks in Espoo and Vantaa. In addition, the Mustikkamaa heat storage unit adds flexibility to the system. A summary of Helen’s replacement plan for Hanasaari coal
Figure 20 District heat production by unit type and energy source in Helsinki, 2018.
5 950
580 63040
0
1 000
2 000
3 000
4 000
5 000
6 000
7 000
CHP Heat pumps Heat boilers Purchased heat
GWh
DH production by unit type
53 %35 %
8 %
3 % 1 %DH production by energy source
CoalNatural gasHeat pumpsBio fuels
Fuel oil
Source: Finnish Energy (2019), Helen website
Helsinki Energy Challenge27
CHP is presented in Figure 21, presenting the estimated capacity impact of each solution.
Heat production plants in Helen’s indicative investment plan. Helen is preparing for future production unit investments with area reservations. According to the current plans, the most likely locations for potential future production assets are in Vuosaari, Tattarisuo, and Patola. Biomass (or pellet) HOBs have been in the discussion as a potential pro-duction technology but the final investment decision is ultimately based on selecting most technologically and economically suit-able alternative for the sites at the time of the decision.16
Helen has proceeded with initial invest-ment plan by announcing the construction of a new biomass HOB in the premises of the current Vuosaari power plant. Vuosaari
16 Helen website. Available at: https://www.helen.fi/en/news/2018/bioenergy-heating-plants
17 Helen website. Available in Finnish at: https://www.helen.fi/yritys/energia/kehityshankkeet/biolampolaitokset/vuosaari
18 Helen website. Available at: https://www.helen.fi/en/news/2018/patola
19 Helen website. Available at: https://www.helen.fi/en/news/2018/environmental-impact-assessment-of-the-tattarisuo-bioenergy-heating-plant
biomass HOB will have 260 MW of district heating capacity and is planned to become operational during the 2022–2023 heating season. Construction works are set to begin in spring 2020.17
Helen has been preparing also an invest-ment at the Patola site next to the existing heat plant. According to the current indicative plan, the production unit would be a new pellet boiler with a fuel capacity of 120 MW equipped with a flue gas condenser. No investment de-cision has been made, but the plant has been granted environmental permits.18
An investment at Tattarisuo site with a production capacity of 130 MW boiler has also been planned. According to the current indicative plan, the production unit would be a biomass boiler or a co-firing biomass and waste plant. The zoning process of the plant has not yet started.19
Figure 21 Helen’s indicative plan to replace Hanasaari B by 2024 in capacity terms.
Source: Pöyry analysis, based on Helen website
60 13
120 1,5 1020 20
260 505
430
0
100
200
300
400
500
600
Waste heatrecovery
Vuosaariheat pump
Mustikka-maa energy
storage
Kruunu-vuorenranta
energystorage
Regionalrenewable
energy
Geothermalheat pump
Heatprocurement
VuosaariBio HOB
Total Hanasaari B
MW
Helsinki Energy Challenge28
Heat pumps in Helen’s indicative investment plan. In addition to new thermal plant capac-ity, Helen is planning on increasing its waste water heat recovery capacity by 40–60 MW in the next few years. The Katri Vala heat cen-tre will be expanded with a sixth heat pump and the new unit will recover heat that has already been utilised once in the heat recov-ery process of waste water, thus improving the recovery efficiency of the process. This also enables the heat centre to operate more during winter as it relies less on heat recovery from the cooling network, which has a strong seasonal demand profile. The Katri Vala expansion adds 20 MW of heating capacity and should start operation in 2021. Helen is also planning on another 20–40 MW of new heat pump capacity that should be online in 2022.20 21
A heat pump investment at the Vuosaari production site is also under planning. The heat pump would utilise excess heat from the plant cooling processes and is planned to produce heat at 13 MW capacity. The heat pump would also utilise heat from the sea water, thus adding the operational span of the unit to the full year. Construction of the heat pump is expected to start in 2020 and the unit would be in production use in 2022.22
The reasonable minimum heat source temperature for sea water heat pumps is between 2–3°C. Due to the gently sloping seabed in the Gulf of Finland, the availability of sufficiently warm sea water during winter months is challenging. To secure availability and heat production throughout the year, a tunnel with length of up to 12–20 km could be required to supply sea water for the heat pump.23
20 Helen website. Available at: https://www.helen.fi/en/news/2018/newheatpump
21 Yle. Available in Finnish at: https://yle.fi/uutiset/3-10766814
22 Helen website. Available at: https://www.helen.fi/en/news/2019/heat-pump-sea-water-heat-vuosaari
23 Helen website. Available in Finnish at: https://www.helen.fi/yritys/vastuullisuus/ajankohtaista/blogi/2019/merivesilampopumput
24 Helen website. Available at: https://www.helen.fi/en/news/2018/gigantic-cavern-heat-storage-facility-to-be-implemented-in-mustikkamaa
25 Helen website. Available in Finnish at: https://www.helen.fi/yritys/vastuullisuus/ajankohtaista/blogi/2019/postkivihiili
Heat storage units in Helen’s indicative investment plan. The storage facilities add flexibility to the district heating system and are primarily discharged during peak de-mand. Construction of the Mustikkamaa heat storage began in early 2019 and is expected to be in use in 2021. The Mustikkamaa heat storage is to be built in old underground fuel oil caverns and the facility will be filled with hot water and connected to the district heating network via heat exchangers. The heat storage will be Finland’s largest, with some 12,000 MWh of heat storage capacity and a dispatch capacity of 120 MW.24
Seasonal heat storage is also planned for rock caverns located beneath Kruunuvuori, where warm surface sea water is collected during summer and used as a heat source for heat pumps during summer. Although the storage capacity in terms of volume and heat is rather large, the total dispatch capacity of the configuration is only 1.5 MW.25
Helsinki Energy Challenge29
4 Cost of district heat production
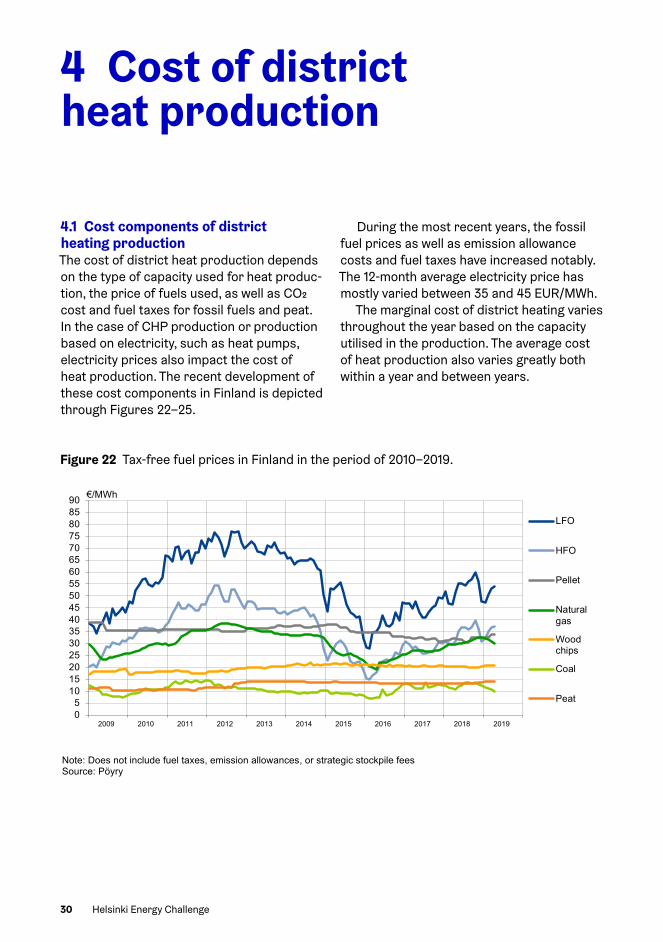
4.1 Cost components of district heating productionThe cost of district heat production depends on the type of capacity used for heat produc-tion, the price of fuels used, as well as CO2 cost and fuel taxes for fossil fuels and peat. In the case of CHP production or production based on electricity, such as heat pumps, electricity prices also impact the cost of heat production. The recent development of these cost components in Finland is depicted through Figures 22–25.
During the most recent years, the fossil fuel prices as well as emission allowance costs and fuel taxes have increased notably. The 12-month average electricity price has mostly varied between 35 and 45 EUR/MWh.
The marginal cost of district heating varies throughout the year based on the capacity utilised in the production. The average cost of heat production also varies greatly both within a year and between years.
HELSINKI INNOVATION CHALLENGE
September 2019
30
PÖYRY MANAGEMENT CONSULTING
4. COST OF DISTRICT HEAT PRODUCTION AND OTHER HEATING METHODS
4.1 Cost components of district heating production The cost of district heat production depends on the type of capacity used for heat production, the price of fuels used, as well as CO2 cost and fuel taxes for fossil fuels and peat. In the case of CHP production or production based on electricity, such as heat pumps, electricity prices also impact the cost of heat production. The recent development of these costs is depicted through Figure 22–Figure 25.
During the most recent years, the fossil fuel prices as well as emission allowance costs and fuel taxes have increased notably in Finland. The 12-month average electricity price has mostly varied between 35 and 45 EUR/MWh.
Figure 22 – Tax-free fuel prices in Finland in the period of 2010–2019
Note: Does not include fuel taxes, emission allowances, or strategic stockpile fees Source: Pöyry
05
1015202530354045505560657075808590
2009 2010 2011 2012 2013 2014 2015 2016 2017 2018 2019
€/MWh
LFO
HFO
Pellet
Naturalgas
Woodchips
Coal
Peat
Figure 22 Tax-free fuel prices in Finland in the period of 2010–2019.
Helsinki Energy Challenge30

HELSINKI INNOVATION CHALLENGE
September 2019
31
PÖYRY MANAGEMENT CONSULTING
Figure 23 – Weekly average electricity SPOT price in Finland in the period of 2009–2019
Source: Nordpool
Figure 24 – Weekly average emission allowance price in the period of 2009–2019
Source: Nordpool
0
20
40
60
80
100
120
140
160
18010 20 30 40 50 10 20 30 40 50 10 20 30 40 50 10 20 30 40 50 10 20 30 40 50 10 20 30 40 50 10 20 30 40 50 10 20 30 40 50 10 20 30 40 50 10 20 30 40 50 10
2009 2010 2011 2012 2013 2014 2015 2016 2017 2018 2019
Weekly average electricity SPOTprices
Spot-12kk liukuva keskiarvo
0
5
10
15
20
25
30
35
40
10 20 30 40 50 10 20 30 40 50 10 20 30 40 50 10 20 30 40 50 10 20 30 40 50 10 20 30 40 50 10 20 30 40 50 10 20 30 40 50 10 20 30 40 50 10 20 30 40 50 10 20 30 40 50
2009 2010 2011 2012 2013 2014 2015 2016 2017 2018 2019
€/t CO2
EUR/MWh
SPOT 12 months moving average
HELSINKI INNOVATION CHALLENGE
September 2019
31
PÖYRY MANAGEMENT CONSULTING
Figure 23 – Weekly average electricity SPOT price in Finland in the period of 2009–2019
Source: Nordpool
Figure 24 – Weekly average emission allowance price in the period of 2009–2019
Source: Nordpool
0
20
40
60
80
100
120
140
160
180
10 20 30 40 50 10 20 30 40 50 10 20 30 40 50 10 20 30 40 50 10 20 30 40 50 10 20 30 40 50 10 20 30 40 50 10 20 30 40 50 10 20 30 40 50 10 20 30 40 50 10
2009 2010 2011 2012 2013 2014 2015 2016 2017 2018 2019
Weekly average electricity SPOTprices
Spot-12kk liukuva keskiarvo
0
5
10
15
20
25
30
35
40
10 20 30 40 50 10 20 30 40 50 10 20 30 40 50 10 20 30 40 50 10 20 30 40 50 10 20 30 40 50 10 20 30 40 50 10 20 30 40 50 10 20 30 40 50 10 20 30 40 50 10 20 30 40 50
2009 2010 2011 2012 2013 2014 2015 2016 2017 2018 2019
€/t CO2
EUR/MWh
SPOT 12 months moving average
Figure 23 Weekly average electricity SPOT price in Finland in the period of 2009–2019.
Figure 24 Weekly average emission allowance price in the period of 2009–2019.
Helsinki Energy Challenge31

HELSINKI INNOVATION CHALLENGE
September 2019
32
PÖYRY MANAGEMENT CONSULTING
Figure 25 – Fuel taxes in heat production in the period of 2009–2019
Source: Pöyry
The marginal cost of district heating varies throughout the year based on the capacity utilised in the production. The average cost of heat production also varies greatly both within a year and between years.
An indicative assessment of the typical cost levels of different production assets is depicted in Figure 26, presenting estimated levelised costs of energy (LCOE) for selected heat production technologies. It is to be noted that the LCOE is highly sensitive to changes in calculation assumptions, and the actual LCOE of a production unit may vary significantly case-by-case. The marginal cost of the production unit may also vary significantly on throughout the year and on hourly basis based on the electricity spot price, especially in the case of production units either producing (CHP) or utilising (heat pumps and electric boilers) electricity in the heat production process.
0123456789
101112131415161718192021222324252627282930
2009 2010 2011 2012 2013 2014 2015 2016 2017 2018 2019
LFO
Coal
HFO
Naturalgas
Peat
€/MWh (fuel)
Figure 25 Fuel taxes in heat production in the period of 2009–2019.
4.2 Comparison of district heating and some alternative heating methodsDistrict heating has a high market share in heating in the cities, but there are also many alternative heating methods. In locations where it can be utilised the main alternative to district heating especially in new buildings is currently ground source heat pumps (GSHP). Pellets and direct electricity heating can be utilised for building-level heating, as well as oil heating and natural gas heating in locations where the gas distribution network is available. District heat users are free to switch their heating methods from district heat to other heat methods and disconnect from district heating, but this typically re-quires investments in the buildings.
District heat users would typically mainly consider disconnecting from district heating at the time of district heat exchanger renew-als which require some investments. For new buildings, the choice of heating methods is more open. However, in the densely populat-
ed city area, there are limitations, for exam-ple, for ground source heat pumps.
Ground source heat pumps have higher initial investment compared to other heating methods, but those are compensated with lower operational costs. Taking into account both investment and operation costs, the levelised cost of heat produced with ground source heat pumps is typically in the same range as district heat prices. The costs of different heating methods vary a lot from building to building depending on specific heat demand patterns and other specific conditions.
Helsinki Energy Challenge32
5 Regulation impacting the district heating sector
5.1 Regulation of district heating in FinlandThere is no separate district heating act in Finland. The Competition Authority has inter-preted that district heating operators have been in a dominant market position relative to their current district heating customers. The abuse of a dominant market position is prohibited, which sets certain requirements for the district heating operators, concerning their pricing but also their cost elements, such as investments into new capacity.
The requirements are typically related to prohibitive prices and terms, and price discrimination. District heating prices are not regulated, but the dominant market position requires pricing to be on equal terms for all similar customer groups. The Competition Authority can initiate investigations if they suspect an abuse of pricing when consider-ing the dominant market position of district heating by charging unreasonably high prices.26
There is in general no obligation to con-nect to a district heating network. However, in some cases connection has been required locally as municipalities have been imposing district heat connection in the city plans. Hybrid heating solutions are also possible, where heating is produced with the combina-tion of district heating and customers own heating installation such as heat pumps. The district heating customers in Finland have a right to disconnect from district heating without any extra fees.
26 Finnish Competition and Consumer Authority (2017)
27 Ministry of Economy and Employment (2017)
There is no regulation for third party access of heat production to district heating network. If a third party wishes to utilise the heat network to deliver heat to end customer, or sell the heat to the district heat network operator, it needs to negotiate with the heat network operator. Some district heating companies have published terms and pricing structure for purchasing heat from third party producers.
In some cases, investments in renewable heat sources can be supported through in-vestment support. Energy aid can be granted to new small heating plants utilising renew-able energy, when invested by companies, municipalities, and other organisations.27
Helsinki Energy Challenge33
5.2 Energy taxationFossil fuels (coal, natural gas, oil) used in heat production are taxed in Finland based on their energy content and CO2 emission. Fuels used for electricity generation are not taxed in order to avoid double taxation. The level of energy taxation is clearly higher than the minimum tax levels set by the EU.
Finland also uses energy taxation as a way to promote renewable energy and therefore fossil heating fuels are subject to both ener-gy tax and CO2 tax, whereas renewable fuels are generally tax-free.
An overview of the relevant tax compo-nents and fees in Finland are listed in Table 5.
When electricity is used to produce dis-trict heat, the electricity taxes and network fees also impact the production cost. Ac-cording to the government program of Prime Minister Rinne, there is a plan to decrease the electricity tax of heat pumps utilized in district heating systems. Currently the tax level is 22,53 €/MWh28.
5.3 Policy impacting heat demand The Energy Authority is the authority respon-sible for promoting energy efficiency im-provements. The measures include voluntary energy efficiency agreements, energy audits, energy information for consumers, and the ecolabelling and ecodesign of products. A separate state-owned energy information company, Motiva, was established in 1993. It
28 More information on current energy tax levels can be found from Finnish Tax Administra-tion: https://www.vero.fi/en/businesses-and-corporations/about-corporate-taxes/excise_taxes/sahko_ja_eraat_polttoaineet/s%C3%A4hk%C3%B6n-ja-er%C3%A4iden-polttoaineiden-verotaulukot/
29 Ministry of Environment (2017)
offers services to the public administration, businesses, communities, and consumers.
In Finland, energy efficiency has been improved through voluntary agreements since the 1990s. The voluntary approach has been chosen by the government and partici-pating sectors to avoid the need to introduce new legislation to achieve the national energy efficiency targets.
In the building sector, energy efficiency is improved with building codes, which are based on the EU directives. The legislation on building codes was introduced in 2013.29
5.4 Land use and permitting proceduresRelevant permitting procedures required for any new energy production installation de-pend highly on the planned installation type. EU directives outline the permitting frame-work for permitting procedures. In addition, there are several national decrees in Finland that regulate which permit procedure is applicable to different types of installation. Some of the permitting processes are par-ticipatory processes, especially in the case of operations that have environmental and social impacts.
In addition to the permitting process, the land use procedures need to be taken into account when assessing the options for heat production in the Helsinki region. Any installation may only be constructed in an area where the land use is designated for
Helsinki Energy Challenge34
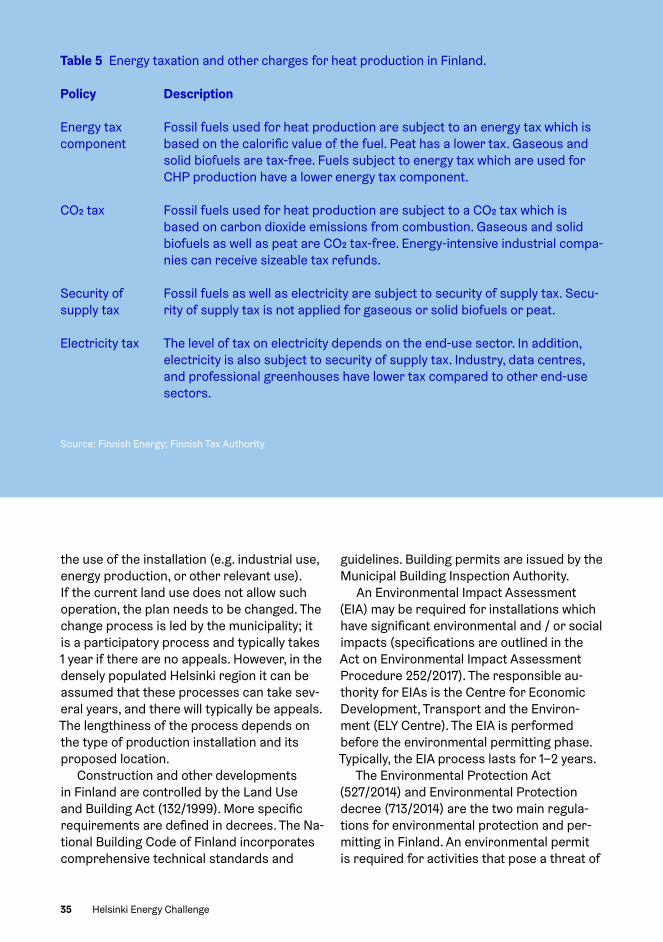
Source: Finnish Energy; Finnish Tax Authority
Table 5 Energy taxation and other charges for heat production in Finland.
Policy Description
Energy tax component
Fossil fuels used for heat production are subject to an energy tax which is based on the calorific value of the fuel. Peat has a lower tax. Gaseous and solid biofuels are tax-free. Fuels subject to energy tax which are used for CHP production have a lower energy tax component.
CO2 tax Fossil fuels used for heat production are subject to a CO2 tax which is based on carbon dioxide emissions from combustion. Gaseous and solid biofuels as well as peat are CO2 tax-free. Energy-intensive industrial compa-nies can receive sizeable tax refunds.
Security of supply tax
Fossil fuels as well as electricity are subject to security of supply tax. Secu-rity of supply tax is not applied for gaseous or solid biofuels or peat.
Electricity tax The level of tax on electricity depends on the end-use sector. In addition, electricity is also subject to security of supply tax. Industry, data centres, and professional greenhouses have lower tax compared to other end-use sectors.
the use of the installation (e.g. industrial use, energy production, or other relevant use). If the current land use does not allow such operation, the plan needs to be changed. The change process is led by the municipality; it is a participatory process and typically takes 1 year if there are no appeals. However, in the densely populated Helsinki region it can be assumed that these processes can take sev-eral years, and there will typically be appeals. The lengthiness of the process depends on the type of production installation and its proposed location.
Construction and other developments in Finland are controlled by the Land Use and Building Act (132/1999). More specific requirements are defined in decrees. The Na-tional Building Code of Finland incorporates comprehensive technical standards and
guidelines. Building permits are issued by the Municipal Building Inspection Authority.
An Environmental Impact Assessment (EIA) may be required for installations which have significant environmental and / or social impacts (specifications are outlined in the Act on Environmental Impact Assessment Procedure 252/2017). The responsible au-thority for EIAs is the Centre for Economic Development, Transport and the Environ-ment (ELY Centre). The EIA is performed before the environmental permitting phase. Typically, the EIA process lasts for 1–2 years.
The Environmental Protection Act (527/2014) and Environmental Protection decree (713/2014) are the two main regula-tions for environmental protection and per-mitting in Finland. An environmental permit is required for activities that pose a threat of
Helsinki Energy Challenge35

environmental pollution. There is a specific list of activities that require an environmen-tal permit or environmental registration. Environmental permit applications are sub-mitted to the Regional State Administrative Agencies (AVI Agency). Typically the permit process from application submittal to permit decision takes about one year. If there are appeals, the process will take longer. Regis-trations are submitted to municipal author-ities and the process is simpler and faster than environmental permitting.
Generally the main conventional permits, such as environmental permit for operating the installation and building permits, are issued for the owner/operator. However, certain permits are often issued directly to the party responsible for performing a specific task, such as concrete batching or underground construction works.
If the installation includes the storage or handling of hazardous chemicals, chemical permitting may be required. Storage and handling of dangerous chemicals is regulat-ed by the Act on the Safety of the Handling of Dangerous Chemicals and Explosives (390/2005) and by the Decree on Monitoring Handling and Storage of Dangerous Chemi-cals (decree 685/2015). National legislation is based on the SEVESO III directive. Re-sponsibilities according to regulation are determined by the extent of operational activity. Operations are divided into two groups, large scale and small scale. Large-scale activities are supervised by the Finnish Safety and Chemicals Agency (Tukes). For minor industrial handling and the storage of dangerous chemicals, an application must be submitted to the municipal rescue authority.
Typically the large-scale permit process lasts 8–12 months.
Operators must notify the municipal envi-ronmental protection committees in writing of measures or events causing temporary noise or vibration, such as construction work if there is a reason to expect that such noise or vibration will be especially disturbing.
Use of water resources requires a permit under the Water Act (587/2011). Such activi-ties include, for example, water abstraction, regulation, hydropower, and water construc-tion such as water intake and discharge structures. If the same activity poses a risk of water pollution, the permit is usually considered together with the environmental permit application and resolved through one decision.
Helsinki Energy Challenge36

6 Further studies and data sources
The following studies contain further background information about different energy sources and their potential in Helsinki.
• Waste heat sources in Helsinki. The report describes the different sources of waste heat, such as swimming halls, hotels, restaurants, hospitals, laundries etc., and their potential in Helsinki area. The study is available in Finnish at: https://www.stadinilmasto.fi/2018/02/15/helsingissa-kartoitettiin-suuria-hukkalampokohteita/
• Nuclear district heating in Finland. The report examines the suitability of small-scale re-actors for district heat production in Finland. The study focuses on small nuclear reactors with thermal capacity between 24 and 900 MW and both heat only and combined heat and power production. The study is available in English at: https://energia.fi/files/3740/Nucle-ar_district_heating_in_Finland_1-2_web.pdf
• Waste to Energy in Finland. The report describes the current state and operating envi-ronment of waste utilisation in energy production and assesses the impacts that potential policy instruments may have on industry. The operating environment is analysed with a focus on existing waste to energy utilities as well as under construction and planning. The report is available in Finnish at: https://energia.fi/files/405/ET_Jatteiden_energiakayt-to_Loppuraportti_161015.pdf
• Seawater temperature in the coast of Helsinki. A study on the temperature levels of sea-water in the coast of Helsinki, taking into account sea water depth variations. The report provides background information for evaluating the use of seawater as a heat source. The study is available in Finnish at: https://www.hel.fi/static/liitteet/kaupunkiymparisto/julkai-sut/julkaisut/julkaisu-25-18.pdf
• Geothermal heat in Helsinki. The report describes the geothermal characteristics and heating potential in Helsinki as well as technical feasibility and permitting practises related to geothermal heating solutions. The report is available in Finnish at: https://www.hel.fi/static/liitteet/kaupunkiymparisto/julkaisut/julkaisut//Maalampotyoryhman_raportti_kes-kustelua-varten.pdf
Open data: Hourly district heating power 2016 https://www.helen.fi/en/company/responsibility/current-topics/open-data
Helsinki Energy Challenge37
• Heat recovery from Kilpilahti industrial site. The manufacturing facilities of Neste Oyj and Borealis Polymers Oy in Kilpilahti produce a significant amount of low-temperature excess heat that could potentially cover one-fourth of district heat demand in Helsinki metro-politan region. Kilpilahti is located some 30 km East from Vuosaari. The study focuses on the techno-economic feasibility of heat recovery and recirculation into district heating systems. The study not published – news in English at: https://www.helen.fi/en/news/2019/kilpilahti
Information about energy sources, Helsinki building stock and other topics can be found in the following data sources:
• Finnish wind atlas. An online tool for estimation of the regional and local wind energy potential in Finland. The database contains average monthly and annual wind speeds (m/s) and estimates for potential power production (MWh) for different turbine types and hub heights. Available at: http://www.tuuliatlas.fi/en/index.html
• Solar energy potential in Helsinki metropolitan area. The online map tool provides estimates on the annular solar energy yields in the rooftops in Helsinki, Espoo and Vantaa areas at a building level granularity. Available at: https://aurinkosahkoakotiin.fi/hsyn-karttapalvelu-kertoo-aurinkosahkon-potentiaalin-katollasi/
• Helsinki region atlas. A database and mapping tool for data related to energy and building stock in Helsinki. Includes data on building construction year, purpose of use, number of stories, heat source as well as feasible locations for solar panels. Available at: http://www.seutuatlas.fi/index.jsp
• Helsinki Energy and Climate Atlas. A 3D information model of Helsinki building stock with information related to energy consumption. The data in also available from Helsinki Region Infoshare. Energy and Climate atlas is available at: https://kartta.hel.fi/3d/atlas/#/
• Heat losses from rooftops in Helsinki. An online map service showing heat losses through the roofs of buildings in Helsinki. The service is based on thermal imaging of heat radiation from Helsinki’s buildings. Available at: https://www.kattohukka.fi/?etusivu
• HSY map service. An online map tool that includes all public spatial data sets of Helsinki Region Environment Services Authority (HSY). HSY is the provider of waste management and water services in the Helsinki metropolitan area. Available at: https://kartta.hsy.fi/
• Helsinki statistics and research. The Urban Research and Statistics Unit at Helsinki City Executive Offices conducts urban research, maintains official statistical and registered data, and produces statistical publications and information services. Available at: https://www.hel.fi/helsinki/en/administration/information/statistics/
Helsinki Energy Challenge38

February 2020
PublisherCity of Helsinki, City Executive Office
Copyright © 2019 Pöyry Management Consulting
This report has been prepared by Pöyry Management Consulting Oy (“Pöyry”) for the City of Helsinki (the “Recipient”), in accor-dance with the Agreement between Pöyry and the Recipient. This report has been prepared based on the instructions by the Recipient and for the specific purpose of pro-viding background information for the Helsin-ki Energy Challenge (the “Purpose”). There is no certainty that the report addresses or re-flects the specific requirements, interests or circumstances of other parties for any other purpose than the Purpose for which this re-port was prepared. Pöyry has prepared this report based on information available to it at the time of its preparation and has no duty to update this report.
Pöyry accepts no responsibility, financially, legally or otherwise, for decisions made or actions taken based on the contents of this report.
Pöyry bases its analyses on publicly available data and information, its own data and data or information provided to us in connection with specific assignments. We always assess whether the quality of these data is sufficient for use in our analyses. We can, however, not guarantee for the quality and accuracy of data that we do not own the rights to. Uncertainty is an element of any analysis. As part of the documentation of the methodical approach used in our individual analyses, we always endeavour to point out and discuss factors of uncertainty.
All rights to this report are reserved and exclusively defined in the Agreement be-tween Pöyry and the Recipient.
Helsinki Energy Challenge39

City of Helsinki City Executive Office
Pohjoisesplanadi 11–1300170 HelsinkiP.O. Box 100099 City of Helsinki, FinlandExchange +358 (0)9 310 1641
energychallenge.hel.fi www.hel.fi