Factors Influencing Implementation Of Non-formal Basic ...
253
FACTORS INFLUENCING IMPLEMENTATION OF NON-FORMAL BASIC EDUCATION CURRICULUM AT THE NON-FORMAL EDUCATION CENTRES IN NAIROBI, MOMBASA AND KISUMU CITIES, KENYA Gathumbi Anthony Mungai A Thesis Submitted to the Department of Educational Administration and Planning in Fulfilment of the Requirements for the Degree of Doctor of Philosophy (PhD) in Curriculum Studies of the University of Nairobi 2013
Transcript of Factors Influencing Implementation Of Non-formal Basic ...

FACTORS INFLUENCING IMPLEMENTATION OF NON-FORMAL BASIC EDUCATION CURRICULUM AT THE NON-FORMAL EDUCATION CENTRES IN NAIROBI, MOMBASA AND KISUMU CITIES, KENYA
Gathumbi Anthony Mungai
A Thesis Submitted to the Department of Educational Administration and
Planning in Fulfilment of the Requirements for the Degree of Doctor of
Philosophy (PhD) in Curriculum Studies of the University of Nairobi
2013
ii
DECLARATION
This thesis is my original work and has not been presented for a degree in any
other university.
____________________________________________
Gathumbi Anthony Mungai
This thesis has been submitted for examination with our approval as University
Supervisors.
________________________________________________
Dr. Grace Nyagah
Senior Lecturer and Chairman
Department of Educational Administration and Planning
University of Nairobi
________________________________________________
Dr. Rose Obae Mosoti
Lecturer
Department of Educational Administration and Planning
University of Nairobi

iii
DEDICATION
This thesis is dedicated to my wife Faith;
and our children Victor, Ian and Perpetua.

iv
ACKNOWLEDGEMENTS
When we set goals for ourselves, there are always obstacles in the way that may
deter us from accomplishing those goals. There are also people in our lives who
are aware of those goals, and encourage us and support us to continue regardless
of the obstacles. It is now that I can formally thank those people for doing just
that for me. First and foremost, I want to sincerely thank my supervisors, Dr.
Grace Nyagah and Dr. Rose Obae. Dr. Grace Nyagah encouraged, supported and
facilitated this study in many aspects, both as my supervisor and as the Chairman
of the department, while Dr. Obae supported, guided and encouraged me
throughout the duration of my work on this thesis.
I would like to thank the four most important people in my life: Faith Wanjiku my
dear wife, Victor Gathumbi, Ian Njuguna and Perpetua Muthu, our wonderful
children. I have set goals for myself because of them. In fact, my life revolves
around them, and many decisions in my professional life were made with them as
a major priority in the decision-making process. My success is theirs. I also wish
to thank the directors, teachers and learners of the Non Formal Education (NFE)
centres in Nairobi, Mombasa and Kisumu cities for providing me with data for
this study. Last but not least I wish to thank everybody who in one way or another
supported me and contributed towards the success of this endeavour.
v
TABLE OF CONTENTS
Content Page
Title Page………………………….……………….......…………………. i
Declaration………………………..……………………...……………….. ii
Dedication………………………….……………………...……………… iii
Acknowledgement…………………….……………………...…………... iv
Table of contents……………………....………………………..………… v
List of tables…………………………....……………………….………… x
List of figures……………………….....…………………………......…… xiii
Abbreviations and acronyms…………………………………………........ xvi
Abstract………………………………………………………………........ xix
CHAPTER ONE
INTRODUCTION
1.1 Background to the study………………………...……….......... 1
1.2 Statement of the problem………………………..……….......... 11
1.3 Purpose of the study……………………………..…….............. 12
1.4 Objectives of the study ……………………………..……........ 12
1.5 Research questions………………………..........…………...…. 13
1.6 Significance of the study………………………......…..……… 14
1.7 Limitations of the study.............................................................. 15
1.8 Delimitations of the study………………….....…….................. 16
1.9 Assumptions of the study………………………...……............. 17
vi
1.10 Definition of terms……………………………...…...……........ 17
1.11 Organisation of the study………………………….………....... 20
CHAPTER TWO
LITERATURE REVIEW
2.1 Introduction……………………………………………............. 22
2.2 Global commitment to education……………………................ 22
2.3 Relevant education for out-of-school children ………….......... 26
2.4 Non-formal education ………………………........................... 28
2.5 Non-formal education in Kenya................................................. 38
2.6 Non-Formal basic education curriculum.................................... 41
2.7 Curriculum implementation........................................................ 43
2.8 Factors influencing curriculum implementation......................... 47
2.8.1 Influence of teacher characteristics on curriculum
implementation........................................................................... 47
2.8.2 Influence of resource on materials on curriculum
implementation........................................................................... 59
2.8.3 Influence of instructional methods on curriculum
implementation........................................................................... 65
2.8.4 Influence of learner characteristics on the curriculum
implementation........................................................................... 69
2.8.5 Influence of the community on curriculum implementation...... 71
2.9 Completion as a indicator of effective curriculum

vii
implementation........................................................................... 73
2.10 Theoretical basis for curriculum implementation....................... 74
2.11 Conceptual framework................................................................ 76
CHAPTER THREE
RESEARCH METHODOLOGY
3.1 Introduction................................................................................. 79
3.2 Research design.......................................................................... 79
3.3 Target population........................................................................ 80
3.4 Sample and sampling techniques................................................ 80
3.5 Research instrumentation............................................................ 82
3.5.1 Questionnaires............................................................................ 82
3.5.1.1 Questionnaire for directors......................................................... 83
3.5.1.2 Questionnaire for teachers.......................................................... 84
3.5.2 Focus group discussion guide for learners.................................. 85
3.5.3 Observation checklist for materials and resources..................... 86
3.5.4 Lesson observation schedule...................................................... 86
3.5.5 Document analysis...................................................................... 87
3.6 Pilot study................................................................................... 87
3.6.1 Validity of the instruments......................................................... 88
3.6.2 Reliability of the instruments...................................................... 89
3.7 Administration of the instruments.............................................. 90
3.8 Data analysis techniques............................................................. 91

viii
CHAPTER FOUR
DATA ANALYSIS AND INTERPRETATION
4.1 Introduction................................................................................. 94
4.2. Response rate.............................................................................. 94
4.3 Demographic data of the respondents......................................... 95
4.3.1 Demographic information on directors of institutions................ 95
4.3.2 Demographic data of teachers at the NFE centres...................... 100
4.4. Influence of teacher characteristics on NFBE curriculum
implementation........................................................................... 106
4.5. Influence of adequacy of resources and materials on the
NFBE curriculum implementation............................................. 129
4.6 Influence of instructional methods on NFBE curriculum
implementation........................................................................... 142
4.7 Influence of learner characteristics on NFBE curriculum
implementation........................................................................... 151
4.8 Influence of community characteristics on NFBE curriculum
implementation........................................................................... 169
4.9 Multiple regression analysis of teacher and directors variables
in relation to completion rates.................................................... 175
4.9.1 Multiple regression analysis for selected teacher variables
against completion rates............................................................. 175
4.9.2 Multiple regression for selected director variables against

ix
completion rates.......................................................................... 180
CHAPTER FIVE
SUMMARY, CONCLUSIONS AND
RECOMMENDATIONS
5.1 Introduction................................................................................. 186
5.2 Summary..................................................................................... 186
5.3 Conclusions................................................................................. 193
5.4 Recommendations....................................................................... 196
5.5 Suggestions for further research................................................. 198
REFERENCES........................................................................................... 199
APPENDICES............................................................................................ 212
Appendix I: Letter of introduction.......................................................... 212
Appendix II Questionnaire for directors................................................. 213
Appendix III: Questionnaire for the teachers at the NFE centres.............. 220
Appendix IV: Focus group discussion guide for learners......................... 227
Appendix V: Observation checklist for materials and resources............. 229
Appendix VI: Lesson observation schedule............................................. 230
Appendix VII: Documents analysis........................................................... 232
Appendix VIII: Letter of authorisation.................................................... 233
Appendix IX: Research permit............................................................... 234

x
LIST OF TABLES
Table Page
Table 1 Gender of the Directors.............................................................. 95
Table 2 Duration of Directors at the Current Centre.............................. 99
Table 3 Distribution of Teachers’ Gender Across the Cities.................. 100
Table 4 Distribution of Teachers by Marital Status ............................... 103
Table 5 Directors’ Responses on Adequacy of Teachers....................... 107
Table 6 Challenges Faced by Directors in Acquiring Trained Teachers 109
Table 7 Reasons for Teacher Turnover .................................................. 112
Table 8 Teachers’ Responses on Providers of the In-Service Training.. 117
Table 9 Teachers’ Use of NFE Curriculum in the NFE Centres ........... 119
Table 10 Teachers’ Attitude Towards NFE Curriculum........................... 125
Table 11 Correlations of Selected Teacher Characteristics against
Completion Rates........................................................................ 127
Table 12 Teachers’ Responses on Availability and Adequacy of
Materials and Resources ............................................................. 130
Table 13 Availability and Appropriateness of Physical Facilities 132
Table 14 Directors’ Responses on Availability of Teaching and
Learning Resources.................................................................... 134
Table 15 Teachers’ Responses on Availability of Teaching and
Learning resources..................................................................... 140
Table 16 Regression analysis of influence of facilities and curriculum
xi
Implementation.......................................................................... 141
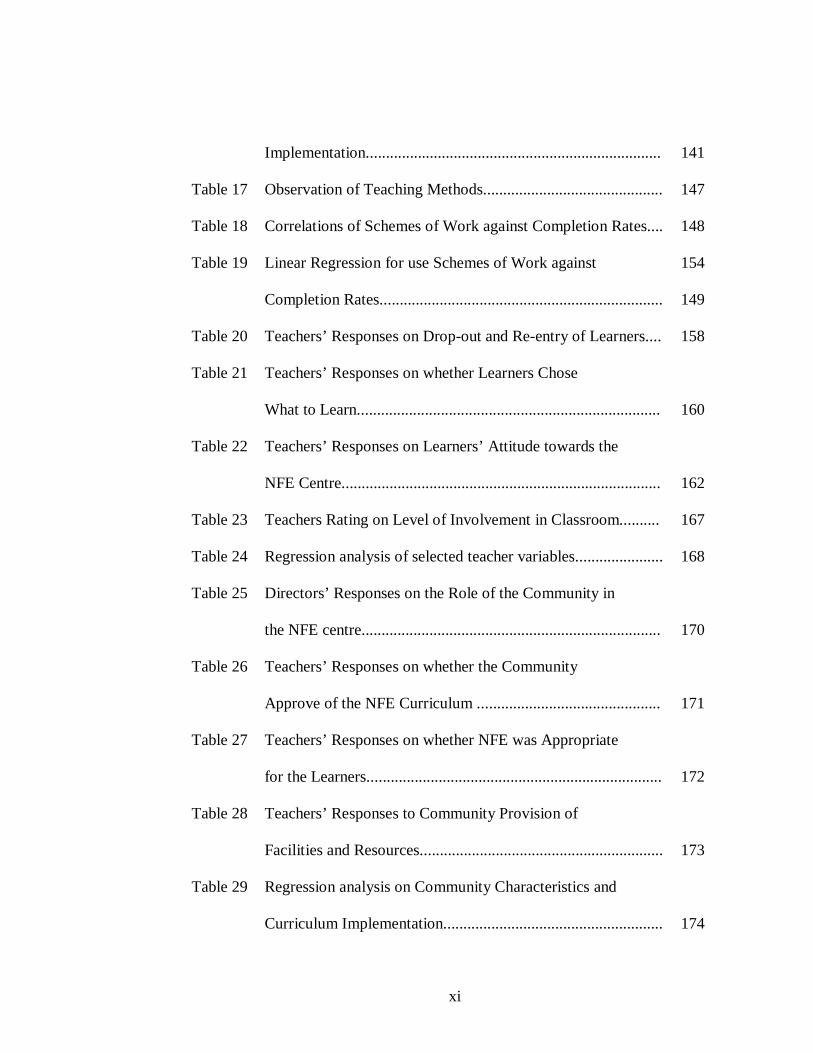
Table 17 Observation of Teaching Methods............................................. 147
Table 18 Correlations of Schemes of Work against Completion Rates.... 148
Table 19 Linear Regression for use Schemes of Work against 154
Completion Rates....................................................................... 149
Table 20 Teachers’ Responses on Drop-out and Re-entry of Learners.... 158
Table 21 Teachers’ Responses on whether Learners Chose
What to Learn............................................................................ 160
Table 22 Teachers’ Responses on Learners’ Attitude towards the
NFE Centre................................................................................ 162
Table 23 Teachers Rating on Level of Involvement in Classroom.......... 167
Table 24 Regression analysis of selected teacher variables...................... 168
Table 25 Directors’ Responses on the Role of the Community in
the NFE centre........................................................................... 170
Table 26 Teachers’ Responses on whether the Community
Approve of the NFE Curriculum .............................................. 171
Table 27 Teachers’ Responses on whether NFE was Appropriate
for the Learners.......................................................................... 172
Table 28 Teachers’ Responses to Community Provision of
Facilities and Resources............................................................. 173
Table 29 Regression analysis on Community Characteristics and
Curriculum Implementation....................................................... 174

xii
Table 30 Correlations for Selected Teacher Variables
Completion Rates....................................................................... 176
Table 31 Model for Multiple Regression for Teacher Selected
Variables.................................................................................... 177
Table 32 Correlations for Selected Directors’ Variables Against
Completion Rates....................................................................... 181
Table 33 Simple Linear Regression for Selected Directors’ Variables
Against Completion Rates......................................................... 182
Table 34 Multiple Regression Summary for Selected Director
Variables.................................................................................... 183
Table 35 Model Coefficients for Selected Director Variables.................. 184

xiii
LIST OF FIGURES
Figure Page
Figure 1 Interrelationship between Variables in the NFE Basic
Education Curriculum Implementation 77
Figure 2 Age Distribution of the Directors............................................. 96
Figure 3 Length of Service in NFE Centres............................................ 97
Figure 4 Distribution of Directors by Level of Education ..................... 98
Figure 5 Teachers’ Distribution by Age ............................................... 101
Figure 6 Distribution of Teachers by Length of Service....................... 102
Figure 7 Distribution of Teachers by Level of Education....................... 104
Figure 8 Distribution of Teachers’ by Duration in the Centres............... 106
Figure 9 Directors’ Responses on Minimum Qualifications Required
for Teachers.............................................................................. 108
Figure 10 Directors’ Responses on Who Paid the Teachers .................... 110
Figure 11 Directors’ Responses on Teacher Turnover Rates.................... 111
Figure 12 Challenges that Teachers Faced in Teaching at NFE............... 113
Figure 13 Teachers’ Professional Qualifications ..................................... 114
Figure 14 Teachers’ Responses on Training Received ............................ 115
Figure 15 Teachers’ Response on NFE In-Service Training received 116
Figure 16 Teachers’ In-Service on Curriculum Use................................. 118
Figure 17 Subjects that Teachers Taught ................................................. 120
Figure 18 Training in the Subjects Taught .............................................. 121

xiv
Figure 19 Teachers’ Responses on Whether They Were Comfortable
Teaching.................................................................................. 122
Figure 20 Teachers’ Responses of Challenges they Faced During
Teaching.................................................................................... 123
Figure 21 Directors’ Responses on Appropriateness of the
Resources and Materials........................................................... 136
Figure 22 Directors’ Responses on Availability of Resources for
Technical Subjects.................................................................... 137
Figure 23 Directors’ Response to Provider of Teaching and Learning
Resources.................................................................................. 138
Figure 24 Teachers’ Responses on Adequacy of Teaching and
Learning Resources................................................................... 139
Figure 25 Number of Lessons Observed .................................................. 142
Figure 26 Lessons Observed..................................................................... 143
Figure 27 Duration of the Lesson.............................................................. 144
Figure 28 Sequence of Lesson.................................................................. 145
Figure 29 Assessment of Learning Outcomes........................................... 146
Figure 30 Regression Standardized Residual for Lesson Observation..... 150
Figure 31 Category of Learners in the Centres......................................... 152
Figure 32 Teachers’ Responses on Learner Characteristics...................... 153
Figure 33 Teachers Rating of Cases of learner Drop Out......................... 156
Figure 34 Teachers’ Responses on Reasons for Learners Dropout.......... 157

xv
Figure 35 Directors’ Responses on Learners’ Exceptions from
Some Subjects........................................................................... 159
Figure 36 Teachers’ Responses on Reasons for Learners Choosing
What to Learn at the Centre...................................................... 161
Figure 37 Teachers’ Responses on Learners’ Willingness to study
at the NFE Centres.................................................................. 163
Figure 38 Teachers’ Responses on Percentage of Absenteeism............... 164
Figure 39 Teachers’ Responses on Reasons for Pupils’ Absenteeism...... 165
Figure 40 Teachers’ Responses on whether Learners Fully Participated
in Class...................................................................................... 166
Figure 41 Regression Standard Residual for Teacher Selected
Teacher Variables..................................................................... 178
Figure 42 Normal PP plot of Regression Standardized Residual for
Teachers Selected Variables..................................................... 179
Figure 43 Scatter plot for Selected Teacher Variables.............................. 180
xvi
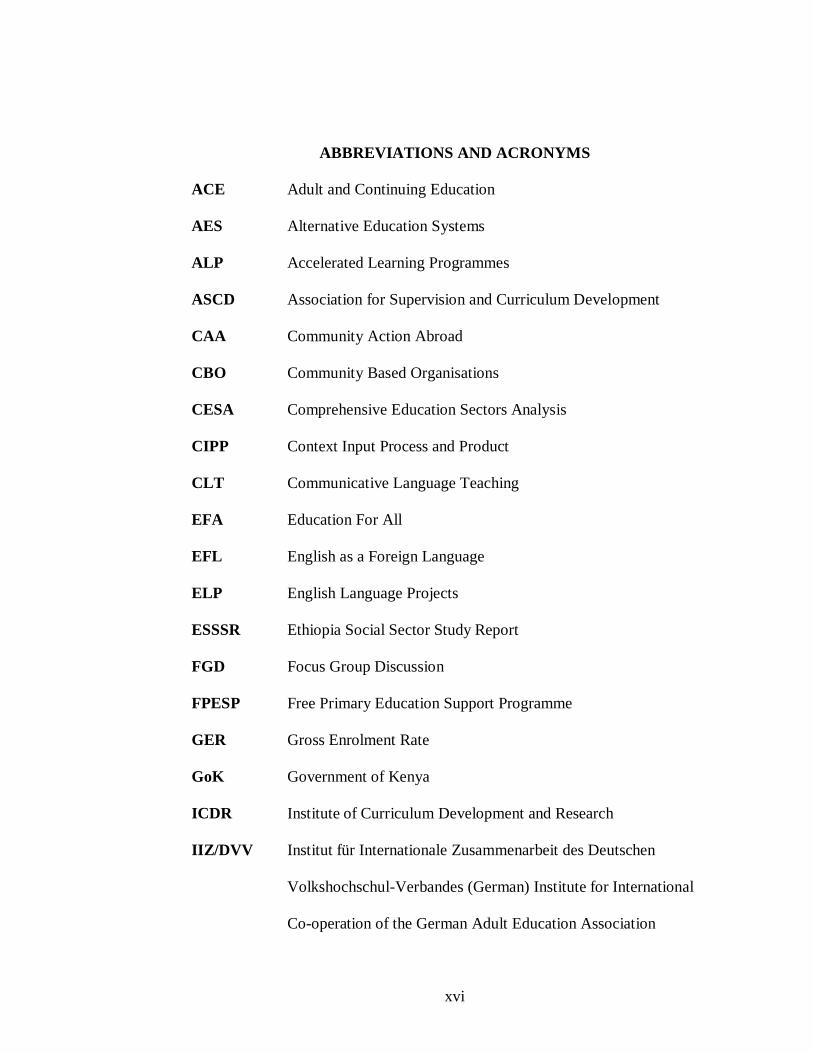
ABBREVIATIONS AND ACRONYMS
ACE Adult and Continuing Education
AES Alternative Education Systems
ALP Accelerated Learning Programmes
ASCD Association for Supervision and Curriculum Development
CAA Community Action Abroad
CBO Community Based Organisations
CESA Comprehensive Education Sectors Analysis
CIPP Context Input Process and Product
CLT Communicative Language Teaching
EFA Education For All
EFL English as a Foreign Language
ELP English Language Projects
ESSSR Ethiopia Social Sector Study Report
FGD Focus Group Discussion
FPESP Free Primary Education Support Programme
GER Gross Enrolment Rate
GoK Government of Kenya
ICDR Institute of Curriculum Development and Research
IIZ/DVV Institut für Internationale Zusammenarbeit des Deutschen
Volkshochschul-Verbandes (German) Institute for International
Co-operation of the German Adult Education Association

xvii
KENSIP Kenya School Improvement Project
KESSP Kenya Education Sector Support Programme
KNLS Kenya National Library Services
LIFA Licensed International Financial Analyst
KIE Kenya Institute of Education
MDGs Millennium Development Goals
MoE Ministry of Education
MoEST Ministry of Education, Science and Technology
NCST National Council of Science and Technology
NER Net Enrolment Rate
NFBE Non-Formal Basic Education
NFBEC Non-Formal Basic Education Curriculum
NFBPE Non-Formal Basic Primary Education
NFE Non-Formal Education
NFECs Non-Formal Education Centres
NGO Non-Governmental Organisation
P1 Primary Teacher Training Certificate
PMLC Project Management Life Cycle
RCWDA Rift Valley Children and Women Development Association
GoK Government of Kenya
SE Special Edition
SEM Structural Equation Modelling

xviii
SPSS Statistical Package for Social Sciences
SWAP Sector Wide Approach
TSC Teachers’ Service Commission
UIS UNESCO Institute for Statistics
UNCRC United Nations Convention on the Rights of the Child
UNDP United Nations Development Programme
UNESCO United Nations Educational, Scientific and Cultural Organisation
UNICEF United Nations Children’s Fund
UNSP United Nations Settlement Programme
UPE Universal Primary Education
WCEA World Conference on Education for All
WEF World Education Forum

xix
ABSTRACT The drive to access basic education to out-of-school (OOS) children has preoccupied successive governments in independent Kenya. Despite the efforts, attaining Education for All (EFA) has remained elusive. The reality of out-of-school children prompted individuals or organisations to initiate non formal education (NFE). Upon recognition of NFE as a viable means of providing education to the OOS children, the Kenya Institute of Education (KIE) prepared the Non-formal Basic Education Curriculum (NFBEC) to be used by the NFECs in Kenya. The purpose of this study was to assess the implementation of the NFBEC in Nairobi, Mombasa and Kisumu urban centres. Five research objectives guided the study. The study employed cross sectional survey design. The target population consisted of 36 directors, 96 teachers, 750 learners and the community leaders. The study employed purposeful sampling using maximum variation. The sample size comprised of all the 96 teachers, 36 directors and 420 pupils. Data was collected by use of questionnaires, interviews, focus group discussions, lessons observation and document analysis. The analysis was carried out by use of STATA 11 Special Edition (SE) statistical application, Epi info and Predictive Analytics SoftWare (PASW). The study revealed that curriculum implementation was affected by inadequate or lack of training for teachers. Most of the teachers (52.7%) had not been in-service training on the NFE curriculum. Regression of teacher characteristics and completion rates revealed that there was a significant relationship between gender (p = 0/01), age (p = 0.03) and duration at the centre (p = 0.02) and completion rates. Multiple regressions of selected teacher variables revealed a correlation coefficient of 0.184 with completion rates. Inadequate teachers challenged the implementation of NFBEC where majority (74.2%) of the directors indicated they had inadequate teachers. Linear regression of teaching methods factor (scheme of work) revealed a correlation coefficient of 0.182. The study further revealed that learner characteristics such as their attitude negatively influenced curriculum implementation. There was a significant relationship between teachers’ rating of learners’ characteristics revealed (p lesser than 0.05). Community characteristics had a significant relationship completion rates (p = 0.0105). The study recommended that the government should finance NFE centres. The Ministry of Gender and Social Services and non-governmental organisations (NGOs) under which these centres are registered should provide teaching and learning facilities. The study also recommended that Kenya Institute of Education (KIE) should provide in-service training for teachers so that they are able to translate and use the NFBE curriculum. The study suggested that a further study should be conducted to establish how other teacher variables not addressed in the study, influence curriculum implementation. A study on how other director variables affect curriculum implementation should be conducted to provide models which would predict what the directors ought to do to effectively implement the curriculum. Lastly, considering that this study was conducted in urban areas, a similar study should be conducted in rural areas to establish what factors affect curriculum implementation in such areas.

1
CHAPTER ONE
INTRODUCTION
1.1 Background to the study
The Universal Declaration of Human Rights adopted by the United Nations
General Assembly in December 1948, guaranteed for the individual a whole range
of basic freedoms with education serving as a basic right necessary for the
achievement of all other freedoms. Article 28 (1) of the United Nations
Convention on the Rights of the Child (UNCRC), 1989, declares that all children
have a right to education. Education is recognised as a basic right of every child
(United Nations Educational Scientific and Cultural Organisation [UNESCO],
2006). The right to education requires that young people be given the opportunity
necessary for the acquisition of knowledge, skills, attitudes and values that will
enable them lead happy and productive lives as individuals and discharge their
social duties for the betterment of life in the society (UNESCO, 2006).
Any child without access to education is, therefore, denied the right and power to
participate fully as a member of their society. Moreover, since investing in
children’s education is the most important contribution a nation can make towards
a better future (Lockheed, Marlaine & Verspoor, 1991), children who have been
denied access to education are seen as dependent rather than potential active

2
participants in their country’s socio-economic conditions (Republic of
Kenya/MoEST, 2003).
Individual governments across the world constantly reaffirm their commitment to
equal opportunity in education. Besides, they are obligated under international
human rights conventions, to act on that commitment. And yet most governments
are systematically failing to address extreme and persistent education
disadvantages that leave large sections of society marginalised (UNESCO, 2010).
These disadvantages are rooted in deeply ingrained social, economic and political
processes, and unequal power relationships, and they are sustained by political
indifference (UNESCO, 2010). This failure to address education gaps is a major
problem whose repercussions reverberate across generations, as those who fail to
get education lose a competitive edge in other areas of life like employment,
health, and social and political participation with the consequent danger of stoking
insecurity and social unrest. As UNESCO (2010) notes, restricted opportunity in
education is arguably the most powerful mechanism for transmitting poverty
across generations (UNESCO, 2010).
In the Kenya Vision 2030 (GoK, 2007), Kenya recognises that education and
training of all Kenyans is fundamental to the success of the Vision. The Vision by
which the country hopes to become a middle income country by the year 2030
recognises that education equips citizens with understanding and knowledge that
enables them to make informed choices about their lives and about the society.

3
The education sector is, therefore, challenged to provide skills necessary to steer
Kenyans to the economic, political and social goals of Vision 2030.
Through education and the Vision 2030, Kenya endeavours to provide globally
competitive quality education, training and research to her citizens for
development and enhanced individual well-being. The overall goal for 2012, for
instance, was to reduce illiteracy by increasing access to education, improving the
transition rate from primary to secondary schools, and raising the quality and
relevance of education. Other goals include the integration of all special needs
education into learning and training institutions, achieving an 80% adult literacy
rate, increasing the school enrolment rate to 95%, and increasing transition rates
to technical institutions and universities from 3% to 8% by 2012 (GoK, 2007). To
cement this endeavour on solid ground, the new Constitution of Kenya guarantees
free and compulsory basic education to every child (Article 53 (1) (b).
However, despite education being the cornerstone for economic and social
development and an indispensable key to personal and social improvement, the
UNESCO Global Monitoring Report (2012) acknowledges that globally, more
than 61 million children fail to complete basic education programmes of whom
42% translating to 26,230 live in The Sub-Saharan Africa (Global Partnership for
Education: Quality Education for all children (2013). Unless appropriate
educational opportunities are opened to these children, they will eventually join
the ranks of adult illiterates who are estimated at 875 million (UNESCO, 2010).

4
Since 1999, enrolment rates in sub-Saharan Africa have been increasing five
times as fast as in the 1990s, with countries like Benin, Ethiopia, Mozambique
and the United Republic of Tanzania registering rapid advances (UNESCO,
2010). Current trends will leave some 61 million children out of school in 2015
and there are indications that the rate of progress towards universal primary
education is slowing. Regional progress has also been uneven. Out-of-school
numbers have fallen far more rapidly in South Asia, driven by rapid advances in
India, than in sub-Saharan Africa (UNESCO, 2010).
Most of the countries that are off track in achieving universal primary education
by 2015 are low-income countries that, having started from a low base, are either
increasing enrolments impressively but too slowly, such as in Burkina Faso and
the Niger; or stagnating, such as Eritrea and Liberia. Countries affected by
conflict feature prominently in this group. However, higher-income countries
such as the Philippines and Turkey are in danger of failing to achieve the target,
largely because of deeply entrenched national inequalities (UNESCO, 2010).
Continued inability of many children to access the formal school system could be
interpreted as a testimony, not only of the failure of the formal school system, but
also of the need for non-traditional education approaches that would address the
needs of the out-of-school children (GoK, 2005). It is against this backdrop that
The Dakar Framework for Action (2000) advocated for the “third channel”
approaches, that is non-formal education (NFE) delivery mode. The shortcomings

5
in the provision of formal education, therefore, call for non-formal education as a
complementary approach to enable the adult and out-of-school youth to access
education.
Non-formal education became part of the international discourse on education
policy in the late 1960s and early 1970s (Coombs, 1968). It was at an
international conference in Williamsburg USA in 1967, that ideas were set out
for what was to become a widely read analysis of the growing “World
Educational Crisis” (Fordham, 1993). The conclusion of the conference was that
formal educational systems had adapted too slowly to the socio-economic changes
around them and that they were held back not only by their own conservatism, but
also by the inertia of societies themselves.
It was from this point of departure that planners and economists in the World
Bank began to make a distinction between informal, non-formal and formal
education. NFE has, therefore, been recognised as an alternative means of
offering education to groups that have not benefited from formal education.
Fordham (1993) notes that in the 1970s, four characteristics came to be associated
with non-formal education. These include, first, NFE is relevant to the needs of
disadvantaged groups; secondly, it is concerned with specific categories of
person; thirdly, it has a focus on clearly defined purposes; and lastly, it is flexible
in organisation and methods.

6
The term non-formal education is broadly and loosely defined to include all
education outside the school system with no parameters of time and space (Shiror,
1995). It includes all learning and training that takes place outside recognised
educational institutions. Even then, it follows a sequential structure of learning
experience and is generally part of some organisation or programme (Farooq,
1993). Moreover, Khawaja and Brennan (1990) have characterised non-formal
education as an international movement that emerged particularly in the second
half of the 20th century as a result of problems of general economic, political and
social development with regard to nations and individuals.
Non-formal education may range from day care for children of working mothers
to adult education classes. Shiror (1995) states that the need for non-formal
education arises due to limitations in financial resources, within contexts of rapid
population growth where there is a perceived need to provide education for all to
increase human development.
Sessional Paper No. 1 of 2005 titled “Policy framework for the Education Sector
for meeting the challenges of Education and Training in Kenya in the 21st
Century”, recognises the important role played by non-formal education as a
vehicle for transformation and empowerment of individuals and society. It further
acknowledges that NFE offers opportunities for those outside the formal school
system to access and benefit from education. Following this, there is a directorate

7
in the Ministry of Education to oversee matters related to NFE and Adult
Education (Republic of Kenya, 2005).
In 1994, the Government of Kenya (GoK), with the support of UNICEF
conducted a study whose aim was to devise interventions to address the needs of
the out-of-school children and adults. The survey revealed that there was no
standandard curriculum offered at the NFE centres. Since then, NFE has
increasingly become a necessary and complementary component of a
comprehensive strategy to provide Education For All (EFA). Both categories of
non-formal institutions comprising non-formal schools (NFSs) or non-formal
education centres (NFECs), which may or may not have been registered by the
MOEST, have been established to provide education and other services (such as
shelter, health, nutrition, counselling, and protection) to school-age children
(GoK, 2005). The chief providers of NFE have been individuals, communities,
local authorities, NGOs, and faith-based organisations. Generally, non-formal
schools target primary school-age children using formal curriculum with support
of non-governmental providers such as communities. Using various curricula,
including the Kenya Institute of Education (KIE) NFE curriculum, the NFECs
target school-age children and youth below 18 years who cannot attend, or have
dropped out of formal schools.
It was upon recognition of NFE as a viable means of providing education at basic
level that the KIE in 2006began preparation of Non-Formal Basic Education

8
Curriculum (NFBEC) to be used by the NFECs in Kenya. The NFBE curriculum
is broad in nature and provides the learners with the opportunity to acquire
knowledge, skills and attitudes necessary for individual and national
development. The target group for this curriculum is out-of-school children and
youth aged 6-17 years (GoK, 2006). The NFBE curriculum is flexible in that it
allows entry, dropping out and re-entry at any level.
The NFBE curriculum was officially launched in March 2007. As a prerequisite
for full-scale implementation and to ascertain the efficiency and effectiveness of
the implementation process, it was found necessary to orient the teachers in
Nairobi Province. The orientation took place at the Kenya Institute of Education
(KIE) in June 2007 (MoE, 2007). Since the launching of the curriculum, these has
been little effort by the Ministry of Education or the KIE in investigating how the
implementation has taken place.
According to Johnson (2000), constructing capacity to support innovation is an
attempt to understand and elaborate on the factors that are able to support, or
hinder, the implementation of new ideas and practices in a system such as a
school or NFE centres. It should be recognised that not all NFE programmes have
the capacity to implement a given innovation to the same extent. Possible
indicators of the capacity to support innovation construct fall into four groups:
physical resources, teacher factors, learner factors and the school ecology and
management which may hinder or support the implementation (Johnson, 2000).

9
Curriculum implementation entails putting into practice the officially prescribed
courses of study, syllabuses and subjects (Pratt, 1994). The process involves
helping the learner acquire knowledge or experience. Curriculum implementation
also refers to the stage when the curriculum itself, as an educational programme,
is put into effect. The curriculum which has been developed keeping in mind the
needs of out of school children ought to be implemented with fidelity. However
this has not been the case. The NFE centres have not fully implemented the
curriculum but opt for the formal curriculum. One may therefore wonder whether
the curriculum addresses the intended goal. There are several factors that
influence curriculum implementation. It has long been recognized that teachers
have a major role in determining and implementing the curriculum. Stenhouse
(1975) identifies the teacher as the agent in the curriculum implementation
process and argues that implementation is the manner in which the teacher selects
and mixes the various aspects of knowledge contained in a curriculum document
or syllabus. A major setback in effective curriculum implementation is the
problem of unqualified teachers, especially specialist teachers in areas like
vocational and technical subjects. In most instances, curriculum is designed up to
implementation without adequate manpower to translate these documents into
reality (Sofalahan, 1998). Hence this study establishes how teacher characteristics
influenced NFBE curriculum.
Similarly, successful implementation is affected by the nature of the particular
school’s physical and human resources (Rogan & Grayson, 2003). Teaching /

10
learning materials form the medium through which teaching is carried out.
Anandu (1990) asserts that physical facilities are vital for both teachers and pupils
for effective curriculum implementation. Physical facilities that are important in
curriculum implementation include classrooms, libraries, sanitary facilities and
play grounds. Nafula and Ngoma (1998) add that modern teaching environment
entails some key characteristics in its physical setting. Mungai (1992), Nafula and
Ngoma (1998) note that without sufficient physical facilities and materials,
curriculum cannot be effectively implemented. Fullan and Miles (1992) further
assert that implementation demands resources for training, for substitutes, for new
materials, for new space, and, above all, for time. This study therefore established
how physical resources and materials influenced NFBE curriculum.
Instructional approaches are important elements during curriculum
implementation. It is assumed that as the curricula change so should the
instructional methodology (MoE, 2011). Wang, Nojan, Strom and Walberg
(1984) posit that for the curriculum to be implemented effectively, alternative
instructional methods need to be adopted too. According to Ajibola (2008), when
instruction is directed towards the needs of the child, there is an accompanying
tendency to make sure that s/he fully understands the material he is being taught
Teacher-centred methods of teaching have been common in classroom because,
teachers lacked confidence, mastery of subject matter content and basic teaching
skills (Thijs, 1999), (Howie, 2002) and (Motswiri, 2004). The current study
therefore established how instructional methods influence NFBE curriculum

11
It is important to note that curriculum implementation cannot take place without
the learner. The learner is therefore the central figure in the curriculum
implementation process Curriculum implementation takes place as the learner
acquires the planned or intended experiences, knowledge, skills, ideas and
attitudes that are aimed at enabling the same learner to function effectively in a
society (University of Zimbabwe, 1995). In NFE programme implementation as
in any other curriculum implementation, the community is central. Unless
concerned community members understand, support, and complement the
programme, failure is unavoidable. The community can influence implementation
in that it provides schools with financial resources to purchase required materials,
they demand the inclusion of certain subjects in the curriculum, it influences
learners to reject courses they consider detrimental to the interests of the group
(Buchert, 1998). The study therefore established how community characteristics
influence curriculum implementation.
1.2 Statement of the problem
Despite the development and launching of NFBEC, the curriculum has not been
implemented in several NFE centres. According to the Nairobi City Education
department, report (2012), 98 percent of the NFECs are offering the formal
curriculum with few isolated cases offering the NFBEC despite the government
effort of launching the curriculum to be used in NFECs. Likewise according to
Mombasa County director of Education, Adult and Non formal Education

12
department, (2013), only 16 percent of the centres in Mombasa were using the
curriculum while in Kisumu; only 13 percent are using the curriculum (Kisumu
County Director of Education, Adult and Non Formal Education department,
2013). From these statistics, it was evident that NFE curriculum was not
implemented in majority of the centres. This study, therefore, aimed at
investigating factors that influenced implementation of NFE basic education
curriculum in Nairobi, Mombasa and Kisumu cities.
1.3 Purpose of the study
The purpose of this study was to assess the factors influencing implementation of
the Non-formal basic education curriculum in Nairobi Mombasa and Kisumu
cities.
1.4 Objectives of the study
The objectives of this study were to:
i. Determine how teacher characteristics influence the implementation of
Non-formal basic education curriculum;
ii. Establish how adequacy of physical resources and teaching/learning
materials influence implementation of the Non-formal basic education
curriculum;

13
iii. Examine how instructional methods influence the implementation of the
Non-formal basic education curriculum;
iv. Assess how learner characteristics influence the implementation of the
Non-formal basic education curriculum;
v. Establish how community characteristics influence the implementation of
the Non-formal basic education curriculum;
1.5 Research questions
The study was guided by the following research questions;
i. To what extent do teacher characteristics influence the implementation of
Non-formal basic education curriculum?
ii. How does adequacy of physical resources and teaching/learning materials
influence the implementation of the Non-formal basic education
curriculum?
iii. How appropriate are the instructional methods employed by teachers in
the implementation of the Non-formal basic education curriculum?
iv. What learner characteristics influence the implementation of the Non-
formal basic education curriculum?
14
v. How do community characteristics influence the implementation of the
Non-formal basic education curriculum?
1.6 Significance of the study
This study is significant in several ways. The study may be important to the
Ministry of Education and the Kenya Institute of Education (KIE) in identifying
factors that influence NFE curriculum implementation and possibly come up with
recommendations for best practices. The findings may also be important to the
curriculum implementers who may be informed on the best practices in the
implementation of the basic NFE education curriculum in the NFE centres. The
study findings might draw attention to the stakeholders on the need for training
and preparing teachers at the basic NFE centres for effective implementation of
the basic NFE curriculum. The study may also assist in establishing whether there
is need or not for seminars and in-service courses for teachers in an effort to help
them adopt the most suitable approaches for the implementation of NFE
curriculum.
Furthermore, the results of the study may sensitise policy makers, educational
administrators, and curriculum planners on the need to plan towards effective
curriculum implementation of NFE curriculum in Kenyan NFE centres. Also, the
result of the study may contribute to policy formulation and practices, as quality
assurance and standards officials may be sensitised on what to look out for during
supervision of the programme. Lastly, the study would hopefully assist in

15
increasing awareness on problems and challenges faced by the teachers, pupils,
directors and the community in the implementation of NFE curriculum.
1.7 Limitations of the study
The research process was hampered by a number of hitches. One, that there was
inadequate up-to-date data on enrolment, transition and performance of the NFE
learners at the NFE desk at the Ministry of Education (MoE). There were limited
studies on the implementation of the curriculum hence the research heavily relied
on secondary sources of information such as implementation of other educational
programmes. This study was limited to the non-formal centres with a specific
reference of examining basic education provision. As such, only NFE centres that
offered NFE basic education curriculum formed the sample. The researcher also
faced limitation in accessing information from some respondents in some sampled
centres hence was forced to fall back on convenience sampling for some institutions.
Another limitation was that in some centres, even after explaining the purpose of the
study to the centre directors, the researcher was still viewed as a potential donor to
the institution hence the directors were tempted to present a good picture of the
institution and how well the centres were doing in the provision of non formal basic
education. The researcher however mitigated this limitation by further explaining the
purpose of the study that it was aimed at assessing the implementation of the NFBEC,
which could lead to improved implementation. The researcher further used
questionnaire which solicited the required information.

16
1.8 Delimitations of the study
Though NFE curriculum has been implemented among different groups such as
street children, adult education and nomadic pastoralists, this study focused on
how NFE curriculum has been implemented in the NFE centres in Nairobi,
Mombasa and Kisumu towns, which are urban settings. There are many indicators
of successful NFBE curriculum implementation. These include completion rates
of learners, number of learners transiting to formal schools, completion rates
among boys, girls, drop out levels, establishment of businesses or establishment
of income generating activities after completion of the programme. These are
measures of dependent variable for effective implementation. The researcher was
selected ‘the number of learners who had completed their education at the NFE’
the measure for the dependent (criterion) variable.
Key players such as the NGOs and religious organisations offering the NFE were
not included in the study though they would provide information on curriculum
implementation. This was as a result of difficulty in accessing them due to their
nature of work. The researcher did not seek information from the KIE which is
curriculum developers. This was because KIE is not a key agent of
implementation. The study was conducted in Nairobi, Mombasa and Kisumu
towns and only in the NFE centres where the non-formal basic curriculum has
been implemented. The findings may therefore be generalised to other NFE
centres with caution.

17
1.9 Assumptions of the study
In this study it was assumed that:
i. National NFE basic education curriculum has been designed for all the
NFE forms regardless of the geographical areas.
ii. The respondents are aware of the factors that influence curriculum
implementation at the NFE centres.
iii. The presence of the researcher in the centres would not significantly
influence the respondents in answering the research instruments.
iv. The respondents were honest and accurate in providing information upon
which the study findings are based.
1.10 Definition of terms
The following are key terms as used in the study
Accelerated learning programme refers to a modification of the formal primary
school cycle that offers flexible learning opportunity in two years where learners
can join the formal education after the two years.
Adequacy is the ability to satisfy a requirement or meet a need.

18
Alternative education are those initiatives offering a significantly form of
learning experience from what is available in the mainstream of formal education
provision (Hoppers, 2006).
Appropriate resources refers to suitable resources for the learners and teachers
at the NFE centres.
Basic education means satisfying learning-for-life needs which includes
knowledge, skills, values and attitudes that permit people to develop abilities and
to fully participate in the development and improvement of their quality of life. In
this context, it is equivalent to the first cycle of the primary education (1-8) in
Kenya.
Basic learning needs refer to the knowledge, basic life skills, attitudes and values
necessary for the children to survive, to improve the quality of their lives, and to
continue learning.
Completeall refers to the number of learners who have completed the NFE cycle
Criterion variable is a variable being predicted in regression analysis. This term
is used interchangeably with dependent variable.
Curriculum implementation is use of the prescribed NFBEC in the NFE centres.
In this study curriculum implementation is measured by the number of learners
who have completed the NFE cycle.

19
Formal education is the hierarchically structured, chronologically graded
education system, running from primary school through to the university and
including, in addition to general academic studies, a variety of specialised
programmes.
Implementation refers to a curriculum stage at which the teacher receives and
executes new curriculum in his or her respective schools.
Implementation refers to a form of evaluation assesses the extent to which a
program is operating as it was intended. It typically assesses program activities’
conformance to statutory and regulatory requirements, program design, and
professional standards or customer expectations.
Instructional methods are the teaching methods such as discussion, lecture,
demonstration, case study, role play and projects that are used to teach learners at
the NFE centres.
Instructional technique is the sequencing and ordering of the methods a teacher
has selected to teach the lesson.
Interest groups are the stakeholders in the provision of NFE which include the
community, parents and service providers who are interested and take part in the
provision of NFE.

20
Non-formal education is any organised, systematic, educational activity, carried
outside the framework of the formal system, to provide selected types of learning
to particular subgroups in the population.
Out-of-school children refer to those minors who are not in school but ought to
be in school.
Predictor variable is a variable used in regression analysis to predict another
variable. The term is used interchangeably with independent variable.
Service providers refer to individuals, religious organisations and NGOs offering
non formal education at the NFECs.
Teacher preparation is any training that teachers have undergone, whether pre-
service or in-service, to take up teaching at the NFE centres.
1.11 Organisation of the study
The study is organised into five chapters. Chapter One focuses on introduction
comprising the background, the statement of the problem, purpose and objectives
of the study, research questions, significance, limitations, delimitations, basic
assumptions and definition of terms. Chapter Two consists of the literature
review. The chapter presents the global commitment to education, relevant
education for the out of school children, non formal education, Non formal
education in Kenya and non formal basic education curriculum. The chapter
further discusses curriculum implementation and factors that influence the

21
implementation. These include teacher characteristics, resources and materials,
instructional methods, learner characteristics. Lastly the chapter presents the
theoretical basis for curriculum implementation and conceptual framework of the
study. Chapter Three is the research methodology and deals with research design,
target population, sample and sampling procedures, the research instrument,
validity and reliability of the research instrument, data collection procedures and
data analysis techniques. Chapter Four constitutes data analysis and discussion of
findings while Chapter Five provides the summary, conclusions,
recommendations and suggestions for further research.

22
CHAPTER TWO
LITERATURE REVIEW
2.1 Introduction
Empirical literature on non formal education (NFE) curriculum implementation is
quite scarce, and often very difficult to access. Not many studies have been
conducted in this area, especially in Kenya, hence making analytical literature
even scarce. The researcher therefore used related studies on curriculum
implementation of formal education. The literature review in this chapter focuses
global commitment to education, relevant education for the out-of-school
children, non formal education, non formal education in Kenya and non formal
basic education curriculum. The chapter further discusses curriculum
implementation and factors that influence the implementation. These include
teacher characteristics, resources and materials, instructional methods, learner
characteristics and community characteristics. Lastly, the chapter presents the
theoretical basis for curriculum implementation and the conceptual framework of
the study.
2.2 Global commitment to education
The Universal Declaration of Human Rights of the United Nations states that
everyone has the right to Education and that the education shall be compulsory.
Therefore, access to basic education is everyone’s right. Education is also an

23
indispensable weapon in fighting ignorance and retardation and a necessary first
step in the long march towards socio-economic and political development. World
peace, stability and sustainable development are impossible without an education
that reaches all, since education is the means towards effective participation in the
societies and economies of the 21st century. This explains the importance of
education as a tool for the achievement of all other human rights and exercise of
human freedoms.
The Education for All movement is a global commitment to provide quality basic
education for everyone. The movement was launched at the World Conference on
Education for All held in Jomtien (Thailand) in 1990, where representatives of the
international community agreed to universalise primary education and massively
reduce illiteracy by the end of the decade (WCEFA, 1990). And according to the
Dakar Framework for Action Senegal, (April 2000), a collective commitment was
made to attain several EFA goals. These included ensuring that by 2015, all
children -with special emphasis on girls and children in difficult circumstances -
have access to and complete free and compulsory primary education of good
quality; and ensuring that the learning needs of all young people and adults are
met through equitable access to appropriate learning and life skills programmes. It
also aimed at achieving a 50 percent improvement in levels of adult literacy,
especially for women, by 2015, and equitable access to basic and continuing
education for all adults (WCEFA, 1990).

24
The gains achieved since the EFA and Millenium Developmet Goals (MDG)
adapted in 2000 are undeniable: great strides have been made towards universal
primary education, increased participation in secondary and tertiary education
and, in many countries, gender equity. More widely, there have been
improvements in overcoming hunger, poverty, and child and maternal mortality
(UNESCO, 2010).
However, many children continue to remain out of school and, therefore, the
question: Who and where are the out-of-school children — and what are their
chances of entering school? (UIS, 2009a). Being out of school is not a fixed
condition. The category of the out-of-school covers children who have dropped
out of school temporarily or permanently, those who have never been to school
but might start late and those who will never go to school. Data constraints make
it difficult to unravel the precise characteristics of the out-of-school population.
However, a model developed by the UNESCO Institute for Statistics (UIS) makes
it possible to predict, on the basis of past evidence, what share of out-of-school
children is likely to enrol in the future (UIS, 2009a).
Overall, about 31 million children face the most acute disadvantages in accessing
education globally. The problem being most pronounced in sub-Saharan Africa
where 59% of the out-of-school population is unlikely to enrol. In Burkina Faso,
Cameroon, Ethiopia, Malawi, Niger, Senegal and Zambia, household survey data
suggests that rural children are more than twice as likely to be out of school
25
(Bruneforth, 2009). An estimated 44% of out-of-school children are unlikely to
make the transition into school. In South and West Asia, more than 60% of the
out-of-school population has dropped out, while one-third is unlikely ever to
enter. Almost half of the out-of school population in the Arab States is unlikely to
enter. Thirteen years have passed since the international community adopted the
six EFA goals in Dakar in 2000. While much has been achieved over the past
decade, many of the world’s poorest countries are not on track to meet the 2015
targets. Failure to reach the marginalised has especially denied many people their
right to education.
In its commitment to the attainment of EFA by 2015, the Government of Kenya is
implementing programmes in line with the International Community’s
commitments and obligations as agreed in Jomtien in 1990 and reaffirmed in
Dakar a decade later. Already, Kenya has implemented the Free Primary
Education (FPE) Programme since January 2003. The initiative, which is mainly
funded from public resources with some support from development partners and
other stakeholders, has greatly enhanced access, retention and equity. The
enrolment in primary schools increased from 5.9 million in 2002 to 7.6 million in
2005. The Gross Enrolment Rate (GER) in 2002 was 88% compared to the
current GER of 104.8%; while the Net Enrolment Rate (NER) stands at 84.5%.
Under the Free Primary Education Programme, all public primary schools receive
grants directly from the government. As a result, fees and levies which existed
under the cost sharing policy were all abolished. However, the number of out-of-

26
school Kenyan children has reached 1.8 million despite the FPE. According to
UNESCO Institute for Statistics (UIS) (2008), about 752,000 boys and 706,000
girls are out of school. For Kenya then to attain the EFA goals, there is need to
find a way to have these children access education.
According to UNESCO (2010), overcoming marginalisation in education is an
imperative for human rights and social justice. It is also the key to accelerated
progress towards the Education for All goals set in Dakar. No government, which
is seriously committed to the goals, can afford to ignore the deep social disparities
that are stalling progress in education, nor can it ignore the wider consequences of
marginalisation in education for social cohesion and prosperity. That is why there
is the urgent need for all countries to develop strategies for more inclusive
education that is linked to wider programmes for overcoming poverty, social
discrimination and extreme inequality (UNESCO, 2010).
2.3 Relevant education for out-of-school children
The drive to access basic education to school-aged children has preoccupied
successive governments in independent Kenya, yet despite all these efforts
attaining EFA has remained elusive. It is this reality of out-of-school children that
has over the years prompted a number of individuals or organisations, operating
outside the formal system to initiate endeavours offering formal education. From
individual cases in the 1980s, these initiatives multiplied in the 1990s and came to
be formally recognised as Non-Formal Schools (NFS). Policy documents exalted

27
their role in reaching specific populations of excluded children and hence
achieving EFA (GoK/UNICEF, 1995).
Over the period 1990 to 2000, there has been increased access and participation in
the provision of education to out-of-school youth and children. The Ministry of
Education has created a section to handle non-formal education, and an NFE
curriculum has been developed by the KIE. There is encouragement for
communities to be actively involved in the administration and management of
NFE centres to improve governance and ensure greater participation and
efficiency. Access and participation have been enhanced by an increase in the
number of non-formal education centres, allowing children who may have
dropped out of school to have access to education (GoK/UNICEF, 1995).
Gonzales and Pijano (1998) assert that the availability of NFE expands access to
more citizens representing a variety of demographic characteristics, social
economic origins and general interests. Its organisation specific activities and
delivery methods are designed to meet the express needs of the clientele. Non-
formal education can help in addressing the shortfall of the formal education
system as it has the potential to teach skills to people that are relevant to both
urban and rural lifestyles, which can help improve the quality of their lives by
enhancing their economic well-being. Such skills can, for example, enable people
to gain employment, start a small enterprise or improve their farming or fishing

28
practices, maybe adding value to traditional products. It can, therefore, make a
direct contribution to the alleviation of poverty and sustainable development.
2.4 Non-formal education
Non-formal Education (NFE) is an organised educational activity outside the
formal system of education. It is simple and flexible and can be delivered at any
place convenient to the learners. It is generally designed to meet the basic learning
needs of disadvantaged groups and can be availed of at any age. NFE is provided
to those sections of the community that have no access to or have dropped out of
formal education. Non-formal education has also been defined by Kleis (1973) as
any intentional and systematic educational enterprise (usually outside of
traditional schooling) in which content is adapted to the unique needs of the
students (or unique situations) in order to maximise learning and minimise other
elements which often preoccupy formal school teachers (Kleis, 1973).
Although non-formal and informal education antedate formal education, 16th
Century educationists saw education as limited to schooling alone. Previously,
non-formal and informal education had been recognised as a means of imparting
practical knowledge especially to girls and boys born outside the nobility and
ruling classes. Education was thus classified into two, whereby the ruling class
and the nobility received their education in specific locations like monasteries and
selected churches which were taught by especially priests and philosophers
whereas the general population received education from their immediate

29
forebears. They were taught cooking, tailoring, housekeeping and polite
conversation in case of girls while boys learnt music, arts, wrestling and the art of
war and reciting religious chants. In some places the general population learnt
also writing and reading skills from their parish priests (Guesepi, internet)
However, the 16th century saw many schools opened for all and, therefore, non-
formal and informal education were by and large relegated to the back banner.
Anyone who did not go through the school system was considered uneducated.
Formal learning was equated with education in schools and universities, and
hence, non-institutional formal learning was overlooked (Colley, 2002). This
trend continued well into the 20th century until educationists led by the likes of
John Dewey, Ivan Illich and Paulo Freire came into the scene.
Illich (1970) and Freire (1970) raised their voices against the schools in Latin
America because they thought that the formal schools were skewed in favour of
the rich, subjugating the common people in general. Illich (1971) advocated for a
“deschooled” education, while condemning out of hand the school system and the
schools, excoriating them, along with many other public institutions, for
exercising anachronistic functions that fail to keep pace with change, serving only
to maintain the status quo and protecting the structure of the society that produced
them (UNESCO, 2000).
In his major work, Deschooling Society Illich (1970) presents the four central
ideas that summarise his ideas on education. He states that universal education

30
through schooling is not feasible. It would be more feasible if it were attempted
by means of alternative institutions built on the style of present schools; that
neither new attitudes of teachers towards their pupils nor the proliferation of
educational hardware or software, nor the attempt to expand the teachers’
responsibility until it engulfs the pupils’ lifetimes will deliver universal
education; that the current search for new educational funnels must be reversed
into the search for their institutional inverse: educational webs which heighten the
opportunity for learning, sharing and caring and that the ethos, not just the
institutions, of society ought to be ‘deschooled’ (Illich, 1970).
For Illich then, schooling and education were diametrically opposed concepts and
he goes ahead to denounce institutionalized education and the institution of the
school as producers of merchandise with a specific exchange value in a society
where those who already possess a certain cultural capital derive the most benefit.
He argues that for most men, the right to learn is curtailed by the obligation to
attend school (Illich, 1970).
Illich, however, would fail the universal movement towards education for all
through his advocacy for an education that is entirely removed from the formal
and structured schooling. The radical nature of his denunciation prevented him
from constructing a realistic strategy for those educators and researchers who
might have associated themselves with his protest. In addition, Illich’s writings
were founded essentially on intuitions, without any reference to the results of

31
socio-educational or learning research. His criticism evolves in a theoretical
vacuum which portrays him as a utopian thinker (UNESCO, 2000).
It is worth noting that NFE is not meant to take the place of formal education as
an alternative but to complement and, hence, cover for its failures especially in
reaching out to the out-of-school children and adults. To replace formal education
systems with non-formal education will complicate and indeed impede the march
towards the education for all goals. Illich’s claim, too, that structured education
favors those with capital also flies in the face of free education programmes like
the Free Primary Education Programme that the Government of Kenya has been
running since 2003. Every child irrespective of their economic background can,
and should, attend school through such programmes. That notwithstanding, Illich
must be credited with laying the groundwork for the conception of an education
system more attentive to the needs of its environment, to the realities of its pupils’
lives and to the efficient acquisition of socially relevant knowledge. This is what
makes non-formal education so relevant especially among the nomadic and other
marginalised communities.
During the same period, Paulo Freire was weaving together his Pedagogy of the
Oppressed (1970), in which he criticises formal schools for their ‘banking’
method of teaching and learning in which the educator makes 'deposits' in the
educate. “Banking assumes that the teacher knows everything; the students know
nothing. The teacher narrates, prescribes and deposits information which the

32
student then must mechanically receive, memorise and repeat. Indeed, "the
teacher presents himself to his students as their necessary opposite; by
considering their ignorance absolute, he justifies his existence," (Freire, 1970).
For Freire, the right education must recognise the existential condition of the
learner and help them liberate themselves from their inhuman, oppressed,
poverty-stricken situations. He advocated for an education where dialogue is
emphasised together with respect, which allows the teacher and learner to work
with each other in a method he called ‘problem posing’ in which the learner has
an equal chance with the teacher to contribute. He further rooted for an education
concerned with praxis action that enhances community participation, builds social
capital and ultimately leads to justice and human flourishing. Just as non-formal
education does today, Freire insisted on situating educational activity in the lived
experience of participants.
Before him, the American philosopher and educationist, John Dewey stressed this
point when he criticised formal education for revolving around the acquisition of
a pre-determined set of skills, insisting that education should emphasize rather on
the realization of one’s full potential and the ability to use those skills for the
greater good. He noted that to prepare the learner for the future life means to give
the learner command of himself so to train him that he will have the full and ready
use of all his capacities (Dewey, 1897). Similarly, Dewey dismisses a curriculum
that solely focuses on the subject matter to be taught as it fosters inactivity (both

33
mental and physical) on the part of the learner. The major flow in this framework
is that "the child is simply the immature being who is to be matured; he is the
superficial being who is to be deepened" (Dewey, 1902). He argues that in order
for education to be most effective, content must be presented in a way that allows
the student to relate the information to prior experiences, thus deepening the
connection with this new knowledge.
From the aforementioned, it can be said that non-formal education in modern
times was born both as a call to action against the failings of the formal education
and also as an innovation that complemented the education system. Educators
thus started to look at how to make education relevant and practical for the
working adults and marginalised communities thus giving impetus to NFE.
Coincidentally, many countries were finding it difficult (politically or
economically) to pay for the expansion of formal education. Formal educational
systems on their part had also adapted too slowly to the socio-economic changes
around them and they were held back not only by their own conservatism, but
also by the inertia of societies themselves. If we also accept that educational
policy making tends to follow rather than lead other social trends, then it follows
that change would have to come not merely from within formal schooling, but
from the wider society and from other sectors within it. It was from this point of
departure that planners and economists in the World Bank began to make a
distinction between informal, non-formal and formal education (Fordham 1993).

34
On their part, developing countries were forced to innovate if they were to realise
their goal to provide education for all. This they undertook by turning to NFE
using two approaches. One was a Programme Approach under which literacy
programmes were implemented to provide basic education through alternative
methods. Since the alternative education also needed teachers, curriculum,
textbooks and physical structures, it was experimented in some places and based
on results, they were expanded. This approach was also called 'gradualist
approach'. At the same time some socialist countries of Asia like China and
Vietnam launched a Mass Literacy Campaign Approach (MLCA) to provide basic
education to masses by mobilising all forces of the society. In the mass literacy
campaign, all teachers, students, government staff, housewives and practically
everybody in the society was asked to play the role of either learner or teacher.
These approaches were space bound, time bound and result oriented (Kleis,
1973).
Many of these programmes apparently met with considerable success. For
example Russia, Cuba, Tanzania, Somalia, Ethiopia and Nicaragua often
organised successful mass campaigns particularly in respect of literacy. By the
mid 1970s a number of non-socialist countries were beginning to turn to the idea
of mass non-formal education. It was clear that there remained a large scale and
apparently growing problem of illiteracy and also clear that economic and social
development depended on bringing about change in many people's thinking
(Kleis, 1973).

35
Non-formal education thus became part of the international discourse on
education policy in the second half of the 20th century. In the 1970s, UNICEF
asked Philip Coombs and Mansoor Ahmed to study Non-Formal Education. In the
course of their study, they defined NFE as an alternative education which would
be organised systematically outside the framework of the formal system to
provide functional learning relevant to particular subgroups of the population,
both adults and children (Fordham,1993).
At an international conference in Williamsburg USA in 1967, ideas were set out
for what was to become a widely read analysis of the growing 'world educational
crisis' (Coombs 1968). There was concern about unsuitable curricula; a realisation
that educational growth and economic growth were not necessarily in step and
that jobs did not emerge directly as a result of educational inputs.
It can be seen as related to the concepts of recurrent and lifelong learning. Tight
(1996) suggests that whereas the latter concepts have to do with the extension of
education and learning throughout life, non-formal education is about
“acknowledging the importance of education, learning and training which takes
place outside recognized educational institution”. Fordham (1993) suggests that in
the 1970s, four characteristics came to be associated with non-formal education:
relevance to the needs of disadvantaged groups, concern with specific categories
of person, a focus on clearly defined purposes and flexibility in organization and
methods.

36
Non-formal education occurs with such organisations which are less structured
than formal schools, allowing youth more choices, providing less curricular
sequencing, and enforcing it even less. Learning is controlled by the learners who
may drop out any time without penalties. As a result, educators must emphasise
those skills, knowledge, and attitudes which are desired by the learners.
NFE is thus more learners centered than most formal education. It is flexible in
that learners can leave anytime they are not motivated. NFE tends to emphasise a
cafeteria curriculum (options, choices) rather than the prescribed, sequential
curriculum found in schools. In NFE, human relationships are more informal
(roles of teachers and students are less rigid and often switch) than in schools
where student-teacher and teacher administrator roles are hierarchical and seldom
change in the short term. NFE focuses on practical skills and knowledge while
schools often focus on information which may have delayed application. Overall
NFE has a lower level of structure (and therefore more flexibility) than formal
schools (Kleis, 1973).
Although the importance of NFE is well recognised, NFE is a sub-sector that has
not been able to attract major assistance from the international donor community.
The main reasons for this state have been the absence of concrete measurable
return to investments made in NFE activities and/or the lack of systematic
monitoring and evaluation practices. Nevertheless, NFE plays a critical role in
achieving the goals of Education for All (EFA) and while international assistance

37
to NFE may be limited, numerous NFE activities continue to be organised. For
example, in the late 1990s, many basic education programmes for out-of-school
children and adults were initiated, and community schools were developed. At the
Kananaskis Summit in 2002 for example, a communiqué on education
development assistance was adopted, which stated clearly the need to introduce a
NFE approach in order to ensure basic education opportunities for working
children.
All is not gloom though as in recent years, more and more donors are looking at
NFE as part of lifelong learning. In particular, it is becoming common practice in
development assistance to integrate NFE activities into comprehensive rural
development projects. With the launching of the United Nations Literacy Decade
in 2003, overall assistance to NFE by UN agencies and international financial
organisations are starting to place increased emphasis on literacy and NFE in
general. As Graham-Brown (1991) says, dividing formal education from out of
school education or so-called non-formal education is artificial in many ways. But
in some countries, this division reflects the gulf between government provision
through the school system, on the one hand, and the needs and interests of
marginal populations who are most alienated from the system on the other.
Simkins (1976) analysed non-formal education programme in terms of purposes,
timing, content delivery systems and control, and contrasted these with formal
educational programmes. The resulting ideal-types provide a useful framework -

38
and bring out the extent to which non-formal education initiatives, while
emphasising flexibility, localness and responsiveness remain located within a
curricula form of education (in contrast with those forms driven by conversation).
Although the non-formal and formal sectors of education exist separately and
have somewhat differing ideologies, they complement each other and can actively
assist each other in many ways. The two systems are not in competition and will
never substitute for each other, the overall goal is the same – teaching and
learning to improve the lives of individuals and to contribute to the development
of communities and nations. There is considerable synergy, mutual benefits,
between formal and non-formal education.
2.5 Non-formal education in Kenya
Since independence, Kenya has endeavoured to provide education to all its
citizens. The Government recognises the need for OOS children and youth to
have access to formal education. This is demonstrated in the investment of
financial resources in education and the exponential growth of the education
system. However, due to poverty and high population, educational facilities and
resources have been overstretched. As a result, many children especially in
informal settlements are out of school (Bagayoko, 1999).
Non-formal education refers to a range of educationally specific activities which
fall outside the formal school system. Programmes within this category include

39
non-formal basic education, vocational training and skill improvement courses.
Given the high levels of poverty, coupled with the fact that some groups such as
pastoralists occupy economically marginal areas, it becomes difficult for children
to access the formal school system. Non-formal programmes, therefore, provide
the recipients the chance of achieving literacy and basic learning needs.
Like other education and social service programmes, NFE programmes have
suffered from the effects of budget cutbacks. In fact, government financial
allocations to this sector have been negligible as the sector attracts little political
clout in government circles. The role of the government in the provision of non-
formal education has basically been that of co-ordination and advice (GoK, 2000).
This means that in actual practice, the government has not been involved in
establishing non-formal schools and the remuneration of staff. Consequently,
policy makers, educationists and researchers in the education sector have often
perceived it as peripheral in the education setup.
The quality and relevance of NFE is affected by lack of a clear policy, a negative
image, lack of clear transition mechanisms, inadequate resources, unqualified
teachers who often employ inappropriate methods, lack of teaching and learning
materials, lack of quality assurance mechanisms, and an un-co-ordinated large
number of service providers (Thompson, 2001). A survey carried out in the urban
centres of Kisumu, Mombasa and Nairobi (Thompson, 2001) shows that over

40
80% of the NFE centres in informal centres were run by civil society
organisations.
The target groups for the NFE are school-age children who for many reasons have
been unable to join the formal system and are learning in either Non-Formal
Schools (NFSs) or Non-Formal Centres (NFCs) (MoEST, 2003). Both categories
of non-formal institutions, which may or may not be registered by the Ministry of
Education (MoE), have been established to provide education and other services
(such as shelter, health, nutrition, counselling, and protection) to school-age
children. Initially, NFE was provided by NGOs, Faith Based Organisations
(FBOs), donor agencies, Community Based Organisations (CBOs) and
individuals. The centres providing this programme had been operating without a
standardised curriculum with each provider deciding on what curriculum to use.
Generally, NFSs and NFCs target primary school-age children and youth below
18 years who cannot attend formal schools, using various curricula including
Ministry of Education NFE curriculum. The Ministry of Education’s capacity to
co-ordinate and support Non-Formal Schools (NFSs) and Non- Formal Education
Centres (NFECs) based service providers, however, has been inadequate. As a
result, the quality of education provided in NFSs and NFECs varies from very
good to poor.
The objectives of Non-Formal Education are to: develop literacy, numeracy,
creativity and communication skills; help learners enjoy learning and to develop

41
desire to continue learning; develop ability for critical thinking and logical
judgement; help learners appreciate and respect the dignity of work; develop
desirable social standards, moral/ethical and religious values; make learners
develop into self-disciplined, physically fit and healthy persons; help develop
aesthetic values and capacity to appreciate own and other people’s cultures; make
learners develop awareness and appreciation of the environment; develop
learners’ awareness and appreciation of other nations and the international
community; develop respect and love for own country and the need for
harmonious co-existence; develop individual talents for the benefit of self and
others; promote social responsibility and make proper use of leisure time and
lastly develop awareness and appreciation of the role of technology in national
development
2.6 Non-formal basic education curriculum
In order to ensure that quality education is provided to all children, the
Government of Kenya in conjunction with UNICEF carried out a needs
assessment survey in 1994. It is this survey that determined the learning needs of
out-of-school children and youth. The findings revealed that NFE centres
provided an alternative form of basic education to children who were not able to
participate in the formal system. The NFE centres were providing different types
and levels of knowledge and skills that were not based on a standardised
curriculum. The survey recommended that NFE centres should offer a dual
curriculum, one that gives employable skills for those who may not pursue further

42
education and the other for those who may wish to continue with education in the
formal system. The finding also recommended that the NFE curriculum be
synchronised to allow horizontal and vertical linkages between NFE institutions
and formal education institutions (MoE, 1994).This consequently led to the
development of basic Non-Formal Education curriculum aimed at harmonising
non-formal education in all learning centres.
With the support of UNICEF and the UNDP, the Kenya institute of Education
(KIE) developed a basic NFE curriculum. The NFE curriculum comprises
academic and technical subjects (KIE, 2006). The curriculum is broad in nature
and provides the learners with opportunities to acquire knowledge, skills and
attitudes necessary for their individual and national development. It is flexible and
allows entry, dropping out and re-entry at any level. The target group for the
curriculum is OOS children and youth aged 6-17 years (KIE, 2007).
The curriculum is structured in three levels (I, II and III) each of which takes two
years to complete. This is an accelerated education programme which enables
learners to complete within six years taking in cognisance some learners’
advanced age and experiences. The curriculum has vertical and horizontal
linkages and equivalences with formal education curriculum. In each level,
learners are expected to acquire the same competences as learners in the
corresponding levels in the formal education. Level I is equivalent to Formal
Education Standard 1-4, Level II Standard 5-6 and Level III Standard 7-8 (KIE,
2007).

43
Subjects offered in Basic NFE programme include academic subjects which
include English, First Language (Mother Tongue), Kiswahili, Arabic, Science,
Mathematics, Social Studies, Christian Religious Education (CRE) and Islamic
Religious Education (IRE). It is worth noting that first language is offered at
Level I only, while learners take one of the religious education subjects offered
i.e. CRE and IRE. Arabic language on the other hand is offered as an optional
subject. Basic NFE programme also has technical/trade subjects which include
Agriculture, Art and Craft, Garment Making, Wood Work, Masonry, Welding and
Fabrication, Motor Vehicle Mechanics and Home Science. In this category of
subjects, the learner is expected to take one (1) technical/trade subject.
There are also support subjects which include basic geometry and
entrepreneurship. The two support subjects help to facilitate learning and
application of knowledge and skills acquired in technical/trade subject (KIE,
2007). Time was a key element that was considered when designing the NFE
curriculum considering the nature of the clientele. They have to learn, earn and
learn to survive at the same time. The curriculum content is therefore formulated
in a manner that it is more relevant to the needs of the clientele (KIE, 2006).
2.7 Curriculum implementation
Green and Kreuter (1999) states that the keys to success in implementation are
experience, sensitivity to people’s needs, flexibility in the face of changing
circumstances, keeping an eye on long-term goals, and a sense of humour.

44
Buchert (1998) has defined implementation as carrying out the reform as planned.
Similarly, Pratt (1994) shortly defines implementation as the realisation of an
intended change. It is the “open use of a programme throughout an entire school
system” (UNESCO, 1977). It is “putting the show on the road” (Ornstein &
Hunkins, 1998). Berman (1978) defined implementation as the carrying out of an
authoritative decision, i.e., a policy choice. Pal (2006) described it as the
execution of the developed policy.
Implementation of a new programme entails social action that builds a climate of
acceptance for the change. It is, thus, an interaction process between those who
have created the programme and those who are charged to deliver it (Ornstein &
Hunkins, 1998). Loucks and Lieberman (1983) define curriculum implementation
as the trying out of a new practice and what it looks like when actually used in a
school system. For example, a curriculum plan in enhancing technology
integration across the curriculum is introduced and you would want to know
whether what was intended in the plan is actually being done in the classroom.
The aim of developing a curriculum is to make a difference to learners.
Fullan and Park (1981) asserted that implementation is changing practice that
consists of alterations from existing practice to some new or revised practice in
order to achieve certain desired student learning outcomes. They alleged that
implementation is considered a changing practice because the emphasis is on

45
actual use rather than on assumed use. Actual use in fact entails whatever change
may occur in practice.
Fidelity of implementation is the delivery of instruction in the way in which it was
designed to be delivered (Gresham, MacMillan, Boebe-Frankenberger, & Bocian,
2000). Implementation at the learning centres involves: planning and preparation
for implementation (reorganisation of programmes, replenishing equipment, etc.);
teacher preparation, availability of curricula materials; involvement of
stakeholders including parents, community; and periodical evaluation and
strengthening of the implementation programme (Skager & Dave, 1977). This
implies that implementation is a crucial stage where planning is put into practice
(Ornstein & Hunkins, 1998). It is, however, the most difficult aspect of a
programme. This is because; there are numerous barriers to it. Situationally
adaptable planning; supportive guidelines; visualisation of the purposes of the
programme, nonetheless enable us to overcome the barriers. Curriculum
implementation, therefore, refers to how the planned or officially designed course
of study is translated by the teacher into syllabuses, schemes of work and lessons
to be delivered to students.
As stated by Pratt, (1994), when we enter the field of implementation we leave the
green pastures of educational planning and enter the harsh arena of politics…”
(Pratt, 1994). Implementation is “The Great Barrier Reef” (Pratt, 1980). There are
many twists and turns as unexpected events occur along the way in the process of

46
implementation efforts. Several innovations and reforms fail to point the way to
change, because of insufficient attention to design or implementation, deficit
capacity for implementation, cost or inadequate financing, novelty of the
approach or rejection by the community/beneficiaries and reluctance of teachers.
For example, a large-scale educational television programme launched in 1971 by
the government of Cote d’Ivoire to expand primary education was cancelled in
1982 because of implementation problems and criticisms of cost and quality
(Lockheed & Verspoor, 1991).
According to Earley and Bubb (2004), curriculum implementation plans are
required to assist the implementers to obtain a common understanding of the
required curriculum practice. These plans become devices for identifying ways of
solving or minimising problems related to implementation. Appropriate plans
clarify the focus points of the implementation process. Clarity reduces the risks of
non-delivery. Plans do not only make the tasks relevant to the users’ contexts, but
they also facilitate the integration of tasks and help to detect the possibility of
overloading the implementers (DoE2, 2003). Earley and Bubb (2004) thus see
curriculum implementation plans as ‘descriptors’ of the envisaged curriculum
improvement. Similarly, Glatthorn (1997) defines curriculum implementation
plans as a school’s ‘record’ of implementation. Fullan (2001) also argues that
curriculum implementation plans provide clear guidance to the users (in this case
the school management teams and teachers) in terms of what should be done to

47
meet particular needs related to curriculum implementation or to solve a particular
related problem.
2.8 Factors influencing curriculum implementation
In implementing any educational innovation, there are three inseparable factors,
namely: people (change forces), curriculum (programme), and organisation/
institution (Marew, 2000; Fullan, 1991; Ornstien & Hunkins, 1998). For the
purpose of this study, however, these factors have been briefly discussed under
six sub-sections namely influence of teachers, learners, teaching and learning
materials, facilities and instructional methods and the community. These are
believed to have direct impact on the curriculum implementation.
2.8.1 Influence of teacher characteristics on curriculum implementation
Putting the curriculum into operation requires an implementing agent who is the
teacher. It has long been recognized that teachers have a major role in determining
and implementing the curriculum. They interpret and give life to the curriculum
specifications of governments and ministries, and translate curriculum intentions
into classroom practices (Norris, 1998). As Scott (1994) mentions, they not only
control the rate but also the degree of change of any curriculum. Stufflebeam and
Shinkfield (1986) argue that effective curriculum implementation include staff
development strategies, as teachers need to be equipped to adjust their classroom

48
instruction according to the requirements of the new curriculum (Stufflebeam and
Shinkfield, 1986).
The most important person in the curriculum implementation process is the
teacher. With their knowledge, experience and competencies, teachers are central
to any curriculum implementation effort. Regardless of which philosophical belief
the education system is based on, there is no denying that teachers influence
students’ learning. Better teachers foster better learning. Teachers are most
knowledgeable about the practice of teaching and are responsible for introducing
the curriculum in the classroom.
Stenhouse (1975) identifies the teacher as the agent in the curriculum
implementation process. She argues that implementation is the manner in which
the teacher selects and mixes the various aspects of knowledge contained in a
curriculum document or syllabus. Teachers, in particular, play a central role in the
implementation of a school curriculum. Fullan (2001) thus agues the importance of
the teacher as a central change agent, as the teacher is the one who is primarily
responsible for the successful implementation of a new curriculum. Implementation
takes place when the teacher’s personality, the teaching materials and the teaching
environment interact with the learner (University of Zimbabwe, 1995).
The importance of teachers in curriculum planning, development and most
importantly implementation cannot also be overemphasized. Widdowson (1993)
pinpointed the importance of taking into consideration teachers’ roles in the

49
curriculum implementation process in relation to other participants, such as
policymakers, researchers, materials designers, and learners involved in the
educational process. Teachers make important decisions with consequences for
students. In the classroom, they do so behind closed doors. No one can control all
of the specific decisions that teachers make, even during a highly specified
instructional episode (Tanner & Tanner, 1995).
A major setback in effective curriculum implementation is the problem of
unqualified teachers, especially specialist teachers in areas like vocational and
technical subjects. In most instances, curriculum is designed up to implementation
without adequate manpower to translate these documents into reality (Sofalahan,
1998).
According to Morrison, Bachman, & Connor (2005) the teacher’s pedagogy,
classroom management strategies, and interactions with students at classroom
level can determine how much is learned. Therefore, learning is contingent on the
teachers’ ability to create and sustain optimal learning environments. There are at
least three important dimensions of teaching that influence learners’ literacy
acquisition directly or indirectly: (1) the classroom environment teachers create,
(2) teachers’ warmth and responsiveness to their students, and (3) the amount and
type of instruction they provide (Morrison, Bachman, & Connor, 2005).
Alexander (2001) argues that there are three elements of teaching: (i) frame, (ii)
form and (iii) act. That the core acts of teaching that is task, activity, interaction

50
and judgement are framed by classroom organisation called 'space', pupil
organisation, time and curriculum, and by classroom routines, rules and rituals. If
the teacher is to be able to translate curriculum intentions into reality, it is
imperative that the teacher understand the curriculum document or syllabus well
in order to implement it effectively (University of Zimbabwe, 1995).
In the context of classroom interaction, the transmission, facilitation and
acceleration are very important components for effective learning. For instance,
learning in the classroom involves arranging and transferring of information from
a source (teacher) to destination (learner) (Heinichi, Molender, & Russel 1999). In
this respect effective communication on the part of the teacher is an integral part
of effective classroom interaction. However, scholars have identified other
variables as being important for the quality of instruction that is received in a
classroom. These include, attitude of the teacher (Osakwe, 2009), knowledge
base, and mastery of subject knowledge by the teacher (Osakwe, 2009; Darling-
Hammond, 2000), and the socio cultural context (Osakwe, 2009). These scholars
are in consensus that a substantial proportion of student achievement is
attributable to the characteristics and performance of the teachers in their
respective schools. According to Darling-Hammond (2000) differences in teacher
effectiveness determines students’ achievement over and above the effects of
class size and heterogeneity in a classroom.

51
Moreover, teachers’ attitude has also been found to be associated with quality
teaching and learning in the classroom. For example, possession of positive work
attitude enhances teaching, thereby leading to the achievement of learning
objectives and the overall educational objectives (Okorodudu, 2006). This implies
that teachers who possess negative attitudes impair the ability of students to
receive messages from the subjects that they teach, leading to wrong
interpretation of concepts. Research also shows that the teachers’ knowledge is
key to effective interaction in the classroom (Osakwe, 2009; Okorosaye-Orubite,
2005, Darling-Hammond, 2000).
As Whitaker (1979) asserts in the University of Zimbabwe (1995) module, the
teachers view their role in curriculum implementation as an autonomous one. In a
non-formal setup, they select and decide what to teach from the prescribed
syllabus or curriculum since they may not have been trained in what is prescribed
in the curriculum. Since implementation takes place through the interaction of the
learner and the planned learning opportunities, the role and influence of the
teacher in the process is indisputable (University of Zimbabwe, 1995).
If the teacher is to be able to translate curriculum intentions into reality, it is
imperative that the teacher understand the curriculum document or syllabus well
in order to implement it effectively (Whitaker, 1995). If the curriculum is what
teachers and students create together, as Wolfson (1997) states, the teacher must
play a more significant role in designing the curriculum. Teachers must be

52
involved in curriculum planning and development so that they can implement and
modify the curriculum for the benefit of their learners.
Practically, NFE teachers recruited from the local area are more likely to have a
higher level of commitment for a lower salary than those who come from distant
places and other high officials (MoE, 2000). Thus, the recruitment, training, and
allocation of NFE teachers and the whole implementation process of the NFE
programme have necessitated emphasis on "Partnership" to bridge the gap
between the capacity of governments to finance education and the needs of the
education sector. This implies that the implementation of NFE programme
requires the participation of government, parents/community, and NGOs that are
found in the respective localities (Buchert, 1998; MoE/ICDR, 1999).
In a survey of Non-Formal Education in Kenya by GoK and UNICEF (1995),
findings revealed that all teachers at the NFE centres had formal education of
KCPE and above. Majority (63%) were KCE level. None of the teacher was
trained, which was a barrier to effective curriculum implementation. The results
revealed that the centres faced challenges in maintaining teachers thus affecting
curriculum implementation. In the same study, teachers indicated that they
required training on the implementation of NFE curriculum.
A teacher needs to have good mastery of the content for enhanced classroom
interaction. For example, Moloi, Morobe, & Urwick (2008) in their study of Free
Primary Education (FPE) in Lesotho found that teachers’ poor knowledge of

53
content and pedagogy surfaced in the teaching of Mathematics with the
deficiencies attributed partly to their training, and partly to the situation in the
schools. While teachers did keep pupils occupied throughout their lessons, the
concept of a learner-cantered method of teaching was lacking (Moloi et al, 2008).
The key to getting teachers committed to an innovation is to enhance their
knowledge of the programme. This means teachers need to be trained and
workshops organised for professional development. Unfortunately, in any
curriculum implementation process, not all teachers will have the benefit of such
exposure. There are just too many teachers and insufficient funds to go around.
The most common approach is to have one-day workshops given by experts with
the lecture method being the dominant pedagogical strategy. Among the many
extrinsic factors identified and which may impede curriculum change are
adequacy of resources, time, school ethos and professional support. The intrinsic
factors are; professional knowledge, professional adequacy and professional
interest and motivation on the part of teachers (Moloi et al, 2008).
Hence, professional development of teachers is an important factor contributing to
the success of curriculum implementation. To what extent have teacher education
programmes required prospective teachers to study curriculum development?
Some view teachers as technicians and as such do not include curriculum
development in their teacher education programmes.

54
According to Mohammad, Raman, Moniz, Begum, and Tapan (2010) in a study
on Impact of Basic education for hard-to-reach urban children (non formal
education project–3) in Bangladesh, both of the teachers per centre and
supervisors initially received twelve days training in the use of the enhanced
curriculum specifically developed for the project target group who were working
and aged 8-14 years and with little or no previous school experience. It covered
basic elements of the grades I-III curriculum with flexibility and included
additional material on Bangladesh history and culture, health, nutrition, hygiene,
environment, basic human rights, numeracy and other life skills developed by
UNICEF, Bangladesh. Certainly, an adequate teacher education programme
should include curriculum development (both the theory and the practice of
curriculum development) if teaching is to be a profession and if educational
opportunities for learners are really to be improved. Below are some topics to be
addressed in designing professional development opportunities for teachers who
are implementing a new programme.
These findings suggested that teachers needed to have been trained so as to have
good content knowledge, knowledge of assessment strategies, including the
design of activities and test items relevant to objectives and marking for effective
mathematics teaching and learning. Content knowledge aside, it is only when a
teacher can communicate effectively that he will be able to draw upon the various
social cultural contexts of the learner to facilitate learning (Stoner, Freeman, &
55
Gilbert, 1999). Effective classroom interaction can also be enhanced by individual
attention of teachers to their students.
In order that curriculum policy is translated into practice and to ensure that
successful implementation exists in the classroom, it is paramount that teachers
receive in-service training and provision of ongoing support and professional
development (De Lano et al., 1994; McLaughlin, 1987; White, 1993). As
Stenhouse (1975) put it, without teacher professional development there can be no
curriculum implementation. Brindley and Hood (1990) argued that ongoing in-
service training and professional development constitute important components of
any projected implementation. In-service training focuses on teachers’
responsibilities and is aimed toward short-term and immediate goals (Richards &
Farrell, 2005).
A considerable number of conceptual and empirical studies have been carried out
to illustrate the importance of teachers’ in-service training and professional
development in assisting teachers with their implementation of curriculum. Fullan
and Pomfret (1977) contend that in-service training is a factor in curriculum
implementation. They indicated that teachers who received intensive in-service
training had a higher degree of curriculum implementation than those who did
not.
Amugo (1997) studied the relationship between availability and qualification of
teachers and implementation of secondary school curriculum in Nigeria. Her

56
sample consisted of 50 secondary school teachers who were randomly selected
from the population of teachers in Lagos and Imo States. She hypothesised that
there was no significant relationship between availability and qualification of
teachers and curriculum implementation in Nigeria and that available specialist
teachers only used theoretical methods in their classroom work without the
practical aspect. The result of the study showed that there existed a significant
relationship between the availability and qualification of teachers and
implementation of skill-based secondary school curriculum in Nigeria. Amugo,
therefore, concluded that quality and quantity of teachers in Nigerian schools
significantly affect the implementation of curriculum in Nigerian schools,
especially, at the secondary school level (Junior and Senior). These sentiments are
shared by Ajibola (2008) who notes that when teachers are not qualified to teach
the subjects in the curriculum, that affects curriculum implementation.
In a study by Owiny (2006) on Provision of Non-Formal Education to the semi-
nomadic Bahima and Karamonjong pastoralists in Uganda found that most of the
facilitators and instructors of the existing NFE programmes were not qualified.
Because of lack of qualified personnel around the centres, the recruited people did
not meet the minimum qualification of “O” level. As a result, they were
incompetent academically and professionally. Consequently they were unable to
effectively deliver course content and manage the learning situations and
programme hence unable to implement the curriculum.

57
Cheng and Wang (2004); Li, (1998); Wang and Han, (2002), deem in-service
training as critical in successfully carrying out a proposed curriculum. Li (1998)
conducted a survey among 18 South Korean secondary school teachers who
studied at a Canadian university in the summer of 1995. The exploration of
teachers’ perceived difficulties in introducing the Communicative Language
Teaching (CLT) in South Korea revealed the main barrier to be teachers
themselves. These teachers identified six major constraints preventing them from
using CLT: deficiency in spoken English, deficiency in strategic and
sociolinguistic competence, lack of training in CLT, few opportunities for
retraining in CLT, misconceptions about CLT, and little time and expertise for
developing communicative materials. The majority of the reasons are connected
with teachers’ lack of in-service training to “retrain and refresh” themselves in
CLT.
Li’s (1998) study involving 35 Chinese EFL teachers from 11 tertiary institutions
demonstrated that teachers varied in their attitudes toward the introduction of
process writing in initial training sessions. However, Thompson and Bates (1995)
pointed out that one of the beliefs extant in general in-service training is a
misconception, in that attending a training course does not necessarily improve
teachers’ practice. This unrealistic expectation of what training courses can offer
fails to take into consideration teachers’ beliefs, attitudes, and other factors. They
asserted that attending a course is only one part of a complex process in which
theory becomes translated into practice. This in-service training, albeit an

58
important one, must also be connected with other teacher professional
development activities.
Teacher change, particularly changes in their attitudes towards innovation, has
been considered crucial in promoting successful curriculum implementation in the
classroom. Carless (1999a) mentions that teachers’ attitudes are derived primarily
from their own experiences as learners, their professional training, their teaching
experiences, their interaction with colleagues, and the cultural values and norms
of the society in which they live.
In a major review of teachers’ attitudes towards innovation, Stern and Keilslar
(1977) stated that teachers involved in the curriculum planning process have more
favourable attitudes towards the implementation of the subject courses than those
who were required to represent programmes over which they have no control.
They contemplated that teachers’ attitudes can be changed through training
programmes, although certain attitudes are more resistant to modification than
others.
The review of the influence of teacher has been documented in the literature
review. Though the review in this section has not focused on teachers at the NFE,
teachers at the NFE will influence how NFBEC is being implemented. Teacher
factors such as attitude towards the curriculum, teachers training in NFE and their
in-service on NFE curriculum will have an impact on how the curriculum will be
implemented. Teachers’ difficulty in using the curriculum has an impact on the

59
implementation. Kenya does not train teachers in NFE curriculum. Which is why,
teachers at the NFE centres are largely those that have been trained in formal
Teacher Training Colleges (TTCs) who are referred to as P1. Such teachers’,
having been trained for formal schools may find it challenging teaching in NFE
centres. When they are therefore taken as teachers in the centres, they will employ
the teaching methodologies that they learnt at TTCs which are not appropriate for
NFE which implies that they are not able to effectively implement the curriculum.
The study will therefore establish teacher related factors and how they influence
curriculum implementation.
2.8.2 Influence of resource and materials on curriculum implementation
The school's physical facilities or the school plant as it is sometimes called
contributes an important component of the learning environment. The facilities
include the administrative offices, classrooms, libraries, stores and the school
playground. According to Bell and Rhodes (1996), these resources are important
because the school uses them to advance the learning opportunities offered to the
pupils. Anandu (1990) asserts that physical facilities are vital for both teachers
and pupils in the teaching/ learning situations. Any trace of inadequacy leads to
frustration and the motivating factor in terms of comfort diminishes. Physical
facilities that are important in curriculum implementation include classrooms,
libraries, sanitary facilities and play grounds. Nafula and Ngoma (1998) add that
modern teaching environment entails some key characteristics in its physical

60
setting.
Mungai (1992) concurs with Nafula and Ngoma (1998) on the importance of
physical facilities in curriculum implementation. He points out that a teacher
should have a classroom of his/her own. When a teacher has his/her own class he
is able to create an atmosphere that reflects own character and what they have to
offer the pupils who come to them. It helps the teacher to use wall displays as
teaching aids. It means that the teacher can manage the practical supply of
learning materials better.
Teaching / learning materials form the medium through which teaching is carried
out. Teaching/ learning materials can be divided into two categories; those used
by the students and those used by the teachers. Materials used by the teachers are
important because they help teachers prepare schemes of work and lesson notes
which guide them in the course of teaching. They include the syllabi, the teachers’
guides, chalkboard, maps, globe, and pictures. The availability of teaching and
learning materials is very crucial in the advancement of education. On this note,
Republic of Kenya (1976) states, “Books and other materials are the basic tools of
educational development. They must therefore be available to the learner in
adequate quality and quantities. They must also be available at the time they are
required.”
Republic of Kenya (1988) claims that teaching and learning materials should be
planned and utilized in the most effective manner to bring about efficient

61
provision of quality and relevance in education. The importance of teaching and
learning materials is further highlighted by Mungai (1992) who stated that
resources have been in use from the earliest times. This view is echoed by
Nyamok (1997) who states that if a teacher uses the teaching materials
effectively, he will be able to use the time thus created for other educational
activities. Adequate resources take care of the learners’ individual differences and
they encourage learners to participate during the teaching learning process. This
makes learning more interesting to the learners and the learners are made active
during the learning process. Ouma (1987) supports this view by stating that,
resources encourage learners to participate in the learning process, motivates
them, cater for individual differences and enable learners to gain experience by
using their senses.
Appropriate printed media facilitate effective learning in the school. They assist
the learners to learn at their own pace. Once a school has got enough text books, a
teacher can give many exercises to the learner without writing them on the
chalkboard. This saves him/her time of talking and making too many
preparations. Most of the materials arouse learners’ instructions once they appear
interesting (Ellington, 1986). The school therefore requires resources to enable it
implement its various educational tasks.
Resources are vital inputs needed to effectively conduct instructional activities at
all levels of the educational system. Material resources include, ‘those items so

62
designed, modified and prepared to assist teaching/ learning operations. This is
an indication that adequate teaching / learning resources are vital if the quality of
education has to improve. According to the study by (UNESCO, 2005) provision
of instructional materials including textbooks was identified as one of the major
achievements of the FPE programme, particularly through reducing the cost
burden of education on parents and thus leading to an influx of pupils to school.
Thought the above literature focuses on formal education, resources and materials
will in the same way affect curriculum implementation in a NFE setting.
Successful implementation is affected by the nature of the particular school’s
physical and human resources (Rogan & Grayson, 2003). Resources in terms of
human, material, and financial has been considered indispensable in determining
the successful implementation of a curriculum (Carless, 1999a; Li, 1998). Fullan
and Miles (1992) assert that implementation demands resources for training, for
substitutes, for new materials, for new space, and, above all, for time. Kritek
(1976) contended that the problems of resource insufficiency are not likely to be
solved by providing only more money. More importantly, human support in terms
of personnel training and administrator and peer support are believed to
maximally increase the smooth implementation of innovations.
Resources and materials are critical ingredients in learning, and the intended
programme cannot be easily implemented without them. No meaningful teaching
and learning, which is a component of curriculum implementation, takes place
without adequate resource materials (Lockheed et al, 1991). For curriculum to be

63
fully implemented as per plan, schools should be supplied with adequate resource
materials such as textbooks, teaching aids and stationery in order to enable
teachers and learners to play their role satisfactorily in the curriculum
implementation process. Resources and materials are designed to help teachers
better enact the curriculum in practice (Ball & Cohen, 1996). They also play
powerful roles in shaping teaching practice as well as practitioner ideas about
teaching and learning.
One of the prerequisite for running NFE programme for out-of-school children is
the availability of appropriate and local-based curricula packages. They are
important inputs for learning. Without them, it would be very difficult to ensure
the transmission and acquiring of knowledge and skills and the development of
desired attitudes (IIZ/DVV, 2000, No.7; MoE/Ethiopia, 1999). The availability of
resources and materials is, thus, one of the most powerful and consistent
determinants of learning achievement. Inequality in access to such materials is a
major source of rural/urban and regional differences in achievement. Particularly
where teacher quality is poor, the value of curricula materials is even more
important.
The availability and use of resources and materials in developing countries, of
course, have not been widely documented (Lockheed, et al, 1991). Ajayi (1999) in
a study on Relationship between infrastructure availability and curriculum
implementation in Nigerian schools and using 250 respondents found that no

64
significant relationship exists between availability of school facilities and
curriculum implementation in those schools. But in a review of this study,
Anyakogu (2002) opined that a relationship did exist between the availability of
school facilities and implementation of school curriculum. This study was carried
out in formal schools. The current study will establish how resources and
materials influence curriculum implantation in NFE centres.
Tarnate (2001) in his study on Extent of Implementation of Non-Formal
Education (NFE) Program in Elementary Schools in Catanduanes, revealed that
facilities and materials were inadequate, namely: textbooks; teaching guides;
chalkboards; and cassette tapes which negatively affected curriculum
implementation. The findings indicated that there were great shortages of
curricula materials at government-NFBPE centres. Only 16%, 37%, and 2% of the
respondents indicated that adequate textbooks, facilitators’ guides, and
supplementary (source) curricula materials respectively were available at
government-implemented centres. On the other hand, 43%, 49%, and 13% of the
respondents who filled for the NGO-implemented centres indicated that adequate
textbooks, facilitators’ guides, and supplementary (source) curricula materials
respectively were available. The study was carried out in Catanduanes. The
current study aimed at establishing how resources and materials influence
curriculum implementation in the Kenyan context.

65
The above literature has established the influence of resources and materials in
curriculum implementation. Thought the review of literature has focused on
formal education in secondary or primary education, resources and materials as a
key component in teaching and learning will influence the implementation of
NFE curriculum. In many NFE centres in Kenya, shortage of resources and
materials is a major constraint. For example, a study carried out by the GoK and
UNICEF (1995), revealed that the NFE centres had inadequate resources and
facilities which negatively affected NFE curriculum implementation. This study
will therefore establish how resources and materials influence NFBEC in the NFE
centres.
2.8.3 Influence of instructional methods on curriculum implementation
The final destination of any curriculum is the classroom. As we enter the
classroom, decision making becomes the responsibility of the teacher. A teacher
is viewed to be the key learning resource not so much the main source of
knowledge but as the central organizer of learning for their learners. As the
central organizer of learning, the teacher’s use of instructional materials is
paramount as Wasiche (2006) states that the best way of organizing teaching and
learning is to use a variety of instructional methods.
Instruction related factors are also identified as influencing the process of
curriculum implementation and the learning environment. For instance, whether
students are interested in the subject matter and motivated to learn, the connection

66
of subject matter to daily life positively influenced both the curriculum
implementation process and the learning environment. Teachers are therefore
expected to follow the prescribed syllabus exactly and make sure that they do not
miss any topic/component. When teachers diligently follow a prescribed syllabus
in teaching a lesson, then they are considered to have fidelity of use or fidelity of
implementation.
Implementing instruction in the classroom includes specifying instructional or
learning goals, selecting content, selecting learning experiences and choosing
techniques or tasks to evaluate instruction. In planning for instruction lesson plans
are used. A lesson plan is an outline prepared in advance of teaching, so that time
and materials will be used efficiently (Peter, 1975). Ideally, different lessons
require different lesson plans and different students require different lesson plans.
Instructional approaches are important elements during curriculum
implementation. It is assumed that as the curricula change so should the
instructional methodology (MoE, 2011). Wang, Nojan, Strom and Walberg (1984)
posit that for the curriculum to be implemented effectively, alternative
instructional methods need to be adopted too. According to (MoE, 2011) the
learner should be placed at the centre of the teaching and learning process through
methods that actively and meaningfully engage them in learning activities. Such
methods include, group activities, discussion and problem solving.

67
Wasiche (2006) observers that small group instructions during the lesson, a
teacher assisting one student at a time especially weak or low achievers,
encouraging students to demonstrate to each other during the lesson, providing
frequent feedback by giving assignments, marking and revising assignments
immediately, motivating students by providing incentives for any small progress
and encouraging students to interact freely in class are some of the techniques that
can enhance students performance.
Teacher-centred methods of teaching have been common in classroom because,
teachers lacked confidence, mastery of subject matter content and basic teaching
skills (Thijs, 1999), (Howie, 2002) and (Motswiri, 2004). Lack of teaching
material, facilities and time and large class sizes have also made it hard to use
learner-centred method of teaching especially in technical subjects (Howie, 2002).
Although a move away from traditional, a teacher-centred, direct instruction
towards a more student centred, understanding based form of teaching that
focuses on exploration and experimentation is fundamental to many contemporary
reforms in science education, researchers report teachers continuing to teach in the
same way they were taught. Smerdon and Burkam (1999) found that teachers still
view lecture as the most expeditious method for covering a large volume of
material. Therefore students continue to listen, copy notes and watch
demonstrations of experiments in science classes while their teachers lectured.

68
Treagust (1991) also indicates that much of what students are required to do in
classrooms can be tedious and is not intellectually demanding.
According to Ajibola (2008), when instruction is directed towards the needs of the
child, there is an accompanying tendency to make sure that s/he fully understands
the material he is being taught. The focus is no longer on how much a student can
remember, but how he understands; what meaning he makes of his understanding;
and, whether he can apply the knowledge and meaning in real-world situations.
Amuseghan (2007), in discussing English language instruction at the Senior
Secondary School level in Nigeria, points out that most teachers are more
concerned with disseminating facts, information and principles on how to do this
or that than teaching language skills or allowing students to do and learn, practice
and engage in language activities aimed at acquiring communicative skills or
competence.
Offorma (2005) quoted Nwagwu (2003) as noting that technical subjects were not
effectively implemented as most of the subjects are not offered due to lack of
teachers, workshops for practical work, and further noted that delivery was
usually theorised because of lack of competence on the part of the teacher or due
to lack of equipment, thus students graduated without any hands-on experience.
Anyanwu (2000) tested a hypothesis which stated that ‘there will be no significant
relationship between instructional method and implementation of curriculum. A

69
hundred and fifty (150) participants were involved in the study and the Pearson
Product Moment Statistics was used to check if there is a significant relationship
between the instructional methods applied by teachers in the class and the
consequent implementation of the school curriculum.
Literature in this section has established the importance of instructional methods
in curriculum implementation. For effective implementation of NFBEC, teachers
need to use appropriate instructional methods. However different factors will
influence this which includes inadequate or lack of training in NFE and
inadequate or lack of teaching learning materials. Considering that NFE
curriculum encompasses technical subjects, lack or inadequate technical facilities
will affect the implementation of the curriculum. The current study will therefore
establish how instructional methods employed by teachers influence curriculum
implementation.
2.8.4 Influence of learner characteristics on the curriculum implementation
It is important to note that curriculum implementation cannot take place without
the learner. The learner is therefore the central figure in the curriculum
implementation process. Implementation takes place as the learner acquires the
planned or intended experiences, knowledge, skills, ideas and attitudes that are
aimed at enabling the same learner to function effectively in a society (University
of Zimbabwe, 1995).

70
Curriculum activities in any educational jurisdiction must involve learners.
Therefore, the final evaluation of any new curriculum implementation will depend
on whether the new curriculum promotes students’ learning or not. As indicators
of any curriculum outcomes, the leaner’s’ perceptions of curriculum
implementation may eventually determine the extent to which the intended
curriculum is successfully implemented and further sustained.
While teachers are the arbiters of the classroom practice, the learners hold the key
to what is actually transmitted and adopted from the curriculum. The learner
factor influences teachers in their selection of learning experiences, hence the
need to consider the diverse characteristics of learners in curriculum
implementation (Whitaker, 1995).
However, it is still not clear how learners should be involved in the curriculum
implementation phase even though they are the main recipients of the programme.
Learners may be so entrenched in their thinking and behaviour that changes
proposed in the curriculum may not be enthusiastically received. For example,
learners may be used to being given notes by their teachers and the new
programme requires them to make their own notes. Some learners may not know
how to make notes and have to be taught how to go about it. Even getting learners
to participate in discussions may not be well received if they have been
accustomed to being passive recipients of information (Ornstein & Hunkins,
1998). In a study by GoK and UNICEF (1995), data on the attitude of pupils
71
towards NFE indicated that their attitude towards NFE was positive. The pupils in
the study reported that they desired education and wished to continue with
education so as to have a better future.
2.8.5 Influence of the community on curriculum implementation
In NFE programme implementation as in any other curriculum implementation,
the community is central. Unless concerned community members understand,
support, and complement the programme, failure is unavoidable. The community
can influence implementation in that it provides schools with financial resources
to purchase required materials, they demand the inclusion of certain subjects in
the curriculum, it influences learners to reject courses they consider detrimental to
the interests of the group (Buchert, 1998). It is, therefore, important to involve the
community groups at the curriculum planning stage. The prime reason why
implementation fails to achieve its potentials is that it does not receive adequate
support of the community. This confirms that human capital has a unique and
decisive role in NFE programme implementation. The critical support according
to Buchert (1998) is that which comes from below - not from powerful patrons
and sponsors - but from those responsible for implementation.
The community provides the school building and manages the school. The
teachers of NFBES do not have to worry about transfers and, therefore, work with
a missionary zeal (Buchert, 1998). According to PMLC (1996) the programme of
Non-formal Basic Education Schools was implemented through NGOs and

72
community based organisations that identify sites for schools, supervise them,
give inputs, teaching aids and pay remuneration to the teachers. These NGOs also
arranged to provide training to the teachers, form parent-teacher committees at
local levels and held meetings with the teachers and communities.
Besides teachers, learners and school administrators or managers, the community
(parents) also plays an important role in the implementation process. For example,
when parents see a subject being taught in way that is unfamiliar to them, they
naturally have questions about what is going on. When children bring homework
from school that parents feel unable to help with, they feel confused and lost. To
be successful, any new programme needs to be embraced by parents. One way of
reaching out to parents is to organise workshops for them focusing on the new
curriculum. The workshops should be designed to help parents better understand
the content and philosophy of the new programme. Parents need an opportunity to
share their concerns and voice their support in an open forum. These workshops
should be conducted by teachers so that they may explain what is really going on
in the classroom (Sowell, 2000).
Another approach in reaching out to parents is to make available information on
curriculum change on the Internet. For example, the government of the province
of Alberta in Canada has on its website a curriculum handbook for parents
containing information on subjects offered, programmes and courses available in
all schools. (http://www.education.gov.ab.ca/parents/handbooks). Similarly, print-

73
based newsletters can be made available to parents informing them of the changes
that are taking place with the introduction of the new curriculum (Sowell, 2000).
A UNICEF evaluation of NFE in 2004 in Somalia revealed that communities
appreciated NFE activities and were actively participating in youth and civil
society organisations. The evaluation also showed increased participation of girls
(about 54 percent) especially in regions where learning and classroom hours were
set for early evening from around 5.00 pm to 9.00 pm, when most of the
participants had completed household chores and other activities (UNICEF,
2004).
2.9 Completion as a indicator of effective curriculum implementation
NFE provides learners with broader curriculum options that contribute to
completion of the two cycles. According to A Situation Analysis Report on
Education (MDG 2) in Bangladesh: A Baseline for Needs Assessment and
Costing, learner completion is measured in terms of the number of pupils starting
grade I and completing grade V. This has an indication that learners have
successfully completed the cycle and hence curriculum has been successfully
implemented. Learners who are not able to complete an education cycle is an
indicated of unsuccessful curriculum implementation. Learner completion of a
prescribed duration that they are supposed to be in school has been one of the
three indicators for attaining the target set for achieving universal primary
education i.e., MDG 02. Most of NFE initiatives are ‘catch up’ initiatives to assist

74
older children/youth who have missed schooling to complete their basic
education. On attainment of the educational qualifications, the learners can
thereafter be integrated into formal education. According to Aga (2002),
successful implementation of Non-Formal Basic Primary Education Programs
was the number of learners who had completed the NFE cycle. According to
Republic of Kenya (2012), the major objective of NFE is that learners are able to
complete the education cycles which enables them engage themselves in other
activities including transiting to formal education for those who are interested. It
therefore implies that learners who not be interested in proceeding with education
an engage themselves in other activities. The emphasis is not academic
performance but ability to complete the NFE cycle hence completion is the
measure of an effective curriculum implementation. This study therefore used
learner completion (completeall) as the measure of curriculum implementation
which was the criterion variable.
2.10 Theoretical basis for curriculum implementation
The study was based on change theory by Fullan and Miles (1991). The theory
has been used by Arnott Daryl George (1994) in the study on Factors affecting
the Implementation of an Elementary Science Curriculum in three Northern
Saskatchewan Provincial Schools. The study was similar to the current study
since it was of factors affecting curriculum implementation hence it was deemed
significant for this study.

75
Based on his research in 1965, Fullan (1981) states that there are factors that
influence curriculum implementation which are also quite large and variable. He
categorizes these factors into three broad categories namely characteristics of the
innovation, characteristics of the implementing unit or situation, and macro or
socio-political factors. Fullan (1981) states that change is a journey. He
formulated a conceptual framework for investigating the implementation of
educational change. He states that for successful implementation, changes have to
be introduced to the users effectively (Fullan & Miles, 2001), and this requires
knowledgeable and experienced change facilitators.
Implementation is explained as putting new ideas into practice (Fullan, 2001).
According to him, curriculum implementation can be described as a dynamic
construct, which refers to the process of continuous specification and redefinition
of the essential characteristics of an innovation by developers and users during the
planning and implementation phases of the planned change process (Fullan &
Pomfret, 1977). He further states that one cannot really know what is going to be
significant until he or she is into the implementation process. The various phases
of the change process can take varying lengths of time and are not linear, but
rather are a process in which events at one phase can give feed back to alter
decisions made at a previous stage which then work their way through in a
continuous interactive way (Fullan, 1991).

76
The study specifically focuses on the second phase of Fullan’s change theory,
usually called implementation. In the implementation phase participants attempt
to use the curriculum in order to change their practice. The implementation phase
focuses on the actual use of the curriculum. Assessing the implementation
processes as this study is doing is concerned with the nature and extent of actual
change, as well as the factors and processes that influence how and what changes
are achieved.
This theory is important in this study since the study aims at assessing how
NFBEC implementation is being carried out and what factors that influences it.
Since this study entails the implementation of the NFBEC, the change theory of is
used to bring forth factors affecting the implementation. This is important because
it is important for different stakeholders to be aware of the problems faced in
implementing the NFBEC curriculum hence if possible or find ways of dealing
with them.
2.11 Conceptual framework
The conceptual framework of this study is presented in Figure 1.

77
Figure 1
Interrelationship between Variables in the NFE Basic Education Curriculum Implementation
RESOURCES AND MATERIALS
Availability Adequacy Appropriateness
Learners’ completion of NFE cycle
CURRICULUM IMPLEMENTATION
TEACHER CHARACTERISTICS
Gender Age marital status Level of education Length of service at
NFE centre
INSTRUCTIONAL METHODS
Lecture Group discussions Individual Presentation Role play Question and answer Project
CURRICULUM DEVELOPMENT AT KIE
LEARNER CHARACTERISTICS Attitude Entry behaviour Learners family
background Age

78
The framework is based on the input, process, output and outcome model. The
framework focuses on the stages of curriculum development, implementation and
how it aims at achieving the desired educational outcomes. The framework shows
that once the curriculum has been developed at the KIE, it is implemented at the
NFECs. During the implementation, various factors such as teacher
characteristics, resources and materials, instructional methods and learner
characteristics (inputs) influence the implementation. When these factors are
favourable, then the curriculum is effectively implemented and hence will
achieving the desired educational output which is completing the NFE cycle.

79
CHAPTER THREE
RESEARCH METHODOLOGY
3.1 Introduction
This chapter explains the methods applied in carrying out this research study. The
chapter contains the following sections: research design; target population;
sample and sampling procedures; research instruments; validity and reliability of
the instruments; administration of the instruments, and data analysis techniques.
3.2 Research design
The design for this study was cross-sectional survey. According to Fowler (2003),
cross-sectional surveys are used to gather information on a population at a single
point in time. In this type of research study, either the entire population or a
subset thereof is selected, and from, data are collected to help answer research
questions of interest. Bryman (2008) contends that cross-sectional design helps to
deal with various categories or cases simultaneously and this matches with the use
of mixed methodology for this research. The design relies on existing
phenomenon at the time of data collection than change resulting from
interventions.
Cross-sectional design was preferred because of its ability to deal with various
cases and variables, and its suitability with quantitative and qualitative methods

80
(Bryman, 2008). Cross-sectional design was preferred because the study cut
across three cities. The information about factors that were gathered represented
how the curriculum was being implemented at only one point in time. This design
was, therefore, deemed suitable for this study because the researcher collected
data at a particular point in time, across the three cities, when events had occurred
with an intention of assessing how non formal basic education curriculum had
been implemented. Using the cross sectional survey, the study assessed how
teacher characteristics, learner characteristics, adequacy and appropriateness of
resources and materials, instructional methods, community, and director
characteristics had influenced the implementation of NFBE curriculum.
3.3 Target population
The target population of this study comprised of all the NFE centres in Nairobi,
Mombasa and Kisumu urban towns, that is, all the pupils, teachers, NFE service
providers and community leaders in these centres. There were 14 NFE centres in
Nairobi, 10 in Mombasa and 12 in Kisumu that had implemented the Non-formal
basic education curriculum. In these centres, there were 96 teachers, 36 directors
and 750 learners(KIE, 2010).
3.4 Sample and sampling techniques
The study employed purposeful sampling using maximum variation sampling.
Patton (1978) quoted in Casley and Kumor (1995) states that when the researcher
cannot meet the requirements of probability sampling, “purposeful” sampling can
81
be used. Maximum variation sampling involves purposefully picking a wide range
of variation on dimensions of interest. Patton further explains that this strategy
aims at capturing and describing the central themes or principal outcomes that cut
across a great deal of participants.
Purposive sampling was used to identify NFE centres and respondents for data
collection. This meant identifying centres that were implementing the NF basic
education curriculum. Selection took into account the following: (i) accessibility,
(ii) that the centres were open and functioning, (iii) that they were implementing
the NF basic education curriculum programme (iv) availability of the relevant
people to be interviewed. NFE teachers, learners, and directors of the NFE centres
were identified as respondents. The reason for choosing purposeful sampling
procedure was therefore used to identify information-rich sources such as
teachers, community leaders, directors and the learners who were the key players
in the implementation of NFE curriculum.
The sample size, therefore, comprised all the 36 directors, 96 teachers and 300
learners. To sample the pupils, convenience sampling was used. According to
Nagle and Williams (no date). Focues groups do not use probability or random
samples. Focus groups generally utilize convenience sampling. Nagle and
Williams further state that focus groups should have between 7 to 12 members. In
this study the researcher selected 10 pupils for the FGD from each of the centres.
82
3.5 Research instrumentation
The research used a mixed methods approach. Various names are used to refer to
this approach but all the terms refer to one thing in different words and the most
common term is mixed methods research (Greene, Benjamin, & Goodyear, 2001).
Mixed methods approach as the name suggests is where quantitative and
qualitative methodologies are combined in carrying out a study to accomplish the
research goals, which require diverse information from diverse stakeholders
(Greene, et al, 2001).
In this study, mixing was carried out through triangulation. According to Bryman
(2008) triangulation entails using more than one method or data in the study of a
social phenomena resulting in greater confidence in findings. The use of different
data collecting methods helped the research to deal with the complexities of
studying the implementation of NFE curriculum at the NFE centres.
Six data collection methods were used, which included: questionnaire for the
directors and teachers the of institutions, focus group discussion guide for
learners, observation checklist for materials and resources, lesson observation
schedule, and documents analysis. These instruments are discussed below.
3.5.1 Questionnaires
There were two sets of questionnaires; one for the teachers and one for the
directors of the institutions. These instruments were designed for self-completion

83
by directors and the teachers. The preference for a questionnaire for teachers was
based on the fact that directors and the teachers were able to complete it without
help, they were anonymous, and were cheaper and quicker than other methods
while reaching out to these two categories of respondents sample (Bryman, 2008;
Cohen et al., 2007). Questionnaire for the teachers and the directors provided in-
depth data about their attitudes and perspectives about the implementation of NFE
curriculum.
3.5.1.1 Questionnaire for directors
The questionnaire for the directors was divided into six sections A to F. Section A
focused on the personal information which included gender, age, length of
service, marital status, level of education and duration at the centre. Section B
comprised five items which focused on the information about the centre which
included name, year of establishment, reasons for its establishment, ownership of
the centre and the services other than education that centre offered.
Section C contained 10 items both structured and unstructured, which focused on
teacher characteristics such as their numbers, qualifications, challenges faced in
acquiring them, payment of teachers, teacher turnover, induction, and challenges
that teachers faced in teaching at the centre. Section D comprised on five
structured and unstructured items that focused on materials and resources. These
included information of acquisition, challenges in acquiring them, appropriateness
of the materials and resources. Section E consisted four items that focused on the
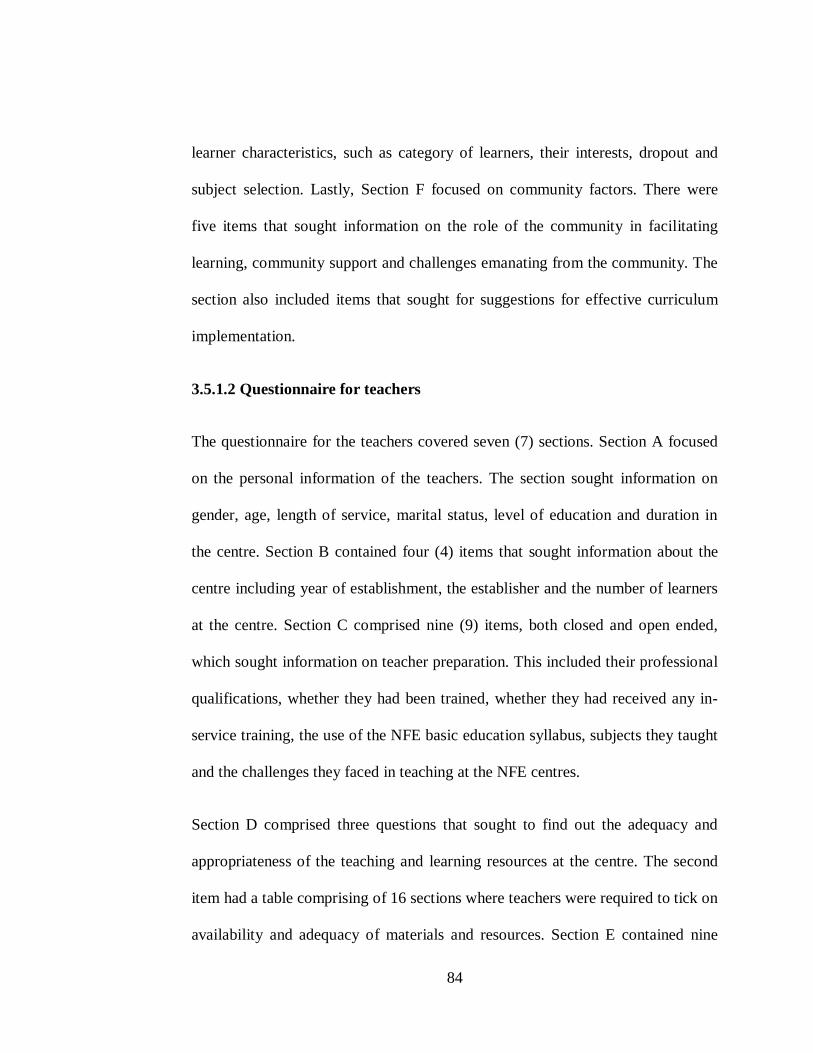
84
learner characteristics, such as category of learners, their interests, dropout and
subject selection. Lastly, Section F focused on community factors. There were
five items that sought information on the role of the community in facilitating
learning, community support and challenges emanating from the community. The
section also included items that sought for suggestions for effective curriculum
implementation.
3.5.1.2 Questionnaire for teachers
The questionnaire for the teachers covered seven (7) sections. Section A focused
on the personal information of the teachers. The section sought information on
gender, age, length of service, marital status, level of education and duration in
the centre. Section B contained four (4) items that sought information about the
centre including year of establishment, the establisher and the number of learners
at the centre. Section C comprised nine (9) items, both closed and open ended,
which sought information on teacher preparation. This included their professional
qualifications, whether they had been trained, whether they had received any in-
service training, the use of the NFE basic education syllabus, subjects they taught
and the challenges they faced in teaching at the NFE centres.
Section D comprised three questions that sought to find out the adequacy and
appropriateness of the teaching and learning resources at the centre. The second
item had a table comprising of 16 sections where teachers were required to tick on
availability and adequacy of materials and resources. Section E contained nine

85
items that sought information on learner characteristics. These items were both
structured and unstructured. One item in the section contained 20 5-point Likert-
type statements that sought the perceptions of the teachers towards the NFE basic
education curriculum implementation in the centres. Lastly, Section G had seven
items that sought information on the influence of the community on the
curriculum implementation. The section had an item that teachers required to
recommend what various stakeholders should do so that NFE curriculum is
effectively implemented.
3.5.2 Focus group discussion guide for learners
The focus group discussion is said to be a type of group interview where the
participants interact, argue and make joint contribution on the topic of concern
rather than making individualised contributions (Bryman, 2008). The focus group
discussion conducted with the learners and the community members provided an
interactive forum through which participants gave information which otherwise
would not have been obtained through individual interviews or individual
questionnaire. This provided the advantage of exploring issues of interest in a
broad, free and interesting style where participants shared and debated. Each
group chose a chairperson and a secretary to regulate their discussion. In the
processes, all the outputs of the discussions were written down by the research
after a consensus on a given point was reached. The focus group discussion
(FGD) for this study involved a total of 300 learners, as Bryman (2008) asserts

86
that a FGD may involve more than 50 participants. The 300 participants were then
divided into 36 groups according to the number of centres under study.
The focus group discussion guide for the community members had two major
sections. The first section sought information about the name of the centre, name
of the town, number of discussants and their gender compositions and the name of
the recorder. The second section contained eleven items for discussion that sought
information based on the research objectives.
3.5.3 Observation checklist for materials and resources
The observation checklist for materials and resources comprised two sections.
The first section dwelt on the information about the centre, the service provider,
the number of teachers and number of learners. The second section contained a
table in which the researcher was supposed to tick on the availability and
appropriateness of materials/resources and facilities.
3.5.4 Lesson observation schedule
This tool was included in the research instruments to purposefully seek
information on how the teachers conducted instruction. This was carried out after
the realisation that there was need for an instrument to evaluate the instructional
methods used by the teachers. The lesson observation schedule was used to find
out how teachers prepared the schemes of work and lesson plan. It was also used

87
to find out the teaching methods that teachers employed and how appropriate the
instructional methods were.
3.5.5 Document analysis guide
This instrument was designed to seek information about the centres. The
document analysis sought information on the number of the learners that had
participated in the programme since its inception, the completion rates, the
dropout rates, the number of learners who had joined the formal schools and the
different activities that learners were involved in after completion of the
programme. More importantly this tool served as the measure of depended
variable.
3.6 Pilot study
A pilot study was carried out in Nakuru town among five NFE centres where the
implementation of the NFBE curriculum has been done. This was done to
determine whether there were ambiguities in any item, if the instruments could
elicit the type of data anticipated, to indicate whether the research objectives had
been appropriately addressed, thus enhancing validity and reliability. It was also
done to indicate whether the type of data collected would be meaningfully
analysed in relation to the stated research objectives and questions (Kinyua
2001).The pilot study revealed deficiencies in the instruments which were
addressed before main study.

88
3.6.1 Validity of the instruments
Validity determines whether the research truly measures that which it is intended
to measure or how truthful the research results are (Joppe, 2000, Polit and Beck,
2004). In this research, all the seven research tools covered the same over-lapping
themes and objectives so that the data obtained clarified, illustrated and
complemented each other. This harmonisation helped strengthen the validity of
the research as a whole. The use triangulation helped in the strengthening of the
research, as Robson (2002) argues that triangulation “enhances the rigor of the
research”. He further adds that the triangulation of methods, methodology and the
data can help reduce researcher bias, respondent bias and threat to validity. This
process gave this research sound basis to claim that it had established its
objectives. Content validity was used to check the representation of the research
questions in the research instruments. This was done in consultation with the
supervisors who examined the representativeness of the questionnaires content in
order to determine the content validity. They indicated the areas that content
needed readjustment. The draft questionnaire was piloted for validity and
reliability. The pilot study indicated areas that needed readjustments or alterations
as follows.
The teachers’ questionnaire contained seven sections which were reduced to six
after piloting. Items that were not in line with the research objectives were
corrected after the pilot test. The initial teachers’ questionnaire previously

89
contained a number of items that were close ended to elicit a ‘yes’ and ‘no’
response. The supervisors advised that there was need to provide room for
explanation on the responses provided to add value to the close ended items. The
teachers’ questionnaire covered 41 items prior to pretesting. These questions were
reduced to 33 with a number of them having been merged. The same procedure
described for the teachers’ questionnaire was followed in validating other
instruments. That is, the supervisors discussed and examined the questionnaire,
focus group discussion, lesson observation schedule, observation checklist, and
document analysis and appropriate amendments were made.
3.6.2 Reliability of the instruments
Reliability refers to the extent to which results are consistent over time and an
accurate representation of the total population under study. If the results of a study
can be reproduced under a similar methodology, then the research instrument is
considered to be reliable (Joppe, 2000). It also refers to the consistency of scores
obtained by the same persons when re-examined with the same test on different
occasions or with different sets of equivalent sets of items (Anasstasi, 1988). An
instrument that has adequate test-retest reliability gives the same result if an
individual is re-tested while remaining in a similar conditions. The study used
test retest method of testing for reliability of the instruments. Test- Retest
reliability "shows the extent to which scores on a test can be generalized over
different occasions" (Anastasi, 1988). Test-retest reliability was more relevant in

90
the setting of this study because the constructs we attempt to measure were
heterogeneous. the two separate administrations were only 2 weeks apart; the time
was deemed short enough so that the respondents skills in the area being assessed
had not changed through additional learning. The relationship between the
respondents' scores from the two different administrations was estimated, through
statistical correlation, to determine how similar the scores were. In this study, the
Pearson Product Moment Correlation (r) was used to assess the test/retest
reliability. The reliability coefficient for the teachers and directors questionnaires
revealed coefficients of r=0.87 and r=0.82 respectively hence the instruments
were deemed reliable.
3.7 Administration of the instruments
Permit to conduct the research was obtained from the National Council for
Science and Technology (NCST). The researcher then booked appointments with
the directors of the NFE centres. Data were collected for two days in each of the
centres. On the first day, the researcher visited the centres, met and discussed the
purpose of the visit with the directors who also introduced the researcher the
teachers and learners. The researcher then administered the questionnaires to the
directors and the teachers. As the questionnaires were filled by the teachers and
the directors, the researcher filled in the observation checklist, on the same day
the researcher conducted lesson observation. The researcher organised with the
directors on how he could access the community members. On the second day of

91
data collection, the researcher was introduced to the community members by the
directors, created rapport with them and explained the purpose of the study. The
researcher then conducted the FGD with them. When through with the community
members, the researcher conducted FGD with the learners and lastly did the
document analysis. In some centres it was not possible to collect data in two days.
He however organised with the directors on when to do what was not possible in
the two days.
3.8 Data analysis techniques
Once data had been collected, it was cleaned which involved determining
inaccurate, incomplete, or unreasonable data to improve the quality through
correction of detected errors and omissions. This study generated both qualitative
and quantitative data. According to Patton (1990), massive qualitative data
collection from questionnaire, focus group discussion and observation guide
needs to be organised into significant patterns to reveal the essence of the data.
The questionnaire generated both quantitative and qualitative data while the focus
group discussion generated qualitative data. Quantitative data, on the other hand,
mainly from the questionnaires, was first cleaned, edited for any irregularities,
and the close-ended responses coded. Data was then entered in the computer
using Epi Info and STATA and then exported to the Predictive Analytics
SoftWare (PASW) for eventual cleaning and analysis. Logical checks and

92
frequency runs were made on all variables to further the accuracy and consistency
of the data and identify any outliers before actual data analysis.
The study employed multiple regressions to generate models for various
variables. In the process of generating a model, the researcher identified several
predictor variables for each of the objective correlated all identified variables
against the criterion variable (completion rates) to determine how strongly the
variables related. Correlation coefficients have a value between -1 and +1. A
positive coefficient means that x and y values increases and decrease in the same
direction. A negative correlation means that as x and y move in opposite
directions where one increases as the other decreases. Coefficient of 0 means x
and y are associated randomly. Multiple regressions were performed to show the
cumulative effect of the regression results. In regression analysis the R value is
the slope of the linear regression model, such that if the R value is close to 0 the
change in y (dependent) over relative to the change in x (predictor variable) is
very small, the larger this value is, the less random the values are.
During the process of data entry the following key was used in labelling the
variables.
_14 Item 14 in the teacher questionnaire
_17a Item 17a in the teacher questionnaire
_18 Item 18 in the teacher questionnaire
_19 Item 19 in the teacher questionnaire

93
_22a Item 22a in the teacher questionnaire
_27 Item 27 in the teacher questionnaire
_28 Item 28 in the teacher questionnaire
completeall Number of learners who had completed to programme
inservicetraining In-service training
qualification Qualifications
requiredmaterials Required materials available in the school
teacherinduction Teacher induction

94
CHAPTER FOUR
DATA ANALYSIS AND INTERPRETATION
4.1 Introduction
This chapter presents the analysis of data that was gathered from the field. The
chapter is divided into several sections. These include the response rate of the
directors’ and teachers’ questionnaires and the demographic data of the directors
and the teachers. The chapter thereafter presents the analysis of data based on the
research objectives. The items in the questionnaires were grouped into themes on
the research objectives. The data from the focus group discussions were
harmonized with the findings in the questionnaires and other tools. The data were
presented by use of frequency distribution tables, and bar graphs. The analysis
where appropriate was presented across cities namely Kisumu, Nairobi and
Mombasa and a total results of the three cities.
4.2 Response rate
This section of the chapter presents the response rate of the targeted population
namely the directors of the NFE centres and the teachers. Out of the 36
questionnaires administered to the directors, 32 (88.9%) were returned. Out of 96
questionnaires administered to the teachers, 77 (80.2%) were returned.

95
4.3 Demographic data of the respondents
The analysis of the demographic data of the respondents was divided into two
sections. First, the demographic data of the directors of the NFE centres were
presented and later the demographic data of the teachers at the NFE centres.
4.3.1 Demographic information on directors of institutions
The researcher sought to establish the gender of the directors of the NFE centres.
The directors were therefore asked to indicate their gender. The data is presented
in Table 1.
Table 1
Gender of the Directors
Gender Region Total
Kisumu Nairobi Mombasa
f % f % F % f %
Male 10 90.9 6 54.5 6 75.0% 22 73.3
Female 1 9.1 5 45.5 2 25.0 8 26.7
Total 11 100.0 11 100.0 8 100.0 30 100.0
Data on the gender of the directors indicated that majority 22 (73.3%) were male.
Kisumu urban centre recorded the highest percentage of males at 10 (90.9%)
while Nairobi recorded the highest percentage of females at 5 (45.5%), who

96
managed the NFE centres. These findings were confirmed by the observation
checklist.
Age distribution of the directors is presented in Figure 2.
Figure 2
Age Distribution of the Directors
Data on the age of the directors indicated that most of the directors were aged
between 26 and 30 years and a relatively lower number aged between 31 and 40
years. Kisumu urban centre had the highest number of directors aged between 31
and 40 years. One of the reasons that could be attributed to this situation is that
most of the directors were people who had completed college and were looking
for jobs they had found themselves in the centres. Consequently, they made
directors since they had a qualification higher than others at the centre.
Age in years Percentage

97
It was also observed that most of the directors who were above 40 years of age
were the initiators of the programmes. These were people who had been working
in other centres and had opted to start a centre on their own and hence assuming
directorship. A practical example was found in Mombasa where most of the
directors had previously working at the Mwokoeni NFE centre, apparently the
first NFE centre in Mombasa town. The then Minister of Education Prof. Sam
Ongeri had launched the NFE curriculum in 1996 at this centre. Some of the staff
in this centre later became directors of other centres such as Olive Rehabilitation
and Shanzu Educational Centre.
The directors were also asked to indicate the length of service at the NFE centres.
The results are presented in Figure 3.
Figure 3
Length of Service in NFE Centres
Data on the level of service at the NFE centre indicated that most of the directors
had served at NFE centres for a duration of between 5 and 10 years as recorded by
Percentage
Length of service

98
14 of them (46.7%), followed by those that had served for a duration of between
11 and 15 years as recorded by 9 or 30%. NFE centres are faced with a myriad of
challenges one of them being staff turnover. This has resulted to having
employees who work for a short time in a centre and thereafter seek for greener
pastures.
The researcher further sought to establish the level of education of the directors.
The data is presented in Figure 4.
Figure 4
Distribution of Directors by Level of Education
Data on the level of education showed that most of the directors of the NFE
centres had either a P1 certificate which is a certificate for trained primary school
teachers, or a Diploma as recorded by 11 directors (39.3%) in both categories.
There is no specific qualification that is required for one to be a director at NFE
Level of education
Percentage

99
centre. With the availability of many P1 certificate holders as a result of the
government ceasing to employ teachers, there are those who seek to work at the
NFE centres, and hence are given responsibilities of heading the institutions.
Table 2 presents the duration at the current centre.
Table 2
Duration of Directors at the Current Centre
Duration in the centre Region Total
Kisumu Nairobi Mombasa
f % F % f % f %
Below 5 years 1 10 3 33.3 3 37.5 7 25.9
5 – 10 years 6 60 5 55.6 1 12.5 12 44.4
11 – 15 years 3 30 1 11.1 4 50.0 8 29.7
Total 10 100 8 100 9 100 27 100
Data on the duration that the directors had served in the current centre showed
that most had served for a duration of between 5 and 10 years as recorded by 12
(44.4%). This is attributed to the fact that most of teachers usually seek for
greener pastures since they feel that the monetary gains and working conditions at
the NFE centres are not conducive. Those that have been working for longer
durations may have been those that have retired from teaching or are the
proprietors of the institutions and hence would be at the institution for a longer
time.

100
4.3.2 Demographic data of teachers at the NFE centres
The demographic data of the teachers focused on their gender, age, length of
service, their marital status, level of education and duration they had been in the
centre. The gender of teachers at the NFE centres is presented in Table 3.
Table 3
Distribution of Teachers’ Gender Across the Cities
Gender Region Total
Kisumu Nairobi Mombasa
f % F % F % f %
Male 4 33.3 21 61.8 14 60.9 39 56.5
Female 8 66.7 13 38.2 9 39.1 30 43.5
Total 12 100.0 34 100.0 23 100.0 69 100.0
The data showed that apart from Kisumu where majority of teachers 8 (66.7%)
were female; all the other centres had male teachers as the majority. The data
implies that males were more dominant in the NFE centres. Over all data
indicated that 39 (56.5%) were male while 30 (43.5%) were females. Although
there is no specified number of how many males or females should be at the NFE
centre, there would be a need to establish why fewer females than males are
teaching at the NFE centres.
Teachers’ distribution by age is presented in Figure 5
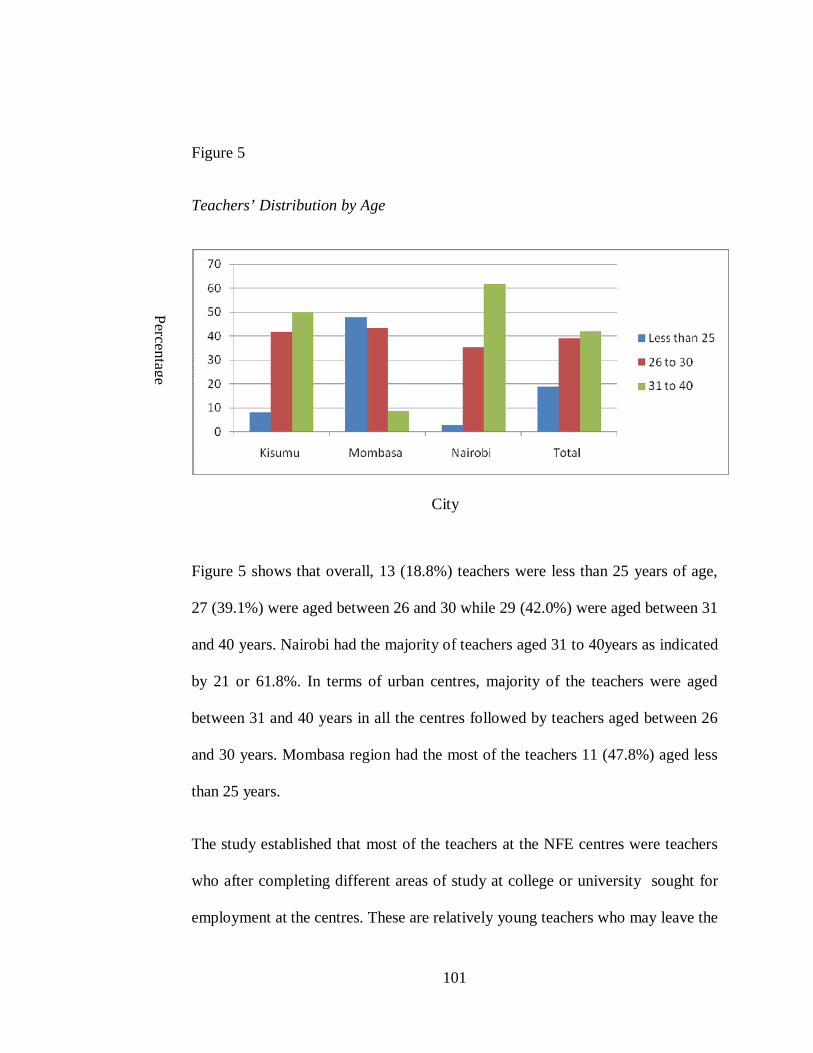
101
Figure 5
Teachers’ Distribution by Age
Figure 5 shows that overall, 13 (18.8%) teachers were less than 25 years of age,
27 (39.1%) were aged between 26 and 30 while 29 (42.0%) were aged between 31
and 40 years. Nairobi had the majority of teachers aged 31 to 40years as indicated
by 21 or 61.8%. In terms of urban centres, majority of the teachers were aged
between 31 and 40 years in all the centres followed by teachers aged between 26
and 30 years. Mombasa region had the most of the teachers 11 (47.8%) aged less
than 25 years.
The study established that most of the teachers at the NFE centres were teachers
who after completing different areas of study at college or university sought for
employment at the centres. These are relatively young teachers who may leave the
Percentage
City

102
centres once they found better jobs, hence their high presence at the NFE centres.
One of the teachers in Kisumu stated that he had been working at the centre for 10
years since he graduated from a primary Teacher Training College (TTC). Asked
why all that time at the centres he told the researcher that he had not found
employment with the Teachers’ Service Commission (TSC) where he would
immediately move if such an opportunity arose.
The distribution of teachers by length of service is presented in Figure 6.
Figure 6
Distribution of Teachers by Length of Service
Data on the duration of service that the teachers had in the NFE centres indicated
that most of the teachers had been at the NFE for between 5 and 10 years. Nairobi
region had the highest number of teachers in that category as indicated by 29
teachers or 82.7%., while Mombasa region had the majority of teachers, 16
Duration in years
Percentage
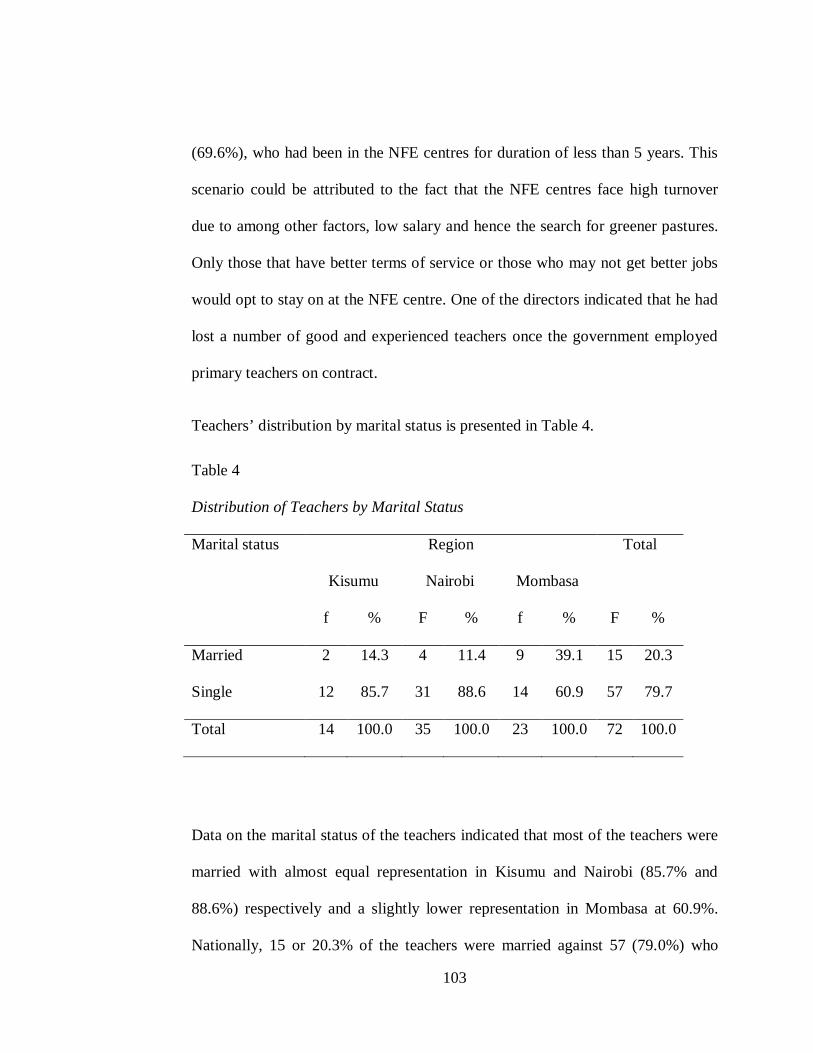
103
(69.6%), who had been in the NFE centres for duration of less than 5 years. This
scenario could be attributed to the fact that the NFE centres face high turnover
due to among other factors, low salary and hence the search for greener pastures.
Only those that have better terms of service or those who may not get better jobs
would opt to stay on at the NFE centre. One of the directors indicated that he had
lost a number of good and experienced teachers once the government employed
primary teachers on contract.
Teachers’ distribution by marital status is presented in Table 4.
Table 4
Distribution of Teachers by Marital Status
Marital status Region Total
Kisumu Nairobi Mombasa
f % F % f % F %
Married 2 14.3 4 11.4 9 39.1 15 20.3
Single 12 85.7 31 88.6 14 60.9 57 79.7
Total 14 100.0 35 100.0 23 100.0 72 100.0
Data on the marital status of the teachers indicated that most of the teachers were
married with almost equal representation in Kisumu and Nairobi (85.7% and
88.6%) respectively and a slightly lower representation in Mombasa at 60.9%.
Nationally, 15 or 20.3% of the teachers were married against 57 (79.0%) who

104
were single. The data show that most of the teachers involved in teaching NFE
centres are mostly single. This could be attributed to the fact that most of them are
relatively young, those who have either completed secondary education or
certificate courses and are looking for something to do as they seek further
education or employment.
Teachers’ distribution by level of education is presented in Figure 7.
Figure 7
Distribution of Teachers by Level of Education
Data on the level of education revealed that most of the teachers at the NFE
centres had a P1 certificate, with Kisumu having the highest number, 9 (64.3%
followed by Nairobi with 17 (51.5%) and Mombasa with 5 or 22.7%. It is only
Mombasa had teachers who had received training in NFE at 9 teachers (40.9%).
Level of education
Percentage

105
Teachers with technical education followed those with P1 certificate with Nairobi
and Kisumu leading with 10 (30.3%) and 4 (28.6%) respectively and no technical
teacher at Mombasa urban centre. As applied to the directors of the NFE centres,
the same scenario is applicable to teachers where with the availability of many P1
certificate holders or other courses out there, there are those who seek to teach
and work at the NFE.
It is interesting to observe that there were teaches who had been trained in NFE.
This is attributed to the fact that some of the learners who have completed NFE
were later on employed in the same centre as teachers, some of them have been
provided with skills at the centres and are presumed to be able to handle this
group of learners.
Teachers’ duration at the centre is presented in Figure 8.

106
Figure 8
Distribution of Teachers’ by Duration in the Centres
Data showed that majority of teachers 33 (49.3%) had been at the centre for
between 5 and 10 years with Nairobi having the highest number at 21 (67.4%)
followed by Kisumu and Mombasa. There were very few teachers who had been
at the centre for above 10 years. This finding could be attributed to the high
turnover rate among teachers at the NFE centres.
4.4. Influence of teacher characteristics on NFBE curriculum
implementation
The first research objective was to determine how teacher characteristics
influenced the implementation of Non-formal basic education curriculum at the
non-formal education (NFE) centres in Kisumu, Nairobi and Mombasa urban
centres. The study therefore examined aspects of teacher characteristics among
other factors, teachers’ demographic data, teacher adequacy, and attitude that
Duration
Percentage

107
influenced the NFBE curriculum implementation at the NFE centres. It is in this
regard that the directors of the centres were asked to indicate whether they had
adequate teachers in their centres. Their responses are presented in Table 5.
Table 5
Directors’ Responses on Adequacy of Teachers
Adequacy Region Total
Kisumu Nairobi Mombasa
f % f % f % f %
Yes 10 90.9 8 72.7 5 55.6 23 74.2
No1 1 9.1 3 27.3 4 44.4 8 25.8
Total 11 100 9 100 11 100 31 100
Data on the adequacy of teachers at the NFE centres indicated that all the centres
had adequate teachers with Kisumu having the highest rating 10 or 90.9%.
Nationally, 23 (74.2%) of the centres had adequate teachers. The data shows that
there were adequate teachers at the NFE centres. The availability and adequacy of
teachers could be attributed to the fact that graduates from different fields at time
work as volunteers at the centres.
The directors were also asked to indicate whether there were specific
qualifications that the centres required for one to be a teacher. Data indicated that

108
there were specific qualifications as reported by 29 (96.7%). Asked to indicate the
qualifications that were required, they responded as presented in Figure 9.
Figure 9
Directors’ Responses on Minimum Qualifications Required for Teachers
Data on the minimum qualifications that were required for teachers indicated that
most of the centres required KCSE certificate as indicated by 24 (80%) of the
directors. A small percentage (27.3%) of the directors in Nairobi required Form
Four certificate holders. It is presumed that pupils who have completed class 8 are
able to teach basic reading and writing. More so, those who have completed form
four are better placed to do so. However Standard 8 leavers may not be in a
position to demand high pay hence they are cost effective in running the
City
Percentage

109
institutions, are able to stay longer unlike Form Four leavers who may wish to go
for further studies and certificates holders who may seek for greener pastures.
Asked whether they faced challenges acquiring trained teachers for the centres,
majority of the directors 29 (96.7%) indicated that they did with all the directors
in Kisumu and Nairobi reporting in the affirmative. Asked to indicate some of the
challenges that they faced when accessing teachers, they responded as shown in
Table 6.
Table 6
Challenges Faced by Directors in Acquiring Trained Teachers
Challenges Region Total
Kisumu Nairobi Mombasa
f % f % f % f %
Teachers’ unwillingness to
teach at the NFE
8
72.7
8
80.0
1
16.7
17
63.0
Poor salaries 3 27.3 1 10.0 5 83.3 9 33.3
Others 0 00 1 10.0 0 00 1 3.7
Total 11 100 10 100 6 100 27 100
Data on the challenges that the directors faced were predominantly teachers
unwillingness to teach at NFE centres as recorded by 17 (63.0%). Challenges
relating to poor salary was recorded by 9 (33.3%) with Mombasa leading at
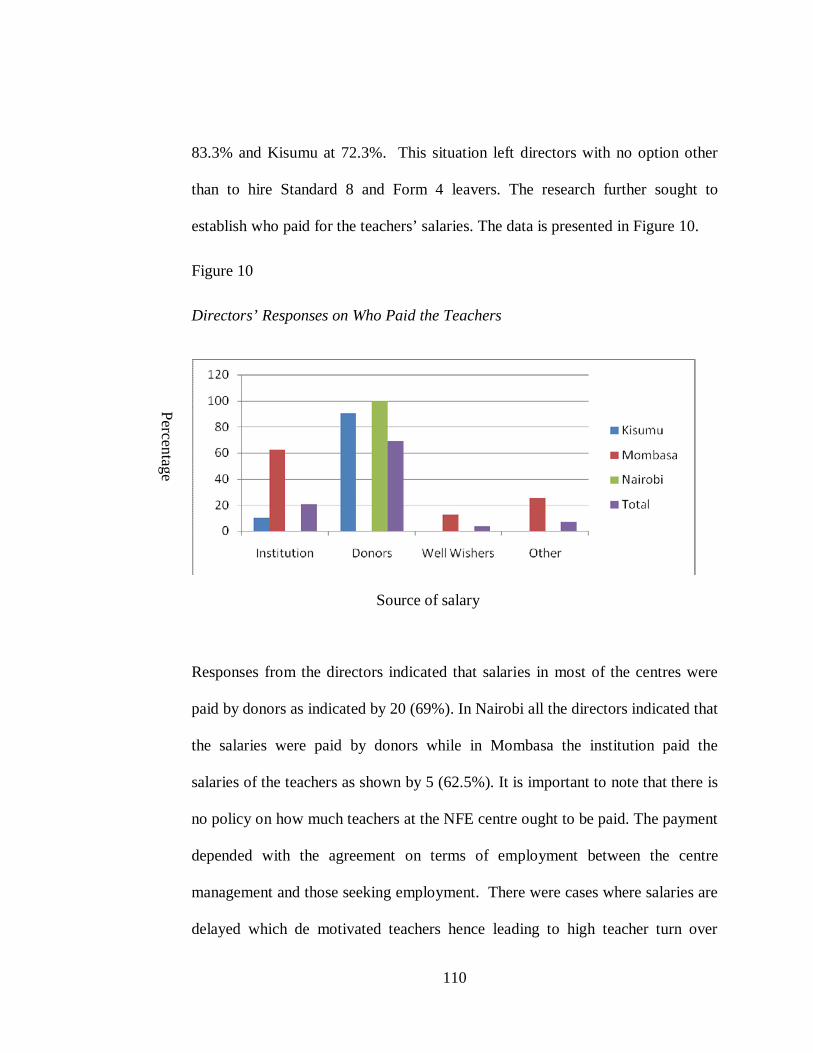
110
83.3% and Kisumu at 72.3%. This situation left directors with no option other
than to hire Standard 8 and Form 4 leavers. The research further sought to
establish who paid for the teachers’ salaries. The data is presented in Figure 10.
Figure 10
Directors’ Responses on Who Paid the Teachers
Responses from the directors indicated that salaries in most of the centres were
paid by donors as indicated by 20 (69%). In Nairobi all the directors indicated that
the salaries were paid by donors while in Mombasa the institution paid the
salaries of the teachers as shown by 5 (62.5%). It is important to note that there is
no policy on how much teachers at the NFE centre ought to be paid. The payment
depended with the agreement on terms of employment between the centre
management and those seeking employment. There were cases where salaries are
delayed which de motivated teachers hence leading to high teacher turn over
Source of salary
Percentage

111
which ultimately affected curriculum implementation. These findings with the
findings of a study by Elimu Kwa Wanakijiji (2004) that Non-Formal school
teachers were characterized by low remuneration levels, little benefits, low morale
and self esteem, lack of job security, high turnover, low levels of academic and
professional training and very limited opportunities for training, including in-
service training. Most teachers were sustained by voluntary spirit and not salary.
The study further sought to establish the extent of teacher turn over in the NFE
centres. In this regard, the directors were asked to rate the teacher turn over in
their institutions. The data is presented in Figure 11.
Figure 11
Directors’ Responses on Teacher Turnover Rates
Data on the rate of teaches turnover was high as recorded by 20 or 71.4%.
Regionally, Nairobi recorded the highest number of teacher turnover at 81.8%
City
Percentage

112
followed by Kisumu at 77.8% and lastly Mombasa at 50%. Asked to indicate the
reasons for turnover, they responded as shown in Table 7.
Table 7
Reasons for Teacher Turnover
Reason Urban centre Total
Kisumu Nairobi Mombasa
f % F % f % f %
Poor salary 8 88.9 8 80 5 62.5 21 77.8
Better employment 1 11.1 2 20 3 37.5 6 22.2
Total 9 100 10 100 8 100 27 100
Data on reasons for teachers turn over were mostly poor salaries as indicated by
21 or 77.8%. The same was recorded equally at Kisumu and Nairobi while
Mombasa recorded 62.5%. As explained above, salary issues mostly contributed
to teachers’ turn over hence affecting curriculum implementation. When asked to
indicate the challenges that teachers faced while teaching at the NFE centres, the
participants gave the following response presented in Figure 12.
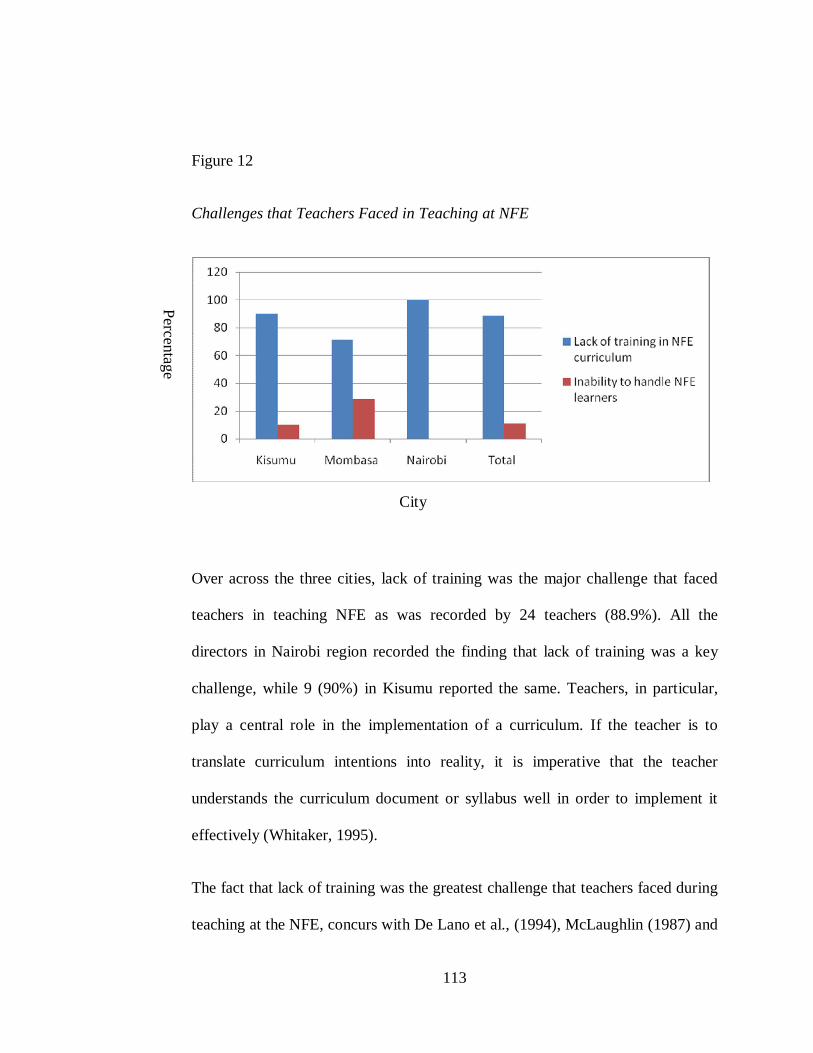
113
Figure 12
Challenges that Teachers Faced in Teaching at NFE
Over across the three cities, lack of training was the major challenge that faced
teachers in teaching NFE as was recorded by 24 teachers (88.9%). All the
directors in Nairobi region recorded the finding that lack of training was a key
challenge, while 9 (90%) in Kisumu reported the same. Teachers, in particular,
play a central role in the implementation of a curriculum. If the teacher is to
translate curriculum intentions into reality, it is imperative that the teacher
understands the curriculum document or syllabus well in order to implement it
effectively (Whitaker, 1995).
The fact that lack of training was the greatest challenge that teachers faced during
teaching at the NFE, concurs with De Lano et al., (1994), McLaughlin (1987) and
Percentage
City

114
White (1993) who observed that in order that curriculum policy is translated into
practice and to ensure that successful implementation exists in the classroom, it is
paramount that teachers receive in-service training and provision of ongoing
support and professional development.
The teachers were further asked to indicate their professional qualifications. The
data is presented in Figure 13.
Figure 13
Teachers’ Professional Qualifications
Data on the professional qualification of the teachers indicated that most of the
teachers at the NFE were professionally trained as presented in Figure 14.
Percentage
City

115
Figure 14
Teachers’ Responses on Training Received
Data showed that most of the teachers were trained as P1 but not in NFE. Lack of
training in NFE implied that teachers could not adequately implement the NFE
curriculum. The teachers were also asked to indicate whether they had received
in-service training on the NFE curriculum. The data is tabulated in Figure 15.
Percentage
City
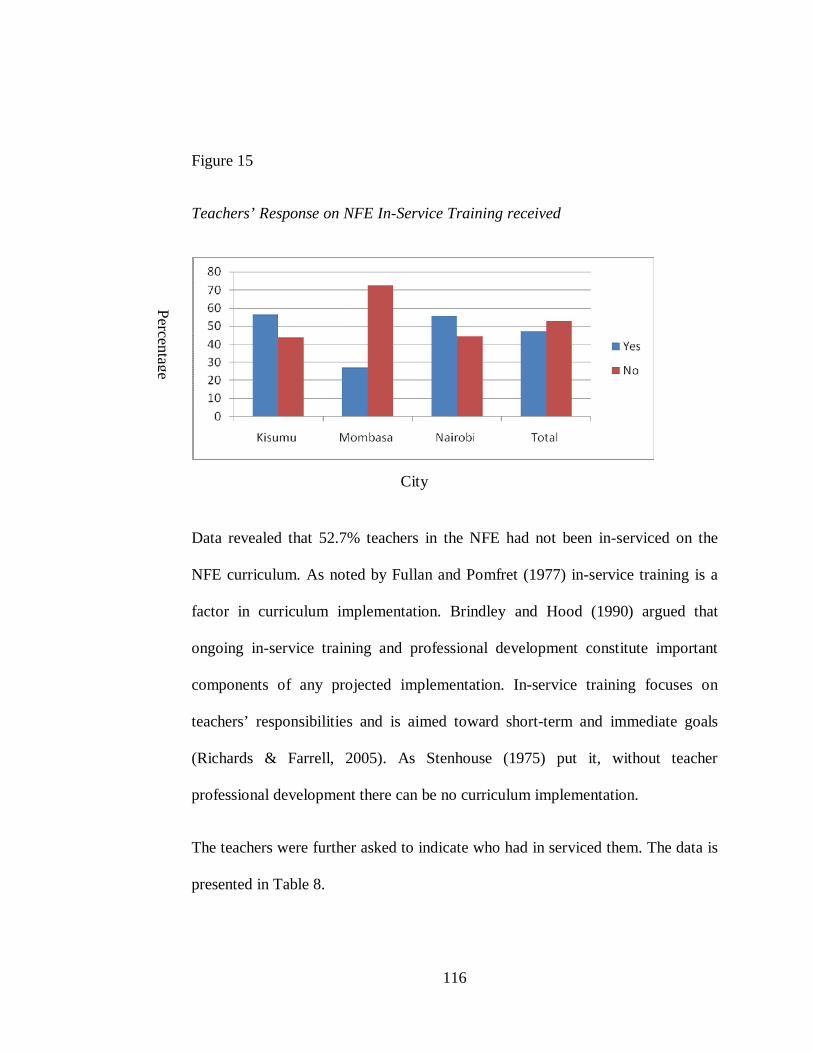
116
Figure 15
Teachers’ Response on NFE In-Service Training received
Data revealed that 52.7% teachers in the NFE had not been in-serviced on the
NFE curriculum. As noted by Fullan and Pomfret (1977) in-service training is a
factor in curriculum implementation. Brindley and Hood (1990) argued that
ongoing in-service training and professional development constitute important
components of any projected implementation. In-service training focuses on
teachers’ responsibilities and is aimed toward short-term and immediate goals
(Richards & Farrell, 2005). As Stenhouse (1975) put it, without teacher
professional development there can be no curriculum implementation.
The teachers were further asked to indicate who had in serviced them. The data is
presented in Table 8.
City
Percentage
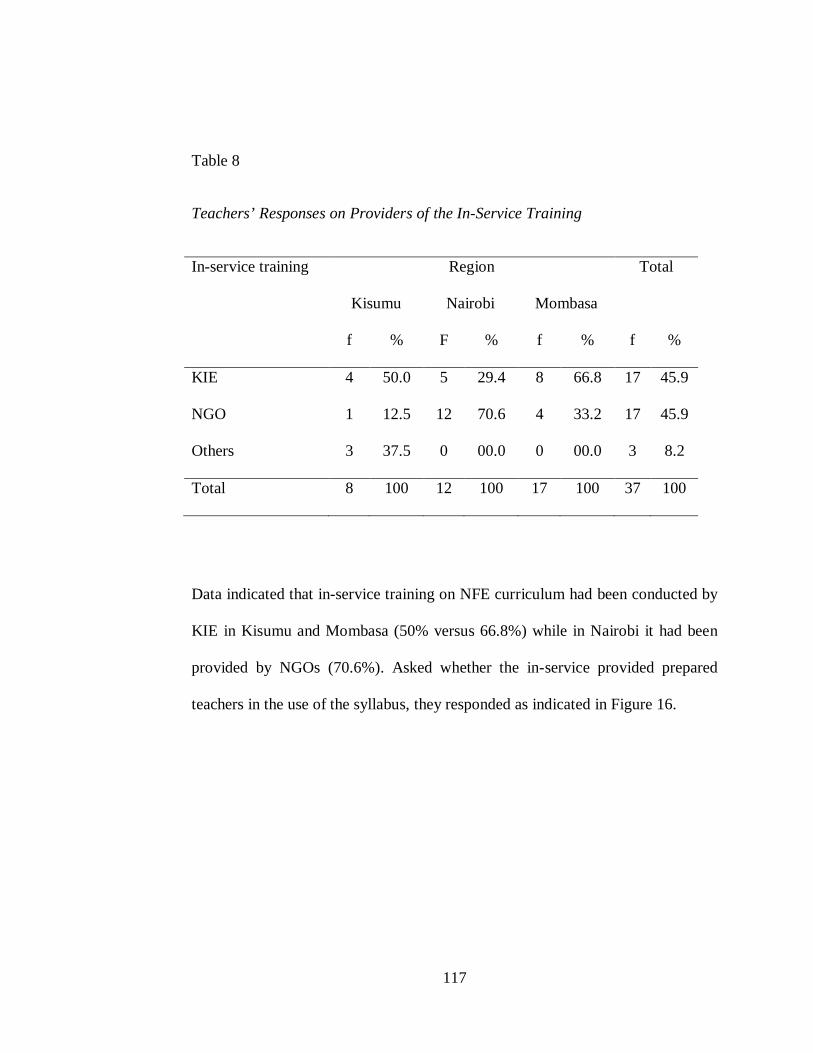
117
Table 8
Teachers’ Responses on Providers of the In-Service Training
In-service training Region Total
Kisumu Nairobi Mombasa
f % F % f % f %
KIE 4 50.0 5 29.4 8 66.8 17 45.9
NGO 1 12.5 12 70.6 4 33.2 17 45.9
Others 3 37.5 0 00.0 0 00.0 3 8.2
Total 8 100 12 100 17 100 37 100
Data indicated that in-service training on NFE curriculum had been conducted by
KIE in Kisumu and Mombasa (50% versus 66.8%) while in Nairobi it had been
provided by NGOs (70.6%). Asked whether the in-service provided prepared
teachers in the use of the syllabus, they responded as indicated in Figure 16.

118
Figure 16
Teachers’ In-Service on Curriculum Use
Data revealed that the in-service training offered prepared teacher for the use of
the curriculum as indicated by 36 (58.1%). This finding indicate that teachers who
had received in-service training were in a better position to implement the
curriculum as Fullan and Pomfret (1977) puts it that in-service training is a factor
in curriculum implementation. Teachers were further asked to indicate whether
they used the NFBE curriculum. Their responses are presented in Table 9.
City
Percentage

119
Table 9
Teachers’ Use of NFE Curriculum in the NFE Centres
Curriculum use Region Total
Kisumu Nairobi Mombasa
f % F % f % f %
Yes 16 94.1 27 75 14 82.4 57 81.4
No 1 5.9 9 25 3 17.6 13 18.6
Total 17 100 36 100 17 100 70 100
Data indicated that most of the teachers used the NFE curriculum as shown by 57
(81.4%) while 13 (18.6%) did not use it. This finding could be attributed to the
fact that most of the centres were using the NFE curriculum while others were
using the 8-4-4 curriculum. Contrary to the common opinion that NFE centres had
stopped using the NFE curriculum, this study established that the NFE curriculum
was actually in use. However, it was observed during the research that the centres
were slowly reverting to formal curriculum due to the cost implications.
In a specific example in Mombasa, the researcher observed that the curriculum
was best in use when the donors funded the centres by provision of technical
subjects’ resources but once over, it was difficult to teach those subjects hence
adopting the 8-4-4 curriculum. It was also observed that most of the centres
preferred the latter since the centres were slowly adopting the formal schooling,
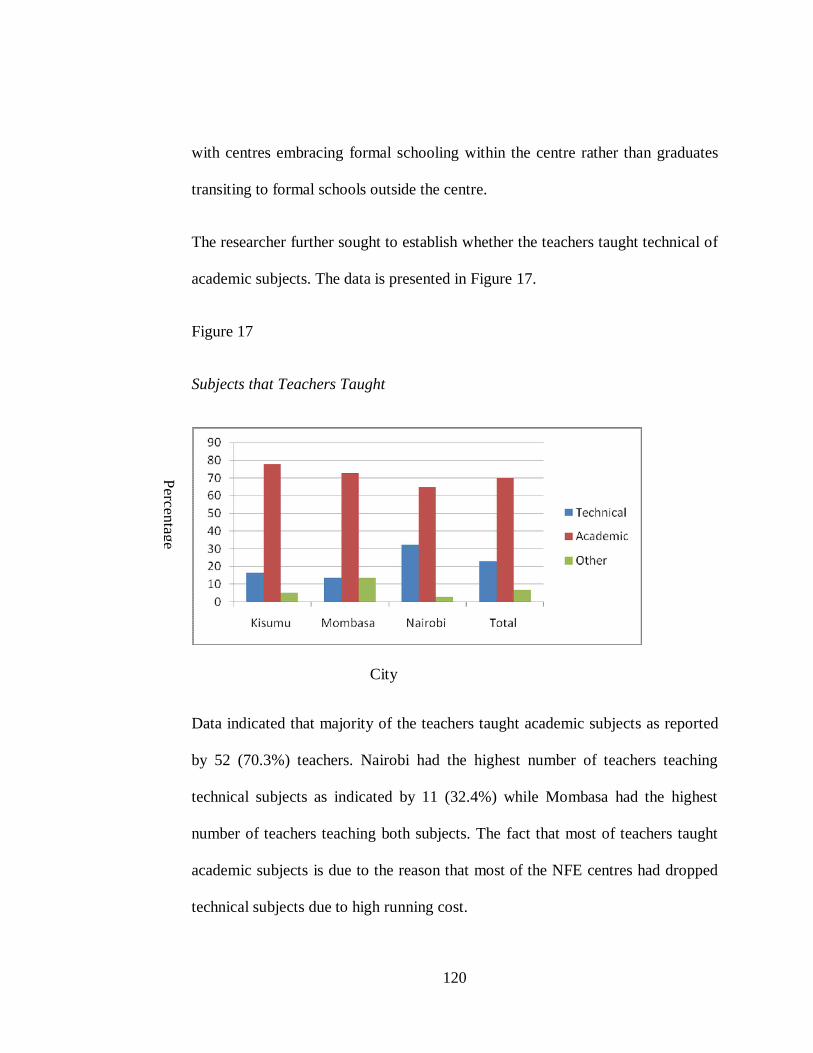
120
with centres embracing formal schooling within the centre rather than graduates
transiting to formal schools outside the centre.
The researcher further sought to establish whether the teachers taught technical of
academic subjects. The data is presented in Figure 17.
Figure 17
Subjects that Teachers Taught
Data indicated that majority of the teachers taught academic subjects as reported
by 52 (70.3%) teachers. Nairobi had the highest number of teachers teaching
technical subjects as indicated by 11 (32.4%) while Mombasa had the highest
number of teachers teaching both subjects. The fact that most of teachers taught
academic subjects is due to the reason that most of the NFE centres had dropped
technical subjects due to high running cost.
City
Percentage
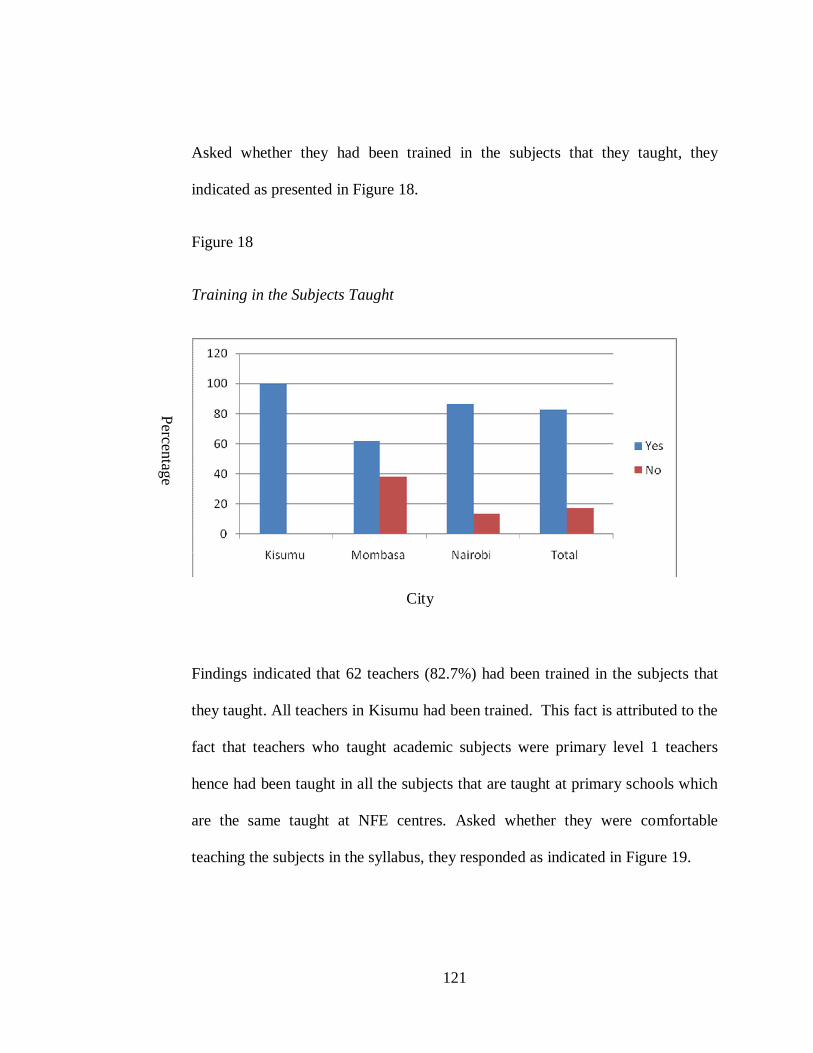
121
Asked whether they had been trained in the subjects that they taught, they
indicated as presented in Figure 18.
Figure 18
Training in the Subjects Taught
Findings indicated that 62 teachers (82.7%) had been trained in the subjects that
they taught. All teachers in Kisumu had been trained. This fact is attributed to the
fact that teachers who taught academic subjects were primary level 1 teachers
hence had been taught in all the subjects that are taught at primary schools which
are the same taught at NFE centres. Asked whether they were comfortable
teaching the subjects in the syllabus, they responded as indicated in Figure 19.
Percentage
City

122
Figure 19
Teachers’ Responses on Whether They Were Comfortable Teaching
Data on whether teachers were comfortable teaching the subjects in the syllabus
indicated that 6 (16.7%) and 5 (22.7%) teachers in Nairobi and Mombasa
respectively were not comfortable. All teachers in Kisumu were comfortable since
they had received training. These findings agree with Cheng and Wang (2004), Li
(1998), Wang and Han, (2002) who deemed in-service training as critical in
successful curriculum implementation. The study further sought to establish the
challenges that teachers faced while teaching. They responded as indicated in
Figure 20
Percentage
City
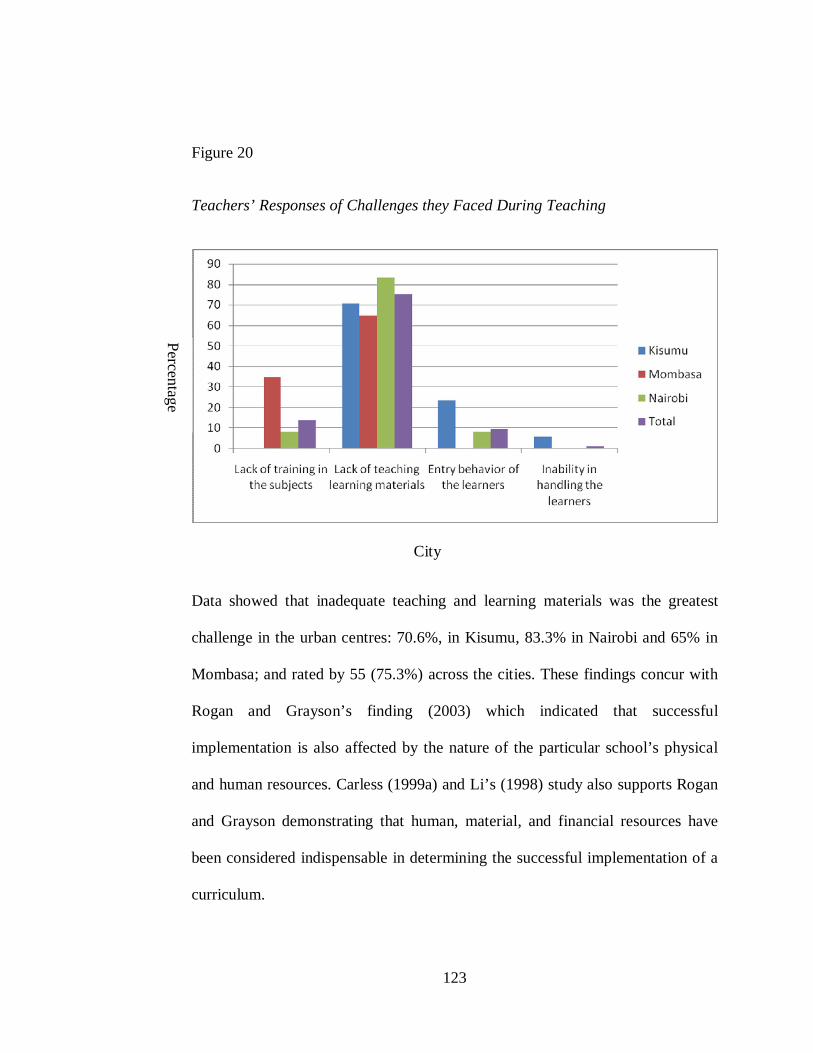
123
Figure 20
Teachers’ Responses of Challenges they Faced During Teaching
Data showed that inadequate teaching and learning materials was the greatest
challenge in the urban centres: 70.6%, in Kisumu, 83.3% in Nairobi and 65% in
Mombasa; and rated by 55 (75.3%) across the cities. These findings concur with
Rogan and Grayson’s finding (2003) which indicated that successful
implementation is also affected by the nature of the particular school’s physical
and human resources. Carless (1999a) and Li’s (1998) study also supports Rogan
and Grayson demonstrating that human, material, and financial resources have
been considered indispensable in determining the successful implementation of a
curriculum.
City
Percentage

124
Hargreaves (1989) claimed that “change in the curriculum is not effected without
some concomitant change in the teacher”. It is on the basis of this that the
researcher sought to determine teachers’ attitude towards NFE curriculum
implementation. To determine the teachers’ attitude towards the NFE curriculum
implementation, the teachers were required to indicate how they agreed or
disagreed with the statements on a Likert scale of strongly agree (SA), Agree (A),
Undecided (U), disagree (D) and strongly disagree (SD). These were scored as SA
= 4, A = 4, U = 3, D = 2 and SD = 1. The total sum of the responses for the Likert
questions in one item were counted from SA to SD. These were added up and
then divided by 5 which was the number of the options in the Likert. The scores
obtained were multiplied by the value in each category and then divided by the
total sum. Dividing the sum by 5 revealed the mean. The data is presented in
Table 10.

125
Table 10
Teachers’ Attitude Towards NFE Curriculum
SN Statement Mean rating % 1 The NFE curriculum is of lower quality than the formal curriculum 2.9 58.0 2 The NFE curriculum does not address the needs of the learners 2.7 54.0 3 The curriculum has no difference with the formal one in terms of content 3.2 64.0 4 The lifestyle of the learners hinder their learning 3.8 76.0 5 Lack of training affects the NFE curriculum implementation 4.0 80.0 6 The lifestyle of the learners hinder curriculum implementation 3.5 70.0 7 The learners appreciate the NFE curriculum 3.8 76.0 8 Teachers at the NFE centres are able to fully implement the curriculum 3.8 76.0 9 The NFE curriculum should be rolled out to other towns to cater for learners who require NFE 4.1 82.0 10 Teachers at the centres were involved in the NFE curriculum development 3.8 76.0 11 Most learners feel the NFE curriculum is helpful to them 3.9 78.0 12 The NFE curriculum has enabled learners join the formal schools 3.8 76.0 13 It is difficult to teach all the subjects as stipulated in the syllabus 3.7 74.0 14 The community around the centre approve of the NFE centre 3.9 78.0 15 Lack of teaching materials hinder the curriculum implementation 3.9 78.0 16 The community fully supports the NFE centres 3.8 76.0 17 The mode of learning in levels is not realistic 3.3 66.0 18 Most of the learners are able to join the formal system after completion at the NFE centres 3.5 70.0 19 The curriculum content should be re-designed to fit the learners needs 3.9 78.0 20 The community around does not support the NFE curriculum 3.6 72.0 Total mean score 4.0 73.0
Data on the attitude of the teachers towards the NFE indicated that the teachers were positive towards the NFE curriculum.
This was indicated by a coefficient of 4.0 which was agree (A) or an equivalent of 73% who were positive towards the
NFE curriculum.
126
Punch and McAtee (1979) explored teachers’ attitudes toward the new
Achievement Certificate System in Western Australia among 841 secondary
school teachers. They established that teachers’ knowledge about, and
participation in the change, and their general attitude to education served as
independent variables while implementation served as the dependent variable.
In a major review of teachers’ attitudes towards innovation, Stern and Keilslar
(1977) noted that teachers involved in the curriculum planning process had more
favourable attitudes towards the implementation of the subject courses than those
who were required to represent programmes over which they had no control.
To establish whether teacher characteristics such as gender, age, length of service,
marital status, level of education and duration of service at the centre influenced
curriculum implementation, categorical regression were carried out against
learner completion rates (completeall). Table 11 displays the regression results for
the teacher characteristics.

127
Table 11
Correlations of Selected Teacher Characteristics against Completion Rates
Ordered probit regression
Number of obs = 602
LR chi2(6) = 55.54
Prob > chi2 = 0.0000
Log likelihood = -1981.4632
Pseudo R2 = 0.0138
completeall Coef.
Std.
Error z P>z
[95% Confidence
Interval]
Gender 0.010606 0.088256 0.12 0.904 -0.16237 0.183583
Age 0.180287 0.076878 2.35 0.019 0.029609 0.330964
Length of service 0.169785 0.08034 2.11 0.035 0.012323 0.327248
Marital status 0.115097 0.107952 1.07 0.286 -0.09648 0.326678
Level of education -0.01733 0.022124 -0.78 0.433 -0.0607 0.026029
Duration at the centre 0.141482 0.060812 2.33 0.02 0.022292 0.260671
Data shows Prob>chi2 =0.000. The p-value of the model is shown in the table above
for each of the variables regressed against completion rate. It indicates the reliability
of X to predict Y. For a statistically significant relationship the p-value should be
lower than 0.05. R-square shows the amount of variance of Y explained by X. In this
case the model explains 1.38% of the variance in completion rate.
The data showed that gender has a p value of 0.01 which is lower than 0.05,
(significant level) hence was statistically significant in explaining completion
rates. The coefficient for gender was 0.18028 which meant for a one unit increase

128
in completion rates there was a 0.180 increase in gender. It should be noted that
gender is binomial where we used 1 for males and 2 for females. The nature of the
variable and the notation therefore suggested that the increase in females favoured
completion rates. Females are more likely to influence completion rates.
As per the age, it has a p value of 0.03 which is lower than significant level (0.05)
hence it was revealed that age was statistically significant in explaining
completion rates. The coefficient was determined to be 0.169 which means for
every increase in age at 0.169 there was a one unit increase in completion rates.
This implies the regression model definitively determined a relationship between
the age and completion rate.
For the variable that teachers had served at the centre, the data dealt with a
categorical variable. The data showed that the length of service had a p value of
0.28 which was higher than 0.05 hence length of service was not statistically
significant in determining completion rates. This implied that the regression
model did not definitively determine a relationship between the completion rate
and the teachers’ service.
It was further observed that marital status was not statistically significant with p
value of 0.43 which implies that the regression model cannot definitively
determined a relationship between the completion rate and the marital status. The
duration at the centre was statistically significant. This was shown by a p value of
0.02 which was lower than 0.05. This implied that the regression model

129
definitively determined a relationship between the completion rate and the said
variable. The coefficient was determined to be 0.14148 which meant that for a
one unit increase in completion rates you will need a 0.14148 increase in duration
at the centre.
4.5. Influence of adequacy of resources and materials on the NFBEC
implementation
Rogan & Grayson, (2003) state that successful implementation is affected by the
nature of the particular school’s physical and human resources. This position is
affirmed by Carless (1999) and Li (1998) who states that resources in terms of
human, material, and financial has been considered indispensable in determining
the successful implementation of a curriculum. It is on this basis that the study
sought to establish the how adequacy at the NFE centres influenced NFBE
curriculum. To establish the adequacy of resources and materials at the centres,
the observation checklist was used together with an item in the teachers’
questionnaire which sought teachers’ responses on adequacy of resources and
materials. The data is presented in Table 12.

130
Table 12
Teachers’ Responses on Availability and Adequacy of Materials and Resources
Material and resource Available Adequate
F % F %
NFE basic education syllabus 63 79.7 6 7.6
Teachers' guide 49 62.0 9 11.4
School timetable 72 91.1 12 15.2
Pupils' text books/writing slates 72 91.1 72 15.2
Boards and chalk 74 93.7 12 15.2
Pens/pencils 71 89.9 10 12.7
Pupils' exercise books 17 21.5 17 100.0
Wall charts 27 34.2 10 12.7
Wall maps 20 25.3 5 6.3
Desks/chairs 25 31.6 15 60.0
Agricultural area 1 1.3 1 100
Agricultural equipment 2 5.0 4 5.0
Art and craft tools 6 7.5 3 3.7
Woodwork tools 5 6.3 5 6.3
Welding and fabrication equipment 6 7.5 5 6.3
Garment making tools 8 10.1 5 62.5
Motor vehicles mechanics equipment 1 1.3 1 100
Home science equipment 5 6.3 5 100
131
Data showed that most of the centres did not have facilities for technical subjects,
for example only 1 (1.3%) had agricultural land, 2 (5%) had agricultural
equipment, 5 (6.3%) had Art and Craft tools, 6 (7.5%) had wood work tools, 6
(7.5%) had welding and fabrication equipment and only 1 (1.3%) centre had
motor vehicle mechanic and equipment. While it is a requirement by the NFBEC
that the centres have these equipments, it implies that the curriculum cannot be
implemented in the centres since the facilities were missing.
The study also sought to establish the appropriate and availability of the resources
and materials. Table 13 presents the data as observed by the researcher.
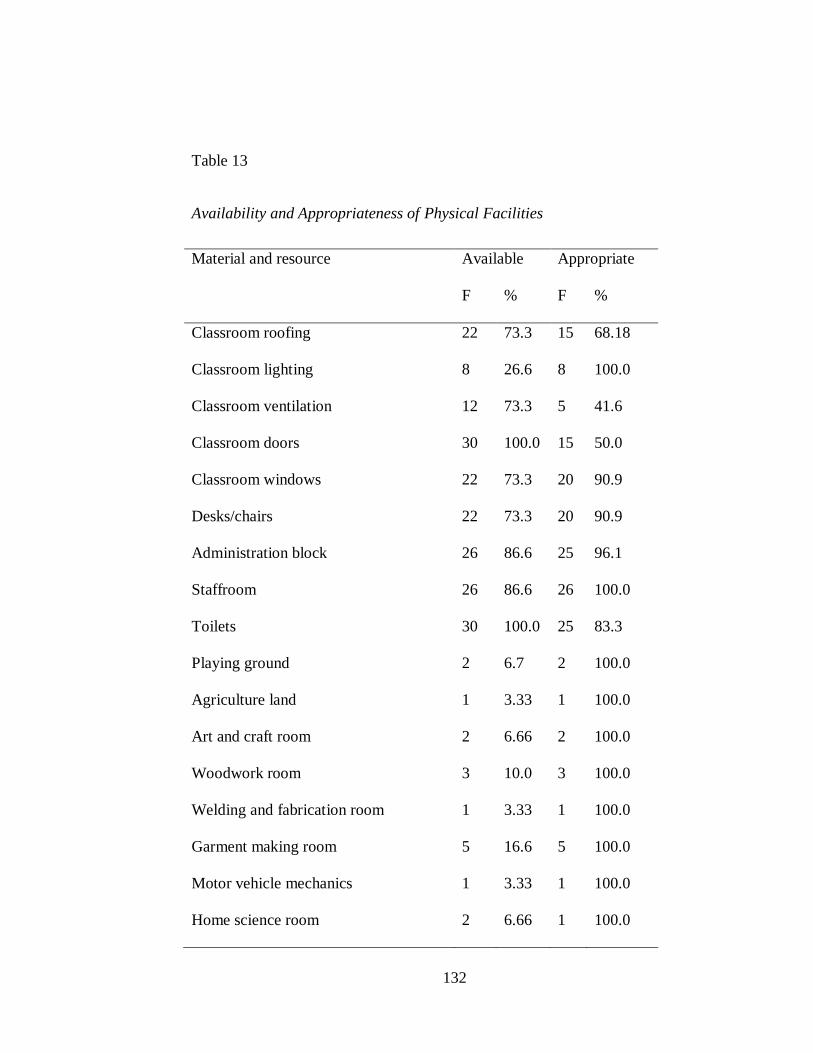
132
Table 13
Availability and Appropriateness of Physical Facilities
Material and resource Available Appropriate
F % F %
Classroom roofing 22 73.3 15 68.18
Classroom lighting 8 26.6 8 100.0
Classroom ventilation 12 73.3 5 41.6
Classroom doors 30 100.0 15 50.0
Classroom windows 22 73.3 20 90.9
Desks/chairs 22 73.3 20 90.9
Administration block 26 86.6 25 96.1
Staffroom 26 86.6 26 100.0
Toilets 30 100.0 25 83.3
Playing ground 2 6.7 2 100.0
Agriculture land 1 3.33 1 100.0
Art and craft room 2 6.66 2 100.0
Woodwork room 3 10.0 3 100.0
Welding and fabrication room 1 3.33 1 100.0
Garment making room 5 16.6 5 100.0
Motor vehicle mechanics 1 3.33 1 100.0
Home science room 2 6.66 1 100.0
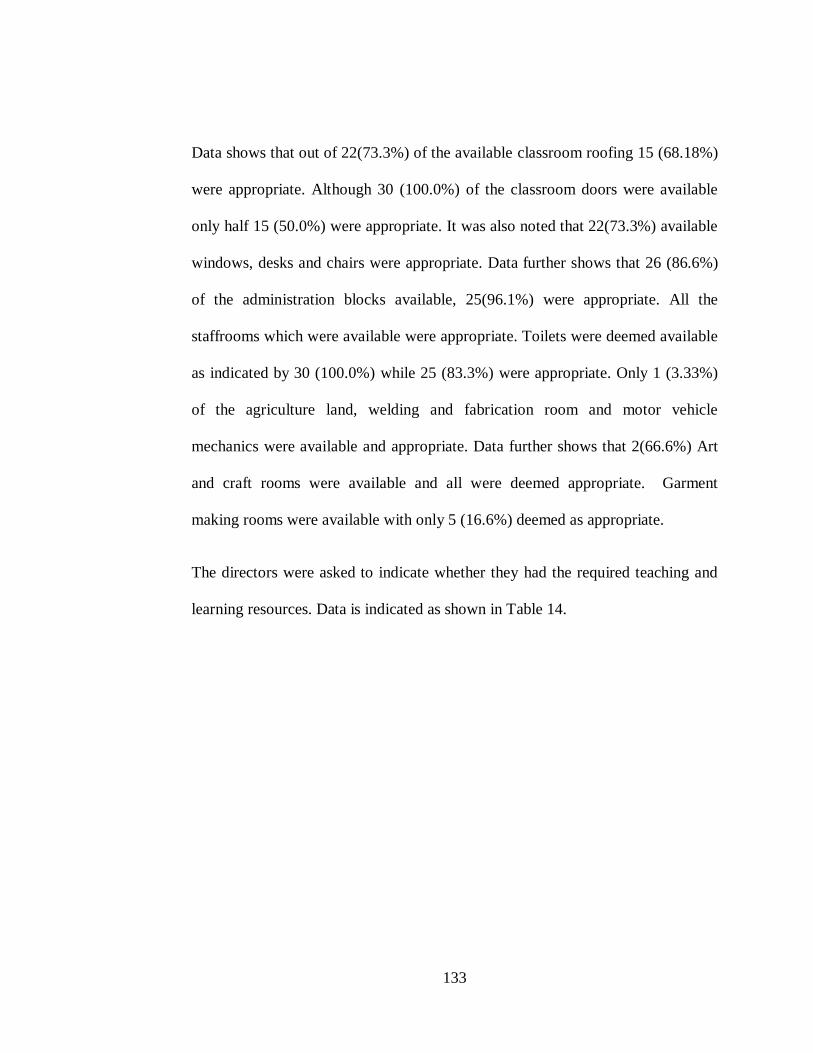
133
Data shows that out of 22(73.3%) of the available classroom roofing 15 (68.18%)
were appropriate. Although 30 (100.0%) of the classroom doors were available
only half 15 (50.0%) were appropriate. It was also noted that 22(73.3%) available
windows, desks and chairs were appropriate. Data further shows that 26 (86.6%)
of the administration blocks available, 25(96.1%) were appropriate. All the
staffrooms which were available were appropriate. Toilets were deemed available
as indicated by 30 (100.0%) while 25 (83.3%) were appropriate. Only 1 (3.33%)
of the agriculture land, welding and fabrication room and motor vehicle
mechanics were available and appropriate. Data further shows that 2(66.6%) Art
and craft rooms were available and all were deemed appropriate. Garment
making rooms were available with only 5 (16.6%) deemed as appropriate.
The directors were asked to indicate whether they had the required teaching and
learning resources. Data is indicated as shown in Table 14.

134
Table 14
Directors’ Responses on Availability of Teaching and Learning Resources
Availability Region Total
Kisumu Nairobi Mombasa
f % F % f % f %
Yes 8 80.0 6 54.5 4 57.1 16 57.1
No 2 20.0 5 45.5 3 42.9 12 42.9
Total 10 100 11 100 7 100 28 100
Data on the directors’ responses on availability of teaching and learning resources
indicated that slightly more than half, 16 directors (57.1%) had the required
resources with Kisumu having the highest availability as recorded by 8 (80%). In
Mombasa and Nairobi urban centres less than half the directors indicated they did
not have the resources (42.9%) and 45.5% respectively. In general the directors
were of the feeling that their centres did not have the required resources and
materials which affected curriculum implementation.
Instructional materials and resources play an important role in curriculum
implementation. Curriculum materials regularly play powerful roles in shaping
teaching practice as well as practitioner ideas about teaching and learning. Ball
and Cohen (1996) states that curriculum materials are designed to help teachers
better enact the curriculum in practice. This implies that if they are lacking, the

135
curriculum will not effectively be implemented. They add that by contributing to
teacher understanding, materials and resources can help facilitate curriculum
implementation. These results indicate that the implementation of the NFE
curriculum was hampered by unavailability and inappropriateness of the
resources.
The findings further agree with Ottevanger (2001) who states that in examining
the complex relationship between teacher knowledge, beliefs and contexts with
regard to curriculum implementation, use of materials are viewed as a catalyst in a
chemical reaction hence contributing to curriculum implementation. To establish
how appropriateness of the teaching learning resources influenced curriculum
implementations, the teachers and the directors were asked to indicate how
appropriate the resources and materials were in their centres. The directors were
therefore asked whether the resources and materials were appropriate. Their
responses are presented in Figure 21.

136
Figure 21
Directors’ Responses on Appropriateness of the Resources and Materials
Data on whether the centres had the appropriate teaching and learning resources
indicated that Mombasa experienced the highest percentage of inappropriate
resources and materials as recorded by 6 directors or 85.7% with Nairobi
following at 4 (80%). The directors were further asked to indicate whether they
had the appropriate teaching learning resources for the technical subjects. The
data is presented in Figure 22.
Percentage
City

137
Figure 22
Directors’ Responses on Availability of Resources for Technical Subjects
Data on the directors responses on availability of teaching and learning resources
for technical subjects indicated that slightly more than half of the centre directors,
12 (52.17%), had the required resources with Kisumu having the highest
availability as recorded by 4 (80%). Directors in Mombasa and Nairobi cities
indicated they had inadequate resources at (14.3%) and 85.7% respectively.
Teachers also responded to statements that sought to assess how adequacy of
teaching learning materials influenced curriculum implementation. They were
also asked to indicate who provided for the teaching and learning materials. The
data is presented in Figure 23.
City
Percentage

138
Figure 23
Directors’ Response to Provider of Teaching and Learning Resources
Data showed that much of the teaching and learning resources were provided by
the NGOs with Kisumu having the highest level of supplies by NGOs as reported
by 7 (53.9%) directors followed by Nairobi as recorded by 15 (46.9%) directors
and finally Mombasa as reported by 5 (22.7%) directors. Parents followed the
NGOs with 23 (34.3%), proprietors and the community with 9 (13.4%) and 6
(6.3%) respectively. The teachers were also asked to indicate whether the
teaching and learning resources were adequate for the teachers and learners in the
centres. The data is presented in Figure 24.
Percentage
Provider of resources

139
Figure 24
Teachers’ Responses on Adequacy of Teaching and Learning Resources
Data showed that all the centres did not have adequate resources as indicated by
40 (70.2%) teachers. Mombasa and Kisumu were the most affected areas with
90.5% and 80% inadequacy. Asked whether they received the necessary teaching
and learning resources when they required them, the teachers responded as
presented in Table 15.
Percentage
Urban centre

140
Table 15
Teachers’ Responses on Availability of Teaching and Learning Resources
Availability Region Total
Kisumu Nairobi Mombasa
F % F % f % f %
Yes 3 17.6 12 34.4 10 43.5 25 33.8
No 14 82.4 25 67.6 13 56.5 52 66.2
Total 17 100 37 100 23 100 77 100
Data showed that majority of teachers 49 (63.6%) did not receive the teaching and
learning resources when they required them. Overall, Kisumu recorded the most
affected in unavailability of resources at 82.4%, while Nairobi and Kisumu
recorded 67.6% and 56.5% respectively.
To establish how facilities influenced curriculum implementation regression was
carried out. The results are presented in Table 16.

141
Table 16
Regression analysis of influence of facilities and curriculum implementation
Ordered probit regression Number of obs = 20
Log likelihood = -304.92257 Pseudo R2 = 0.0091
LR chi2(1) = 0.00
Prob > chi2 = 1.0000
Log likelihood = -40.506524 Pseudo R2 = 0.0000
completeall Coef. Std. Err. z P>z
[95%
Confidence
Interval
facilities -4.67E-17 0.229244 0 1 -0.44931 0.44931
Data showed that Prob>chi2 =1.000. The p value is -0.44931 which is lower than
0.05. The data implied that availability of facilities which was a categorical
variable was statistically significant in increasing completion rates. This implied
that the regression model definitively determine a relationship between the
completion rate and the said variable. The coefficient is basically 0 meaning that
the model defines the facilities have a minimal influence in completion rates.
The above findings have revealed that resources and materials were inadequate in
almost all the centres. These findings agree with Tarnate (2001) who noted that
facilities and materials, namely: textbooks; teaching guides; chalkboards; and
cassette tapes in government and NGO, NFE centres in Catanduanes were
inadequate. This was deemed to negatively affect curriculum implementation. The
analysis of the data obtained from observation checklists in the current study and

142
in the study by Tarnate (2001) concur that NFE centres did not have adequate
curricula materials which affected implementation.
4.6 Influence of instructional methods on NFBE curriculum
implementation
The researcher sought to assess the influence of instructional methods on
curriculum implementation. Data for this research objective was gathered by
filling in the lesson observation schedule. Findings on the number of lesson
observed are presented in Figure 25.
Figure 25
Number of Lessons Observed

143
Data indicates that 13 lessons (38.2%) were observed in Kisumu, 12 lessons
(35.3%) in Nairobi and 9(26.5%) in Mombasa. The lessons observed are
presented in Figure 26.
Figure 26
Lessons Observed
The figure shows that 8 (23.5%) of the lesson observed were Kiswahili,
Mathematics, English and Social Studies were frequently observed. The duration
of the lessons ranged from 30 to 50 minutes with most lessons taking 35 minutes
as presented in Figure 27.

144
Figure 27
Duration of the Lesson
The researcher also observed whether the teachers had the schemes of work. Data
indicated that majority 23 (67.6%) of the teachers did not have the schemes of
work. The researcher further observed the sequence of the lesson and recorded
the following as presented in Figure 28.
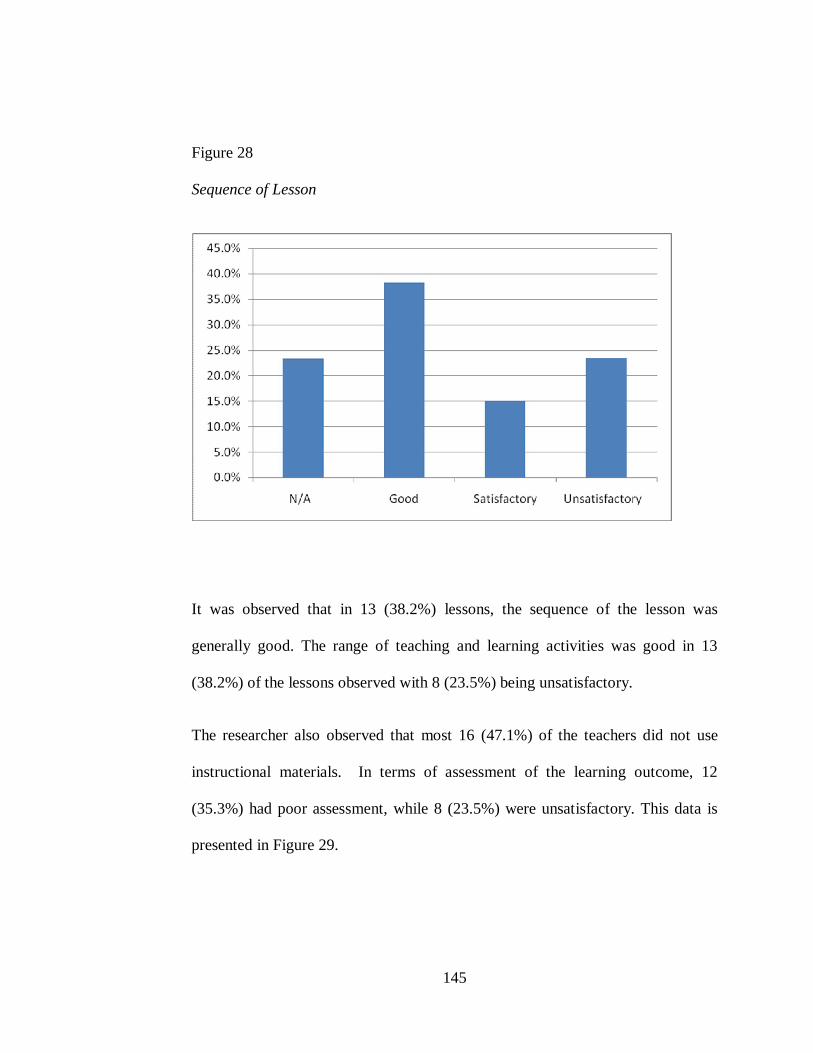
145
Figure 28
Sequence of Lesson
It was observed that in 13 (38.2%) lessons, the sequence of the lesson was
generally good. The range of teaching and learning activities was good in 13
(38.2%) of the lessons observed with 8 (23.5%) being unsatisfactory.
The researcher also observed that most 16 (47.1%) of the teachers did not use
instructional materials. In terms of assessment of the learning outcome, 12
(35.3%) had poor assessment, while 8 (23.5%) were unsatisfactory. This data is
presented in Figure 29.

146
Figure 29
Assessment of Learning Outcomes
The researcher further observed the teaching method that the teachers used. The
findings are presented in Table 17.

147
Table 17
Observation of Teaching Methods
Teaching method Inappropriate Appropriate Not applicable
F % f % f %
Lecturer 26 76.5 4 11.8 4 11.8
Group discussion 27 79.4 3 8.8 4 11.8
Individual presentation 16 47.1 2 5.9 16 47.1
Role play 0 00 4 11.8 30 88.2
Question and answer 6 17.6 27 79.4 1 2.9
Project 25 73.5 6 17.6 3 8.8
Data shows that the lecturer method as used in teaching was inappropriate as
observed in 26 (76.5%) lessons. Group discussion was similarly inappropriate in
majority 27(49.4%) of the lessons observed, while individual presentation was not
appropriate in 16 (47.1%) lessons observed. Role play was not used in majority
30 (88.2%) lessons. However, question and answer was observed as appropriately
used in majority 27 (79.4%) of the lessons observed while project method of
teaching was inappropriate in 25 (73.5%) observations.
To establish the relationship between instructional method and curriculum
implementation, the predictor variable (use of scheme of work) was used. The
variable was categorical by ‘yes’ and ‘no’ values. This variable was correlated
with the criterion variable ‘completion rates’. The data is presented in Table 18.
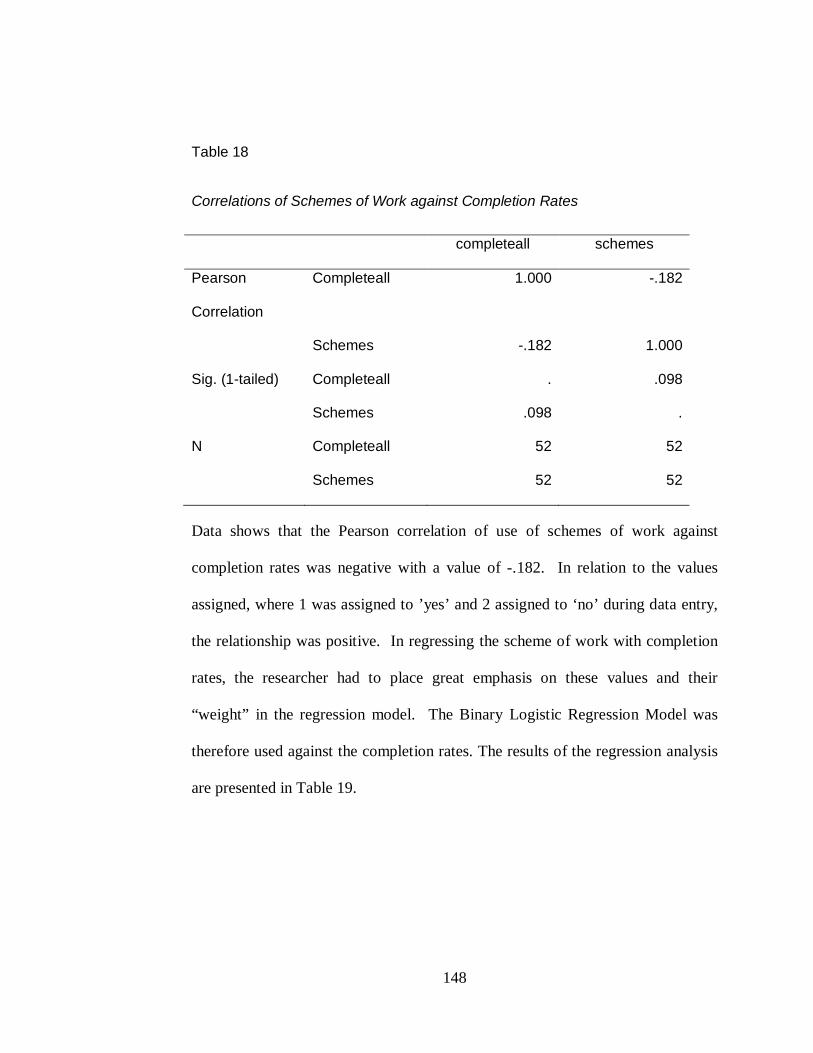
148
Table 18
Correlations of Schemes of Work against Completion Rates
completeall schemes
Pearson
Correlation
Completeall 1.000 -.182
Schemes -.182 1.000
Sig. (1-tailed) Completeall . .098
Schemes .098 .
N Completeall 52 52
Schemes 52 52
Data shows that the Pearson correlation of use of schemes of work against
completion rates was negative with a value of -.182. In relation to the values
assigned, where 1 was assigned to ’yes’ and 2 assigned to ‘no’ during data entry,
the relationship was positive. In regressing the scheme of work with completion
rates, the researcher had to place great emphasis on these values and their
“weight” in the regression model. The Binary Logistic Regression Model was
therefore used against the completion rates. The results of the regression analysis
are presented in Table 19.

149
Table 19
Linear Regression for use Schemes of Work against Completion Rates
Model
R R Square
Adjusted R
Square
Std. Error of the
Estimate
1 .182a .033 .014 227.80801
a. Predictors: (Constant), schemes
b. Dependent Variable: completeall
Data revealed that the R value was .182 which suggests that the use of schemes of
work had a positive slope though close to 0, which means that the schemes of
work were mostly random with standard error estimate set at 227.808. Figure 30
depicts the distribution of the schemes of work.

150
Figure 30
Regression Standardized Residual for Lesson Observation
Figure 30 shows that the residuals were normally distributed to the extent that the
histogram matches the normal distribution. This gives an indication of how well
the sample predicted a normal distribution in the population.

151
4.7 Influence of learner characteristics on NFBE curriculum
implementation
It is important to note that curriculum implementation cannot take place without
the learner who is the central figure in the curriculum implementation process.
Implementation takes place as the learner acquires the planned or intended
experiences, knowledge, skills, ideas and attitudes that are aimed at enabling the
same learner to function effectively in a society (University of Zimbabwe, 1995).
The study therefore sought to determine how learner characteristics influenced
curriculum implementation of the non-formal basic education curriculum at the
non-formal education (NFE) centres. The directors were therefore expected to
indicate the category of learners that they had in the centres. The data is presented
in Figure 31.

152
Figure 31
Category of Learners in the Centres
Data indicated that most of the learners in the centres were those that had dropped
out of school as shown by in Figure 31. Apart from Mombasa where majority 4
(57.1%) of the directors indicating that pupils had never been to school, in
Kisumu and Nairobi all the learners were those that had dropped out of school.
The teachers were also asked to indicate the category of learners that they
handled. Their responses are presented in Figure 32.
Percentage
City

153
Figure 32
Teachers’ Responses on Learner Characteristics
Data shows that majority of the learners were those that had dropped out of school
as indicated by 47 teachers (63.5%), followed by learners who had never been to
school and those that had dropped from NFE centres. Regionally, Nairobi
recorded the highest of learners who had dropped out of formal schools as
reported by 75.7% teachers, while Mombasa recorded the highest number of
learners that had never been to school (54.6%). This finding affirms the
characteristics of the NFE that takes on board the learners who have either
dropped out of school or have, due to various reasons, never been to school.
These findings were confirmed by the focus group discussions with the learners
who were asked what they had been doing before they joined the NFE. They gave
Urban centre
Percentage

154
many reasons such as being at home, and having dropped out of the formal
schools after their parents were not in a position to pay school fees. Others had
been working as house helps, herding animals, while others had never been to
schools and were too old to join formal schools while others were on the streets.
One learner in Mombasa commented during a focus group discussion:
“I was born near the beach and at an early age, I used to accompany my uncle
who was a fisherman. I learnt the skill too and so never had time to go to school. I
realized later that I needed education when one Mzungu (white lady) wanted to
take me away to Europe and assist me but indicated that I needed to have the
basic education. I went to formal school but felt out of place due to my age so I
joined this NFE centre since there were my age mates with whom we can share
experiences and learn together”.
Another shared his experience:
“I grew up in Kwale and did not go to school, but rather used to dance
‘mchechemeko’ (A Giriama traditional dance) where we used to be paid some
money by those we entertained. I was approached by one of the centre directors
who asked me to join school since he used to teach girls how to dance and learn.
At the centre, we used to dance and learn. I gained lots of skills and I enjoy being
at this centre. When I complete my training, I want to go back to the village and
start my own centre so that I can help other needy children who have had no
chance of schooling.”

155
Kleis (1973) defines non-formal education as any intentional and systematic
educational in which content is adapted to the unique needs of the learners. The
learners in the focus group discussions were asked whether they liked the
education that was offered at the centres. They unanimously indicated that they
liked since the NFE was flexible and accommodated learners who would
otherwise not be accommodated in the formal schools. In further discussion with
the older learners, some indicated that they had dropped out of school and later
joined while others had never been to school.
The teachers were also asked to indicate the rate of absenteeism among learners.
The data indicated that cases of absenteeism existed as indicated by 65 teachers
(87%). Asked to rate the drop out, they reported as presented in Figure 33.

156
Figure 33
Teachers’ Rating of Cases of Learner Drop-Out
Data indicated that cases of learner-drop out from the NFE centres were high as
shown by 52 teachers (71.2%). Nairobi recorded the highest rate at 32 (86.5%)
while Kisumu followed at 66.9%. Asked to indicate the reasons for dropping out,
teachers responded as presented in Figure 34.
Percentage
Rate of drop out
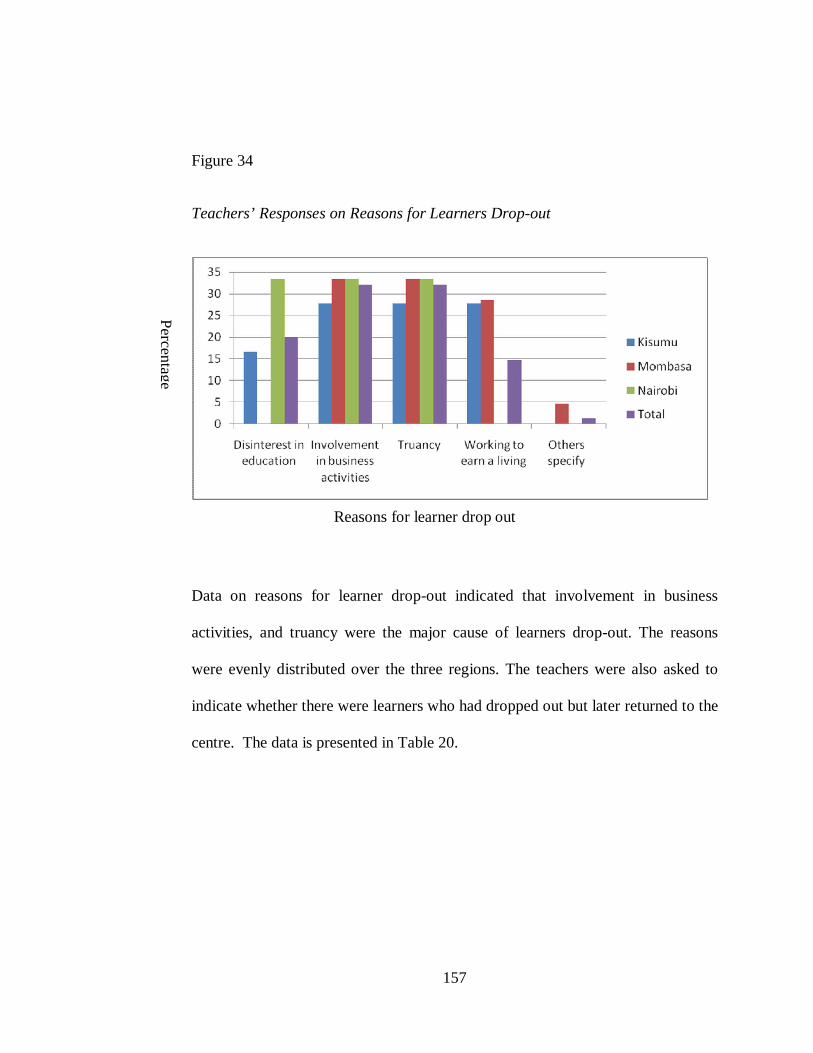
157
Figure 34
Teachers’ Responses on Reasons for Learners Drop-out
Data on reasons for learner drop-out indicated that involvement in business
activities, and truancy were the major cause of learners drop-out. The reasons
were evenly distributed over the three regions. The teachers were also asked to
indicate whether there were learners who had dropped out but later returned to the
centre. The data is presented in Table 20.
Reasons for learner drop out
Percentage

158
Table 20
Teachers’ Responses on Drop-out and Re-entry of Learners
Drop out and re-entry Region Total
Kisumu Nairobi Mombasa
F % F % f % f %
Yes 18 100 35 100.0 14 66.7 67 89.2
No 0 00.0 0 00 7 33.3 7 10.8
Total 18 100 35 100 21 100 74 100
Findings on whether there were cases where learners dropped out and later came
back showed that such cases existed as indicated by 66 teachers (89.2%). Across
cities, Kisumu had all the teachers reported that there were learners who had
dropped out and later returned with teachers reporting at 97.1% while Mombasa
had a relatively lower percentage of 66.7% of teachers reporting the same. The
directors were also requested to indicate whether there were exceptions for some
learners to take some subjects. The data is presented in Figure 35.

159
Figure 35
Directors’ Responses on Learners’ Exceptions from Some Subjects
Data showed that there were exceptions for some learners to take some subjects
and not others as recorded by 19 or 67.9%. Kisumu had the highest number of
learner exceptions at 90.9% followed by Nairobi at 72.3% while Mombasa had
least at 16.7%. This implies the nature of NFE where learners may be excepted
from some subjects.
The teachers were also required to indicate whether learners were supposed to
choose what to learn and what not to learn. They responded as indicated in Table
21.
Percentage
City

160
Table 21
Teachers’ Responses on whether Learners Chose What to Learn
Choice of subjects Region Total
Kisumu Nairobi Mombasa
f % F % f % f %
Yes 4 23.5 20 58.8 8 34.8 32 43.2
No 13 76.5 14 41.2 15 65.2 42 56.8
Total 17 100 34 100 23 100 74 100
Thirty two 32 (43.2%) teachers indicated that learners chose what to learn and
what not to learn. Across the cities, the situation was highest in Nairobi at 58.8%,
while Mombasa had 34.8% and 23.5% in Kisumu. Asked what made them make
such choices, they responded as indicated in Figure 36.
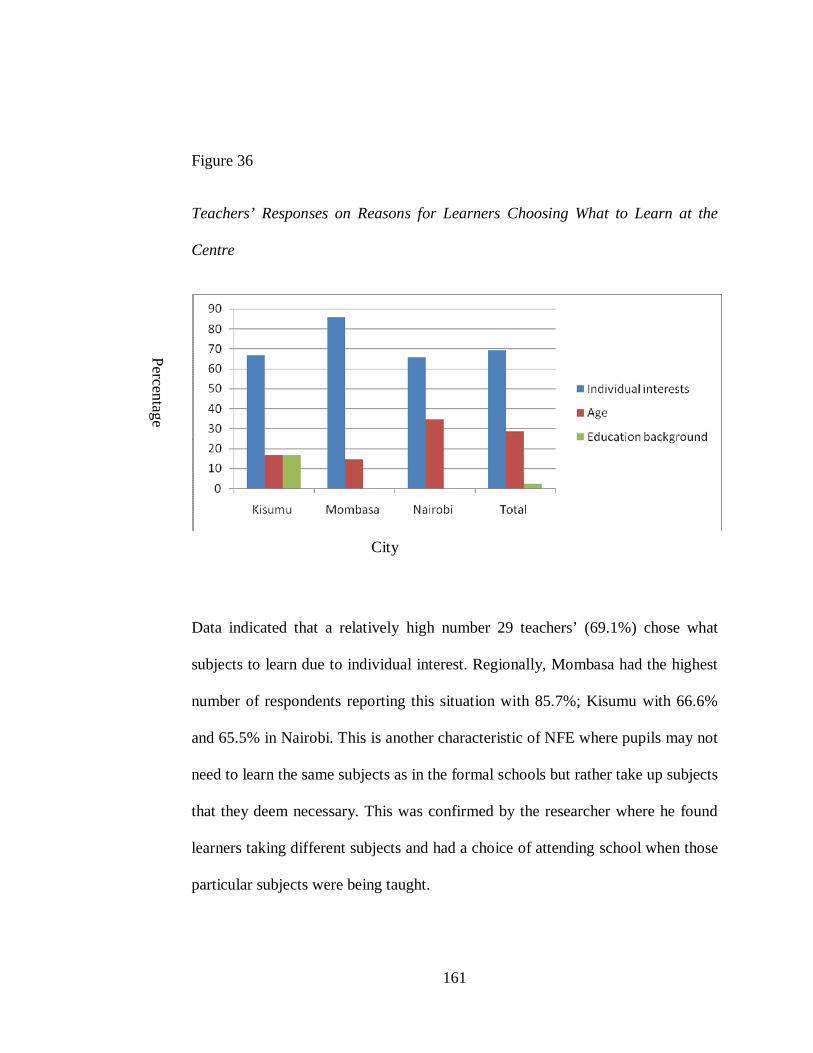
161
Figure 36
Teachers’ Responses on Reasons for Learners Choosing What to Learn at the
Centre
Data indicated that a relatively high number 29 teachers’ (69.1%) chose what
subjects to learn due to individual interest. Regionally, Mombasa had the highest
number of respondents reporting this situation with 85.7%; Kisumu with 66.6%
and 65.5% in Nairobi. This is another characteristic of NFE where pupils may not
need to learn the same subjects as in the formal schools but rather take up subjects
that they deem necessary. This was confirmed by the researcher where he found
learners taking different subjects and had a choice of attending school when those
particular subjects were being taught.
City
Percentage

162
Teachers were asked to indicate their learners’ attitude towards the NFE centre.
The data is presented in Table 22.
Table 22
Teachers’ Responses on Learners’ Attitude towards the NFE Centre
Learners’ attitude Region Total
Kisumu Nairobi Mombasa
f % f % f % f %
Positive 16 88.9 33 89.2 10 45.5 59 76.6
Negative 0 00.0 1 2.7 3 13.6 4 5.2
Neutral 2 11.1 3 8.1 9 40.9 14 18.2
Total 18 100 37 100 22 100 77 100
Data on the teachers responses on learner attitude towards NFE centres indicated
that majority of them felt that learners were positive about the NFE as indicated
by 59 of teachers (76.6%). Apart from Mombasa which recorded the lowest rate
of students having positive attitude (45.5%), Kisumu and Nairobi recorded very
high percentage of learners’ positivity towards the centre at 16.8% and 33.8%
respectively.
These findings were corroborated by the focus group discussions with the learners
who indicated that they enjoyed being at the centres. They liked it since they were
taught well, they had been given a chance to get education and that they could

163
learn at their own pace. They also indicted that they were taught technical subjects
at the centre, which were not offered at the formal schools. These they believed
would enable them acquire a skill to become productive members of the society.
Further probed on whether they liked their teachers, they indicated that they liked
them since they were kind and understanding. They also respected their teaches
though some students were older than the teachers.
Asked whether the learners were willing to learn at the centre, majority 69 (92%)
of the teachers indicated that they were willing. This was shown by Kisumu
having 17 teachers (94.4%), Nairobi with 33 (94.3%) and Mombasa with 19
(86.4%). This data is presented in Figure 37.
Figure 37
Teachers’ Responses on Learners’ Willingness to study at the NFE Centres
Percentage
City
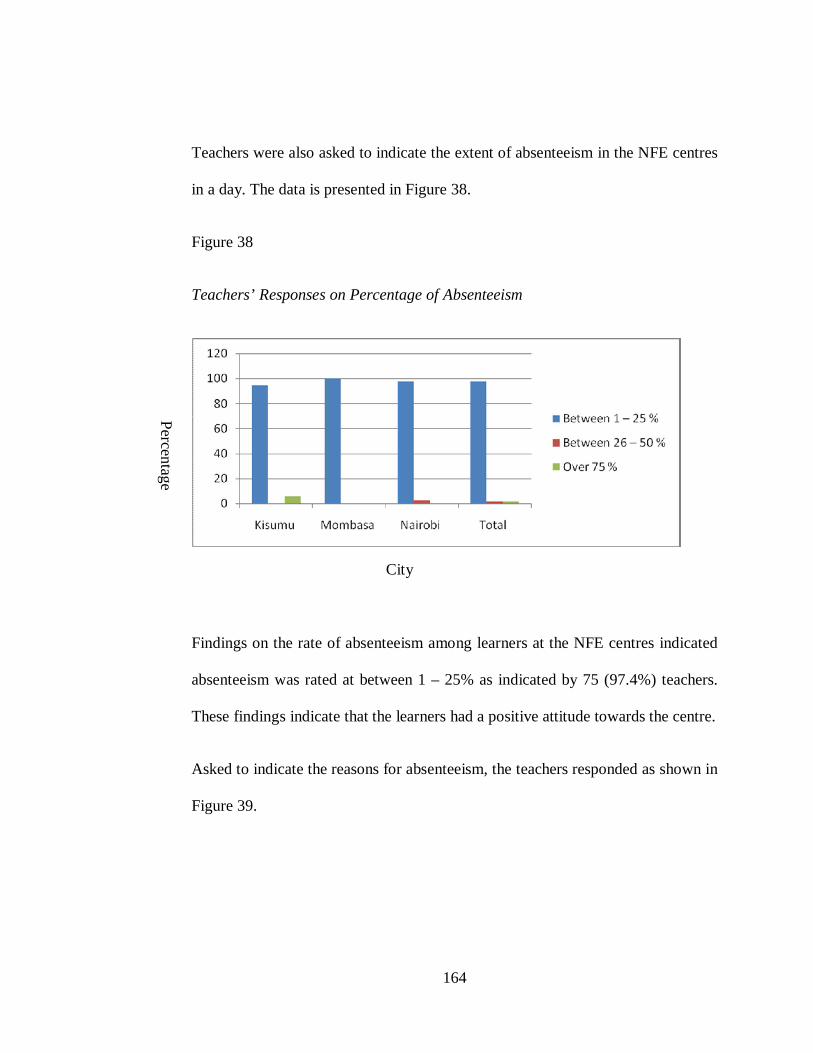
164
Teachers were also asked to indicate the extent of absenteeism in the NFE centres
in a day. The data is presented in Figure 38.
Figure 38
Teachers’ Responses on Percentage of Absenteeism
Findings on the rate of absenteeism among learners at the NFE centres indicated
absenteeism was rated at between 1 – 25% as indicated by 75 (97.4%) teachers.
These findings indicate that the learners had a positive attitude towards the centre.
Asked to indicate the reasons for absenteeism, the teachers responded as shown in
Figure 39.
Percentage
City
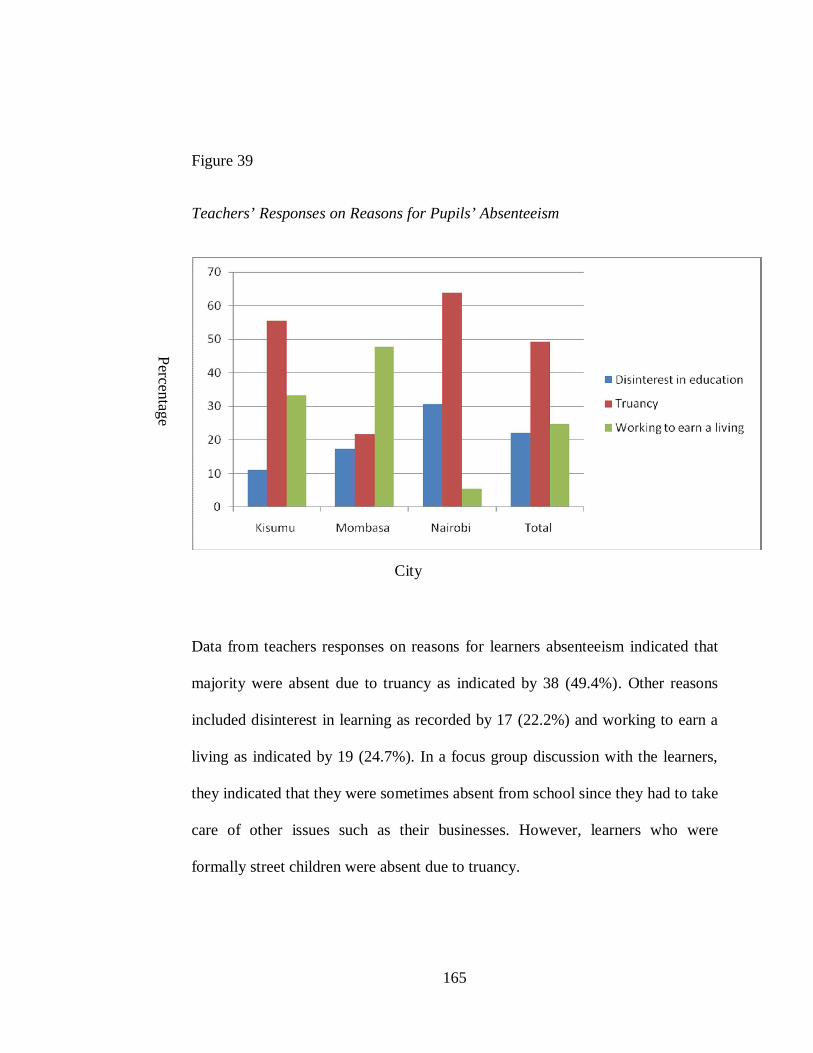
165
Figure 39
Teachers’ Responses on Reasons for Pupils’ Absenteeism
Data from teachers responses on reasons for learners absenteeism indicated that
majority were absent due to truancy as indicated by 38 (49.4%). Other reasons
included disinterest in learning as recorded by 17 (22.2%) and working to earn a
living as indicated by 19 (24.7%). In a focus group discussion with the learners,
they indicated that they were sometimes absent from school since they had to take
care of other issues such as their businesses. However, learners who were
formally street children were absent due to truancy.
Percentage
City

166
The teachers were further asked whether learners fully participated in the
classroom. The findings are presented in Figure 40.
Figure 40
Teachers’ Responses on whether Learners Fully Participated in Class
Findings on teachers’ responses on learners’ participation in class revealed that
majority 65 (85.5%) of the teachers indicted that learners fully participated during
class. Nairobi recorded the highest percentage participation recorded by teachers
at 91.9%, Mombasa at 82.6% while Kisumu recorded a participation recorded by
teachers at 75%. These findings could be corroborated with the researchers
observation during lesson observation where learners actively participated during
learning. These findings further indicated that the teachers were of the opinion
City
Percentage

167
that learners had a positive attitude towards the centres due to their high levels
participation. Asked to rate learners’ involvement during teaching, teachers
responded as indicated in Table 23.
Table 23
Teachers Rating on Level of Involvement in Classroom
Class participation Region Total
Kisumu Nairobi Mombasa
f % f % f % f %
Very actively involved 14 82.4 31 86.1 22 95.7 67 88.2
Less involved 3 17.6 5 13.9 1 4.3 9 11.8
Total 17 100 36 100 23 100 76 100
Findings on the level of involvement of learners indicated that learners were very
actively involved during the learning process as rated by majority 67 of the
teachers (88.2%). This was confirmed by observation that learners were
involvement during the lesson. Unlike the formal school, learners at the NFE
centres participated during the teaching and learning process. This shows that they
knew what they want to achieve.
To establish how learner characteristic influenced curriculum implementation,
selected variables from the teacher characteristics were selected and regressed
with completion rates. The results are presented in Table 24.

168
Table 24 Regression Analysis of Selected Teacher Variables
Ordered probit regression Number of obs = 706 LR chi2(7) = 48.43 Prob > chi2 = 0.0000 Log likelihood = -2357.3954 Pseudo R2 = 0.0102
completeall Coef. Std. Err. z P>z
[95% Confidence Interval]
Teachers’ rating of learners’ attitude towards NFE -0.18748 0.050153 -3.74 0 -0.28578 -0.08918 Teachers’ response to pupils willingness to learn 0.132175 0.174102 0.76 0.448 -0.20906 0.473409 Teachers’ response to learner absenteeism 0.1867 0.261748 0.71 0.476 -0.32632 0.699717 Teachers’ response to percentage of pupils absent 0.033626 0.095268 0.35 0.724 -0.1531 0.220348 Teachers’ response to reasons for absenteeism -0.19988 0.055542 -3.6 0 -0.30873 -0.09102 Teachers’ response to learner participation in class -0.37974 0.128586 -2.95 0.003 -0.63176 -0.12771 Teachers’ rating of learner involvement in learning 0.364778 0.124515 2.93 0.003 0.120733 0.608823

169
Data shows that all the variables were categorical. The table shows that learner
characteristics except “Teachers’ rating of learner involvement in learning” were
all statistically significant since they are all below 0.05. This implied the
regression model definitively determined a relationship between the completion
rate and the said variables except “Teachers’ rating of learner involvement in
learning “
4.8 Influence of community characteristics on NFBE curriculum
implementation
The study sought to establish how community characteristics influenced
curriculum implementation. The centre directors were asked to indicate the roles
that the community played in the centre. The data is presented in Table 25.

170
Table 25
Directors’ Responses on the Role of the Community in the NFE centre
Role Region Total
Kisumu Nairobi Mombasa
F % F % f % f %
Provision of food 3 30 5 50.0 0 00 7 25.9
Provision of teaching
and learning materials
0
00
1
10
3
50.0
6
22.3
Counselling services 0 00 0 00 3 50.0 3 11.1
Volunteer work 7 70 4 40 0 00 11 40.7
Total 9 100 10 100 6 100 27 100
Data shows that the community participated mainly in volunteer work and
provision of food as indicated by 11 (40.7%) and 7 directors (25.9%) respectively.
Nairobi region had the highest level of provision of food by the community as
shown by 5 directors (50%) while Kisumu had the highest level of volunteer work
as indicated by 7 directors (70%).
Teachers were also asked to indicate whether the community approved the NFE
curriculum. Their responses are reported in Table 26.

171
Table 26
Teachers’ Responses on whether the Community Approve of the NFE Curriculum
Response Region Total Kisumu Nairobi Mombasa
F % f % f % f %
Yes 17 94.4 30 85.7 15 78.9 62 86.1
No 1 5.6 5 14.3 4 21.1 10 13.9
Total 18 100 35 100 19 100 72 100
Data indicated that the community around the centre approved of the NFE
curriculum as indicated by 62 teachers (86.1%). Across the cities, Kisumu had the
highest approval at 94.4%, followed by Nairobi at 85.7% while Mombasa had
78.9%.
The teachers were also asked to state whether the NFE was appropriate for the
out-of-school learners. Their responses are presented in Table 27.

172
Table 27
Teachers’ Responses on whether NFE was Appropriate for the Learners
Appropriateness Region Total
Kisumu Nairobi Mombasa
f % f % f % f %
Yes 16 88.9 30 85.7 15 75.0 61 83.6
No 2 11.1 5 14.3 5 25.5 12 16.4
Total 18 100 35 100 20 100 73 100
Data indicate that majority of the teachers 61 (83.6%) viewed the curriculum as
appropriate for the learners. Overall, Kisumu recorded the highest approval at
88.9%, followed by Nairobi at 85.7% while Mombasa had the lowest at 75%. The
data implied that teachers deemed the NFE as important in making OOS children
access education.
The teachers were asked to indicate whether the community provided the
necessary facilities and resources to the centre. The data are presented in Table
28.

173
Table 28
Teachers’ Responses to Community Provision of Facilities and Resources
Provision resources Region Total
Kisumu Nairobi Mombasa
f % f % f % f %
Yes 8 48.9 32 94.1 3 15.0 43 59.7
No 10 51.1 2 5.9 17 85.0 29 40.3
Total 18 100 34 100 20 100 72 100
Data on provision of facilities and resources by the community to the NFE centres
whether the community indicated that it did as shown by 43 (59.7%) teachers.
Nairobi had the highest reported community provision (94.1%) while Mombasa
had the lowest as reported by 17 (85%) teachers.
To establish how community characteristics influenced curriculum
implementation, the researcher selected variables from the teachers’
questionnaire. The data is presented in Tables 29.

174
Table 29
Regression Analysis on Community Characteristics and Curriculum
Implementation
Ordered probit regression
Number of obs = 760
LR chi2(1) = 4.71
Prob > chi2 = 0.0299
Log likelihood = -2568.2361 Pseudo R2 = 0.0009
completeall Coef. Std. Err. z P>z
[95%
Confidence
Interval
Teachers’ response to
community perception of NFE 0.108541 0.050017 2.17 0.03 0.010509 0.206573
Teachers’ response to community perception of NFE showed that the p value was
0.0105 which was lesser than 0.05 hence it was concluded that they can definitively
determine a relationship between teachers perception to community perception and
completion rates. The coefficient was 0.108541 which means for a 1 unit increase in
teachers’ response to community perception in NFE we get a 0.108541 increase in
completion rates. The model showed that community perception had a relationship
with completion rates characterised by a coefficient of 0.108541 with a standard
error of 0.050017.

175
4.9 Multiple regression analysis of teacher and director variables in relation
to completion rates
The researcher conducted multiple regression analysis for selected teacher and
director variables in a bid to develop regression models. In doing this, the
researcher selected a number of predictor variables for the teacher and directors to
establish how these director variables influenced curriculum implementation. The
measure for the criterion variable was the ‘completion rates’ of learners at NFE.
The choice of the completion rates as the measure for the dependent variable was
used based on the fact that, although there are many outcomes for the NFE,
learners are expected to complete the cycle before they could engage themselves
in other activities. For example, for learners to transit to formal schooling, they
had to complete the NFE cycle. Likewise they have to complete the cycle before
they could engage themselves in different enterprises.
4.9.1 Multiple regression analysis for teacher variables against completion
rates
To perform regression analysis for the teacher variables, the researcher selected
the variables he considered important in the implementation of NFBE curriculum.
These were teachers’ response on attitude of learners towards NFE (Item 19),
pupils’ participation in class (Item 22a), teachers’ perception on the community’s
attitude on education offered at the NFE centre (Item 27) and teachers’ response
on whether the community around the centre approved of the NFE curriculum

176
(Item 28). These selected variables were correlated against the completion rates.
The correlation coefficients are presented in Table 30.
Table 30
Correlations for Selected Teacher Variables
completeall qualification _19 _22a
Pearson
Correlation
completeall 1.000 .031 -.156 -.046
qualification .031 1.000 -.136 -.102
_19 -.156 -.136 1.000 .136
_22a -.046 -.102 .136 1.000
_27 .084 -.056 .010 .174
_28 -.019 -.091 .183 .206
Sig. (1-
tailed)
completeall . .204 .000 .109
qualification .204 . .000 .003
_19 .000 .000 . .000
_22a .109 .003 .000 .
_27 .013 .069 .391 .000
_28 .309 .008 .000 .000
N completeall 705 705 705 705
qualification 705 705 705 705
_19 705 705 705 705
_22a 705 705 705 705
_27 705 705 705 705
_28 705 705 705 705
Finding on the correlations of the selected variables as presented in Table 25
demonstrates the only Item 19 and Item 27 were significant that is they
demonstrated a strong relationship between the independent and dependent

177
variable (completion rate) at -.156 and .084 respectively. These two variables
were used to carry out multiple regression with completion rates to provide a
cumulative effect of the selected teacher variables against completion rates. The
results are presented in Table 31.
Table 31
Model for Multiple Regression for Teacher Selected Variables
Model R R Square Adjusted R
Square
Std. Error of
the Estimate
1 .184 .034 .027 233.65249
a. Predictor: (Constant), _28, _27, qualification, _19, _22a.
Data in Table 31 shows that the adjusted R Square value was 0.27 which shows
that the model accounts for 27.0% of variance in the scores. This model describes
the cumulative effect of qualification, teacher resources, teacher induction, and
community support over the completion rates. The model has an R value of .184
which suggests that the correlation coefficient of the combination of all the
variables to completion rates was 0.184. Figure 41 presents a plot to check for
normality.
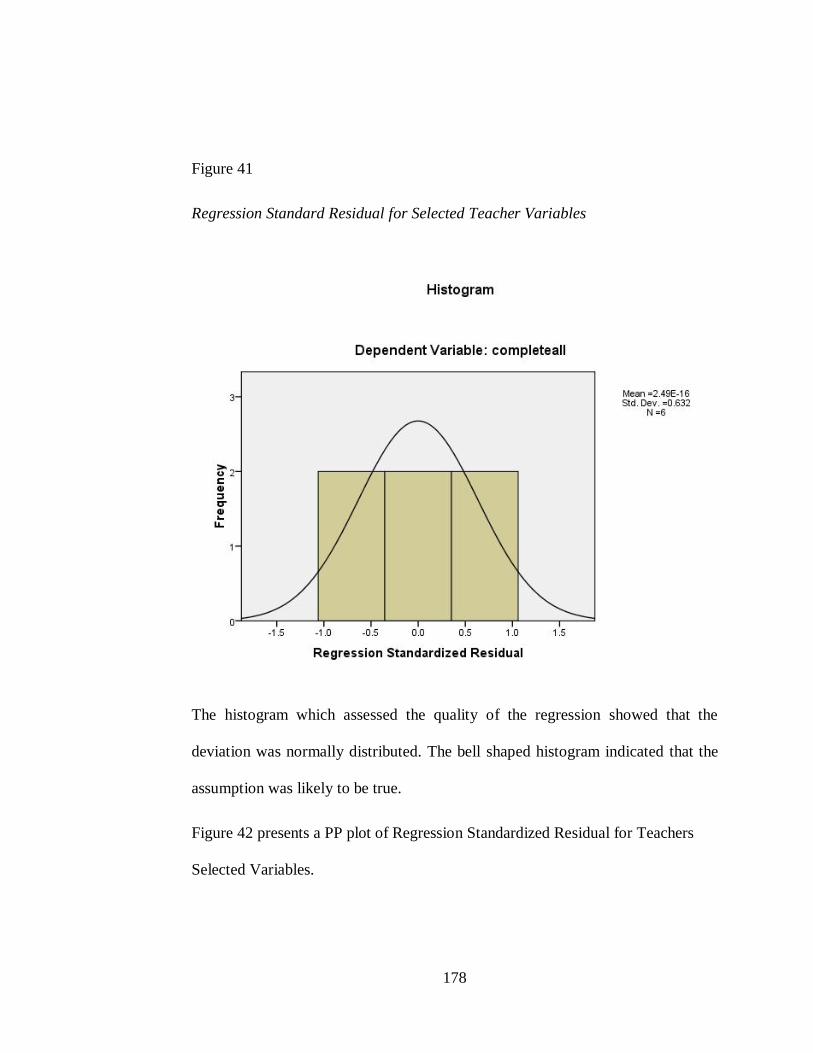
178
Figure 41
Regression Standard Residual for Selected Teacher Variables
The histogram which assessed the quality of the regression showed that the
deviation was normally distributed. The bell shaped histogram indicated that the
assumption was likely to be true.
Figure 42 presents a PP plot of Regression Standardized Residual for Teachers
Selected Variables.

179
Figure 42
Normal PP plot of Regression Standardized Residual for Teachers Selected
Variables
The PP plot of Regression standardized residual for teachers selected variables
indicates that the residuals or error terms were normally distributed. Scatter plot
for selected teacher variables is presented in Figure 43.

180
Figure 43
Scatter plot for Selected Teacher Variables
The scatter plot showed that the residuals were likely to be true.
4.9.2 Multiple regression for selected director variables against completion
rates
To perform multiple regression analysis for the directors’ variables, the researcher
selected the variables the he considered as important in the implementation of
NFBE curriculum. These were the director’s responses to adequacy of teachers
(Item 7 in the director questionnaire), whether teachers had been inducted (Item
13a) in the director questionnaire, and the community supported the NFE ( Item

181
25 in the same questionnaire). These selected variables were correlated against the
completion rates of the learners at the NFE. The results are presented in Table 32.
Table 32
Correlations for Selected Directors’ Variables Against Completion Rates
teacherinduction communitysupport
Pearson
Correlation
Completeall -.815 .407
Adequateteachers .920 -.454
Teacherinduction 1.000 -.500
communitysupport -.500 1.000
Sig. (1-tailed) Completeall .024 .211
adequateteachers .005 .183
Teacherinduction . .156
communitysupport .156 .
N Completeall 6 6
adequateteachers 6 6
Teacherinduction 6 6
communitysupport 6 6
Simple Linear regression was computed from the selected variables against
completion rates hence the results presented in Table 33.

182
Table 33
Simple Linear Regression for Selected Directors’ Variables Against Completion
Rates
Model
R R Square
Adjusted R
Square
Std. Error of
the Estimate
1 .816a .665 .163 149.90664
a. Predictors: (Constant), communitysupport
adequateteachers, teacherinduction
b. Dependent Variable: completeall
The analysis shows that R was at .816 This value was quite close to one and thus
it can be concluded that that the relationship between director variables and
completion rates is linear and positive. The data further imply that a 1 degree
increase in the director variables would result in a .816 increase in the completion
rates. An increase of teacher induction, community support, and adequacy of
teachers by one unit would have a corresponding increase of completion rates of
.816 units or 81.6 percent of the increase in the completion ‘rates’.
To establish the cumulative effect of the director variables, multiple regression
analysis for selected director variables was carried out. The data is presented in
Table 34.

183
Table 34
Multiple Regression Summary for Selected Director Variables
Model
R R Square
Adjusted R
Square
Std. Error of the
Estimate
.070a .005 -.011 109.991
a. Predictors: (Constant), communitysupport, requiredmaterials,
adequateteachers, teacherinduction
b. Dependent Variable: completeall
The model shows that the R value is set at .070 meaning that the cumulative effect
of the independent ordinal and categorical variables of community support,
required materials, adequate teachers as well as teacher induction were random.
The closer the R value is to 1 the more linear, or positive or stronger is the
relationship the variables are. The closer R is to 0 the more weaker or random the
values are. It would be suggested that the PLUM ordinal regression can be carried
out on 2 of the independent variables in order to get a more conclusive R value
closer to 1. By observing the coefficients of the model, there is a better
understanding of the individual effects of the independent variables on the
completion rates as observed in Table 35.
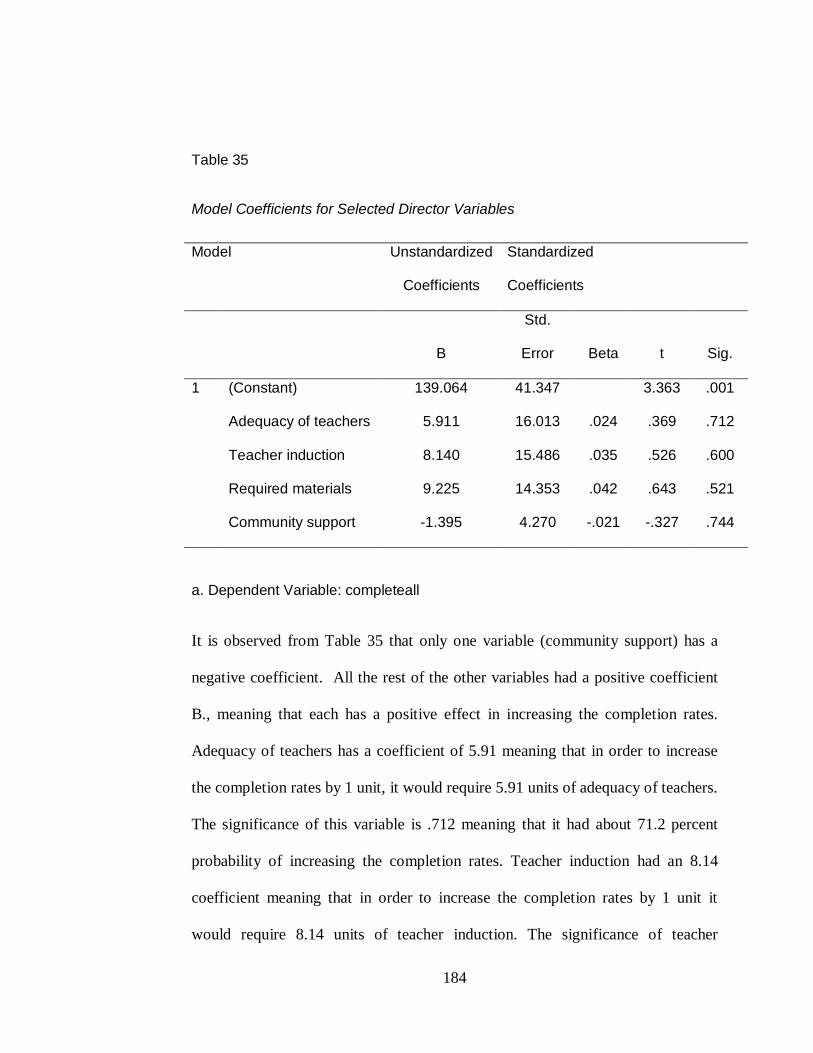
184
Table 35
Model Coefficients for Selected Director Variables
Model Unstandardized
Coefficients
Standardized
Coefficients
B
Std.
Error Beta t Sig.
1 (Constant) 139.064 41.347 3.363 .001
Adequacy of teachers 5.911 16.013 .024 .369 .712
Teacher induction 8.140 15.486 .035 .526 .600
Required materials 9.225 14.353 .042 .643 .521
Community support -1.395 4.270 -.021 -.327 .744
a. Dependent Variable: completeall
It is observed from Table 35 that only one variable (community support) has a
negative coefficient. All the rest of the other variables had a positive coefficient
B., meaning that each has a positive effect in increasing the completion rates.
Adequacy of teachers has a coefficient of 5.91 meaning that in order to increase
the completion rates by 1 unit, it would require 5.91 units of adequacy of teachers.
The significance of this variable is .712 meaning that it had about 71.2 percent
probability of increasing the completion rates. Teacher induction had an 8.14
coefficient meaning that in order to increase the completion rates by 1 unit it
would require 8.14 units of teacher induction. The significance of teacher

185
induction was .600 (with 1 being the most significant), meaning that it had about
60.0 percent probability of increasing the completion rates. Required materials
had a coefficient of 9.225 meaning that in order to increase the completion rates
by 1 unit it would require 9.23 units of required materials. The significance of this
variable is .521 (with 1 being the most significant), meaning that it has about 52.1
percent probability of increasing the completion rates. Community support has a
1.395 coefficient meaning that in order to increase the completion rates by 1 unit
it would require 1.395 to reduce 1 units of community support. The significance
of this variable is .744 (with 1 being the most significant), meaning that it has
about 74.4 percent probability of increasing the completion rates. Community
support has a negative effect on completion rates, according to the data.

186
CHAPTER FIVE
SUMMARY CONCLUSIONS AND RECOMMENDATIONS
5.1 Introduction
This chapter presents the summary of the study, summary of findings, conclusions
and recommendations. The chapter also presents the suggestions for further
research.
5.2 Summary of the study
The purpose of this study was to assess the implementation of the non-formal
basic education curriculum in Nairobi, Mombasa and Kisumu cities. Five research
objectives were formulated to guide the study. The study sought to: determine
how teacher characteristics influenced the implementation of non-formal basic
education curriculum; establish how adequacy of physical facilities, resources and
materials influenced implementation of the non-formal basic education
curriculum; examine how instructional methods influenced the implementation of
the non-formal basic education curriculum; determine how learner characteristics
influenced the implementation of the non-formal basic education curriculum; and
lastly establish how community characteristics influenced the implementation of
the non-formal basic education curriculum.

187
The study employed cross-sectional survey. Cross-sectional design was preferred
because of its ability to deal with various cases and variables, and its suitability in
quantitative and qualitative methods. The study employed purposeful sampling
using maximum variation which involved purposefully picking a wide range of
variation on dimensions of interest. The sample size comprised all the 36
directors, 96 teachers and 30 community members. Data were collected by use a
mixed methods approach through triangulation of seven data collection methods
which included: questionnaire for the teachers and directors of the NFE centres,
focus group discussion guide with community members, focus group discussion
guide for learners, observation checklist for physical resources and materials,
lesson observation schedule and documents analysis. Data were analyzed by use
of descriptive and inferential statistics. The descriptive statistics were done by use
of frequencies and percentages while inferential statistics was done by use of
multiple regressions. Models were developed by use of Epi Info, STATA 11 SE,
and PASW statistical applications.
The first objective was to determine the influence of teacher characteristics on the
implementation of NFBE curriculum. The study therefore examined how selected
teacher variables such as teachers’ demographic data, teacher adequacy, and
attitude influenced the NFBE curriculum implementation at the NFE centres. Data
indicated that all the centres had adequate teachers with a rating of 23 (74.2%).
The minimum qualifications that were required for one to teach at the NFE
centres was class 8 certificate as indicated by 24 (80%) of the directors. However,

188
the centres had teachers who had other qualifications such as Form Four
certificate diploma and technical based qualifications.
The findings also revealed that acquiring teachers was a challenge as reported by
majority 29 (96.7%) of the directors. The study further revealed that the directors
faced the challenge of teacher unwillingness to teach at NFE as recorded by 17
directors (63.0%) and poor salaries. Teacher turnover was reported as high in all
the centres as indicated by 20 directors or 71.4%. This was mostly due to poor
salaries they were paid at the NFE centre. Nationally, lack of training was the
major challenge that faced teachers in teaching NFE as was recorded by 24
directors (88.9%). Data further revealed that most of the teachers in the NFE had
not been in-serviced on the NFBE curriculum.
Findings also revealed that most of the teachers partially used the NFBE
curriculum as shown by 57 (81.4%). However, majority of the teachers 74 (100%)
had not been in-serviced in the use of the curriculum. Data on the attitude of the
teachers towards the NFE curriculum revealed that teachers were positive towards
the NFE curriculum. This was indicated by a coefficient of 4.0 or an equivalent of
73% teachers who were positive towards the NFE curriculum. Regression of
teacher characteristics and completion rates revealed that there was a significant
relationship between gender (p = 0/01), age (p = 0.03) and duration at the centre
(p = 0.02) and completion rates.

189
The second research objective aimed at establishing how adequacy of resources at
the NFECs influenced the implementation of the Non-formal basic education
curriculum at the NFE centres in Kisumu, Nairobi and Mombasa cities, Kenya.
Findings indicated that most of the centres did not have facilities for technical
subjects, for example only 1 (1.3%) had agricultural land, 2 (5%) had agricultural
equipment, 5 (6.3%) had Art and Craft tools, 6 (7.5%) had woodwork tools, 6
(7.5%) had welding and fabrication equipment and only 1 (1.3%) centre had a
motor vehicle workshop. Majority of teachers 49 (63.6%) did not receive teaching
and learning resources when they required them. Across the cities, Kisumu
recorded the highest in unavailability of resources at 82.4%, while Nairobi and
Kisumu recorded 67.6% and 56.5% respectively.
The findings implied that the centres could not implement the curriculum without
the necessary teaching learning resources. The teaching and learning materials
and resources in the centres were also deemed as inappropriate. For example, of
22 (73.3%) of the available classroom roofing only 15 (68.18%) were appropriate.
Only 1 (3.33%) of the agriculture land, welding and fabrication room and motor
vehicle mechanic that were available were appropriate. Data further showed that 2
(66.6%) of the Art and craft rooms were available and all were deemed
appropriate. Only 5 (16.6%) garment making rooms were available and
appropriate. In general the directors were of the opinion that their centres did not
have the required resources and materials which affected curriculum
implementation. Regression analysis of availability of resources and completion

190
rates revealed that there was a significant relationship between availability of
facilities and completion rates (p = -0.44931).
Research Objective Three was to assess the appropriateness of the instructional
methods employed by teachers, influence the implementation of the Non-formal
basic education curriculum at the NFE centres in Kisumu, Nairobi and Mombasa
cities, Kenya. Data for this research objective was gathered by filling in the lesson
observation schedule. The Binary Logistic Regression Model was used against
completion rates. To perform regression analysis for the lesson observation
variables, the researcher selected ‘schemes of work’ variables as the predictor
variable. The R value was .182 which implied that schemes of work had a
positive slope though close to 0.
Research Objective Four aimed at determining how learner characteristics
influenced curriculum implementation of the Non-formal basic education
curriculum at the non-formal education (NFE) centres in Kisumu, Nairobi and
Mombasa cities in Kenya. Findings indicated that most of the learners at the
centres were those that had dropped out of schools, apart from Mombasa where
majority 4 directors (57.1%) reported that learners had never been to school.
Across the three cities, Nairobi recorded the highest number of children who had
dropped out of formal schools at 75.7% while Mombasa recorded the highest
number of learners that had never been to school (54.6%). This finding affirmed

191
the characteristics of the NFE that takes on board learners who have either
dropped out of school, or have, due to various reasons, never been to school.
These findings were confirmed through the focus group discussions with learners
who gave many reasons for not having been to schools, which included: being at
home, having dropped out of the formal schools after their parents’ inability of
pay school fees, others had been working as domestic workers, herding animals,
or had never been to schools since they viewed themselves as too old to join
formal public schools. There were cases of learners who had previously been on
the streets. Data indicated that cases of drop out from the NFE centres were high
as shown by 52 (71.2%) with Nairobi recording the highest rate of learner drop
out at 32 (86.5%).
The major reason for dropping out included but not limited to involvement in
business activities and truancy. These reasons were common in the three urban
centres. Findings also revealed that there were exceptions for some learners to
select some subjects and not others as recorded by 19 (67.9%) of them. Kisumu
had the highest number of learner exceptions at 90.9% followed by Nairobi at
72.3% while Mombasa had least at 16.7%. Findings on the teachers’ responses on
learners’ attitude indicated that majority of them felt that the learners were
positive about the NFE as indicated by 59 (76.6%). Learners were also willing to
learn at the centre as recorded by 69 (92%) of the teachers. Class participation
was recorded as high by 91.9% of the teachers.

192
Regression analysis of teachers’ rating of learners’ attitude towards NFE, pupils’
willingness to learn, learner absenteeism, percentage of pupils absent from school
and reasons for absenteeism learner participation were all statistically significant
since they had a p value lesser than 0.05. This implied the regression model
definitively determined a relationship between the completion rate and the said
variables.
Research Objective Five aimed at establishing how community characteristics
influenced the implementation of the Non-formal basic education curriculum at
the non-formal education (NFE) centres in Kisumu, Nairobi and Mombasa cities,
Kenya. The findings indicated that the community participated in volunteer work
and provision of food as indicated by 11 directors (42.3%) and 7 directors
(26.9%) respectively. It was also revealed that the community around the centre
approved of the curriculum as indicated by 62 (86.1%) with majority of the
teachers 61 (83.6%) indicating that the community felt that the curriculum was
appropriate for the learners. The community also provided the facilities and
resources to the NFE centres. These responses were confirmed by the focus group
discussion with the community members who reported such involvement in the
running of the NFE centres. Teachers’ response to community perception of NFE
revealed a p value of 0.0105 which was lesser than 0.05 hence it was concluded that
community perception had a relationship with completion rates characterised by a
coefficient of 0.108541 with a standard error of 0.050017.

193
Multiple regression analysis for the teacher and director variables revealed that all
teacher variables had strong correlations with completion rates. The model can be
used to perform future predictions of completion rates of learners at the NFE
centres. All director variables had strong correlations and the model can be used
to perform future predictions of completion rates of learners at the NFE centres.
For lesson observation, the variable could not be conclusively used to perform
future observations.
5.3 Conclusions
Findings from the research objective one showed that all the centres had adequate
teachers, however they were not trained. The NFE could pick on anybody to teach
in the centres provided one had a Class 8 certificate. For any successful
implementation of a curriculum, professional qualification is important hence it
was concluded that inadequate teacher qualification was a hindrance to effective
curriculum implementation. Teachers had not been in-serviced in the use of the
curriculum. This resulted to teachers not implementing the recommend NFBE
curriculum. Analysis further revealed that it was difficult to find teachers to teach
in the NFE centres. The centres faced high turnover, teachers were also unwilling
to teach in the NFE centres. The study therefore concluded that inability to get
trained teachers was a hindrance to effective curriculum implementation.
Analysis of the second research objective revealed that most of the centres did not
have the resources and facilities required for learning at the NFE centres.

194
Specifically, the centres lacked resources that were meant to facilitate the teaching
of technical subjects. It was also revealed that the facilities that were available at
the centres were not usable. This was therefore a major hindrance to curriculum
implementation. For any effective implementation, facilities and resources are of
great importance. The curriculum especially for the technical subjects requires
that centres are well equipped with the facilities such as technical rooms and tools
for specific subjects. Lack of such facilities and resources resulted to centres
opting to concentrate on academic subjects, leaving out the technical area and
hence hindering full implementation of the curriculum. The study therefore
concluded that inadequacy and inappropriateness of resources and materials
hindered the curriculum implementation.
Analysis of Research Objective Three revealed that teachers used different
methods of teaching which were not appropriate. For example, most teachers used
question and answer methods and lecturer method which were deemed
inappropriate for the lessons that were observed. The study concluded that
inability for teachers to use the appropriate methods of teaching was as a result of
lack of professional qualifications and also lack of in-servicing. The study
therefore concluded that inappropriate instructional methods were a hindrance to
curriculum implementation. The use of schemes of work by the teachers had a
positive influence on completion rates, according to do the data collected. The
study therefore concluded that this could as a result of inadequate professional

195
training making teachers unable to prepare and to use schemes of work hence,
affecting curriculum implementation.
Findings of the fourth research objective indicated that most of the learners in the
centres were those that had dropped out of schools and those that had never been
to school. Some of the learner characteristics that affected curriculum
implementation were dropping out and truancy which affected the implementation
of curriculum. Some positive aspects that may be deemed to facilitate curriculum
implementation included learners’ positive attitude towards the centre and high
class participation. The study therefore concluded that although there were some
factors that negatively affected curriculum implementation, there were also
positive aspects that facilitated curriculum implementation. The model summary
showed that learners positive attitude towards the NFE had a linear relationship
with completion rates at the NFE. It was therefore concluded that learner attitude
should be enhanced for effective curriculum implementation.
Findings from the fifth research objective showed that the community participated
in the running of the NFE in various ways which included volunteer work,
provision of food and provision of facilities. The community members had a
positive attitude towards the curriculum and felt that it was appropriate for the
learners. The study concluded that community participation in the running of the
NFE had a positive contribution to effective curriculum implementation.

196
Regression analysis for the teacher and director variables revealed that all teacher
variables had strong correlations and the model can be used to perform future
predictions of completion rates of learners at the NFE centres. All selected
director variables had strong correlations and the model can be used to perform
future predictions of completion rates of learners at the NFE centres. For lesson
observation the variable cannot be conclusively used to perform future
observations, further study needs to be carried out to capture more details for
schemes of work in relation to completion rates.
5.4 Recommendations
The following were the recommendations based on the findings and conclusions
of the study
i. The study recommends that KIE which developed the curriculum should
set minimum qualifications for teachers supposed to teach and the NFE
centres. Since NFE has been recognized as a viable means of reaching the
out of school the government should put in place specialised institutions
for training teachers meant to implement the curriculum.
ii. The study has established that inadequate resources and materials at the
NFE hindered curriculum implementation. The study recommends that the
government and other stakeholders such as the community, NGOs and
well wishers should come up with ways of providing such facilities. The

197
government should have a clear policy on financing NFE centres for
example, payment of teachers so as to minimise teacher turnover.
iii. The study has also established that poor teaching methodologies were a
hindrance to effective curriculum implementation. It is therefore
recommended that KIE should organize workshops or seminars to
empower teachers in a way that they are able to use the NFE curriculum.
iv. The study has also revealed that learner characteristics such as
absenteeism and truancy were a hindrance to curriculum implementation.
It is therefore recommended that the community and centre organizers
provide a conducive learning atmosphere that will deter absenteeism and
truancy. The centre could, for example, be organized in such a way that
those who have to work as they learn have a flexible time schedule as that
is one of the characteristics of NFE. There should also be provision for
learners of different ages.
v. The study has revealed that the community had a positive contribution
towards NFE curriculum implementation. The study recommends that the
community should be encouraged to participate more in the running of the
centres. For example, organizations working with NFE can organize
capacity building seminars and workshops to create awareness among the
community members on their role in centres.

198
5.5 Suggestions for further research
i. The research has established that some selected variables had a
relationship with completion rates of the learners at the NFE centres. A
further study should be conducted to establish how other teachers’ variable
related to completion rates of the learners.
ii. The study did not develop a model for learner factors and how they
influence curriculum implementation. A study on how selected learner
factors influence completion rates should be conducted to provide future
prediction on what is needed to be done by the learners for effective
curriculum implementation.
iii. A study on how NFE director characteristics affect curriculum
implementation should be conducted to provide models which would
predict what the directors ought to do to effectively implement NFE
curriculum.
iv. Considering that this study was conducted in urban areas, a similar study
should be conducted in rural areas to establish what factors influence
curriculum implementation in the rural areas.

199
REFERENCES
Adams & Onyene, (2001). Nature of curriculum content implementation in Nigeria, Lagos, Macmillan Press. Adeleke, M. H. (2006). An Appraisal of curriculum implementation in Nigeria, Lagos, Macus Publication. Ajayi, S. N. (1999). Evaluation of Nigeria’s educational goals, Lagos: Memphis Publishers. Ajibola, M. A. (2008). Innovations and curriculum implementation for basic education in Nigeria: Policy priorities and challenges of practices and implementation, Research Journal of International Studies. Issue 8 (November, 2008) pp 51-58. Alao, N. (2001). Problems of curriculum content implementation in Nigeria, Ibadan: University Press. Anastasi, A. (1988). Psychological testing (6th ed.). New York: Macmillan Publishing Co., Inc. Armitage, P. (1980). Statistical methods in medical research. Blackwell Scientific Publications, Oxford UK. ISBN 0-632-05430-1 p. 147-166. Amugo, M. B. (1997). Designing and delivering curriculum in Nigeria, Ibadan: University Press. Amuseghan, S. (2007). ESL curriculum in secondary schools in Nigeria: Issues and challenges towards communicative competence, Nebula (4.2), 319- 333. Anandu, D. A. (1990). Factors Affecting the Implementation of the 8-4-4 School Curriculum in Primary Schools: A survey of Emuhaya Division of Vihiga District. M.Ed Thesis: Kenyatta University. Anyakogu, P. M. (2002). The Idea of 6-3-3-4 System, Lagos: Mumdus Press Ltd Anyanwu, S. O. (2000). Effective curriculum content implementation and Nigeria educational goals, Ibadan; University Press. Bagayoko, M. (1999). The Conceptual framework and operationalisation of non-formal education in Kenyan context. Nairobi: Ministry of Education.

200
Ball, D., & Cohen, D. (1996). Reform by the book: What is - or might be - the role of curriculum materials in teacher learning and instructional reform? Educational Researcher, 25(9), 6-8, 14. Bell, L., & Rhodes, C. (1996). The skills of primary school management. London: Routledge. Berman, P. (1978). The study of macro- and micro-implementation. Public Policy, 26(2), 157-184. Brindley, & Hood (1990). Curriculum innovation in adult ESL in Brindley G. (ed). The second language curriculum in action. Sidney Austraria. Bruneforth, M. (2009a). Differences in the Age Distribution of Primary Pupils Between Administrative and Household Data and the Impact on Monitoring of Enrolment Rates. Montreal, Qué, UNESCO Institute for Statistics. Bryman, A. (2008). (3rd Edition). Social research methods, Oxford: Oxford University Press. Bryman, A. (2006). Mixed methods. London: SAGE. Buchert, L. (ed.) (1998). Education reform in the south in the 1990s. France: UNESCO Publishers. Carless, D. (2001a). Curriculum innovation in the primary ELT Classroom: Case studies of three teachers implementing Hong Kong’s Target-Oriented Curriculum (TOC). Unpublished PhD thesis, University of Warwick. Carless, D. (2002). Implementing task-based learning with young learners. English Language Teaching Journal 56 (4), 389–396. Carless, D., (1999). Perspectives on the cultural appropriacy of Hong Kong’s Target-Oriented Curriculum (TOC) initiative. Language, Culture and Curriculum 12 (3), 238–254. Casley, J. D., & Kumor, K. (1985). The collection analysis and use of monitoring and evaluation data. World Bank Publication. Baltimore: The Jonsis Hopkins University Press. Chen, Y., & Wang, J. Z. (2004). A region-based fuzzy feature matching approach to content-based image retrieval. IEEE Transactions on Pattern Analysis and Machine Intelligence, 24(9):1252–1267.

201
Cohen, L., Manion, L., & Morrison, K. (2007). Research methods in education, Rutledge, London Cohen, L., Manion, L., & Morrison, K. (2004). Research methods in education, 5th ed, Rutledge Falmer, London. Colley, H., Hodkinson, P. & Malcolm, J. (2002). Non-formal Learning: Mapping the Conceptual Terrain, A Consultation report, University of Leeds Lifelong learning Institute Collins, R. (1995). Prediction in macro sociology: The case of the Soviet collapse. American Journal of Sociology 100:1552-1593. Coombs, P. (1968). The world educational crisis. New York, Oxford University Press. Coombs, P. (1973). New paths to learning for rural children and youth. New York, NY: International Council for Educational Development, p. 11. Darling-Hammond, L. (1990). Instructional policy into practice: The power of the bottom over the top. Educational Evaluation and Policy Analysis, 12 (3), 339-347. Darling-Hammond, L., (1997). The right to learn. San Francisco: Jossey-Bass,. De Lano, L., Riley, L., & Crookes, G. (1994). The meaning of innovation for ESL teachers. System, 22(4), 487-496. Dewey, J. (1897). My pedagogic creed. Retrieved from http://books.google.com/books Earley, P., & Bubb, S. (2004). Leading and managing continuing professional development: Developing people, developing schools. London: Paul Chapman. Earley, P., & Bubb, S. (2004). Leading and managing continuing professional development: Developing people, developing schools. London: Paul Chapman. Ellington, (1986). Producing Teaching Materials New York: Nicholas Publishing Company. Farooq, R. A. (1993). Orientation of education. Lahore: Azher Sons.
202
Fordham, P. E. (1993). 'Informal, non-formal and formal education programmes' in YMCA Fowler, F. (2003). Policy studies for educational leaders: An introduction (2nd ed.). Rev. Columbus, OH: Merrill/Prentice Hall. Freire, P. (1970). Pedagogy of the Oppressed, New York: Continuum. Fullan, M. (2001). The new meaning of educational change. Third edition. New York: Teachers’ College Press. Fullan, M., & Miles, M. (1991). Getting educational reform right : What works and what doesn't . An article submitted to Phi Delta Kappan. Fullan, M. G., & Stiegelbauer, S. (1991). The new meaning of educational change. New York: Teachers College Press. Fullan, M. (1982). The meaning of Educational change. New York: Teachers college press. Fullan, M., & Park, P. (1981). Curriculum implementation. Toronto: OISE Press. Fullan, M. & Pomfret, A. (1977). Research on curriculum and instruction implementation. Review of Educational Research, 47 (1). Glatthorn, A. A. (1997). Differentiated supervision (2nd ed). Alexandria, VA: Association for Supervision and Curriculum Development. Global Partnership for Education: Quality Education for all children (2013). Government of Kenya. (2007). Kenya vision 2030: A Globally competitive and prosperous Kenya. Nairobi Government Press. Government of Kenya (2006). Non formal basic education syllabus Vol. One and Two. Nairobi: Kenya Institute of Education. Government of Kenya (2006). Non formal basic education syllabus Vol. Two. Nairobi: Kenya Institute of Education. Government of Kenya (2005). Sessional paper No. 1 of 2005 on Education training and research. Nairobi; Government printers. Government of Kenya (2005). Sessional Paper No. 1 of 2005 on policy framework for education sector GoK, Nairobi; Government printer.
203
Government of Kenya. (2005). Kenya Education Sector Support Programme (KESSP) 2005 – 2010: Delivering quality education and training to all Kenyans. Nairobi. Government of Kenya/MoE (1995). Cost and finances of education in Kenya. Consultants report on access quality and equity in primary education. (Study I). Government of Kenya (1976). Report of the national committee on educational objectives and policies. Nairobi: Government Printer. GoK/UNICEF, (1995). Survey of non-formal education in Kenya. Nairobi: Kenya Institute of Education. Gonzales, T., Celeste & Pinzano, C. (1998). Non-formal education in the Phillipines: A fundamental step towards lifelong learning. Manila: Department of Education, Culture and Education. Available http://www.apec-hurdit.org/lifelong-learning-book/pijano.hml Graham-Brown, S.B. (1991). Education in the Developing World: Conflict and Crisis. Longman, London. Green, L. W., & Kreuter, M. W. (1999). Health promotion program planning: An educational and ecological approach. Mountain View, CA: Mayfield. Greene, J. C., Benjamin, L., & Goodyear, L. (2001). The merits of mixing methods in evaluation. Evaluation, 7(1), 25-44. Gresham, F.M., MacMillan, D.L., Beebe-Frankenberger, M.E., & Bocian, K.M. (2000). Treatment integrity in learning disabilities intervention research: Do we really know how treatments are implemented? Learning Disabilities Research & Practice, 15(4), 198–205. Hargreaves, A. (2000). Pushing the boundaries of educational change. In Hargreaves, A., Lieberman, A., Fullan, M. and Hopkins, D. (Eds). International Handbook of Educational Change. Part one. Dordrecht: Kluwer. Heininchi, R., Molendar, M., & Russel, J. D. (1999). Instructional medial and new technologies of instructions. 2nd Edition, New York: Macmillan Publication & Company.

204
Hoppers, W. (2006). ‘Non-formal education and basic education reform: a conceptual review’, International Institute for Education Planning, UNESCO. IIZ/DVV-ETH (1998). Focus on adult and non-formal education in Ethiopia, News implementation stage. Review of Educational Research, 57(3), 237- 254. Howie, S. (2002). English language proficiency and contextual factors
influencing mathematics achievement of secondary pupils in South Africa. Doctoral dissertation. Enschede: University of Twente. Information Age Publishing
Illich, (1970). Deschooling society. London, Calder & Boyers. IZ/DVV-ETH, (2000). Focus on adult and non-formal education in Ethiopia. News Letter No.7. Johnson, R. B., & Onwuegbuzie, A. J. (2004). Mixed methods research: A research paradigm whose time has come. Educational Researcher, 33(7), 14-26. Joppe, M. (2000). The research process. Retrieved February 25, 1998, from http://www.ryerson.ca/~mjoppe/rp.htm Khawaja, S. & Brennan, B. (1990). Non-formal education. Islamabad: Mr. Books. Kleis, J., Lang, L., Mietus, J.R. & Tiapula, F.T.S. (1973). Towards a contextual definition of non formal education. Non formal education discussion papers, East Lansing, MI: Kinyua, A. K. (2001). An evaluation of the implementation of environmental education integrated curriculum in primary teachers training colleges in Kenya. Unpublished PhD thesis, University of Nairobi. Nairobi. Kleis, J., Lang, L., Mietus, J. R., & Tiapula, F. T. S. (1973). Toward a contextual definition of non formal education. Non formal education discussion papers, East Lansing, MI: Michigan State Univers. ity, pp.. 3-6. Kritek, W. (1976). Lessons from the literature on implementation educational Administration Quarterly

205
Lancaster, G. A., Dodd, S., & Williamson, P. R. (2004). Design and analysis of pilot studies: recommendations for good practice. Journal of Evaluation in Clinical Practice 10(2): 307-12. Li, D. (1998). ‘‘It’s always more difficult than you plan and imagine’’. Teachers’ perceived difficulties in introducing the communicative approach in South Korea. TESOL Quarterly 32, 677–697. Lockheed, Marlaine E., & Verspoor, A. (1991). Improving Primary Education in Developing Countries. New York: Oxford University Press for the World Bank. Loucks, S. F., & Lieberman, A. (1983). Curriculum implementation. In F. English (ed), Fundamental curriculum decisions (1983 Yearbook). Alexandria, Virginia: Association for Supervision and Curriculum Development (ASCD). Marew, Z. (2000). Curriculum implementation and evaluation: A Course Material. (Unpublished) McLaughlin, M. W. (1987). Learning from experience: Lessons from policy implementation. Educational Evaluation and Policy Analysis, 9(2), 171- 178. Miles, M., & Huberman, A. M. (1994). Qualitative data analysis: An expanded sourcebook (2nd ed.). Thousand Oaks, CA: Sage. Ministry of Education, (2007). Education Sector Strategic Plan (2007-2011). Hargeisa, Somaliland: Ministry of Education. MoE, (2000). Alternate routes to basic primary education. Addis Ababa: Commercial Printers MoE, (1999). Education sector development program. Addis Ababa: Central Printing Press. MoE/ICDR (1999). A study on the status of non-formal education in some regions of Ethiopia. Addis Ababa: Ourael Printing Press. MoEST, (2003). National action plan on education for all 2003 – 2015, Nairobi. Government printer. Mohammad, S. Rahman F. Y., Monzil A., Begum, J. A., & Tapan. K. N. (2010). Impact of “Basic education for hard to reach urban children (non formal

206
education project–3) project” to provide basic education equivalent to class three (grade-III) for urban hard to reach children of six divisional cities of Bangladesh. Elementary Education Online, 9(2), 484–487. Elementary Education Online, 9(2), 484–487. Đlkoğretim Online, 9(2), 484-487, 2010. [Online]: http://ilkogretim-online.org.tr Mohammed, M. J. (2005). Our educational growth has not matched quality. The Nigerian Education Times. N0. 5, April-May 29-3. Moloi, F., Morobe, N., & Urwick, J. (2008). Free but inaccessible primary education: a critique of the pedagogy of English and Mathematics in Lesotho (2008) International Journal of Educational Development, 28 (6), pp. 612-621 Morris, M. (1998). Unresting the curriculum: Queer projects, queer imaginings. In W.F. Pinar (Ed.), Queer Theory in Education (pp.275–287). Mahwah, NJ: Lawrence Erlbaum Morrison, F.J., Bachman, H. J., & Connor, C. M. (2005). Improving literacy in America: Guidelines from research. New Haven, CT7 Yale University Press Motswiri, M. J. (2004). Supporting chemistry teachers in implementing formative
assessment of investigative practical work in Botswana. (Unpublished Doctoral dissertation. Enschede: University of Twente
Mowbray, C. T., Holter, M. C., Teague, G. B., & Bybee, D. (2003). Fidelity criteria: Development, measurement, and validation. American Journal of Evaluation, 24(3), 315-340. Mungai, V. W. (1992). An Investigation into the Availability and use of Resources for the Teaching and Learning in Primary School in Njoro Division Nakuru District. (Unpublished M.Ed Thesis. Kenyatta University. Nafula, J. M., & Ngoma, C. K. (1998). Education foundations. Nairobi: Kenyatta University. Nagle, B. & Williams N. (nd) Methodology Brief: Introduction to Focus Groups. Centre for assessment, planning and accountability. Norris, N. (1998). Curriculum evaluation revisited. Cambridge Journal of Education, 28(2), 207-220.

207
Nwagwu, N. A. (2003). Crisis in the Nigeria Education System. Being WCCI Hosted by the Lagos Branch of the University of Lagos Akoka, Lagos: October 23. Nyamok, M. P. (1997). The Role of Teaching Materials in Academic Performance. Unpublished PGDE Research Project: Kenyatta University. Offorma, G. C. (2005). Curriculum for wealth creation, Paper presented at the seminar of the World Council for Curriculum and Instruction (WCCI), held at the Federal College of Education, Kano, Nigeria Okorodudu, R. I. (2006). Refocusing teachers’ personality dimensions as correlate of work attitude: Implications for counselling teacher education in Nigeria. Journal of Education in Developing Areas (JEDA), 15: 1-10. Okorosaye-Orubite, A. K. ( 2005). The Role of the Teacher in the Development of the Nigerian Nation. Journal of Research in Education, 2(1): 41-45. Olateju, S., & Rewaju, O. (1988). A Study of Work Motivation among Educators
in Selected Educational Institutions Using Job Characteristics Model. University Minnesota.
Ornstein, A. C., & Hunkins, F. P. (2004), Curriculum foundations, principle and issues. Boston: Pearson, pp 298-327. Ornstein, A. C., & Hunkins, F. P. (1998). Curriculum foundations, principles, and Issues. (3rd ed.). USA: Allyn and Bacon. Osakwe, R. N. (2006). Understanding teaching profession. Osasu Series in Education. Benin City: University of Benin. Ottevanger, W. (2001). Materials development as a catalyst for science curriculum implementation in Namibia. Doctoral dissertation. Enschede: University of Twente. Ouma, D.N. (1987). The Impact of Teaching Aids on Performance: A case of Selected Public and Private Schools in Kisumu Municipality (Unpublished PGDE Project), Kenyatta University. Owiny, C. D. (2006). Providing Non-Formal Education to the Semi-Nomadic Bahima and Karamojong Pastoralists in Uganda. (Unpublished PhD. Thesis). University of South Africa.

208
Öztürk, E. (2003). An assessment of high school biology curriculum implementation. A thesis submitted to the graduate school of social sciences. Ankara: Middle East Technical University Pal, L. A. (2006). Beyond policy analysis: Public issue management in turbulent times. Scarborough, Ont: ITP Nelson Patton, M. Q. (2002). Qualitative evaluation and research methods (3rd ed.). Thousand Oaks, CA: Sage Publications, Inc. Patton, M. Q. (1978). Utilization-focused evaluation. Beverly Hills: SAGE. Pennington, M. C., & Cheung, M. (1995). Factors shaping the introduction of process writing in Hong Kong secondary schools. Language, Culture and Curriculum, 8(1), 1-20. PMLC (1996). Prime Minister's Literacy Commission (Pakistan) Punch, K. F., & McAtee, W. A. (1979). Accounting for teachers’ attitudes towards Punch, K. (2006) Introduction to social research, quantitative and qualitative approaches 2nd edition. London: SAGE Publications Richards, J. C., & Farrell, T. S. C. (2005). Professional development for language teachers. New York: Cambridge University Press. Robson, C. (2002). Real World Research. Blackwell Publishers. Rogan, J. M., & Grayson, D. J. (2003). Towards a theory of curriculum implementation with particular reference to science education in developing countries. International Journal of Science Education. 25(10): 1171-1204. Scott, F. B. (1994). Integrating curriculum implementation and staff development. Clearing House, 67(3), 157-161. Scriven, M. (1973). The methodology of evaluation. In B. R. Worthen and J. R. In B. R. Worthen and J. R. Sanders (Eds.), Educational Evaluation: Theory and Practice. Worthington, OH: C. A. Jones. Shiror, R. (1995). Non-formal education for development. New Delhi: Anmol Publishers.

209
Siegel, S., & Castellan, N. J. (1988). Nonparametric Statistics for the behavioral sciences 2nd. Ed. McGraw Hill, Inc. Boston Massachusetts. ISBN 0-07- 057357-3 p235-244.) Simkins, T. (1977) Non-Formal education and development. some critical issues, Manchester, UK. Skager, Rodney, & Dave, R. H. (eds.) (1877). Curriculum evaluation for life long education. Great Britain: Pargamon Press Smerdon, B. A., & Burkam, D. T. (1999). Access to constructivist and didactic teaching: who gets it? Where is it practiced? Teachers College Record, 101(1), 5-35 Stenhouse, L. (1975). An introduction to curriculum research and development. London: Heinemann. Stern, C., & Keislar, E. R. (1977). Teacher attitudes and attitude change: A research review. Journal of Research and Development in Education, 10 (2), 63-76. Stoner, J. A. F., Freeman, R. E., & Gilbert, D. R., (1999). Management. India. New Delhi Stufflebeam, D. L. & Shinkfield, A. J. C. (1986). Systematic evaluation. A self- instructional guide to theory and practice. Boston: Kluwer-Nijhoff Publishing. Tanner, D., & Tanner, L. (1995). Curriculum development: Theory into practice (3rd ed.). Englewood Cliffs, NJ: Merrill Tarnate, R. T. (2001). Extent of implementation of non-formal education (nfe) program in elementary schools in Catanduanes, (Unpublished PhD Thesis). Catanduanes State Colleges. Thijs, A. (1999). Supporting science curriculum reform in Botswana: The
potential of peer coaching. Doctoral dissertation. Enschede: University of Twente.
Thompson, E. J. D. (2001) Non-formal education in urban Kenya: Findings of a study in Kisumu, Mombasa and Nairobi. The Commonwealth Secretariat. Tietjen, K. (1991). Educating Girls: Strategies to increase access, persistence, and achievement. Washington Dc. Creative Associates International

210
Tight, M. (1996). Key concepts in adult education and training, London: Rutledge. UIS. (2009). International literacy statistics: A review of concepts, methodology and current data. Montreal, Qué., UNESCO Institute for Statistics. UNESCO Global Monitoring Report (2012) UNESCO. (2010). EFA global monitoring report. Reaching the marginalized. Paris: UNESCO. UNESCO Institute for Statistics (UIS), (2008) UNESCO. (2006). Institute for statistics. Global education digests 2006: Comparing education statistics across the world. UIS, Montreal. UNICEF. (2004). State of the world’s children: Excluded and invisible. New York: UNICEF. United Nations Convention on the Rights of the Child (UNCRC) (1948). Geneva: United Nations University of Zimbabwe. (1995). Curriculum Implementation, Change and Innovation. (Module EA3AD 303). Harare: Centre for Distance Education, University of Zimbabwe. Uzodinma, M. U. (2004). Can Nigeria effectively implement her curriculum content? Owerri: Uzor Press Ltd Verspoor, A. M. (1991). Improving primary education in developing countries. Washington DC: Oxford University Press. Wang, H., & Han, H. (2002). The development of college English curriculum in China. Carleton Papers in Applied Language Studies, 16/17, 75-97. Wang, M. C., Nojan, M., Strom, C. D., & Walberg, H .J. (1984).The utility
of degree of implementation measures in program implementation and evaluation research. Curriculum Inquiry.
Wasiche, J. L. (2006). Teaching techniques that enhance students
performance in mathematics in selected public secondary schools in Butere, Mumias district in Kenya. (Unpublished M Ed thesis). Kenyatta University. Nairobi.

211
WCEFA. (1990). Meeting basic learning needs: A Vision for the 1990s. New York: Inter-agency Commission for World Conference on Education for All. Whitaker, J. (1995). Curriculum implementation, change and innovation. (Module EA3AD 303). White, R. (1987). Managing innovation. English Language Teaching Journal, 41(3), 211-218. Widdowson, H. G. (1978). Teaching language as communication. Oxford: Oxford University Press. Wolfson, M. (1997). ‘Divergent Inequalities: Theory and Empirical Results’, Review of Income and Wealth 43(4): 401-21. World Bank. (1995). priorities and strategies for education: Development in practice. U.S.A: The International bank for Reconstruction and Development

212
APPENDICES
APPENDIX I: LETTER OF INTRODUCTION
University of Nairobi,
School of Education,
Department of Educational
Administration and Planning,
P.O. Box 30197,
Nairobi.
10th December, 2011
The Director,
_________________NFE centre,
Dear Sir/ Madam
Re: Factors influencing implementation of Non-formal basic education
curriculum in Nairobi, Mombasa and Kisumu cities
Dear Sir/Madam,
I am a post-graduate student pursuing a PhD degree in curriculum studies at the
University of Nairobi. I am conducting research on Factors Influencing
Implementation of Non-formal Basic Education Curriculum in Nairobi, Mombasa
and Kisumu Cities, Kenya. Your centre has been selected for the study. I am
kindly requesting your assistance in collection of data for the purpose of this
study.
____________________________
Gathumbi Anthony Mungai

213
APPENDIX II
QUESTIONNAIRE FOR DIRECTORS
The purpose of this questionnaire is to gather data on the Evaluation of the
Implementation of Non Formal Basic Education Curriculum in urban centres of
Nairobi, Mombasa and Kisumu. You are asked to participate in the study by
filling in this questionnaire. The researcher would like to assure you that your
identity will be confidential.
Section A: Personal information (Tick Appropriately)
Gender Age in
years
Length of
teaching
(years)
Marital
Status
Level of Education Duration of
teaching in
the centre
(years)
□ Male
□
Female
□25&
Below
□26-30
□31-40
□41-50
□51-60
□Below 5
□5-10
□11-15
□16-20
□21-25
□26 & above
□Single
□Married
□Widowed
□Divorced
□Separated
□NFE
□PI Certificate
□Diploma
□Technical
education
□Higher Diploma
□ Bachelor’s degree
□Masters
□Others (Specify)
_________________
□Below 5
□5-10
□11-15
□16-20
□21-25
□26 &
above
Section B: Centre characteristics
1. What is the name of your centre? _______________________________
2. When was the centre established? _______________________________
3. For what reasons was the centre established?

214
______________________________________________________
4. In which category or ownership is your institution?
Individual [ ]
Religious organisation [ ] Specify ____________________
NGO [ ] Specify ______________________
Community [ ]
Individual and community [ ]
Others, specify _______________________________________
5. Apart from education, what other services does your centre offer?
Shelter [ ] Food provision [ ]
Health services [ ] Counselling [ ]
Rehabilitation [ ] Protection [ ]
Others, specify ______________________________________________
Section C: Influence of teacher factors on NFE basic education curriculum
implementation
6. How many teachers do you have in your centre, their qualifications and
terms of service
Qualifications Full time Part time Volunteer Temporary
Class 8
Secondary school drop out
Form Four
P 1
Diploma
Bachelor’s degree
Master’s degree

215
7. (a) Are the teachers adequate for the learners you have?
Yes [ ] No [ ]
(b) On average what is the pupil-teacher ratio in your centre? __________
8. a)Are there specific qualifications that you consider when sourcing for
teachers?
Yes [ ] No [ ]
b) If yes, what qualifications __________________________________
9. What is the minimum qualification that is required for one to teach at the
centre?
Class 8 [ ] Form Four [ ]
Certificate [ ] Others, specify ________________
10. a) Do you find challenges getting teachers for your centre?
Yes [ ] No [ ]
b) If yes, what are some of the challenges?
Unwilling to teach at the NFE centres [ ]
Poor salaries [ ]
Lack of proper training [ ]
Negative attitude towards NFE [ ]
Others, specify___________________________________________
11. Who pays the salaries of teachers?
Institution [ ] Donors [ ]
Well wishers [ ] Others, specify ________________
12. (a) What would you comment on the teacher turn over in your centre?

216
Very high [ ] High [ ]
Low [ ]
Very low [ ]
(b) What are some reasons for teacher turn over?
Poor salary [ ]
Search for greener pastures [ ]
Challenges due to curriculum content [ ]
Challenges in class control [ ]
Others, specify_______________________________________________
13. (a) Are your teachers inducted into the teaching of the NFE curriculum?
Yes [ ] No [ ]
14. (b) If who inducts them? ______________________________________
c) How are they inducted? ____________________________________
15. What challenges do your teachers face in teaching the NFE learners
Lack of training in NFE curriculum [ ]
Inability to handle NFE learners [ ]
Inability to translate the curriculum content [ ]
Others, specify_____________________________________________
Section D: Influence of materials and resources on NFE basic education
curriculum implementation
16. Who provides for the teaching and learning materials for your centre?
__________________________________________________
17. a)Do you have the required teaching and learning materials in your centre?

217
Yes [ ] No [ ]
b) If no, what measures do you take to ensure that teaching and learning
goes on? __________________________________________________
18. What challenges do you face in terms of accessing the teaching/learning
materials? _________________________________________________
19. a)Do you have appropriate teaching/learning resources for the academic
subjects?
Yes [ ] No [ ]
b) If no, what measures do you take? ___________________________
a)Do you have appropriate teaching/learning resources for the technical
subjects?
Yes [ ] No [ ]
b) If no, what measures do you take? ____________________________
Section E: Influence of learner characteristics on NFE basic education
curriculum implementation
20. Tick the category of your learners in the following characteristics
Learners who have dropped out of school [ ]
Learners who have never been to school [ ]
Learners who cannot fit in the formal school [ ]
Learners with special needs (e.g. street children) [ ]
21. a) Are learners interested in the NFE ?
Yes [ ] No [ ]
b) Please explain ____________________________________________
(a) Do you have learners who drop out of the centre?

218
Yes [ ] No [ ]
b) If yes, what are the reasons for dropping out? ___________________
Are there exceptions for some learners to take some subjects and not
others?
Yes [ ] No [ ]
b) Please explain your answer __________________________________
Section F: Influence of community factors on NFE basic education
curriculum implementation
22. What is the role of the community in facilitating learning at the centre?
____________________________________________________________
(a)Does the community support the centre?
Yes [ ] No [ ]
b) If yes, in what ways does the community support?
Provision of food [ ]
Provision of teaching facilities [ ]
Provision of counselling services [ ]
Provision of teaching learning /resources [ ]
Volunteer work [ ]
Any other, specify ______________________________
23. What challenges do you face from the community that affect teaching and
learning in your centre?
____________________________________________________
24. What would you suggest as solution to above mentioned challenges?

219
______________________________________________________
______________________________________________________
25. What suggestions would you make for effective implementation of NFE
basic education curriculum?
______________________________________________________
______________________________________________________
End
Thank you for your co-operation

220
APPENDIX III
QUESTIONNAIRE FOR THE TEACHERS
The purpose of this questionnaire is to gather data on the implementation of Non
Formal Basic Education Curriculum in urban centres of Nairobi, Mombasa and
Kisumu. You are asked to participate in the study by filling in this questionnaire.
The researcher would like to assure you that your identity will be treated
confidentially.
Thank you!
Section A: Personal Information (Tick Appropriately)
Gender Age in years Marital
Status
Highest level of
Education
Length of
Service at
the centre
Duration in
the centre
(Years)
□ Male
□ Female
□25& Below
□26-30
□31-40
□41-50
□51-60
□Single
□Married
□Widowed
□Divorced
□Separated
□NFE
□PI Certificate
□Diploma
□Technical
education
□Higher Diploma
□ Bachelor’s degree
□Masters
□Others (Specify)
_________________
□ Below 5 yrs
□5-10 yrs
□11-15 yrs
□16-20 yrs
□21-25 yrs
□26 yrs &
above
□Below 5
□5-10
□11-15
□16-20
□21-25
□26 &
above
Section B: Information about the centre
1. When was it established? _________________________
2. Who established the centre?
Community [ ]
NGO [ ] Specify _______________________
Religious institution [ ] Specify _______________________

221
Individual [ ]
Others (specify) _________________________________
3. Who runs the centre?
Community [ ] NGO [ ]
Religious institution [ ] Individual [ ]
Others (specify) ________________________
4. How many learners do you have in the following age bracket?
Age bracket in years Number of learners
Male Female
5 – 10
11- 15
16 – 20
21- 25
26 – 30
Over 30
Section C: Influence of teacher characteristics on NFE basic education
curriculum implementation
5. What is your professional qualification?
Teacher [ ] Social workers [ ]
Any other, Specify_________________________
6. (a)Are you a trained teacher?
Yes [ ] No [ ]
(b) Have you received any in-service training on NFE curriculum?
Yes [ ] No [ ]
b) If yes, who provided the in-service training?
KIE [ ] NGO [ ]
Others, specify _____________________________________

222
c) Do you think the in-service that you received adequately prepared you
in the use of the NFE basic education syllabus?
Yes [ ] No [ ]
7. Do you use the NFE basic education syllabus in your centre?
Yes [ ] No [ ]
8. Have you received in-service training from the Kenya Institute of
Education (KIE) on the syllabus use?
Yes [ ] No [ ]
9. Do you teach technical or academic subjects?
Technical subjects [ ] Academic subjects [ ]
Both [ ]
10. Are you trained in academic/technical subjects that you teach?
Yes [ ] No [ ]
11. Are you trained in the technical subjects that you teach?
Yes [ ] No [ ]
12. Do you feel comfortable in teaching the subjects in the syllabus?
Yes [ ] No [ ]
13. a) Do you face challenges in teaching the subjects in the syllabus?
Yes [ ] No [ ]
b) If yes, what are some of the challenges that you face?
Lack of training in the subjects [ ]
Lack of teaching learning-materials [ ]
Entry behaviour of the learners [ ]
Inability in handling the learners [ ]
Any other, Specify __________________________________
Section D: Influence of adequacy and appropriateness of teaching learning
resources on NFE basic education curriculum implementation
14. Who provides the teaching and learning resources for your centre?
Community [ ] Parents [ ]

223
NGO [ ] Proprietor [ ]
Well wishers [ ] Others specify ________________
15. Are the teaching-learning resources in your centre enough for the teachers
and the learners?
Yes [ ] No [ ]
16. To what extent do you have the following materials in your centre? (Tick
as appropriate)
Material and resource Available Not
available
Adequate Not
adequate
NFE basic education syllabus NA NA
Teachers’ guide NA NA
School time table NA NA
Pupils’ text books / writing slates
Boards and chalk
Pens/pencils
Pupils’ exercise books
Wall charts
Wall maps
Desks/chairs
Agricultural area
Agricultural equipment
Art and craft tools
Woodwork tools
Welding and Fabrication equipment
Garment making tools
Motor vehicle mechanics equipment
Home science equipment

224
17. a) Do you receive the necessary teaching/learning resources when you
need them?
Yes [ ] No [ ]
b) If no, what measures to you take so that learning is not hampered?
____________________________________________________________
____________________________________________________________
Section E: Influence of learner characteristics on NFE basic education
curriculum implementation
18. Indicate with a tick (�) if you have learners with the following
characteristics
a. Learners who dropped out of formal school [ ]
b. Learners who have never been to school [ ]
c. Learners who were formally from NFE centres [ ]
19. How do you rate the attitude of the learners toward the NFE centre?
Positive [ ] Negative [ ] Neutral [ ]
20. Are learners willing to learn at the centres?
Yes [ ] No [ ]
21. a) Do you have cases of absenteeism among learners?
Yes [ ] No [ ]
b. If yes, what is the average percentage of learners who are absent in a
day?
Between 1 – 25 % [ ] Between 26 – 50 % [ ]
Between 51 – 75 % [ ] Over 75 % [ ]
c) If yes, what reasons among those stated below contribute to
absenteeism?
Disinterest in education [ ] Truancy [ ]
Working to earn a living [ ]
Others, specify _____________________________________

225
22. (a) Do the learners fully participate during the lessons?
Yes [ ] No [ ]
(b) If yes, how do you rate their involvement?
Very actively involved [ ]
Somehow involved [ ]
Not involved at all [ ]
23. (a) Do you have cases of drop out of the learners?
Yes [ ] No [ ]
(b) If yes, how would you rate the drop out?
Very high [ ] Moderately high [ ]
Low [ ] Very low [ ]
(c) What are some of the reasons for dropping out?
Disinterest in education [ ]
Involvement in business activities [ ]
Truancy [ ]
Working to earn a living [ ]
Others specify _____________________________________
24. Do you have learners who drop out and come back?
Yes [ ] No [ ]
25. a)Do learners choose what to learn and what not to learn?
Yes [ ] No [ ]
(b) If yes, what makes them have such choices?
Individual interests [ ] Age [ ]
Education background [ ] Gender [ ]
26. The following section seeks your opinion on the implementation of NFBE
curriculum. Kindly indicate the extent to which you agree or disagree with
the following statements

226
Key
SA = Strongly agree A= Agree U = Undecided D = Disagree
SD = Strongly disagree
SN Statement SA A U D SD
1 The NFE curriculum is of lower quality than the formal
curriculum
2 The NFE curriculum does not address the needs of the learners
3 The curriculum has no difference with the formal one in terms of
content
4 The lifestyle of the learners hinder curriculum implementation
5 Lack of training affects the NFE curriculum implementation
6 The learners appreciate the NFE curriculum
7 The NFE curriculum was implemented without prior preparation
8 Teachers at the NFE centres are able to fully implement the
curriculum
9 The NFE curriculum should be rolled out to other towns to cater
for learners who require NFE
10 Teachers at the centres were involved in the NFE curriculum
development
11 Most learners feel the NFE curriculum is helpful to them
12 The NFE curriculum has enabled learners join the formal schools
13 It is difficult to teach all the subjects as stipulated in the syllabus
14 The community around the centre supports the NFE centre
15 Lack of teaching materials hinder the curriculum implementation
16 The community fully supports the NFE centres
17 The mode of learning in levels is not realistic
18 Most of the learners are able to join the formal system after
completion at the NFE centres
19 The curriculum content should be redesigned to fit the learners
needs
20 The community around does not support the NFE curriculum

227
Section G: Influence of the community characteristics on NFE basic
education curriculum implementation
27. How does the community perceive the education offered at the centre?
Very helpful [ ] Helpful [ ]
Not helpful [ ]
28. Does the community around the centre approve the NFE curriculum?
Yes [ ] No [ ]
29. a) As a teacher at the NFE centre, do you think the NFE curriculum is
appropriate for the kind of the learners you have?
Yes [ ] No [ ]
b) Please explain your answer __________________________________
30. Does the community provide the necessary facilities and resources to the
centres?
Yes [ ] No [ ]
31. What challenges do you face in the implementation of NFE Basic
Education Curriculum? _______________________________________
32. What would you recommend to the following stakeholders in order to
facilitate NFE basic education curriculum implementation?
Government _________________________________________________
Ministry of Education _________________________________________
Community _________________________________________________
Kenya Institute of Education (KIE) ______________________________
32. What suggestions would you recommend for effective NFE Basic
education curriculum implementation?
____________________________________________________________
End
Thank you for your co-operation

228
APPENDIX IV
FOCUS GROUP DISCUSSION GUIDE FOR LEARNERS
The following semi-structured questions constitute the items in the focus
group discussion with the learners at the NFE centres
Name of the centre _______________________________________
Town _______________________________________
Number of discussants Male ________________
Female_______________
Name of recorder _________________________________________
1) Why did you join the centre (probe for reasons for joining NFE)
2) Where were you before you joined the centre (previous schooling?)
3) Do you like what you are taught here? (probe for relevance NFE)
4) What subjects do you like most? (probe for interest in curriculum content)
5) Do you like your teachers? (probe for ways that teachers handle them)
6) Are you provided with the materials you need for learning? (probe for
availability of T/L materials)
7) Why are you not in the formal schools (probe for reasons for NFE)
8) What things don’t you like in your centre? (probe for challenges in the
centre)
9) Do you think what you learn will be helpful for you in the future? (probe
for future expectations)
10) How do you apply what you learn in the day to day life? (probe for use of
the skills and knowledge acquired)
11) What do you think should be done to make you learn better? (suggestions
for effective implementation)

229
APPENDIX V OBSERVATION CHECKLIST FOR MATERIALS AND RESOURCES
Name of centre _____________________________________ Date of establishment _____________________________________ Service provider _____________________________________ Number of teachers _____________________________________ Number of learners _____________________________________ Available = A; Not available = NA; Adequate = AD; Not adequate = NAD; Not appropriate = NP; appropriate = AP. These will apply only where it is appropriate
Material/facilities AVAILABILITY APPROPRIATENESS
A NA AD NAD AP NP
Classroom roofing
Classroom floor
Classroom location
Classroom lighting
Classroom floor
Classroom ventilation
Classroom doors
Classroom windows
Facilities A NA AD NAD AP NP
Desks/chairs
Administration block
Staffroom
Toilets
Playing ground
Agriculture land
Art and craft room
Woodwork room
Welding and fabrication room
Garment making room
Motor vehicle mechanics room
Home science room

230
APPENDIX VI
LESSON OBSERVATION SCHEDULE
Name of the centre _______________________________
Town _______________________________
Lesson observed _______________________________
Duration of the lesson _______________________________
Is there a scheme of work Yes [ ] No [ ]
1= Unsatisfactory, 2=Satisfactory, 3= good, 4=Very good 5 = excellent
SN Lesson development 1 2 3 4 5
2 Sequence of lessons
3 Range of teaching and learning activities
4 Instructional materials
5 Assessment of learning outcomes

231
Instructional methods employed
The researcher will observe the teaching method applied and record in the table
below using the following key:
Appropriate = A Not appropriate =NA
Teaching method employed Rating
Tick A NA
1 Lecturer
2 Group discussion and presentation
3 Individual presentation
4 Role play
5 Question and answer
6 Project

232
APPENDIX VII
DOCUMENT ANALYSIS GUIDE
Name of the centre __________________ Town _________________
Year of establishment of the centre ____________________________
Number of learners at the inception of the programme
Male _______________ Female ___________________
Number of learners who completed the programme since its inception
Male _________________ Female _________________
Number of learners who have dropped out since its inception ______________
Number of learners who transited to formal education since its inception
Male _______________ Female __________________
Number or learners who established businesses using skills they acquired from
the centre
Male ______________ Female __________________
Types of businesses that that learners who have graduated from the centres are
involved in
____________________________________________
____________________________________________
The researcher will record any other relevant information gathered related to
study
____________________________________________

233
APPENDIX VIII
LETTER OF AUTHORIZATION

234
APPENDIX IX
RESEARCH PERMIT


![Factors influencing[1]](https://static.fdocuments.in/doc/165x107/54be1c8d4a795948378b4597/factors-influencing1.jpg)