FACTORS INFLUENCING ACCESS TO CREDIT IN THE …
64
FACTORS INFLUENCING ACCESS TO CREDIT IN THE RENEWABLE ENERGY SECTOR: THE CASE OF BIOGAS IN KENYA BY BERNARD M. MULANDI REG: D61/66982/2011 A RESEARCH PROJECT SUBMITTED IN PARTIAL FULFILLMENT OF THE REQUIREMENTS FOR THE DEGREE OF MASTER OF BUSINESS ADMINISTRATION (MBA) UNIVERSITY OF NAIROBI OCTOBER 2013
Transcript of FACTORS INFLUENCING ACCESS TO CREDIT IN THE …
FACTORS INFLUENCING ACCESS TO CREDIT IN THE
RENEWABLE ENERGY SECTOR: THE CASE OF BIOGAS
IN KENYA
BY
BERNARD M. MULANDI
REG: D61/66982/2011
A RESEARCH PROJECT SUBMITTED IN PARTIAL
FULFILLMENT OF THE REQUIREMENTS FOR THE DEGREE
OF MASTER OF BUSINESS ADMINISTRATION (MBA)
UNIVERSITY OF NAIROBI
OCTOBER 2013

ii
DECLARATION
This research project is my original work and has not been submitted for the award of a degree in any other university.
Signed: …………..……………………………….. Date: ……………………
Bernard M. Mulandi
Reg. No.: D61/66982/2011
This research project has been submitted for examination with my approval as university supervisor.
Signed: …………………………………………… Date: …………………
Dr.Sifunjo Kisaka
iii
ABSTRACT
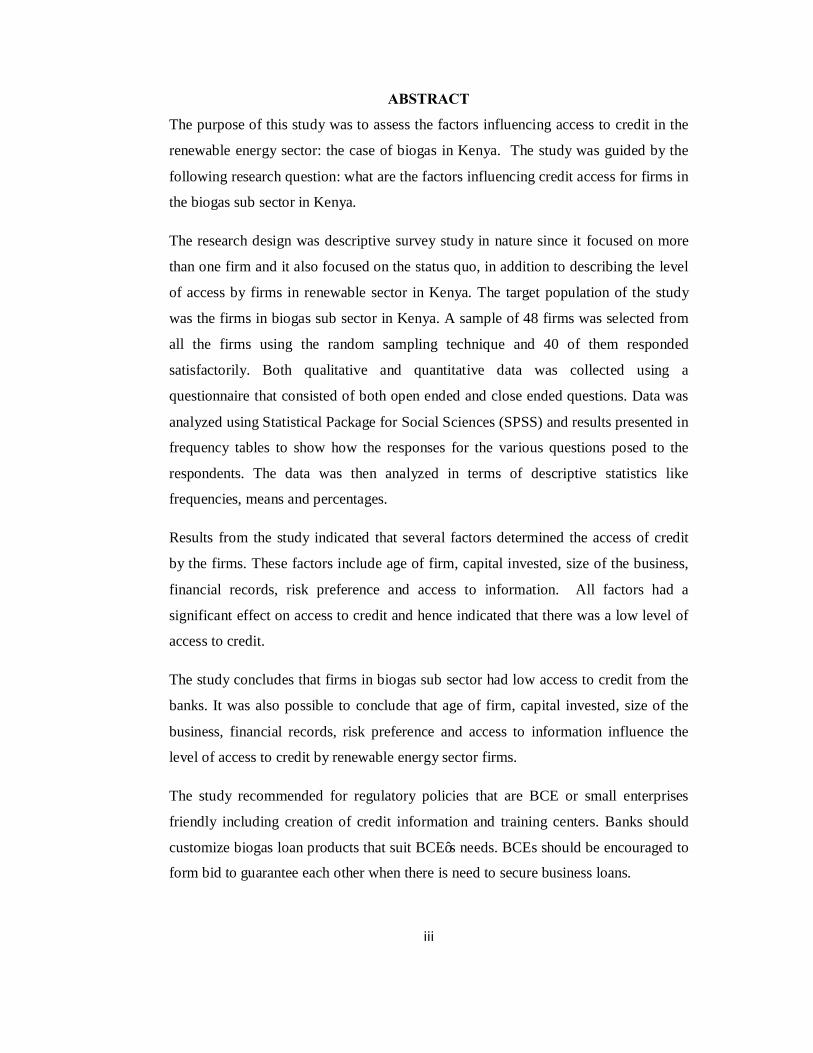
The purpose of this study was to assess the factors influencing access to credit in the
renewable energy sector: the case of biogas in Kenya. The study was guided by the
following research question: what are the factors influencing credit access for firms in
the biogas sub sector in Kenya.
The research design was descriptive survey study in nature since it focused on more
than one firm and it also focused on the status quo, in addition to describing the level
of access by firms in renewable sector in Kenya. The target population of the study
was the firms in biogas sub sector in Kenya. A sample of 48 firms was selected from
all the firms using the random sampling technique and 40 of them responded
satisfactorily. Both qualitative and quantitative data was collected using a
questionnaire that consisted of both open ended and close ended questions. Data was
analyzed using Statistical Package for Social Sciences (SPSS) and results presented in
frequency tables to show how the responses for the various questions posed to the
respondents. The data was then analyzed in terms of descriptive statistics like
frequencies, means and percentages.
Results from the study indicated that several factors determined the access of credit
by the firms. These factors include age of firm, capital invested, size of the business,
financial records, risk preference and access to information. All factors had a
significant effect on access to credit and hence indicated that there was a low level of
access to credit.
The study concludes that firms in biogas sub sector had low access to credit from the
banks. It was also possible to conclude that age of firm, capital invested, size of the
business, financial records, risk preference and access to information influence the
level of access to credit by renewable energy sector firms.
The study recommended for regulatory policies that are BCE or small enterprises
friendly including creation of credit information and training centers. Banks should
customize biogas loan products that suit BCE’s needs. BCEs should be encouraged to
form bid to guarantee each other when there is need to secure business loans.

iv
DEDICATION
This dedication goes to my family; my good wife Felister Ben and our beloved son
Israel Mulandi who greatly inspired me to complete this course for their sake.
To my mother Priscilla Ndanu, my father Mulandi Nzuka and my sister M/s purity
Mumbi for their support and encouragement.
Finally to my son Israel. may this work be an inspiration for him to seek more
knowledge in the world.

v
ACKNOWLEDGEMENT
My greatest appreciation goes to my supervisor Dr. Sifunjo Kisaka for his timely
guidance and assistance which was very instrumental for the completion of this
project.
My sincere gratitude goes to my employer, Chief Executive Officer, Kenya National
Farmers Federation (KENAFF) Dr. John Mutunga and the GM-Technical affairs
Mr.George Nyamu for their patience and understanding, which made it possible for
me to secure permission to be out of office while I carried out the study.
I feel grateful to my brothers and sisters for offering me both moral and material
support.
Finally I appreciate my friends and other family members for the moral support they
have accorded me.
May God Almighty bless them all.
vi
TABLE OF CONTENTS
DECLARATION ..................................................................................................... ii
ABSTRACT ............................................................................................................ iii
DEDICATION.............................................................................................................iv
ACKNOWLEDGEMENT...........................................................................................v
TABLE OF CONTENTS ....................................................................................... vi
LIST OF FIGURES ................................................................................................. x
LIST OF TABLES .................................................................................................. xi
LIST OF ABREVIATIONS .................................................................................. xii
CHAPTER ONE ...................................................................................................... 1
INTRODUCTION ................................................................................................... 1
1.1 Background of the Study ............................................................................. 1
1.1.1 Access to Credit…. ................................................................................. 1
1 .1.3 Renewable Energy Sectors ...................................................................... 3
1.2 Problem Statement ...................................................................................... 7
1.3 Objectives ................................................................................................... 8
1.4 Importance of the Study .............................................................................. 8
CHAPTER TWO ................................................................................................... 10
LITERATURE REVIEW...................................................................................... 10
2.1 Introduction .............................................................................................. 10
2.2. Theoretical Framework .......................................................................... 10
vii
2.2.1 Credit Rationing Theory........................................................................ 10
2.1.2 Financial Inclusion Theory .................................................................... 12
2.3 Empirical Literature................................................................................... 13
2.3.1 Entrepreneurial Characteristics and Access to Credit .............................. 13
2.3.2 Firm Characteristics and Access to Credit .............................................. 14
2.3.3 Determinants of Access to Credit .......................................................... 15
2.4 Credit Access in Kenya ............................................................................ 17
2.5 Summary .................................................................................................. 18
CHAPTER THREE ............................................................................................... 20
RESEARCH METHODOLOGY .......................................................................... 20
3.1 Introduction .............................................................................................. 20
3.2 Research Design ........................................................................................ 20
3.3 Population ................................................................................................. 20
3.4 Sample ..................................................................................................... 20
3.5 Data and Data Collection .......................................................................... 21
3.6 Data Analysis ........................................................................................... 21
3.6.1 Conceptual Model ................................................................................. 22
3.6.2 Empirical Model ................................................................................... 24
CHAPTER FOUR ................................................................................................. 25
DATA ANALYSIS AND PRESENTATION ........................................................ 25
viii
4.1 Introduction .............................................................................................. 25
4.2 Summary Statistics .................................................................................... 25
4.2.1 Response Rate........................................................................................ 26
4.2.2 Nature of Business ................................................................................. 26
4.2.2 Legal Registration ................................................................................. 26
4.2.3 Age of Firm .......................................................................................... 27
4.2.4 Level of Education ................................................................................ 27
4.2.5 Position Held ......................................................................................... 28
4.2.6 Capital Invested ..................................................................................... 28
4.2.7 Number of Employees........................................................................... 29
4.2.8 Financial Records .................................................................................. 30
4.2.9 Risk Preference ...................................................................................... 30
4.2.10 Access to Information ........................................................................... 31
4.2.11 Level of Access..................................................................................... 31
4.3 Inferential Statistics and The Estimated Model ......................................... 33
4.3.1 Bivariate Correlations ............................................................................ 33
4.3.2 Regression Analysis……………………………………………………….35
4.4 Discussion ................................................................................................ 36
4.5 Summary .................................................................................................. 38
CHAPTER FIVE ................................................................................................... 39

ix
SUMMARY AND CONCLUSION ....................................................................... 39
5.1 Introduction ................................................................................................... 39
5.2 Summary of the Study.................................................................................... 39
5.3 Conclusion ..................................................................................................... 41
5.4 Limitations of the Study ................................................................................. 42
5.5 Recommendations .......................................................................................... 43
REFERENCES ...................................................................................................... 45
APPENDIX I QUESTIONNAIRE ........................................................................ 49

x
LIST OF FIGURES
Figure 4.1 Legal Registration .................................................................................. 26
Figure 4.2 Age of the Firm...................................................................................... 27
Figure 4. 3 Level of Education ................................................................................. 28
Figure 4.4 Number of Employees ........................................................................... 29
Figure 4.5 Financial Records .................................................................................. 30
Figure 4.6 Risk Preference ...................................................................................... 30
xi
LIST OF TABLES
Table 4.1 Response Rate .......................................................................................... 25
Table 4.2 Nature of the Business.............................................................................. 26
Table 4.3 Position Held ........................................................................................... 28
Table 4.4 Capital Invested ....................................................................................... 29
Table 4.5 Access to Information .............................................................................. 31
Table 4.6 Level of Access ........................................................................................ 32
Table 4.7 Correlations between Factors Influencing Access to Credit ...................... 34
Table 4.8 Regression Model Fitness ........................................................................ 35
Table 4.9 Analysis of Variance (ANOVA)............................................................... 35
Table 4.10 Relationship between Access to Credit and its Determinants .................. 36

xii
LIST OF ABREVIATIONS
ABPP Africa Biogas Partnership Programme
BCE Biogas Construction Enterprise
BT Biogas Technician
BDS Business Development Support
DGIS Directorate-General for International Cooperation
GTZ German Technical Cooperation
KENBIM Kenya Biodigester Model
KENDBIP Kenya National Domestic Biogas Programme
KENFAP Kenya National Federation of Agricultural Producers
MDG Millennium Development Goal
MFI Micro-Financing Institution
MoE Ministry of Energy
NGO Non-Governmental Organisation
NIA National Implementing Agency
PID Programme Implementation Document
PSDA Private Sector Development in Agriculture
SACCO Savings and Credit Cooperative Society
SME Small and Medium size Enterprise
SNV Netherlands Development Organisation
SPSS Statistical Package for Social Sciences
USD United States Dollar
1
CHAPTER ONE
INTRODUCTION
1.1 Background of the Study
Small and Medium Enterprises (SME's) are important for raising the economic
efficiency of a country. They are breeding grounds for entrepreneurship, innovations
and inventions hence a reservoir for employment. Sustainable jobs create income
which in turn reduces the level of poverty. Access to credit is a key constraint for
SMEs in developing countries and there is need to develop credit access indicators
from an individual firm borrower’s point of view. Despite extensive economic and
financial sector reforms over the last few decades, many Sub-Saharan African
countries, including Kenya still face a severe financial development gap. This is not
only relative to the advanced economies but also other peer developing economies as
well. A key obstacle to financial development is access of the disadvantaged to credit,
which would promote economic growth at the broadest scales.
1.1.1 Access to Credit
World Bank report (2007), states that financial inclusion or broad access to financial
services is defined as an absence of price or non price barriers in the use of financial
services. It recognizes the fact that financial inclusion does not imply that all
households and firms should be able to borrow unlimited amounts or transmit funds
across the world for some fee. It makes the point that creditworthiness of the customer
is critical in providing financial services.
The World Bank report (2007) also stresses the distinction between “access to’ and
‘use of’ financial services as it has implications for policy makers. ‘Access’
essentially refers to the supply of services, whereas use is determined by demand as
well as supply. Among the non users of formal financial services a clear distinction
needs to be made between voluntary and involuntary exclusion. The problem of
financial inclusion addresses the ‘involuntarily excluded’ as they are the ones who,
despite demanding financial services do not have access to them.
Access to finance is measured through statistics on number of deposit and loan
accounts and the retail locations for banks. To measure credit access, the World Bank

2
collected the first set of indicators of financial access through a survey of bank
regulators in countries around the world in 2005 (Beck, Demirguc-Kunt, Martinez
Peria, 2007) . The bank then updated these indicators for selected countries in 2008
(“Banking the Poor”, 2008) and rolled out an annual survey starting in 2009 under the
name Financial Access implemented by Consultative Group to Assist the Poor
(CGAP) with the first report published in October 2009. However, this statistics do
not address access of finance by individual firm borrowers.
It is easy to understand how rapid credit access facilitates economic growth. When
credit is expanding, consumers can borrow and spend more and businesses can
borrow and invest more. Increasing consumption and investment creates jobs and
expands income and profit. Moreover, the expansion of credit tends to cause the price
of assets such as stocks and property to increase, thereby boosting the net worth of the
public. Eventually, however, every credit-induced economic boom comes to an end
when one or more important sectors of the economy become incapable of repaying
the interest on its debt (Storey, D.J 2004).
While the success of microfinance institutions (MFIs), such as Grameen Bank, has
captured the attention of many economists and policy makers, some MFIs are now
beset by non-repayment problems and high cost of financing. Meanwhile, most
established commercial banks view the sectors targeted by MFIs as ‘unbankable.’ In
fact, we are only beginning to understand the specific policies and institutions that
best promote financial inclusion in environments endowed with asymmetric
information, weak institutions and the absence of basic infrastructures necessary for
banking (e.g., access to roads) (Chaia et al., 2011).
Recent studies such as Honohan (2008) show that in the early 2000s, roughly 2.5
billion adults, or half of the world’s adult population, lacked any bank account; in
Sub-Saharan Africa, the setting for our study, over eighty percent of the adult
population lacked an account during that same period.
1.1.2 Factors Influencing Access to Credit
Research studies reveal that age, capital, size, information access, risk and financial
records are key factors influencing credit access by firms. Others include; Interest

3
rates, borrower’s education level and past financial performance. These factors can be
categorized into three namely; entrepreneur characteristics, firm characteristics and
financial characteristics (World Bank report (2007).
1 .1.3 Renewable Energy Sectors
1.1.3.1 Energy Sources In Kenya
The three main sources of electricity generation in Kenya are hydropower, diesel
thermal and geothermal plants, along with several minor sources. From 2004 to 2011,
increases in electricity supply generally came from fossil fuels and geothermal.
Geothermal has shown the greater proportional increase in installed capacity (58%
compared to 45% fossil), despite the fact that set-up costs are significantly higher than
for fossil fuels. Launched over 50 years ago, geothermal energy is only now emerging
as a significant electric power resource for Kenya. Assessments of geothermal
hotspots indicate an estimated potential of 7,000–10,000 MW in the Kenyan Rift
Valley. By 2030, the GoK intends to tap into its rich geothermal potential, drastically
increasing geothermal capacity to twice that of fossil fuels. Hydropower production is
projected to remain relatively stable (Climate and Development Knowledge Network,
2013).
1.1.3.2 Supply, Demand and Financing of Energy In Kenya
Total current power generation in Kenya amounts to 1,479MW, with an access rate of
less than 25 percent and per capita electricity consumption of 1 47 kWh (122ndin the
world). The generation mix includes: 50% hydro, 35% thermal, 13% geothermal, 2%
cogeneration, and others. The average retail tariff is of 15 cents/kWh, which
compares well with neighboring countries (for example, Rwanda 20 cents, Ethiopia 3
cents, Uganda 12 cents, Tanzania 8 cents). The system has been expanding at 4.2%
p.a. between 2002-2011. Under the Vision 2030’s Least Cost Power Development
Plan (LCPDP), the ambition is to develop geothermal 5,000+MW, wind 2,000+MW,
an expansion of 9.3% p.a. with USD 23 billion in renewable energy generation, USD
4.5 billion in transmission (World Economic Forum, 2012).
4
Kenya’s ambitious clean energy development plan will require significant financing.
Around 45billion USD are estimated by year 2030, of which 60% on the generation
side (41.4bn USD) and the rest (3.9bn USD) for transmission. Over the next 5 years,
the financing needs are estimated at around 7.3 billion USD of which around 1 billion
USD for geothermal resource assessment, around 3.6 billion USD for generation,
(around 2 billion USD for transmission and the rest for distribution .
Donors are deploying a range of financing tools (grants, mixed grants and loans),
with concessional lending representing 98% of current donor financing. Projects
range from large infrastructure projects, such as interconnectors and geothermal
plants, to smaller rural electrification, technical assistance and capacity building.
Around 51% of donor financing is focused on generation,20% on transmission, 13%
on distribution and the remainder on other sector-wide needs (World Economic
Forum, 2012).
1.1.3.3 Biogas Technology
Biogas technology has been tried and supported through different initiatives in Kenya
since 1946 when the first biogas was put up in Nyandarua sub-county financed among
others by UNDP, GTZ/PSDA, DGIS (PID, 2009). Technology is defined as people
using knowledge, tools, and systems to make their lives easier and better. Biogas
technology is therefore, a complete system in itself; it includes cost effective
production of energy and fertilizer for the soil. Biogas technology has been
recommended as one of the most appropriate renewable energy technologies for rural
areas in developing countries because of the many advantages. Biogas dissemination
in developing world has been promoted by many governments and non-governmental
organizations, but its adoption has been slow.
Biogas is produced by methanogenic bacteria acting on bio-digestible materials in
absence of oxygen in the process known as anaerobic digestion. Anaerobic digestion
is basically a simple process carried out in a number of steps that can use almost any
organic material as a substrate. It occurs in digestive systems, in marshes, rubbish
damps and septic tanks (Harris, 2005). Biogas is mainly composed of 50 to 70 percent
methane, 30 to 40 percent carbon dioxide and low amount of other gases like
5
Hydrogen (5-10), Nitrogen (1-2), water vapor (0.3) and traces of hydrogen sulphide
(FAO/CMS, 1996).
It takes 1–2 cows, 5–8 pigs, or 4 adult humans to supply adequate daily feed-stocks
for a single-household bio-digester (Brown, 2006). The daily input of dung and urine
from a single cow produces 1–2 kilowatt- hours of electricity or 8–9 kilowatt hours of
heat. In most African applications, a household biogas installation provides sufficient
energy for cooking and some lighting. Production of energy is influenced by factors
such as microbes, plant design, construction materials, climate, chemical and
microbial characteristics of inputs, and the inter-relationships among these factors
(FAO/CMS, 1996).
1.1.3.4 Benefits of Biogas Technology
Biogas has been acknowledged as being simple and cheap technology; it does not
require imported knowledge or components and also is suitable for family and/or
village scale use. Biogas is among the renewable non-conventional fuel technologies,
which involves anaerobic digestion of biomass to yield biogas and organic slurry. In
addition to gas production all disease causing organisms are eliminated making the
effluent safe for disposal or reuse as manure for crop production. Biogas is one of the
few technologies that utilize wastes as valuable resources and improves sanitation
(Rajeswaran, 1983).
Other benefits of biogas technology include reducing women’s workload, saving time
consumed for firewood collection and increase of income by saving money spent for
purchase of other energy sources (Rutamu, 1999). Furthermore according to
Rajeswaran (1983), biogas can be used for heating, cooking, and to operate an internal
combustion engine for mechanical and electric power. For engine applications it may
be advisable to scrub out hydrogen sulfide (a highly corrosive and toxic gas). Very
large-scale system/producers may be able to sell the gas to natural gas companies but
this may require scrubbing out the carbon dioxide. Material drawn from the digester is
called sludge, or effluent. It is rich in nutrients (ammonia, phosphorus, potassium,
and more than a dozen trace elements) and thus is an excellent soil conditioner.
6
1.1.3.5 Challenges of Biogas Technology
Some of the challenges associated with biogas systems include; High initial
investiment costs with a domestic plant costing an average of Kenya shillings 85,000
to install. There is low awareness of the technology among the biogas potential
markets in kenya and thus most BCE firms consider biogas as an alternative to other
competing sources of income. Biogas associations and institutions are still in the
formative stage characterized by low managerial and operational capacity and weak
infrastructure. Access to biogas loans is limited and this is presumed to be fueled by
various factors including, lack of savings to boost borrowing capacity, high
transaction costs, high interest rates, farmers negative attitude towards loans, lack of
a revolving fund, and financial institutions’ perception of rural based biogas firms and
farmers as un-credit worthy.
1.1.3.6 The Main National Biogas Institution In Kenya
The Kenya National Domestic Biogas Programme (KENDBIP) is hosted by Kenya
National Federation of Agricultural Producers (KENFAP) with capacity building
support provided by Netherlands Development Organization (SNV) and fund
management support of the Humanistic Development Organization (HIVOS) under
the African Biogas Partnership Programme (ABPP). The goal of KENDBIP is to
improve the livelihoods and quality of life of rural farmers in Kenya through
exploiting the market and non-market benefits of domestic biogas. During the first
phase (2009 – 2013), the programme is envisaged to support the construction of 8000
domestic biogas installations of specified fixed-dome design referred to as KENBIM.
The purpose of the programme is to develop a commercially viable domestic biogas
sector. Therefore the Programme implementation follows the technical potential for
domestic biogas from 2009; it aims at stimulating access to credit for biogas
construction and requisite appliances from financial institutions. It also involves
regional vocational training institutes to provide short-term biogas courses at
construction and supervision level hoping that the course will be fully incorporated
within the institute curriculum and the institute act as “knowledge broker” in its
catchment area.
7
The programme has been collaborating with relevant appropriate partners to provide
business development support (BDS) to the emerging biogas construction enterprises.
The programme has been stimulating gender inclusion in all programmes activities as
per the project design and through its Implementing Partner Infrastructure it has been
delegating with responsibilities and matching resources to develop a commercially
viable biogas sector in their catchment area. KENDBIP encourages sector
development, implying close cooperation of all relevant stakeholders (Government,
Civil Society and Private sector) in the sector at all levels (micro and macro) whereby
those stakeholders are sufficiently equipped to fulfill the necessary functions.
1.2 Problem Statement
Biogas technology has many benefits at the household level. It provides a clean
smoke free kitchen environment which reduces incidences of health related
complication. It saves on labour and time required for collecting fire wood. It also
helps to reduce deforestation and mitigation to climate change (PID, 2009). However,
financing biogas sector in Kenya has been inadequate. Micro finance institutions do
not have a biogas specific credit product though they have general development
product which could be used for biogas construction but their terms may not be
conducive to biogas clients. To stimulate the demand for domestic biogas
installations, biogas sector actors should stimulate access to credit facilities for BCE
firms to expand their business and farmers to cope with the relative high investment
costs of construction.
Research has shown that access to credit has a positive impact on growth at both a
household level and at a national level (Burgess and Pande, 2004; Klapper, Laeven
and Rajan, 2004; Dehejia & Gatti (2002), Beegle, Dehejia & Gatti (2003), and Jacoby
(1994). However, studies such as Kumar and Fransico (2006), Levine (2004), Pandula
(2011) have also pointed out that SMES face constraints when accessing credit. In
addition, studies have shown that there exist various factors that affect firm’s access
to credit. For instance, Storey (2004) specifically looked at age, capital investment,
track record, work experience and social background of the owner when accessing
credit from banks. Another study by Whincop (2001) attempted to assess how the
entrepreneurial financial gap can be bridged and therefore investigated the firm
8
characteristics such as size, age of the business, legal status, financial performance
indicators such as profit and fixed assets base. This indicates that the proper
conceptualization of the factors influencing the use or access of bank credit by firms
should at least take into consideration three types of characteristics namely;
entrepreneur characteristics, firm characteristics and financial characteristics.
Studies on credit access seem to concentrate on the SMEs in service sector which
leaves knowledge gap as far as the renewable energy sector is concerned. There is a
paucity of studies on the factors affecting credit access for firms in biogas sector in
Kenya and the researcher was not aware of any study that has been done on the study.
This study therefore sought to bridge this knowledge gap by assessing the factors
influencing credit access for firms in the biogas sector in Kenya. Specifically, this
study attempted to answer the following research question: what are the factors
influencing credit access by firms in the biogas sector in Kenya?
1.3 Objectives
The objective of the study was to establish the factors influencing credit access for
firms in the biogas sub sector in Kenya.
1.4 Importance of the Study
The study will be beneficial to various parties namely the BCE firms, the regulator in
charge of banks and MFIs, general public and scholars. The beneficiaries of loans
will find this study useful as they will learn from shared experiences on the issues
relating to factors influencing credit access. The micro credit industry will use this
study as an eye opener of the challenges facing the firms who were their past, present
and prospective clients. Consequently, they might adopt institutional remedies to curb
these challenges.
Policymakers and planners have become acutely aware of the economic significance
of men and women's productive activities and the nature of their contribution to
income generation. The findings of this study are expected to provide the policy
makers with a platform to formulate policies that would enhance productivity and
growth in line with Vision 2030. The study will act as a blue print for NGOs and
poverty reduction agencies as they increase their efforts to alleviate poverty in Kenya

9
and the world at large through micro finance. This study will be a valuable addition to
literature review as scholars of business, political economy and finance may use it to
broaden their knowledge of issues relating to microfinance.
10
CHAPTER TWO
LITERATURE REVIEW
2.1 Introduction
The chapter discusses the theoretical literature in depth in order to give the study a
theoretical underpinning. Section 2.2 will discuss the theoretical review and has
subsections 2.2.1 which will discuss credit rationing theory and 2.2.2 where the
financial inclusion/exclusion theory will be discussed. Section 2.3 will explore the
empirical literature with an aim of uncovering what has been done on the area and
identification of the missing contextual and conceptual knowledge gaps. Section 2.4
will discuss factors affecting financial inclusion in Kenya in order to give a local
perspective to the discourse on financial inclusion. Section 2.5 is a summary of the
chapter and it highlights all the main points identified in the literature.
2.2. Theoretical Framework
This section explores the various theories that can explain the determinants of credit
access to BCE firms. Several theories were advanced; these include;
2.2.1 Credit Rationing Theory
An increasing body of analytical work has attempted to explain the functioning
of credit markets using new theoretical developments. Challenging the paradigm
of competitive equilibrium, they have explored the implications of incomplete
markets and imperfect information for the functioning of credit markets in developing
countries. These provide a new theoretical foundation for policy intervention.
According to Stiglitz and Weiss (1981) interest rates charged by a credit institution
are seen as having a dual role of sorting potential borrowers leading to adverse
selection, and affecting the actions of borrowers leading to the incentive effect.
Interest rates thus affect the nature of the transaction and do not necessarily clear the
market. Both effects are seen as a result of the imperfect information inherent in credit
markets. Adverse selection occurs because lenders would like to identify the
borrowers most likely to repay their loans since the banks’ expected returns depend
on the probability of repayment. In an attempt to identify borrowers with high
11
probability of repayment, banks are likely to use the interest rates that an individual is
willing to pay as a screening device. However, borrowers willing to pay high interest
rates may on average be worse risks; thus as the interest rate increases, the riskiness of
those who borrow also increases, reducing the bank’s profitability. The incentive
effect occurs because as the interest rate and other terms of the contract change, the
behavior of borrowers is likely to change since it affects the returns on their projects.
Stiglitz and Weiss (1981) further shows that higher interest rates induce firms to
undertake projects with lower probability of success but higher payoffs when they
succeed leading to the problem of moral hazard. Since the bank is not able to control
all actions of borrowers due to imperfect and costly information, it will formulate the
terms of the loan contract to induce borrowers to take actions in the interest of the
bank and to attract low risk borrowers. The result is an equilibrium rate of interests at
which the demand for credit exceeds the supply. Other terms of the contract, like the
amount of the loan and the amount of collateral, will also affect the behavior of
borrowers and their distribution, as well as the return to banks. Raising interest rates
or collateral in the face of excess demand is not always profitable, and banks will
deny loans to certain borrowers.
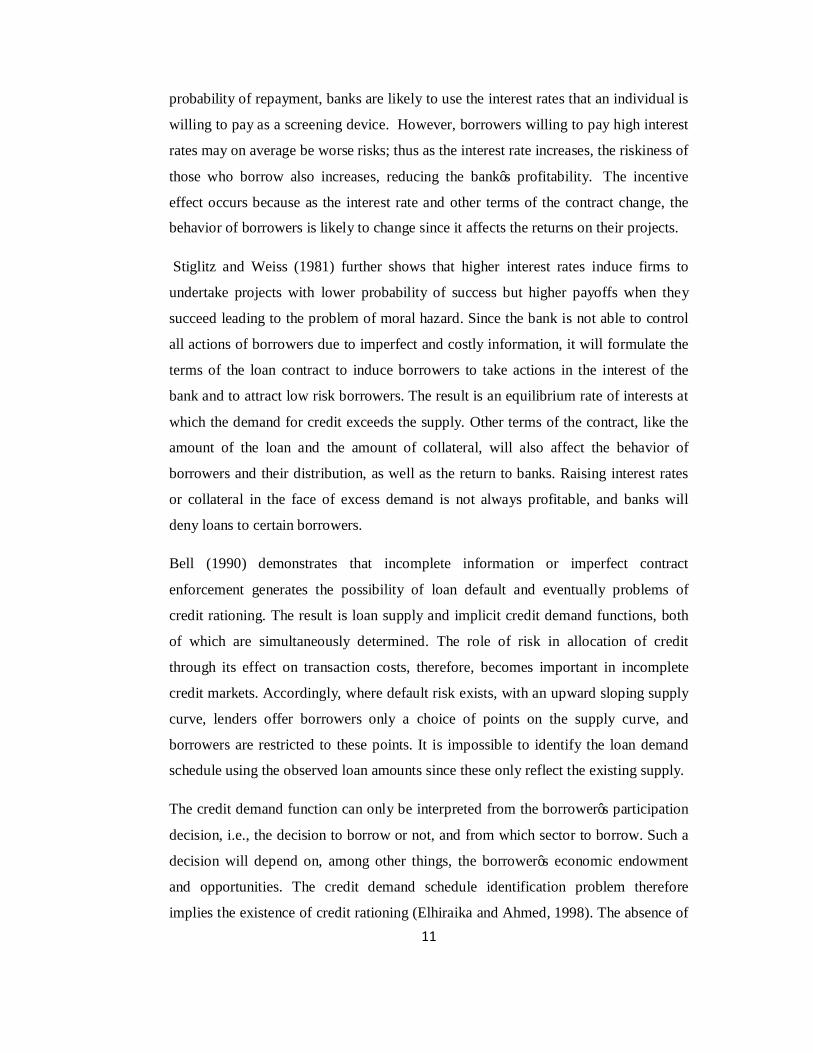
Bell (1990) demonstrates that incomplete information or imperfect contract
enforcement generates the possibility of loan default and eventually problems of
credit rationing. The result is loan supply and implicit credit demand functions, both
of which are simultaneously determined. The role of risk in allocation of credit
through its effect on transaction costs, therefore, becomes important in incomplete
credit markets. Accordingly, where default risk exists, with an upward sloping supply
curve, lenders offer borrowers only a choice of points on the supply curve, and
borrowers are restricted to these points. It is impossible to identify the loan demand
schedule using the observed loan amounts since these only reflect the existing supply.
The credit demand function can only be interpreted from the borrower’s participation
decision, i.e., the decision to borrow or not, and from which sector to borrow. Such a
decision will depend on, among other things, the borrower’s economic endowment
and opportunities. The credit demand schedule identification problem therefore
implies the existence of credit rationing (Elhiraika and Ahmed, 1998). The absence of
12
supply for credit creates a lack of demand expressed in low revealed demand. Again,
due to market failure in the credit market, the transaction cost involved in obtaining
credit is considered greater than the utility, prompting entrepreneurs to switch profits
between activities as a way of financing working capital. This also explains the
existence of informal credit markets alongside formal credit institutions.
2.1.2 Financial Inclusion Theory
Financial inclusion refers to the process of ensuring access to appropriate financial
products and services needed by all sections of the society in general and vulnerable
groups such as weaker sections and low income groups in particular, at an affordable
cost, in a fair and transparent manner, by mainstream institutional players
(Chakrabarty, 2011). An inclusive financial sector that provides ‘access’ to credit for
all ‘bankable’ people and firms, to insurance for all insurable people and firms, to
savings and payment services for everyone (United Nations 2006 b). Inclusive finance
does not require that everyone who is eligible use each of the services, but they should
be able to choose to use them if desired.
Worldbank (2008) has classified financial access barriers into four main categories;
physical barriers, lack of documentation barriers, affordability barriers and lack of
appropriate products and services. For Geographic access, branches have been the
traditional bank outlet, hence geographic distance to the nearest branch, or the density
of branches relative to the population can provide a first crude indication of
geographic access or lack of physical barriers to access (Beck, Demirguc-Kunt and
Martinez Peria (2007).
Limiting eligibility and documentation requirements is another barrier to access. For
example banks in Albania, the Czech Republic, Mozambique, Spain and Sweden
demand on average only one document to open a bank account, whereas banks in
Tobago, Uganda and Zambia require at least four documents, including an identity
card or passport, recommendation letter, wage slip and proof of domicile
(Worldbank,2008). Given the high degree of informality in many developing
countries, only a small proportion of the population can produce these documents.
13
Kempson et al (2004) report that financial exclusion is most prevalent amongst those
on low incomes. Unemployed people living on social security payments from the state
are therefore especially vulnerable, as are low income households from ethnic
minority communities who may also have relatively low levels of engagement with
the financial services industry. Kempson et al (2004), supported by evidence from the
Family Resources Survey 2002-2005, report that uptake of financial products and
services is lowest amongst African-Caribbean, Black, Pakistani and Bangladeshi
households in the UK. However, for some members of these groups religious beliefs
may provide a partial explanation for this apparent exclusion.
2.3 Empirical Literature
2.3.1 Entrepreneurial Characteristics and Access to Credit
Storey (2004) conducted a study on racial and gender discrimination in the micro
firm’s credit market and demonstrated evidence from Trinidad and Tobago. The
study was built upon human capital theory and specifically looked at education, age,
work experience and social background of the owner when accessing credit from
banks. Deakins, et al (2008) conducted a study on SMEs access to finance and
specifically on whether the debt finance gap still existed. The authors suggested that
demand side factors that affected SMEs access to bank finance were due to fear of
outright rejection and receiving less than what they expected. Deakins et al (2008)
also cites Fraser (2005) who asserted that willingness to approach, feeling
discouraged from applying because they expect to be rejected was a demand side
factor for credit access.
Pandula (2011) conducted a survey into the SMEs access to bank finance with a focus
on a developing economy (Sri Lanka). The author used a Chi square statistic to assess
whether the determinants of access to credit is significantly different among the credit
rationed firms and not rationed firms. The chi square results indicated that, education
of the entrepreneur and having membership with business association are associated
with access to bank finance. Somewhat unexpectedly, all other factors identified in
the study did not show any association with access to credit.
14
2.3.2 Firm Characteristics and Access to Credit
A study by Whincop (2001) attempted to assess how the entrepreneurial financial gap
can be bridged and therefore investigated the firm characteristics such as size, age of
the business, legal status and financial characteristics such as profit, fixed assets base.
Kumar and Francisco (2005) conducted a study on enterprise size, financing patterns
and credit constraints in Brazil. Specifically, the authors investigated the importance
of firm size with respect to access to credit, relative to firm performance, and other
factors which may affect creditworthiness, such location, or the industrial sector to
which the firm belongs. The principal findings were that size strongly affects access
to credit, compared to performance as well as other variables, suggesting quantitative
limitations to credit access. Looking at short-versus long-term loans, the impact of
size on access to credit was greater for longer-terms loans.
Kumar and Francisco (2005) conducted a study on enterprise size, financing patterns
and credit constraints in Brazil. The authors argued that looking at short-versus long-
term loans, the impact of size on access to credit was greater for longer-terms loans.
Finally, examining the role of financial constraints relative to other constraints faced
by the firm, it was found however that credit access constraint may have a less
significant differential impact across firms of different sizes than other constraints
though cost of finance as a constraint is very important.
Deakins, et al (2008) conducted a study on SMEs access to finance and specifically
on whether the debt finance gap still existed. The authors suggested that demand side
factors that affected SMEs access to finance from the bank included age of the firm
with younger firms experiencing lower access, size of the firm with smaller firms
experiencing lower access to credit, access to collateral, and geographical location
with rural SMEs experiencing lower access to finance than urban SMES.
Firm size is one of the important variables in literature related to access to credit.
Numerous studies have discussed that small and medium enterprises are financially
more constrained than large firms. For example Pandula (2011) noted that when the
company is smaller, the restrictions on credit are greater. Further research has
demonstrated that small firms usually do not have audited financial reports, are owned
and operated by the entrepreneur himself and there is no such legal requirement to
15
regularly report financial information. In addition smaller firms have less assets to
offer as collateral as compared to larger firms.
Ajagbe (2012) analyzed determinants of access and demand for credit by small scale
entrepreneurs from Oyo State in Nigeria. The empirical result showed that the
respondent’s age, membership of a social group, value of asset, education and the
nature of the credit market are the major determinants of credit access and demand
among respondents.
2.3.3 Determinants of Access to Credit
A study on the determinants of credit rationing among formal and informal lenders
was conducted by Zeller (1994) in Madagascar. The regression results showed that
the probability of applying for informal credit increases with age, years of education,
and number of sick days of household during the recall period. On the other hand, the
probability of being credit constrained by the informal lender increases with age, and
years of education. The study also identified the leverage ratio of household as the
most important determinant for loan rationing. Physical collateral plays a minor role
in credit rationing.
Berger and Udell (2004) conducted a study on how SMEs can overcome growth
constraints. The authors argued that the availability of external finance for small and
medium enterprises (SMEs) is a topic of significant research interest to academics and
an issue of great importance to policy makers around the globe. However, Berger and
Udell (2004) also asserted that a conceptual framework of factors affecting SME
credit availability should focus on national financial institution structures and lending
infrastructures and the way in which these elements of the financial system affect
SME credit availability. By financial institution structure, the authors meant the
market presence of different types of financial institutions that provide credit, as well
as the competition among these institutions. By lending infrastructure, the authors
meant the rules and conditions set up mostly by governments that affect financial
institutions and their abilities to lend to different potential borrowers. The authors
further argued that differences in the financial institution structure and lending
infrastructure may significantly affect the availability of funds to SMEs by affecting
the feasibility with which financial institutions may employ the different lending
16
technologies in which they have comparative advantages to provide funds to different
types of SMEs.
Kumar and Francisco (2005) conducted a study on enterprise size, financing patterns
and credit constraints in Brazil. Looking at the ownership of the lending institution, it
was found that public financial institutions are more likely to lend to large firms than
to small firms.
Deakins et al (2008) indicated that supply side factors that affected access to finance
included lack of business performance and credit worthiness information about the
borrower, policy and practices of banks affected access to finance, banking structure
(existence of subsidiaries for referral). Specific bank practices and policies include the
5 Cs of lending. The 5 Cs of lending include collateral, character, capacity, capital,
conditions. The 5 Cs are most commonly used models by banks in evaluating lending
propositions. The 5Cs model looks at a range of aspects associated with lending
covering both the finance being sought as well as the characteristics of the borrower.
Character stands for the characteristics of the borrower such as honesty and
trustworthiness, Capacity considers ability to pay in terms of acquired skills and
experience, Capital measures the net value of the entrepreneurs in terms of assets and
liabilities, Collateral is the security required in lending which acts as a cushion against
borrower’s inability to repay the loan / credit. Conditions are those set by the bank
such as turnovers levels and profitability, Purpose of loans which refers to the need
for the requested amount, period of business operations, Amount which refers to
adequacy of the credit, Repayment which refers to source and timing to repay back
the credit (Binks, & Ennew, 1996).
Ugbomeh (2008) investigated determinants of loan repayment performance among
women self-help groups in Bayelsa State, Nigeria. The estimated regression model
indicated that women as household heads, interest rate, household size, price stability
of farm proceeds, and commitment to self help groups significantly affected loan
repayment of women farmers in the group. Oboh (2009) examined the socio-
economic determinants of farmers’ loan size in Benue State, Nigeria. The result
shows that annual income, distance from the farmer’s resident to credit source, farm

17
size and previous loan status were significant factors that encouraged larger loan size
to farmers.
Henri-Ukoha et al. (2011) studied determinants of loan acquisition from the financial
institutions by small-scale farmers in Ohafia agricultural zone of Abia state, Southeast
Nigeria. Factors that influenced the amount of loan disbursed by the financial
institutions were age of the farmers, level of education, farming experience and farm
size. Oboh and Kushwaha (2009) studied the effect of socio-economic and
demographic factors on the rate of credit allocation to the farm sector by arable crop
farmers in Benue State, Nigeria. Empirical result reveals that factors that affect the
rate of credit allocation to the farm in the study area were; age, education, farm size,
household size, length of loan delay and visitation by lenders.
Lawal et al. (2009) found that a direct relationship exists between social capital and
credit access, and that membership and cash contribution in the associations’ by the
farming households drives access to credit positively for productivity and welfare.
According to development professionals, the lack of access to credit by poor rural
households has negative effect on farm business expansion.
Akudugu (2012) estimated the determinants of credit demand by farmers and supply
by Rural Banks in the Upper East Region of Ghana. Semi-structured questionnaire
complemented by key informant interviews and focus group discussions were used in
gathering data from 250 farmers in 5 districts of Upper East Region. The logit model
was used to estimate the determinants of credit demand by farmers and the Tobit
model used to estimate the determinants of credit supply by Rural Banks. The
findings showed that age of farmers, gender and political affiliations among others
were the main determinants of credit demand by farmers. Type of crop grown, farm
size and the amount of savings made were some determinants of credit supply by the
Rural Banks.
2.4 Credit Access in Kenya
Credit constraints operate in variety of ways in Kenya where undeveloped capital
market forces entrepreneurs to rely on self-financing or borrowing from friends or
relatives. Lack of access to long-term credit for small enterprises forces them to rely
18
on high cost short term finance. There are various other financial challenges that face
small enterprises. They include the high cost of credit, high bank charges and fees.
The scenario witnessed in Kenya particularly during the climaxing period of the year
2008 testifies the need for credit among the common and low earning entrepreneurs.
Numerous money lenders in the name of Pyramid schemes came up, promising hope
among the ‘little investors,’ that they can make it to the financial freedom through soft
borrowing. The rationale behind turning to these schemes among a good number of
entrepreneurs is mainly to seek alternatives and soft credit with low interest rates
while making profits. Financial constraint remains a major challenge facing SMEs in
Kenya (Wanjohi and Mugure, 2008).
Ng’eno et al. (2011) studied farmers’ inaccessibility to agricultural credit in
Nyandarua District, Kenya. The study established that socio-economic constraints
such as age, gender, household size, farm income, collateral and awareness are critical
determinants of access to credit.
Lack of access to credit is almost universally indicated as a key problem for SMEs
(including Biogas entrepreneurs) in Kenya. In some cases, even where credit is
available, the entrepreneur may lack freedom of choice because the lending conditions
may force the purchase of heavy, immovable equipment that can serve as collateral
for the loan.
2.5 Summary
Biogas technology has many benefits at the household level. It provides a clean
smoke free kitchen environment which reduces incidences of health related
complication. It saves on labour and time required for collecting fire wood. It also
helps to reduce deforestation and mitigation to climate change (PID, 2009). However,
financing biogas sector in Kenya has been inadequate. Micro finance institutions do
not have a biogas specific credit product though they have general development
product which could be used for biogas construction but their terms may not be
conducive to biogas clients. To stimulate the demand for domestic biogas
installations, biogas sector actors should stimulate access to credit facilities for BCE
19
firms to expand their business and farmers to cope with the relative high investment
costs of construction.
Research has shown that access to credit has a positive impact on growth at both a
household level and at a national level (Burgess and Pande, 2004; Klapper, Laeven
and Rajan, 2004; Dehejia & Gatti (2002), Beegle, Dehejia & Gatti (2003), and Jacoby
(1994). However, studies such as Kumar and Fransico (2006), Levine (2004), Pandula
(2011) have also pointed out that SMEs in general face constraints when accessing
credit. In addition, studies have shown that there exist various factors that affect firms
access to credit. For instance, Storey (2004) specifically looked at education, age,
work experience and social background of the owner when accessing credit from
banks. Another study by Whincop (2001) attempted to assess how the entrepreneurial
financial gap can be bridged and therefore investigated the firm characteristics such as
size, age of the business, legal status and financial characteristics such as profit, fixed
assets base. This indicates that the proper conceptualization of the factors affecting
the use or access of bank credit by firms should at least take into consideration three
types of characteristics namely; entrepreneur characteristics, firm characteristics and
financial characteristics.
Studies on credit access seem to concentrate on the SMEs in the service sector which
leaves knowledge gap as far as the renewable energy sector is concerned. There is a
paucity of studies on the factors affecting credit access for firms in biogas sector in
Kenya and the researcher is not aware of any study that has been done on the study.
This study therefore wishes to bridge this knowledge gap by assessing the factors
affecting credit access for firms in the biogas sector in Kenya. Specifically, this study
attempts to answer the following research question: what are the factors affecting
credit access for firms in the biogas sector in Kenya?
From the literature review above it is informative that age , size, capital investment,
financial records, information access and risk preference of entrepreneurs are key
determinants of credit access by firms. The researcher therefore will be seeking to
establish the relationship between these factors among others and how they influence
access to credit in the renewable energy sector in Kenya and particularly as they can
be applied in the biogas subsector.
20
CHAPTER THREE
RESEARCH METHODOLOGY
3.1 Introduction
This chapter outlines in detail how the research was conducted. It reviewed the
population of interest, the sampling technique, measurement and details of the
variables used. An outline of the method used to ensure validity and reliability of the
instrument was also outlined.
3.2 Research Design
Research design refers to how data collection and analysis are structured in order to
meet the research objectives through empirical evidence (Chandran, 2004; Cooper
and Schindler, 2006).
The current study took a descriptive survey design. A descriptive survey design was
appropriate for this study since the study focuses on more than one Biogas Contractor
Enterprise (BCE) firms.
3.3 Population
A population refers to an entire group of individuals, events or objects having a
common observable characteristic (Mugenda & Mugenda, 2003). The population of
the study was all the 477 firms operating as biogas enterprises in the biogas sub-sector
in Kenya.
3.4 Sample
A sample is a subset of a population (Cooper and Schindler, 2006). According to
Mugenda and Mugenda (2003), a sample size of 10% or more is ideal for research
purposes. Therefore, this study took 10% of 477, which brought the sample size to 48
firms. The sample selection took a random approach targeting proprietors or senior
managers of the BCE firms partnering with KENDBIP in the biogas sector. There are
477 BCE firms operating in Kenya in partnership with KENDBIP.
21
3.5 Data and Data Collection
Both quantitative and qualitative data was collected, hence calling for primary and
secondary data sources. Both forms of data are required, where practicable, for
purposes of gaining a deeper insight and a better interpretation of the collected data.
Primary data was collected by a survey method using the questionnaire as the main
research instrument. The questionnaire consisted of both closed and open ended –
ended questions. The questionnaire was also divided into two parts i.e Firms
characteristics and Factors influencing credit access.
The open ended parts of the questionnaire allowed collection of qualitative data that
helped explain aspects of quantitative data.
The reliability and validity of the instrument was tested using an internal consistency
measure (Cronbach’s Alpha (α)).The standardized Cronbach’s alpha was defined as:
( )
−+
=−−
−
CNV
CN
.1
.α
Where N is the number of components (items or testlets), equals the average
variance and is the average of all covariances between the components (i.e. average
Pearson correlation coefficients between the components). The recommended value
of 0.7 was used as a cut–off of reliabilities
A pilot study was also undertaken on at least five (5) firms to validate the
questionnaire. This enabled the researcher to amend the questionnaire so as to
accurately capture the data.
3.6 Data Analysis
The questionnaires were coded and data entered into Statistical Package for social
sciences (SPSS17) for cleaning, analysis and interpretation in line with the aim of the
study, namely “Factors Influencing Access to Credit in the Renewable Energy Sector”
22
Descriptive and inferential statistics were employed in the analysis to find out on the
research objectives.
The strength of the relationships was tested using p values. P values of less than 0.05
signified that age, capital, size, access to information, risk preference and financial
records of the BCE firm are significant determinants of credit access.
A regression model was also used;
3.6.1 Conceptual Model
The conceptual model was deduced from the literature review which indicated that
age, capital, size, information access, risk and financial records are key factors
influencing credit access by firms.
The model is as follows;
CA = f (AB, K, S, AI, RP, FR, e)………….(Equition I)
Where, CA= Credit Access
AB= Age of Business
K=capital invested
S=size of business (number of employees)
AI= Access to information
RP= Risk Preference
FR=Financial Records
e- Error term
The variables were measured as explained in section 3.6.1.2 below. The basis of the
model is as explained in section 3.6.2 below.
3.6.1.1 Expected Hypothetical Relationships
The expected/ hypothetical relationships about the independent variables are as
follows;
Age of business was expected to have a positive relationship with level of credit
access Deakins, et al (2008).Ho-1
23
Capital invested was expected to have a positive relationship with level of credit
access (Ajagbe 2012, Kumar and Francisco 2005). Ho-2
Size of business was expected to have a positive relationship with level of credit
access, (Whincop 2001).Ho-3
Access to information was expected to have a positive relationship with level of credit
access, (World Bank 2008).Ho-4
Risk preference was expected to have a positive relationship with level of credit
access, (Bell 1990).Ho-5
Financial records were expected to have a positive relationship with level of credit
access (World Bank 2008).Ho-6
3.6.1.2 Operationalization of Variables
Credit Access was measured through five (5) statements. A 5 point likert scale was
used to measure the level of inclusion. A Likert score of 4 or 5 indicated a high level
of financial inclusion while a likert score of 1 or two indicated a low level of financial
inclusion.
Age of the Business was measured using 4 levels namely less than 1 year, 1-3yrs, 3-
5yrs, over 5yrs years. The expected relationship was positive. As age increases, credit
access increases.
Capital invested was measured using four quintiles namely kes 0 to kes 25,000
,kes26,000 to kes 75,000, Kes 76,000 to kes 150,000, and Kes 151,000 and above.
The expected relationship was positive. As capital invested increases, credit acess
increases.
Size of the business was measured using three categories namely: 0-5 employees, 6 to
10 employees, over 10 employees. Size of business is expected to have a positive
relationship with level of credit access.
Access to Information was measured by three categories: High Access, Moderate
Access and Low access. Access to information is expected to have a positive
relationship with level of credit access.
24
Risk preference was measured by three categories: Highly comfortable, Moderate
comfortable and not comfortable at all. Risk preference was expected to have a
positive relationship with level of credit access
Financial records were measured by a binary response: Yes or No. Keeping financial
records was expected to have a positive relationship with level of credit access.
3.6.2 Empirical Model
The basis of this model was the empirical literature which demonstrated that the
independent variables have a significant effect on credit access of SMEs. The Model
is as follow
Credit Access (CA) = α0 + α1AB+ α2K+ α3 S+ α4 AI+ α5RP+ α6FR + et……(Equition II)
The strength of the relationships was tested using p values. P values of less than 0.05
signified that age, capital, size, access to information, risk preference and financial
records of the BCE firm are significant determinants of credit access.
25
CHAPTER FOUR DATA ANALYSIS AND PRESENTATION
4.1 Introduction
The chapter discusses the data collected during the research was analyzed and
reported. Section 4.2 will discuss the summary statistics and will have subsections
4.2.1 which will discuss nature of business, 4.2.2 will discuss Legal registration, 4.2.3
discussed age of the firm, 4.2.4 discussed level of education, 4.2.5 discussed position
held in the firm, 4.2.6 discussed capital invested, 4.2.7 discussed number of
employees, 4.2.8 discussed financial records, 4.2.9 discussed risk preference, 4.2.10
discussed access to information, 4.2.11 discussed level of access. Section 4.3 will
explore the inferential statistics which will have subsections 4.3.1 which will cover
bivariate correlations and 4.3.2 which will discuss the regression analysis. Section 4.4
will present the discussion. Section 4.5 is a summary of the chapter.
4.2 Summary Statistics
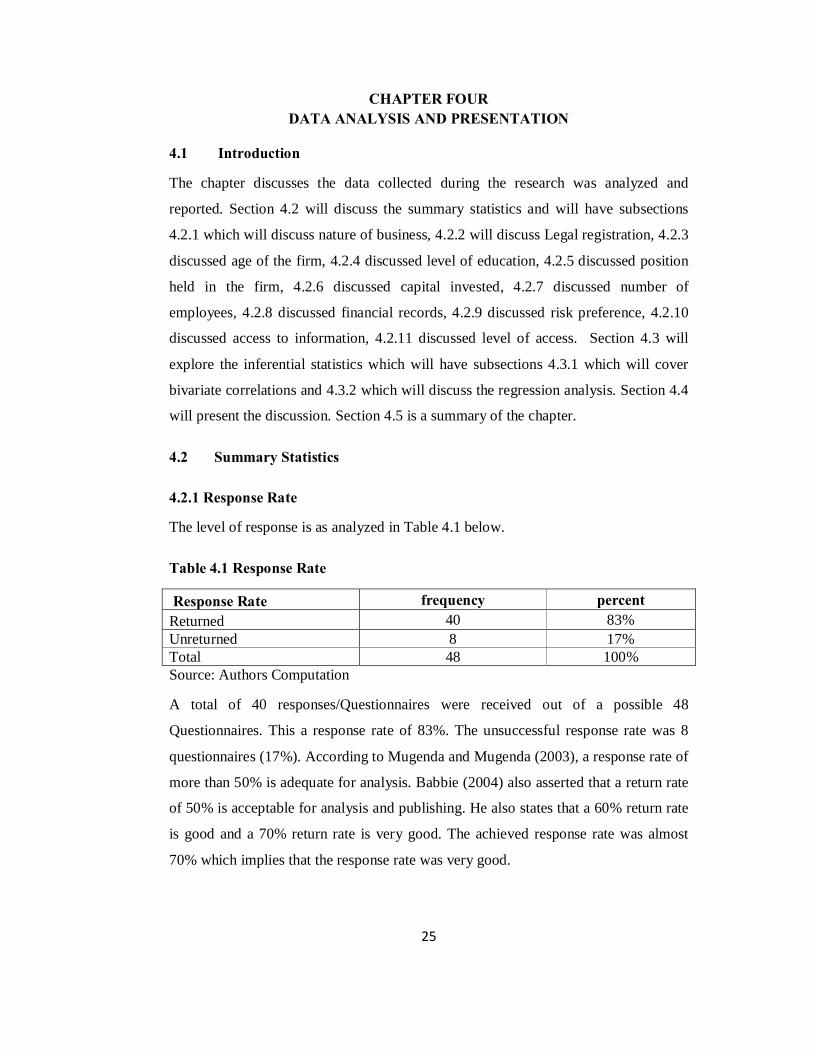
4.2.1 Response Rate
The level of response is as analyzed in Table 4.1 below.
Table 4.1 Response Rate
Response Rate frequency percent Returned 40 83% Unreturned 8 17% Total 48 100% Source: Authors Computation
A total of 40 responses/Questionnaires were received out of a possible 48
Questionnaires. This a response rate of 83%. The unsuccessful response rate was 8
questionnaires (17%). According to Mugenda and Mugenda (2003), a response rate of
more than 50% is adequate for analysis. Babbie (2004) also asserted that a return rate
of 50% is acceptable for analysis and publishing. He also states that a 60% return rate
is good and a 70% return rate is very good. The achieved response rate was almost
70% which implies that the response rate was very good.
26
4.2.2 Nature of Business
The respondents were asked to indicate the nature of the business firm. The findings
are presented in Table 4.2 below.
Table 4.2 Nature of the Business
Nature of business Frequency Percent Biogas construction only 9 22% Biogas construction and appliances 20 50% Biogas and Solar installation 11 28% Total 40 100%
Source: Authors Computation
Results in Table 4.2 shows that 50% of the respondents indicated the nature of
business firms was Biogas construction and appliances, 28% indicated Biogas and
Solar installation and 22% indicated Biogas construction only. This is an indication
that majority of firms in this sector are engaged in biogas construction and appliances
distribution because the two activities are complementary.
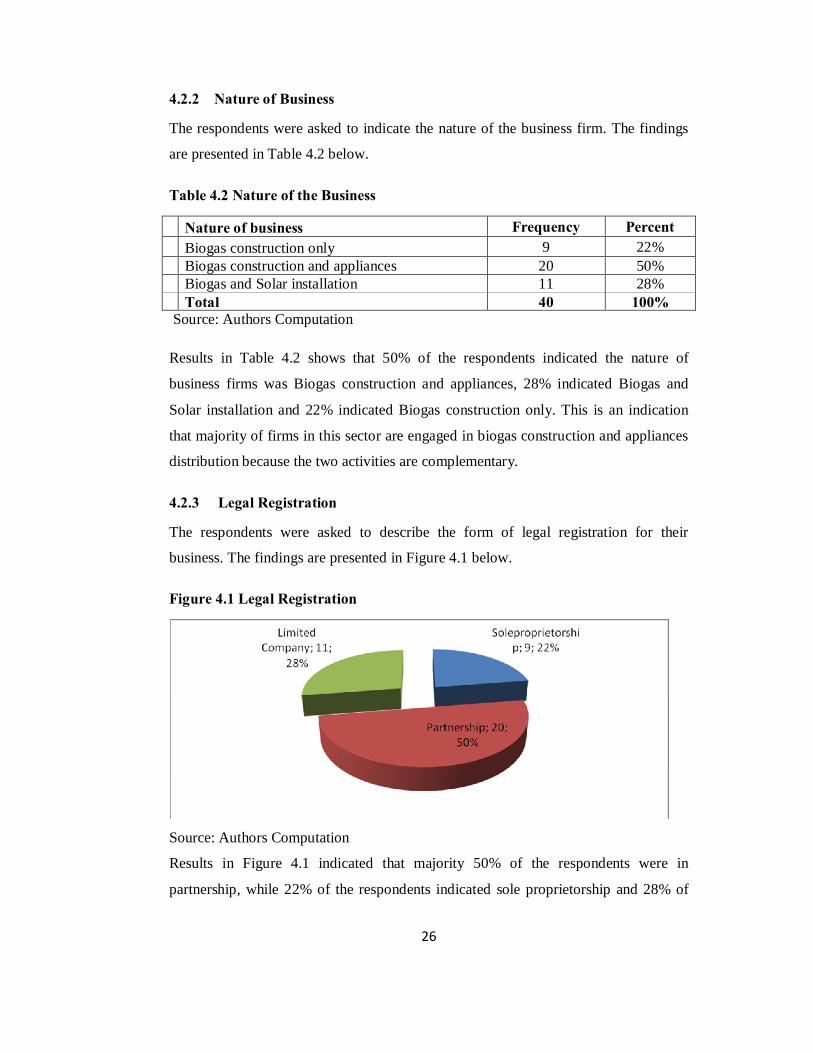
4.2.3 Legal Registration
The respondents were asked to describe the form of legal registration for their
business. The findings are presented in Figure 4.1 below.
Figure 4.1 Legal Registration
Source: Authors Computation
Results in Figure 4.1 indicated that majority 50% of the respondents were in
partnership, while 22% of the respondents indicated sole proprietorship and 28% of
27
the respondents indicated limited company. This is an indication that most of the BCE
firms are still under the direct control of the owners.
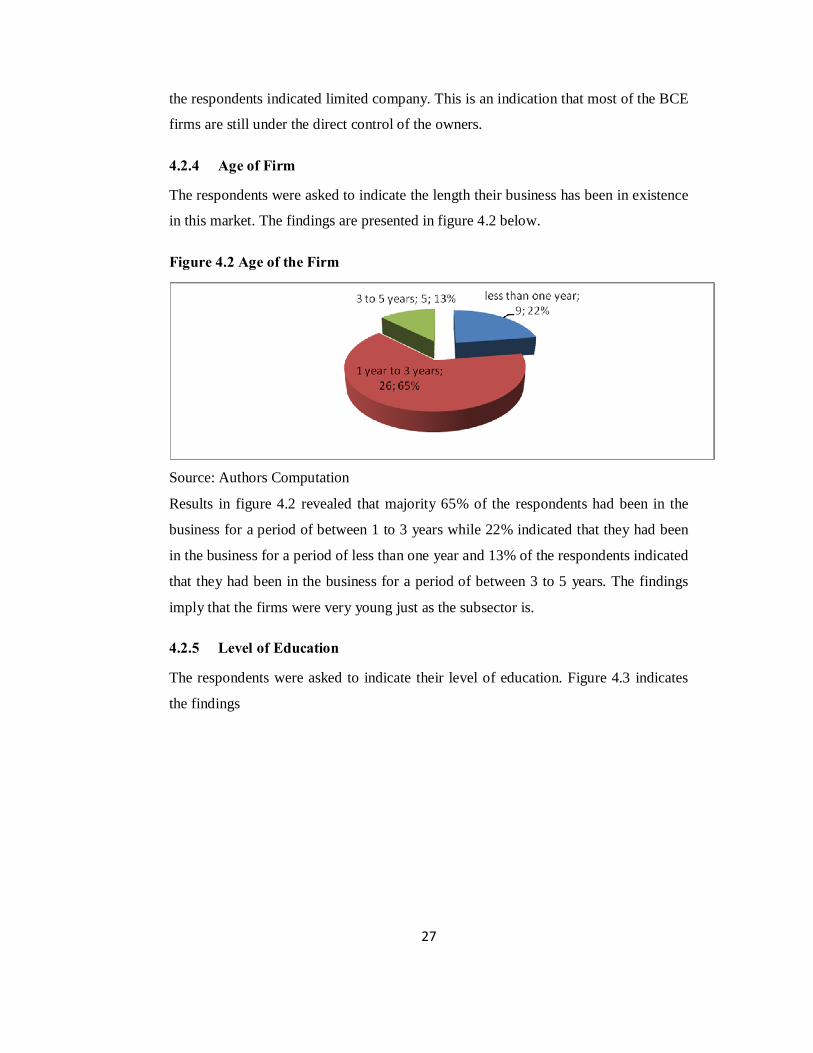
4.2.4 Age of Firm
The respondents were asked to indicate the length their business has been in existence
in this market. The findings are presented in figure 4.2 below.
Figure 4.2 Age of the Firm
Source: Authors Computation
Results in figure 4.2 revealed that majority 65% of the respondents had been in the
business for a period of between 1 to 3 years while 22% indicated that they had been
in the business for a period of less than one year and 13% of the respondents indicated
that they had been in the business for a period of between 3 to 5 years. The findings
imply that the firms were very young just as the subsector is.
4.2.5 Level of Education
The respondents were asked to indicate their level of education. Figure 4.3 indicates
the findings

28
Figure 4. 1 Level of Education
Source: Authors Computation
Results in figure 4.3 reveal that majority 68% had reached college level, 22% had
reached primary level and 10% had reached university level. These results imply that
the respondents had high academic qualifications and therfore understood the issues
in question very well.
4.2.6 Position Held
The respondents were asked to indicate the Managerial position held in the business
firm. Findings are presented in Table 4.3 below.
Table 4.3 Position Held
Position Frequency Percent Middle level 9 22 % Senior Level 31 78% Total 40 100% Source: Authors Computation
Table 4.3 indicates that majority (78%) of the respondents are in senior management
level and 22 % were in middle management level. This implies that most of the
respondents are the founders or proprietors of the firms.
4.2.7 Capital Invested
The respondents were asked to indicate the amount of capital invested in their
business. The findings are presented in Table 4.4 below.

29
Table 4.4 Capital Invested
Frequency Percent Kes 0____ kes 25,000 24 60% Kes26,000 –kes 75,000 13 33% Kes 76,000_kes 150,000 3 7% Total 40 100% Source: Authors Computation
Results in Table 4.4 revealed that majority 60% of the respondents indicated they had
invested less than 25,000 shillings, while 33% of the respondents indicated kes 26000
to 75000 and finally 7% of the respondents indicated Kes 76,000 to 150,000. These
results imply that the respondents had low capital invested and therefore this may
have contributed to the low level of credit access.
4.2.8 Number of Employees
The respondents were asked to indicate the number of employees employed in their
businesses. Figure 4.4 indicates the findings
Figure 4.4: Number of Employees
Source: Authors Computation
As illustrated in Figure 4.4, majority 43% of the respondents indicated they had 6 to
10 employees, while 42% of the respondents indicated they had less than 5 employees
and 15% of the respondents indicated they had over 10 employees. The findings
imply that majority of the respondents had small business in size and these may have
contributed to the low credit access levels.

30
4.2.9 Financial Records
The respondents were asked to indicate whether they keep financial records for their
businesses. The findings are presented in Figure 4.5 below.
Figure 4.5 Financial Records
Source: Authors Computation
Results in Figure 4.5 revealed that majority 60% of the respondents did not have
financial records while 40% of the respondents had financial records. The findings
imply that majority of the respondents had no financial records and these may have
contributed to the low credit access levels.
4.2.10 Risk Preference
The respondents were asked to indicate the extent to which they are comfortable with
the risk of taking a bank loan. The findings are presented in Figure 4.6 below.
Figure 4.6 Risk Preference
Source: Authors Computation
31
Results in figure 4.6 indicated that 45% of the respondents were not comfortable at
all, while 40% of the respondents were moderately comfortable and 15% of the
respondents were highly comfortable. The findings imply that the firms find it
difficult to access loans because there are so many requirements needed for any firm
to provide as collateral. The other reason the respondents indicated as reasons why
they are not comfortable in accessing loans is the fear of the unknown if they business
fails how would they pay for the loan.
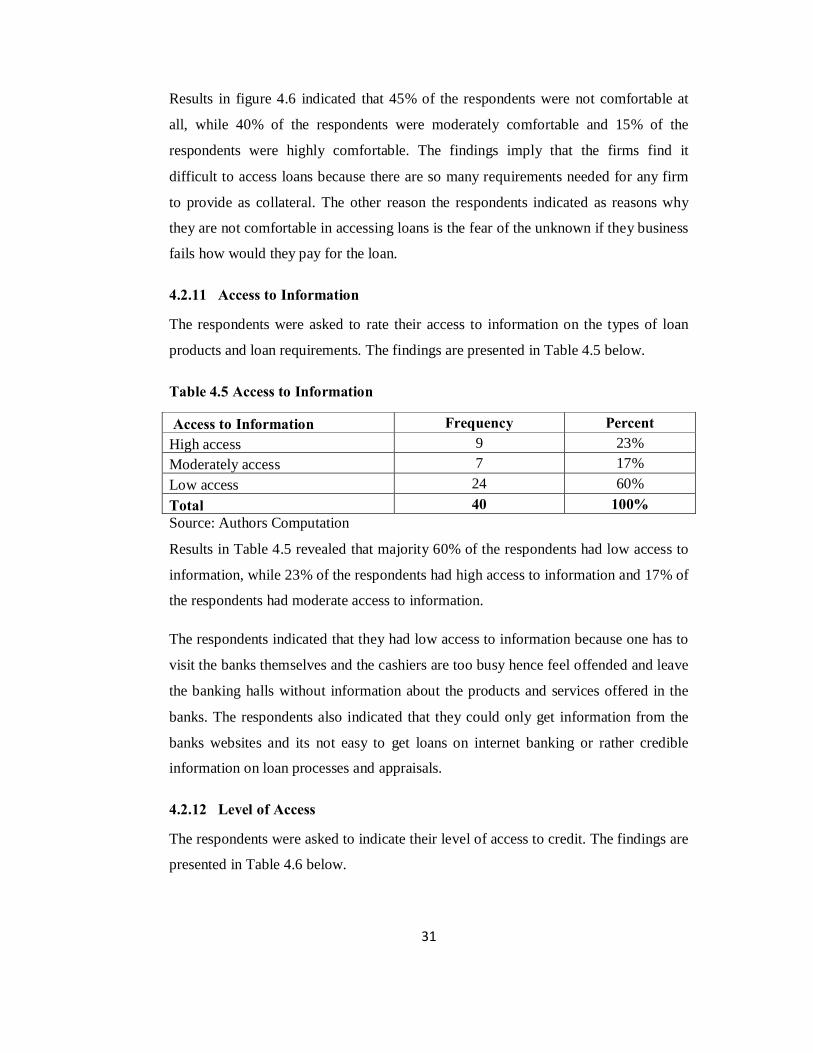
4.2.11 Access to Information
The respondents were asked to rate their access to information on the types of loan
products and loan requirements. The findings are presented in Table 4.5 below.
Table 4.5 Access to Information
Access to Information Frequency Percent High access 9 23% Moderately access 7 17% Low access 24 60% Total 40 100% Source: Authors Computation
Results in Table 4.5 revealed that majority 60% of the respondents had low access to
information, while 23% of the respondents had high access to information and 17% of
the respondents had moderate access to information.
The respondents indicated that they had low access to information because one has to
visit the banks themselves and the cashiers are too busy hence feel offended and leave
the banking halls without information about the products and services offered in the
banks. The respondents also indicated that they could only get information from the
banks websites and its not easy to get loans on internet banking or rather credible
information on loan processes and appraisals.
4.2.12 Level of Access
The respondents were asked to indicate their level of access to credit. The findings are
presented in Table 4.6 below.
32
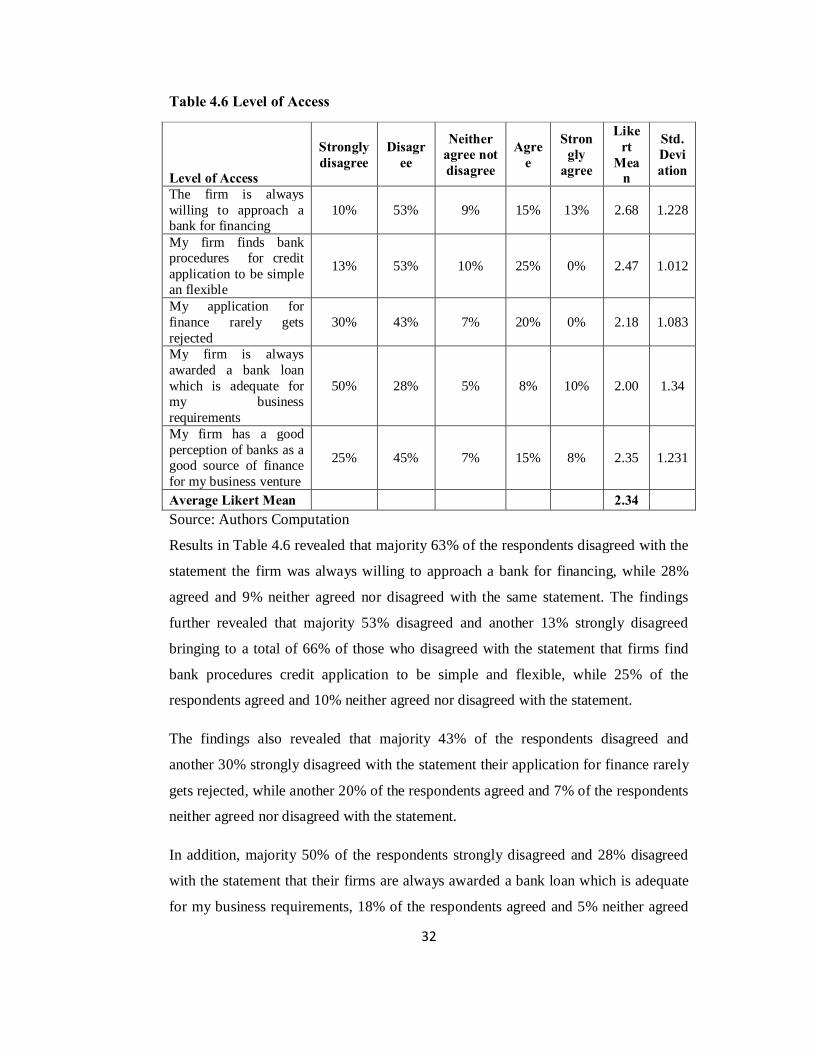
Table 4.6 Level of Access
Level of Access
Strongly disagree
Disagree
Neither agree not disagree
Agree
Strongly
agree
Likert
Mean
Std. Deviation
The firm is always willing to approach a bank for financing
10% 53% 9% 15% 13% 2.68 1.228
My firm finds bank procedures for credit application to be simple an flexible
13% 53% 10% 25% 0% 2.47 1.012
My application for finance rarely gets rejected
30% 43% 7% 20% 0% 2.18 1.083
My firm is always awarded a bank loan which is adequate for my business requirements
50% 28% 5% 8% 10% 2.00 1.34
My firm has a good perception of banks as a good source of finance for my business venture
25% 45% 7% 15% 8% 2.35 1.231
Average Likert Mean 2.34 Source: Authors Computation
Results in Table 4.6 revealed that majority 63% of the respondents disagreed with the
statement the firm was always willing to approach a bank for financing, while 28%
agreed and 9% neither agreed nor disagreed with the same statement. The findings
further revealed that majority 53% disagreed and another 13% strongly disagreed
bringing to a total of 66% of those who disagreed with the statement that firms find
bank procedures credit application to be simple and flexible, while 25% of the
respondents agreed and 10% neither agreed nor disagreed with the statement.
The findings also revealed that majority 43% of the respondents disagreed and
another 30% strongly disagreed with the statement their application for finance rarely
gets rejected, while another 20% of the respondents agreed and 7% of the respondents
neither agreed nor disagreed with the statement.
In addition, majority 50% of the respondents strongly disagreed and 28% disagreed
with the statement that their firms are always awarded a bank loan which is adequate
for my business requirements, 18% of the respondents agreed and 5% neither agreed

33
nor disagreed with the statement. Finally, 70% of the respondents disagreed with the
statement that their firms have a good perception of banks as a source of finance for
my business venture, while 15% of the respondents agreed and another 8% strongly
agreed bringing to a total of 23% of those who agreed with the statement and 7% of
the respondents neither agreed or disagreed with the statement. The mean score for
this section is 2.34 indicating that majority of the respondents disagreed with the
statements on level of access to loans.
The findings agree with those in Deakins et al (2008) who cited Fraser (2005) who
asserted that willingness to approach, feeling discouraged from applying because they
expect to be rejected was a demand side factor for credit access.
4.3 Inferential Statistics and The Estimated Model
This section has analysis of the questionnaire responses using inferential statistics like
correlation and the estimated regression model.
4.3.1 Bivariate Correlations
The study sought to establish the relationship between level of access and the
independent variables (financial records, risk preference, age bracket, age of business,
size of business, capital invested and access to information). First a correlation
between Factors Influencing Access to Credit was done. Results are presented in
Table 4.7 below.
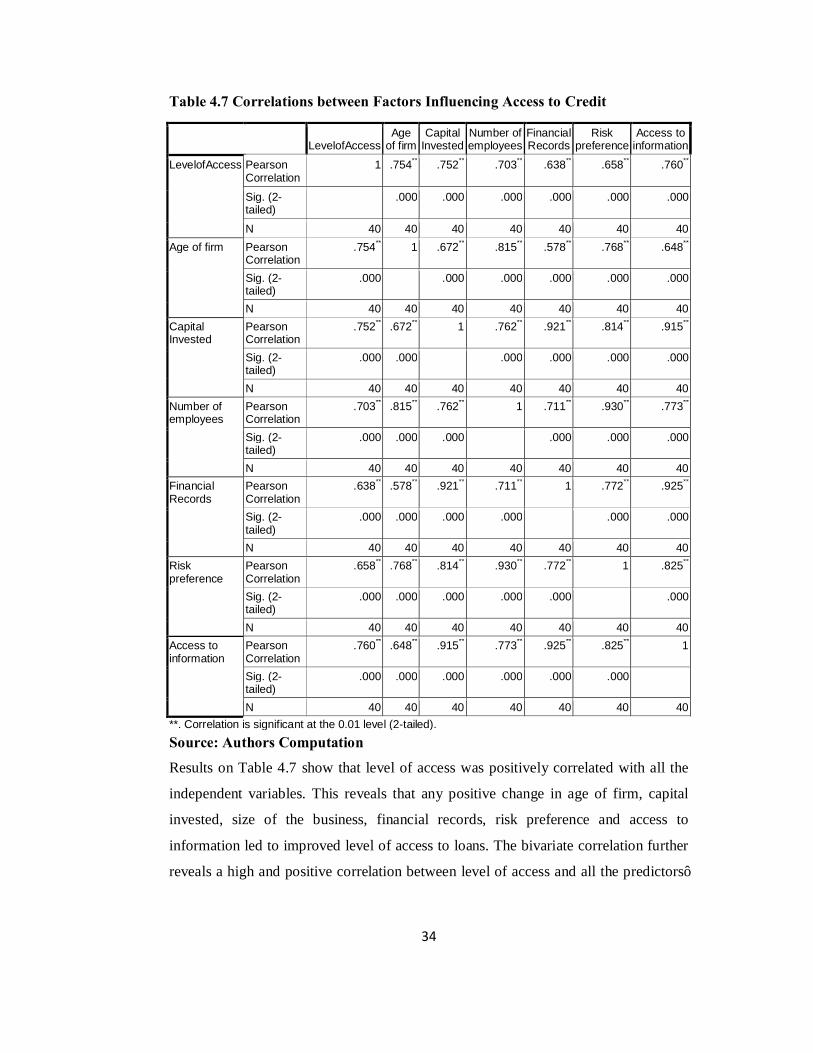
34
Table 4.7 Correlations between Factors Influencing Access to Credit
LevelofAccess
Age of firm
Capital Invested
Number of employees
Financial Records
Risk preference
Access to information
LevelofAccess Pearson Correlation
1 .754** .752** .703** .638** .658** .760**
Sig. (2-tailed) .000 .000 .000 .000 .000 .000
N 40 40 40 40 40 40 40 Age of firm Pearson
Correlation .754** 1 .672** .815** .578** .768** .648**
Sig. (2-tailed)
.000 .000 .000 .000 .000 .000
N 40 40 40 40 40 40 40 Capital Invested
Pearson Correlation
.752** .672** 1 .762** .921** .814** .915**
Sig. (2-tailed)
.000 .000 .000 .000 .000 .000
N 40 40 40 40 40 40 40 Number of employees
Pearson Correlation
.703** .815** .762** 1 .711** .930** .773**
Sig. (2-tailed)
.000 .000 .000 .000 .000 .000
N 40 40 40 40 40 40 40 Financial Records
Pearson Correlation
.638** .578** .921** .711** 1 .772** .925**
Sig. (2-tailed)
.000 .000 .000 .000 .000 .000
N 40 40 40 40 40 40 40 Risk preference
Pearson Correlation
.658** .768** .814** .930** .772** 1 .825**
Sig. (2-tailed)
.000 .000 .000 .000 .000 .000
N 40 40 40 40 40 40 40 Access to information
Pearson Correlation
.760** .648** .915** .773** .925** .825** 1
Sig. (2-tailed)
.000 .000 .000 .000 .000 .000 N 40 40 40 40 40 40 40
**. Correlation is significant at the 0.01 level (2-tailed).
Source: Authors Computation
Results on Table 4.7 show that level of access was positively correlated with all the
independent variables. This reveals that any positive change in age of firm, capital
invested, size of the business, financial records, risk preference and access to
information led to improved level of access to loans. The bivariate correlation further
reveals a high and positive correlation between level of access and all the predictors’
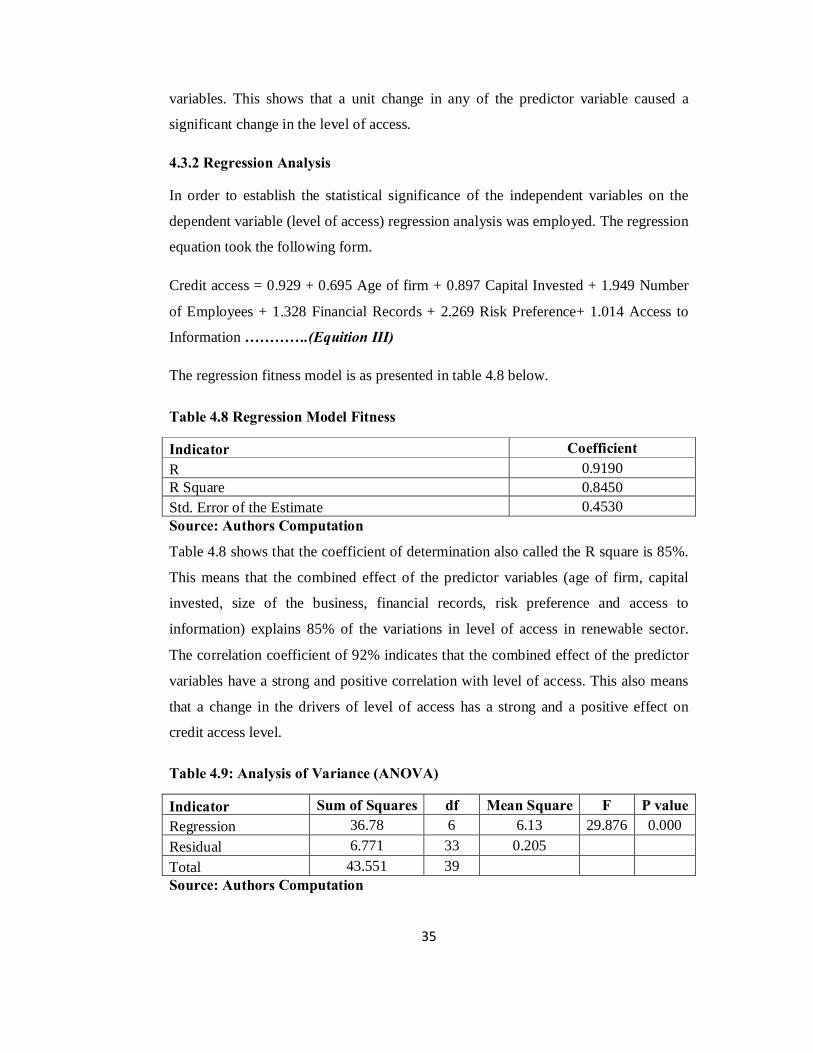
35
variables. This shows that a unit change in any of the predictor variable caused a
significant change in the level of access.
4.3.2 Regression Analysis
In order to establish the statistical significance of the independent variables on the
dependent variable (level of access) regression analysis was employed. The regression
equation took the following form.
Credit access = 0.929 + 0.695 Age of firm + 0.897 Capital Invested + 1.949 Number
of Employees + 1.328 Financial Records + 2.269 Risk Preference+ 1.014 Access to
Information ………….(Equition III)
The regression fitness model is as presented in table 4.8 below.
Table 4.8 Regression Model Fitness
Indicator Coefficient R 0.9190 R Square 0.8450 Std. Error of the Estimate 0.4530 Source: Authors Computation
Table 4.8 shows that the coefficient of determination also called the R square is 85%.
This means that the combined effect of the predictor variables (age of firm, capital
invested, size of the business, financial records, risk preference and access to
information) explains 85% of the variations in level of access in renewable sector.
The correlation coefficient of 92% indicates that the combined effect of the predictor
variables have a strong and positive correlation with level of access. This also means
that a change in the drivers of level of access has a strong and a positive effect on
credit access level.
Table 4.9: Analysis of Variance (ANOVA)
Indicator Sum of Squares df Mean Square F P value Regression 36.78 6 6.13 29.876 0.000 Residual 6.771 33 0.205 Total 43.551 39 Source: Authors Computation
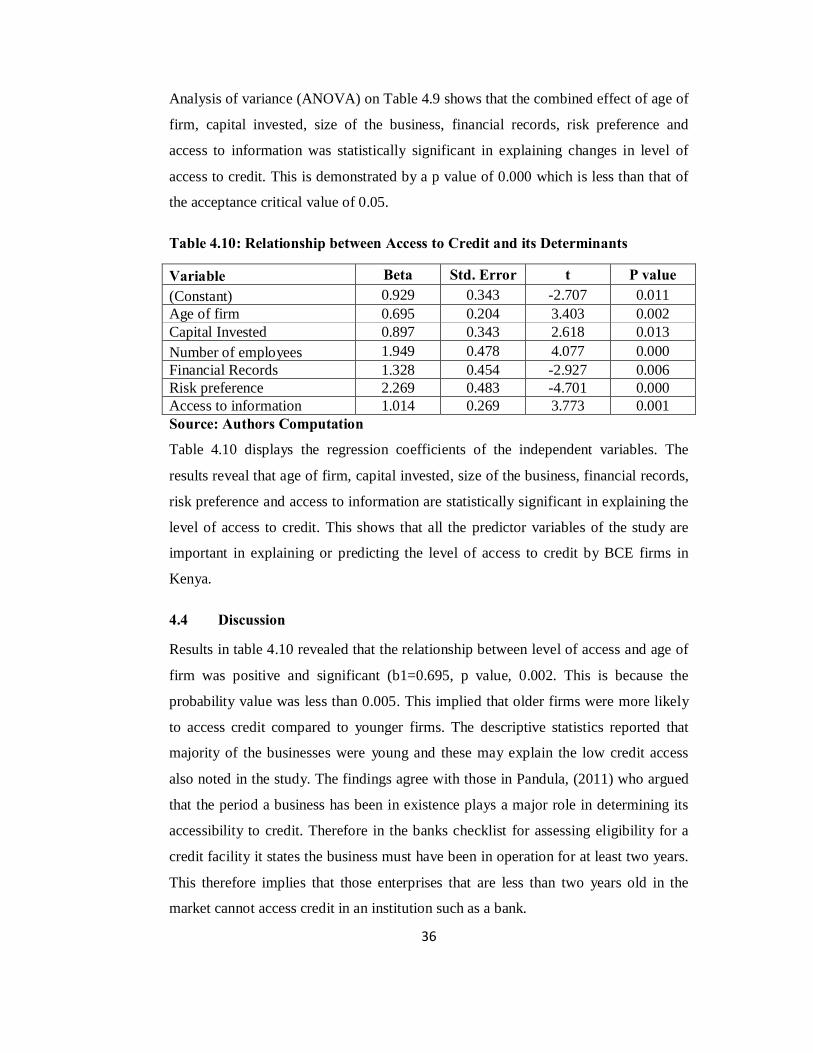
36
Analysis of variance (ANOVA) on Table 4.9 shows that the combined effect of age of
firm, capital invested, size of the business, financial records, risk preference and
access to information was statistically significant in explaining changes in level of
access to credit. This is demonstrated by a p value of 0.000 which is less than that of
the acceptance critical value of 0.05.
Table 4.10: Relationship between Access to Credit and its Determinants
Variable Beta Std. Error t P value (Constant) 0.929 0.343 -2.707 0.011 Age of firm 0.695 0.204 3.403 0.002 Capital Invested 0.897 0.343 2.618 0.013 Number of employees 1.949 0.478 4.077 0.000 Financial Records 1.328 0.454 -2.927 0.006 Risk preference 2.269 0.483 -4.701 0.000 Access to information 1.014 0.269 3.773 0.001 Source: Authors Computation
Table 4.10 displays the regression coefficients of the independent variables. The
results reveal that age of firm, capital invested, size of the business, financial records,
risk preference and access to information are statistically significant in explaining the
level of access to credit. This shows that all the predictor variables of the study are
important in explaining or predicting the level of access to credit by BCE firms in
Kenya.
4.4 Discussion
Results in table 4.10 revealed that the relationship between level of access and age of
firm was positive and significant (b1=0.695, p value, 0.002. This is because the
probability value was less than 0.005. This implied that older firms were more likely
to access credit compared to younger firms. The descriptive statistics reported that
majority of the businesses were young and these may explain the low credit access
also noted in the study. The findings agree with those in Pandula, (2011) who argued
that the period a business has been in existence plays a major role in determining its
accessibility to credit. Therefore in the banks checklist for assessing eligibility for a
credit facility it states the business must have been in operation for at least two years.
This therefore implies that those enterprises that are less than two years old in the
market cannot access credit in an institution such as a bank.

37
The relationship between level of access and capital invested was positive and
significant (b1=0.897, p value, 0.013). The relationship between level of access and
access to information was positive and significant (b1=1.014, p value, 0.001). The
findings agree with those in Deakins et al (2008) who indicated that supply side
factors that affected access to finance included lack of business performance and
credit worthiness information about the borrower, policy and practices of banks
affected access to finance.
The relationship between level of access and size of business was positive and
significant (b1=1.949, p value, 0.000). This implied that larger businesses in size were
more likely to access credit compared to small business in size. The small size of
business reported in descriptive statistics may explain the low credit access noted in
the study. The findings agree with those in Kumar and Francisco (2005) who asserted
that size strongly affects access to credit, compared to performance as well as other
variables, suggesting quantitative limitations to credit access hence looking at short-
versus long-term loans, the impact of size on access to credit was greater for longer-
terms loans.
The relationship between level of access and risk preference was positive and
significant (b1=2.269, p value, 0.000). This implied that less risk averse firms were
more likely to access credit compared to more risk averse firms. The descriptive
statistics reported that majority of the respondents were not comfortable and
moderately comfortable and these may explain the low credit access also noted in the
study. The findings agree with those in Liu, 2008; Dercon, 2006; Boucher et al., 2008,
and; Fletschner et al., (2009) who argued that producers who are more risk averse are
less likely to adopt new technologies, to undertake projects that are expected to offer
higher profits but expose them to more risk, or to apply for loans that may cause them
to lose the collateral they own.
The relationship between level of access and financial records was positive and
significant (b1=1.328, p value, 0.006). This implied that businesses with financial
records were more likely to access credit compared to businesses without financial
records. The descriptive statistics reported that majority of the respondents had no
financial records and this may explain the low credit access also noted in the study.
38
4.5 Summary
The chapter presented the descriptive statistics first. The inferential statistics were
also presented. Specifically regression results demonstrated that the determinants of
credit include age of the business, size of the business, financial records, risk
preference and capital invested. Findings in this chapter formed a crucial input in the
next chapter (chapter 5).
Statistics show that the independent variables accounted for 85% influence of access
to credit by BCE firms meaning that other related factors account for 15%. Again
tests showed that all the independent variables have a statistically significant positive
correlation with the level of access to credit.
Majority of respondents indicated that they are shy to approach the banks for credit
for fear of being rejected or because the loan application process was thought to be
discouraging to them. Majority said it was lengthy and complicated. Many of the
respondents also were of the view that collateral demanded by the banks discouraged
them from borrowing and increased their financial risk posed by high interest rates
which is subject to compounding in the event of default, volatility of BCE business
and Financial Institution’s unfriendly loan recovery strategies.
Majority of senior managers of BCE firms are college level graduates and they have
been in business for less than five year hence they lack the managerial experiences
required by most banks and MFI’s to qualify for credit financing.
Lack of access to credit Information by BCE firms was also cited as a significant
impediment in securing cost effective credit financing and a knowledge base is
necessary to overcome such problems.
Results pointed that when the firm is small, restrictions on credit are greater. This is
because small firms usually do not have audited financial reports, are owned and
operated by the entrepreneur him/her self and there is no such legal requirement to
regularly report financial information and in addition smaller firms have less assets to
offer as collateral compared to larger firms.
39
CHAPTER FIVE
SUMMARY AND CONCLUSION
5.1 Introduction
This purpose of this chapter is to discuss and summarize the findings of the study and
finally give conclusions and recommendations for improvement or practice. Section
5.2 discusses the summary of findings, 5.3 discusses the conclusion, 5.4 covers the
limitations of the study and 5.5 discusses the recommendations for policy and further
research.
5.2 Summary of the Study
The general objective of this study was to establish the factors influencing credit
access for firms in the biogas sub sector in Kenya. A sample size of a total population
of forty eight (48) respondents was drawn from all the renewable sector firms and
forty (40) questionnaires were satisfactorily completed and returned. For purposes of
collecting primary data, the researcher developed and administered a questionnaire
and the results obtained were analyzed using Microsoft Excel and Statistical Package
for Social Sciences (SPSS).
The study findings showed that 50% of the respondents indicated the nature of
business firms was Biogas construction and appliances. A majority 50% of the
respondents were in partnership, results revealed that majority 65% of the respondents
had been in the business for a period of between 1 to 3 years while 22% indicated that
they had been in the business for a period of less than one year and majority 68% of
the respondents had reached college level. These results imply that the respondents
had high academic qualifications and therfore understood the issues in question very
well. A majority (78%) of the respondents was in senior management level and 60%
of the respondents indicated they had invested less than 25,000 shillings, while 48%
of the respondents indicated they had 6 to 10 employees.
The findings also revealed that majority 60% of the respondents did not have financial
records, 45% of the respondents were not comfortable with borrowing risk at all, and
60% of the respondents indicated they had low access to information. More so, results
40
revealed that majority 63% of the respondents disagreed with the statement the firm
was always willing to approach a bank for financing, 66% disagreed with the
statement that firms find bank procedures credit application to be simple and flexible,
while 73% disagreed with the statement their application for finance rarely gets
rejected, and 78% disagreed with the statement that their firms are always awarded a
bank loan which is adequate for my business requirements, Finally, 70% of the
respondents disagreed with the statement that their firms have a good perception of
banks as a source of finance for business venture. The mean score for this section is
2.34 indicating that majority of the respondents disagreed with the statements on level
of access to loans.
Results indicate that demographic factors such as age of firm, capital invested, size of
the business, financial records, risk preference and access to information are a
significant determinant of level of access to credit. Regression analysis was conducted
to empirically determine whether demographic factors were a significant determinant
of level of access to credit and the results support this finding. Correlation results
showed that level of access was positively correlated with all the independent
variables. This reveals that any positive change in age of firm, capital invested, size of
the business, financial records, risk preference and access to information led to
improved level of access to loans. The bivariate correlation reveals a high and positive
correlation between level of access and all the predictors’ variables.
Regression results indicated that the coefficient of determination also called the R
square is 85%. This means that the combined effect of the predictor variables (age of
firm, capital invested, size of the business, financial records, risk preference and
access to information) explains 85% of the variations in level of access in renewable
sector. Analysis of variance (ANOVA) results showed that the combined effect of
age of firm, capital invested, size of the business, financial records, risk preference
and access to information was statistically significant in explaining changes in level of
access to credit. This is demonstrated by a p value of 0.000 which is less that the
acceptance critical value of 0.05. Regression coefficients results reveal that age of
firm, capital invested, size of the business, financial records, risk preference and
access to information are positive and statistically significant in explaining the level
41
of access to credit. This shows that all the predictor variables of the study are
important in explaining or predicting the level of access to credit in Kenya.
5.3 Conclusion
As demonstrated by the findings of the study, BCEs face a "liability of smallness."
Because of their size and resource limitations, they are unable to successfully develop
new technologies or to make vital changes in existing ones. Still, there is evidence
that BCEs have the potential to initiate minor technological innovations to suit their
circumstances. However, for BCEs to fully develop and use this potential, they need
specific policy measures to ensure that technology services and infrastructure are
provided.
Also, following the study findings it is possible to conclude that BCEs have low
access to credit from the banks. It was possible to conclude that financing biogas
sector in Kenya has been inadequate. Micro finance institutions do not have a biogas
specific credit product though they offer general business loans which could be used
by biogas construction enterprises to access business capital but their terms may not
be conducive to the biogas sector. It was also possible to conclude that age of firm,
capital invested, and size of the business, financial records, risk preference and access
to information influence the level of access to credit by firms in the renewable sector
(BCEs).
Specifically the study results demonstrated that the determinants of credit include age
of the business, size of the business, financial records, risk preference and capital
invested and that these factors account for 85% influence of access to credit by BCE
firms meaning that other related factors account for 15%. Again tests showed that all
the independent variables have a statistically significant positive correlation with the
level of access to credit.
It is worth stating that BCEs have the potentiality of transforming the economy of the
nation. As such, every effort should be made to boost their growth especially through
access to credit finance.
42
5.4 Limitations of the Study
The sample size of 10% or 48 BCE firms though representative was a limitation to the
accuracy and representativeness of the study findings. A census would have been the
best option and would have been the most representative. However, a census would
not have been technically and economically efficient based on time and funds
available.
Noise was also identified in some of the questionnaires which could reduce the
accuracy of the findings, however such questionnaires were considered unsatisfactory
and hence not analyzed.
Some respondents said they lacked time to answer to the questionnaires due to the
hectic nature of their jobs. To overcome this limitation, care was taken to replace the
non-cooperative respondents with cooperative ones from the same target group.
Another limitation of this study was the level of cooperation from respondents. Some
respondents were not cooperative as they were not sure how we intended to use the
data. To overcome this limitation, the researcher presented the respondents with
introduction letters from the university to allay their fears. The researcher also
ensured that the respondents were assured of confidentiality.
In addition, it may not have been possible to ensure that all the respondents were
honest about their responses, however care was taken to explain to the respondents
that honesty was important as the report would be valuable to many parties.
Finally, some of the questions were sensitive e.g level of capital invested as well as
work force levels. Consequently, a truthful response is suspect. To overcome this
limitation, the researcher assured the respondents of the confidentiality and that none
of the information will be disclosed without prior consent from the BCE firms.
43
5.5 Recommendations
5.5.1 Recommendations for Policy
One major question we should pose is: what solution can be offered to the plight of
Biogas contractor enterprises in Kenya? For one, policies should aim to encourage
and promote the development of local technologies such as the biogas technology.
Emphasis should be on the promotion of the local tool industry to reduce reliance on
imports of biogas appliances.
To begin with, research and development institutions that are publicly funded should
be encouraged to target the technology needs of BCEs.
Secondly, the problem of access to information may be attributed to the inadequacy of
BCE support institutions. This points to the need for a supportive policy to encourage
the establishment of documentation centers and information networks to provide
information to BCEs at an affordable price.
Thirdly, the government should come up with training centers for training managerial
and technical courses for the small enterprises such as BCEs. Equally, there should be
business information centers.
Fourthly, government should come up with proper regulatory policies that are BCE or
small enterprises friendly since many of what we have in Kenya, frustrates every
effort of a junior entrepreneur. The policies we have seem to care for the well-
established businesses.
Since majority of small enterprises lack finance, government should establish friendly
small loaning system. This would include low interests rates to ensure the continuity
of these businesses. Micro financing institutions should customize their products and
services they offer to BCEs so as to have all clients enclosed in their loan portfolio.
Lastly, formation of business groups for BCE businesses should be encouraged to
form a bid to guarantee each other when there is need to secure business loans.

44
5.5.2 Recommendations for Further Research
The researcher dealt with only the above six factors that influence accessibility to
credit facility by BCE firms in the biogas sub sector of the renewable energy in
Kenya.
There is need to research on other related factors and even use other methods of study
to see whether the similar result can be realized.
This research concentrated on the Biogas Contractor Enterprises (BCE) firms only
and there is need to have a wider research on factors influencing credit access
targeting all actors in the renewable energy sector in Kenya to compare the findings.
The researcher recommends further studies on the access of informal credit by BCEs.
Such study should focus on the factors that influence the formation of informal
business clubs such as merry go rounds and un registered SACCOs.
Future studies should also focus on the financial management practices of BCE firms
or generally firms in the renewable energy sector. This is because proper working
capital management may influence the growth, profitability and the consequent ability
to access finance from all sources.
45
REFERENCES
Ajagbe FA. Analysis of Access to and Demand for Credit by Small Scale
Entrepreneurs. Evidence from Oyo State, Nigeria. Journal of Emerging Trends
in Economics and Management Sciences (JETEMS). 2012;3(3):180-183.
Akudugu MA. Estimation of the Determinants of Credit Demand by Farmers and
Supply by Rural Banks in Ghana‟s Upper East Region. Asian Journal of
Agriculture and Rural Development. 2012;2(2):189-200.
Beck, T., Demirguc-Kunt, A. and Martinez Peria, M.S. 2007. Reaching Out: Access
to and Use of Banking Services Across Countries, Journal of Financial
Economics, forthcoming.
Beegle, Dehejia & Gatti; 2003, “Child Labor, Income Shocks and Access to Credit”,
World Bank mimeo
Bell, C. 1990. Interactions between institutional and informal credit agencies in rural India. World Bank Economic Review, 4 (3), 297–327.
Berger, & Udell. (2004). A More Complete Conceptual Framework for SME Finance.
World Bank.
Binks, M. R. & Ennew C. T. (1996). Growing Firm and the Credit Constraint, Journal of Small Business Economics, 8 (1), 17 – 25.
Burgess, R. and Pande R. 2005. “Do Rural Banks Matter? Evidence from the Indian
Social Banking Experiment”, American Economic Review (95) 3: 780–95.
Chaia, Alberto, Aparna Dalal, Tony Goland, Maria Jose Gonzalez, Jonathan
Morduch, and Robert Schiff, 2011, Half the world is unbanked, Working
paper, New York University
Chakrabarty K.C. 2011. Financial Inclusion. Seminar on “Financial Inclusion: Partnership between Banks, MFIs and Communities”, New Delhi, 14 October 2011
Chandran, E. 2004. Research Methods: A Quantitative Approach with Illustrations
from Christian Ministries. Nairobi: Daystar University.
Climate and Development Knowledge Network (2013). “www.cdkn.org”
46
Cooper, D.R and Schindler, P.S .2006. “Business Research Methods”, 9th, edition. McGraw-Hill Publishing, Co. Ltd. New Delhi-India
Cronbach, L. J. 1951. Coefficient alpha and the internal structure of tests.
Psychometrika 16:297–334.
Deakins, D., North, D., Balddock, R. and Whittam , G. (2008) “ SMEs’ Access to
Finance".: Is there still a debt finance gap. World Bank Economic Review, 4
(3): 297–327.
Dehejia & Gatti. 2002, “Child Labor: The Role of Income Variability and Access to
Credit in a Cross Section of Countries”, World Bank mimeo
Elhiraika, A.B. and S.A. Ahmed. 1998. “Agricultural credit under economic liberalization and Islamization in Sudan”. AERC Research Paper No. 79.
European Commission. (2005). SME Access to Fnance. European Commission.
FAO/CMC (1996). SD Environment: A system Approach to Biogas Technology. Training Manual for extension. [http://www.fao.org].
Fraser, S. (2005) Finance for Small and Medium Sized Enterprises: A Report on the
2004 UK Survey of SME Finances, Warwick Business School: Coventry
Harris, P. (2005). Beginners Guide to Biogas. The University of Adelaide, Adelaide [http://www.ees.adelaide.edu.au] .
Henri-Ukoha A, Orebiyi JS, Obasi PC, Oguoma NN, Ohajianya DO, Ibekwe UC,
Ukoha II. Determinants of loan acquisition from the financial institutions by
small-scale farmers in Ohafia Agricultural zone of Abia State, South East
Nigeria. Journal of Development and Agricultural Economics. 2011;3(2):69-
74.
Honohan, Patrick, 2008, Cross-Country variation in household access to financial
services, Journal of Banking and Finance 32, 2493-2500.
Jacoby, H; 1994, “Borrowing Constraints and Progress Through School: Evidence
From Peru”, Review of Economics and Statistics, 76, 151-60
Kempson. E., Atkinson. A. and Pilley. O, 2004, Policy Level Response to Financial
Exclusion in Developed Economies: Lessons for Developing Economies, The
47
Personal Finance Research Centre prepared for the Department of
International Development
Klapper, L. (2004). The Role of “Reverse Factoring” in Supplier Financing of Small
and Medium Sized Enterprises. Washington Dc: World Bank.
Kumar, A., & Francisco, M.2005. “Enterprise size, financing patterns and credit
constraints in Brazil: analysis of data from the Investment Climate Assessment
Survey.” World Bank working paper No.49.
Lawal JO, Omonona BT, Ajani OI, Oni AO. Effects of Social Capital on credit
Access among Cocoa Farming Households in Osun State, Nigeria. Agric. J.
2009;4:184–191.
Levine, R.2004. “Finance and growth: Theory and evidence”. NBER Working paper
10766
Mugenda, O. M. and Mugenda, A. G. 2003. Research Methods: Quantitative and
Qualitative Approaches, Acts Press, Nairobi-Kenya
Ng’eno V, Muiruri EJ, Nyangweso PM, Langat BK, Kipsat MJ. Farmers
Inaccessibility to Agricultural Credit in Nyandarua District, Kenya. Asian
Journal of Agriculture and Rural Development. 2011; 1(2):64-68.
Oboh VU, Ineye DE. Determinants of formal agricultural credit allocation to the farm
sector by arable crop farmers in Benue State, Nigeria. African Journal of
Agricultural Research. 2011;6 (1):181-185.
Oboh VU, Kushwaha S. Socio-economic Determinants of Farmers’ Loan Size in
Benue State, Nigeria. Journal of Applied Sciences Research. 2009;5(4):354-
358.
Pandula. 2011. “An empirical Invetigation of small and medium enterprises access to
bank finance : the case of an emerging economy “.
Programme Implementation Document (PID) for the Kenya National Domestic
Biogas Programme 2009-2013 ;October 2009.
Rajeswaran, K. (1983). Simple Energy Technology Biogas Utilization in Tanzania. A Paper Presented at IRA Seminar held on 24 May 1983, UDSM. Service paper
48
No. 83/4.
Rutamu, I. (1999). Low Cost Bio-digesters for Zero Grazing Smallholder Dairy Farmers in Tanzania. Livestock Research for Rural Development (11) 2. [http://www.cipav.org.co.]
Stiglitz J. and Weiss. A. 1981. “Credit rationing in markets with imperfect information”.American Economic Review, 71(3): 393–410.
Storey, D.J. 2004."Racial and gender discrimination in the micro firms credit
market?Evidence from Trinidad and Tobago." Small Business Economics, 23
( 5), 401-22.
Ugbomeh GM, Achoja M, Ideh FO, Ofuoku AU. Determinants of loan repayment
performance among women self help groups in Bayelsa State, Nigeria.
Agriculturae Conspectus Scientificus. 2008;73(3):189-195.
United Nations. 2006. Building Inclusive Financial Sectors for Development.
Wanjohi, A.M. and Mugure, A. (2008). Factors affecting the growth of MSEs in rural
areas of Kenya: A case of ICT firms in Kiserian Township, Kajiado District of
Kenya.
Whincop, M. J. 2001. "Bridging the entrepreneurial financing gap:Linking
governance with regulatory policy." Hants: Ashgate Publishing Company.
World Bank (2007), ‘Finance for All:Policy and Pitfalls in Expanding Access”, Policy Research Report, http//go World Bank.org
World Bank. 2008. Finance for all? Policies and pitfalls in expanding access. The International Bank for Reconstruction and Development / The World Bank
World Bank. 2008b. Gender in Agriculture Sourcebook. Washington DC.
World Economic Forum (2012), “unlocking financing for clean energy in Kenya”
Workshop, Nairobi-Kenya 15th May 2012.
Zeller M. Determinants of Credit Rationing: A study of Informal lenders and Formal
Credit Groups in Madagascar. Food Consumption and Nutrition Division,
International Food Policy Research Institute, Washington, D.C. U.S.A; 1994.

49
APPENDIX I QUESTIONNAIRE Dear Respondent,
I am a student at the University of Nairobi pursuing Master of business administration degree
programme which requires submission of a Research project as part of the course. My topic of
research is factors influencing access to credit in the renewable energy: The case of
biogas in Kenya and I kindly request your cooperation to answer the questions below.
Information collected through the questionnaire will be treated with high degree of
confidentiality and will only be used for the purpose of the research.
Instructions: Please tick (√) where applicable or fill the spaces provided.
PART I: GENERAL DATA
1. Nature of the business firm
a) Biogas construction only
b) Biogas construction and appliances
c) Biogas and Solar installation
d) Others (specify) ……………………………………………………
2. Which of the following best describes the form of legal registration for your business?
a. Soleproprietorship b. Partnership c. Limited Company
3. Number of years the firm has been in existence
a) less than one year
b) 1 year to 3 years
c) 3 to 5 years
d) over 5 years
4. Highest level of education (Respondent)
a) Primary b) Secondary c) College

50
d) University e) Other (specify)…………………………………
5. Managerial position held in the business firm a) Middle level b) Senior Level c) Others (Specify)…………………………………………………. PART II: FACTORS INFLUENCING ACESS TO CREDIT This Section is concerned with assessing the level of credit access by renewable energy (BCE) firms in the sector 6. How much money have you invested in this business as capital?
a. Kes 0____ kes 25,000 b. Kes26,000 –kes 75,000 c. Kes 76,000_kes 150,000 d. Kes 151,000 and above
7. How many employees do you have?
a. 0 to 5employees b. 6 to 10 employees c. over 10 employees
8. Do you keep financial records for your business?
a. Yes b. No
Which ones ……………………………………..
9. a) To what extent are you comfortable with the risk of taking a bank loan? i) Highly comfortable ii) Moderately comfortable iii) Not comfortable at all
b) Give reasons for your choice in (a) above with respect to Roman numbers.
i) ……………………………………………………………………………………
…………………………………………………………………………………
ii)………………………………………………………………………………………
…………………………………………………………………………………………
ii)………………………………………………………………………………………
…………………………………………………………………………………………

51
10 .a) How would you rate your access to information on the types of loan products and loan requirements?
i) High access ii) Moderately access iii) Low access
b) Give reasons for your choice in (a) above according to Roman numbers.
i) …………………………………………………………………………………..
………………………………………………………………………………..
ii)………………………………………………………………………………………
………………………………………………………………………………………….
ii)………………………………………………………………………………………
…………………………………………………………………………………………
11 a). Please mark (x) in the box which best describes your agreement or disagreement on each of the following statements.
Statement
Strongly disagree Disagree
Neither agree not disagree Agree
Strongly agree
i ii iii iv v
The firm is always willing to approach a bank for financing
My firm finds bank procedures for credit application to be simple an flexible
My application for finance rarely gets rejected
My firm is always awarded a bank loan which is adequate for my business requirements
My firm has a good perception of banks as a good source of finance for my business venture

52
b) What other sources of financing the business are available to you?
i)…………………………………………………………………………...........
…………………………………………………………………………………
ii)…………………………………………………………………………………..
……………………………………………………………………………………
iii)…………………………………………………………………………………..
…………………………………………………………………………………….
12. What other factors are hindering access to credit by your firm?
................................................……………………………………………………..........
.....................................................……..………………………………………………
……………………………….…………………………………………………………
…………………………………………………………………………………………
…………………………………………………………………………………………
Thank you