Fact Book Q3 2014 - Danske Bank · Danske Bank Fact Book Q3 2014 1.3 Share data The Danske Bank...
52
1 Fact Book Q3 2014 Supplementary Information for Investors and Analysts Unaudited Updated: 30 September 2014
-
Upload
duongnguyet -
Category
Documents
-
view
217 -
download
2
Transcript of Fact Book Q3 2014 - Danske Bank · Danske Bank Fact Book Q3 2014 1.3 Share data The Danske Bank...
1
Fact Book Q3 2014
Supplementary Information for Investors and Analysts Unaudited
Updated: 30 September 2014

2
Danske Bank Fact Book Q3 2014
Table of contents 1. Group facts
1.1 Financial goals 5
1.2 Dividends and share buybacks 5
1.3 Share data 6
1.4 Ratings 7
1.5 Accounting principles and presentation 8
2. Financial statistics
2.1 Income statement - Danske Bank Group 10
2.2 Balance sheet - Danske Bank Group 13
2.2.1 Breakdown of balance sheet 14
2.3 Ratios and key figures 23
3. Business segments and key statistics
3.1 Breakdown of key income and expense items 26
3.2 Personal Banking 28
3.3 Business Banking 32
3.4 Corporates & Institutions (C&I) 36
3.5 Breakdown of loans at Realkredit Danmark 37
3.6 Danske Capital 39
3.7 Danica Pension 41
3.8 Other Activities 42
3.9 Non-core 43
3.10 Market shares, countries 44
3.11 Online banking 45
3.12 MobilePay 45
4. Macroeconomics
4.1 Tables and charts 47
3
Danske Bank Fact Book Q3 2014
Fact Book Q3 2014
This publication is meant as a supplement to the information published in the quarterly interim reports and the annual report. Additional information can be found on www.danskebank.com
For further information, please contact:
Henrik Ramlau-Hansen Direct: +45 45 14 06 66 Chief Financial Officer Mobile: +45 22 20 73 10 [email protected] Claus Ingar Jensen Direct: +45 45 12 84 83 Head of IR Mobile: +45 25 42 43 70 [email protected] Robin Hjelgaard Løfgren Direct: +45 45 14 06 04 IR Officer Mobile: +45 24 75 15 40 [email protected]
This publication has been prepared by Danske Bank for information purposes only. It is not an offer or solicitation of any offers to purchase or sell any securities, currency or financial instruments. Whilst reasonable care has been taken to ensure that the content of this publication is not untrue or misleading, no representation is made as to its accuracy or completeness, and no liability is accepted for any loss arising from reliance on it. Danske Bank, its affiliates or staff may perform business services, hold, establish, change or cease to hold positions in any securities, currency or financial instrument mentioned in this publication. Danske Bank Group’s research analysts are not permitted to invest in securities under coverage in their research sector. This publication is not intended for private customers in the UK or any person in the US. Danske Bank is regulated by the FSA for the conduct of investment business in the UK and is a member of the London Stock Exchange. Copyright © 2014 Danske Bank A/S. All rights reserved. This publication is protected by copyright and may not be reproduced in whole or in part without permission.
Disclaimer
Financial calendar
Date Event
3 February 2015
30 April 2015
22 July 2015
29 October 2015
Annual Report 2014
Interim Report – First quarter 2015
Interim Report – First half 2015
Interim Report – First nine months 2015

4
Group facts
5
Danske Bank Fact Book Q3 2014
1.1 Financial goals
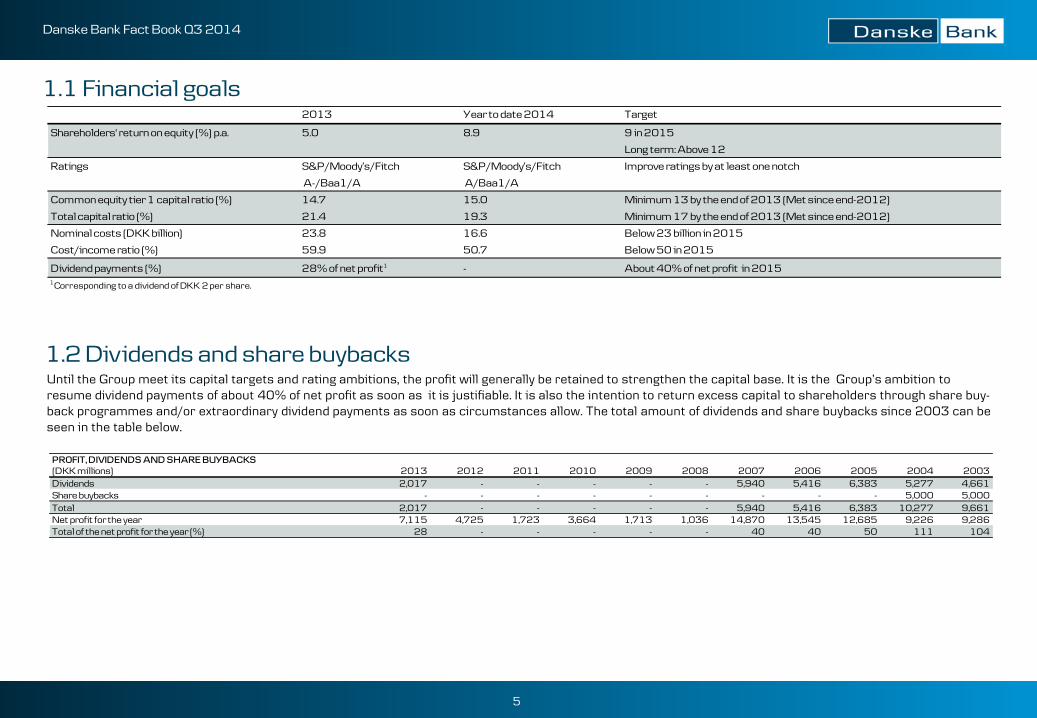
Until the Group meet its capital targets and rating ambitions, the profit will generally be retained to strengthen the capital base. It is the Group’s ambition to resume dividend payments of about 40% of net profit as soon as it is justifiable. It is also the intention to return excess capital to shareholders through share buy-back programmes and/or extraordinary dividend payments as soon as circumstances allow. The total amount of dividends and share buybacks since 2003 can be seen in the table below.
1.2 Dividends and share buybacks
PROFIT, DIVIDENDS AND SHARE BUYBACKS(DKK millions) 2013 2012 2011 2010 2009 2008 2007 2006 2005 2004 2003Dividends 2,017 - - - - - 5,940 5,416 6,383 5,277 4,661Share buybacks - - - - - - - - - 5,000 5,000Total 2,017 - - - - - 5,940 5,416 6,383 10,277 9,661Net profit for the year 7,115 4,725 1,723 3,664 1,713 1,036 14,870 13,545 12,685 9,226 9,286Total of the net profit for the year (%) 28 - - - - - 40 40 50 111 104
2013 Year to date 2014 Target
Shareholders' return on equity (%) p.a. 5.0 8.9 9 in 2015
Long term: Above 12
Ratings S&P/Moody’s/Fitch S&P/Moody’s/Fitch Improve ratings by at least one notch
A-/Baa1/A A/Baa1/A
Common equity tier 1 capital ratio (%) 14.7 15.0 Minimum 13 by the end of 2013 (Met since end-2012)
Total capital ratio (%) 21.4 19.3 Minimum 17 by the end of 2013 (Met since end-2012)
Nominal costs (DKK billion) 23.8 16.6 Below 23 billion in 2015
Cost/income ratio (%) 59.9 50.7 Below 50 in 2015
Dividend payments (%) 28% of net profit1 - About 40% of net profit in 20151Corresponding to a dividend of DKK 2 per share.
6
Danske Bank Fact Book Q3 2014
1.3 Share data
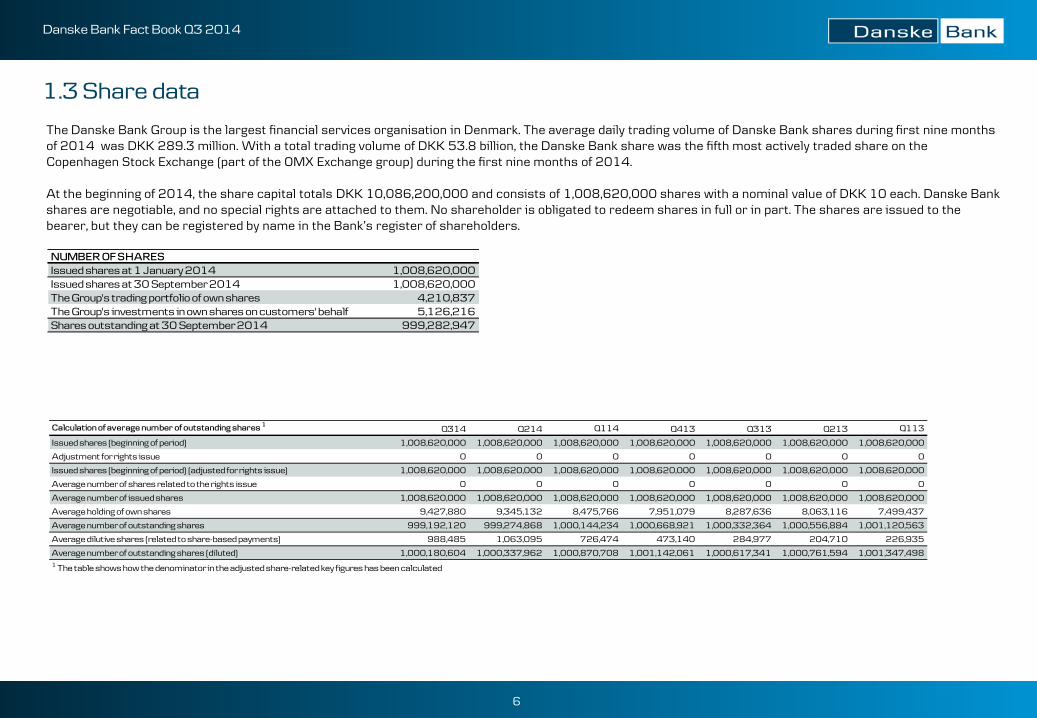
The Danske Bank Group is the largest financial services organisation in Denmark. The average daily trading volume of Danske Bank shares during first nine months of 2014 was DKK 289.3 million. With a total trading volume of DKK 53.8 billion, the Danske Bank share was the fifth most actively traded share on the Copenhagen Stock Exchange (part of the OMX Exchange group) during the first nine months of 2014. At the beginning of 2014, the share capital totals DKK 10,086,200,000 and consists of 1,008,620,000 shares with a nominal value of DKK 10 each. Danske Bank shares are negotiable, and no special rights are attached to them. No shareholder is obligated to redeem shares in full or in part. The shares are issued to the bearer, but they can be registered by name in the Bank’s register of shareholders.
NUMBER OF SHARESIssued shares at 1 January 2014 1,008,620,000Issued shares at 30 September 2014 1,008,620,000The Group's trading portfolio of own shares 4,210,837The Group's investments in own shares on customers' behalf 5,126,216Shares outstanding at 30 September 2014 999,282,947
Calculation of average number of outstanding shares 1 Q314 Q214 Q114 Q413 Q313 Q213 Q113
Issued shares (beginning of period) 1,008,620,000 1,008,620,000 1,008,620,000 1,008,620,000 1,008,620,000 1,008,620,000 1,008,620,000
Adjustment for rights issue 0 0 0 0 0 0 0
Issued shares (beginning of period) (adjusted for rights issue) 1,008,620,000 1,008,620,000 1,008,620,000 1,008,620,000 1,008,620,000 1,008,620,000 1,008,620,000
Average number of shares related to the rights issue 0 0 0 0 0 0 0
Average number of issued shares 1,008,620,000 1,008,620,000 1,008,620,000 1,008,620,000 1,008,620,000 1,008,620,000 1,008,620,000
Average holding of own shares 9,427,880 9,345,132 8,475,766 7,951,079 8,287,636 8,063,116 7,499,437
Average number of outstanding shares 999,192,120 999,274,868 1,000,144,234 1,000,668,921 1,000,332,364 1,000,556,884 1,001,120,563
Average dilutive shares (related to share-based payments) 988,485 1,063,095 726,474 473,140 284,977 204,710 226,935
Average number of outstanding shares (diluted) 1,000,180,604 1,000,337,962 1,000,870,708 1,001,142,061 1,000,617,341 1,000,761,594 1,001,347,4981 The table shows how the denominator in the adjusted share-related key figures has been calculated
7
Danske Bank Fact Book Q3 2014
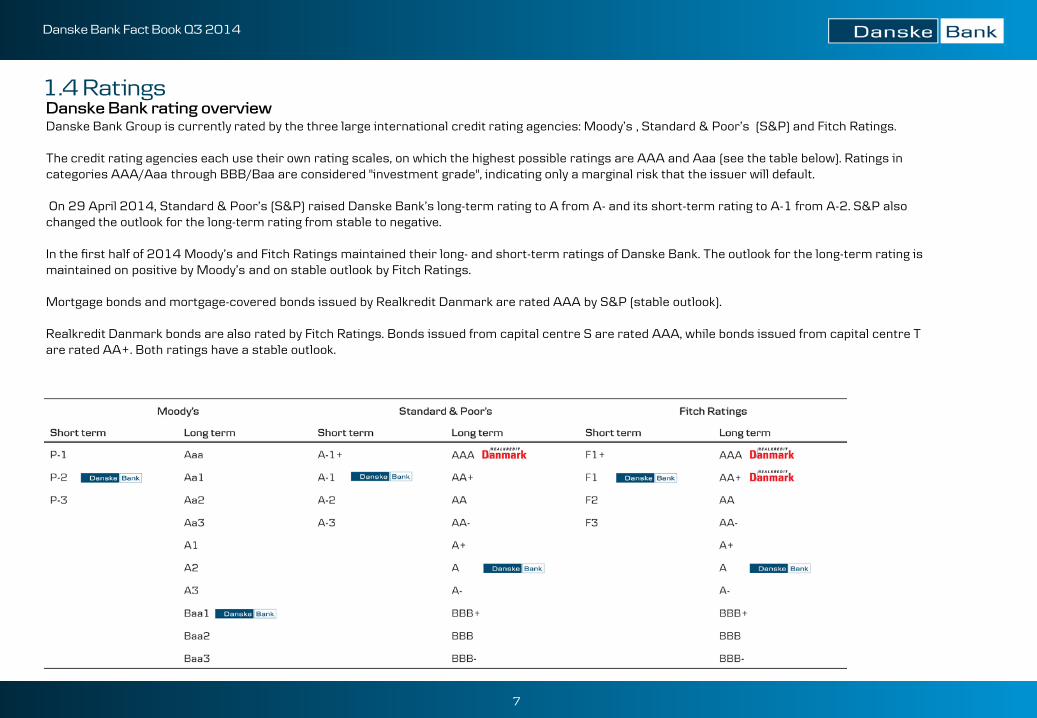
Danske Bank rating overview Danske Bank Group is currently rated by the three large international credit rating agencies: Moody’s , Standard & Poor’s (S&P) and Fitch Ratings. The credit rating agencies each use their own rating scales, on which the highest possible ratings are AAA and Aaa (see the table below). Ratings in categories AAA/Aaa through BBB/Baa are considered "investment grade", indicating only a marginal risk that the issuer will default. On 29 April 2014, Standard & Poor’s (S&P) raised Danske Bank’s long-term rating to A from A- and its short-term rating to A-1 from A-2. S&P also changed the outlook for the long-term rating from stable to negative. In the first half of 2014 Moody’s and Fitch Ratings maintained their long- and short-term ratings of Danske Bank. The outlook for the long-term rating is maintained on positive by Moody’s and on stable outlook by Fitch Ratings. Mortgage bonds and mortgage-covered bonds issued by Realkredit Danmark are rated AAA by S&P (stable outlook). Realkredit Danmark bonds are also rated by Fitch Ratings. Bonds issued from capital centre S are rated AAA, while bonds issued from capital centre T are rated AA+. Both ratings have a stable outlook.
1.4 Ratings
8
Danske Bank Fact Book Q3 2014
Accounting principles The Group’s interim report for the first nine months of 2014 has been prepared in accordance with IAS 34, Interim Financial Reporting, as adopted by the EU, and additional Danish disclosure requirements for interim reports of listed financial institutions. The Group has adopted IFRS 10, Consolidated Financial Statements, IFRS 11, Joint Arrangement, and amendments to IAS 28, Investments in Associates and Joint Ventures . The adoption had an insignificant effect on the Group’s consolidated financial statements. As part of the Group’s strategy, Non-core activities are placed in a separate business unit. Personal Banking and Business Banking customers in Ireland were transferred to the Non-core unit with effect from 1 January 2014.
Accounting policies and estimates Management’s estimates and assumptions of future events that will significantly affect the carrying amounts of assets and liabilities underlie the preparation of the consolidated financial statements. The estimates and assumptions that are deemed critical to the consolidated financial statements are • the fair value measurement of financial instruments • the measurement of loans and advances • the measurement of goodwill • the measurement of liabilities under insurance contracts • the recognition of deferred tax The estimates and assumptions are based on premises that management finds reasonable but which are inherently uncertain and unpredictable. The premises may be incomplete, unexpected future events or situations may occur, and other parties may arrive at other estimated values. For further description of the Group’s significant risks and external conditions that may affect the Group, see Annual Report 2013 and Risk Management 2013.
1.5 Accounting principles and presentation
9
Financial statistics
10
Danske Bank Fact Book Q3 2014
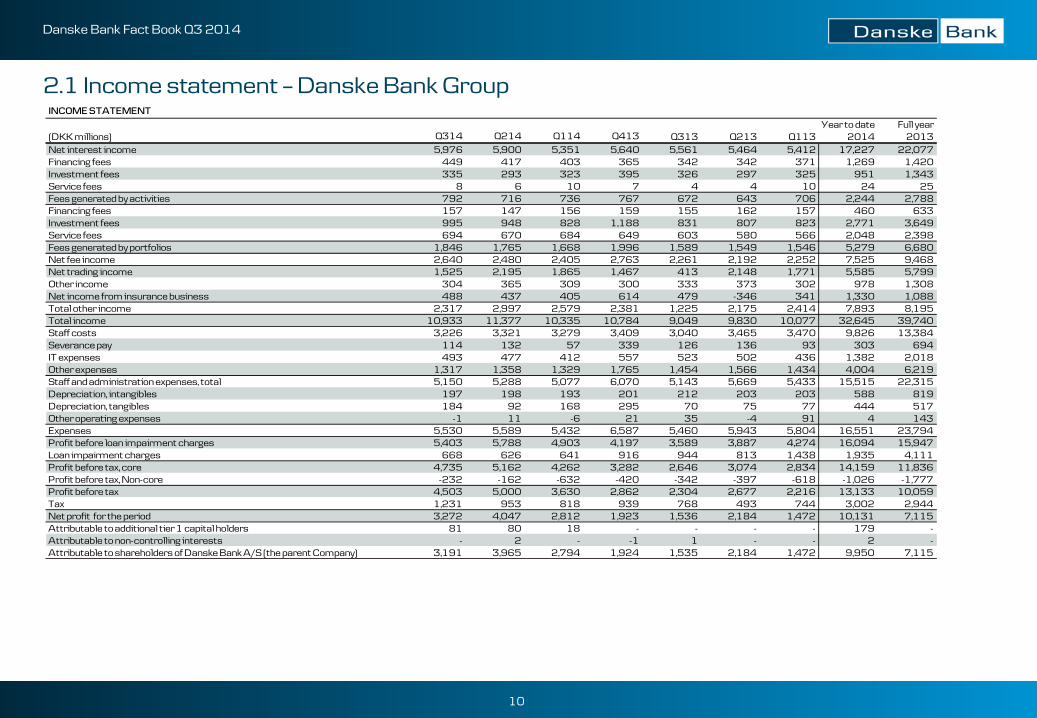
2.1 Income statement – Danske Bank Group
INCOME STATEMENTYear to date Full year
(DKK millions) Q314 Q214 Q114 Q413 Q313 Q213 Q113 2014 2013Net interest income 5,976 5,900 5,351 5,640 5,561 5,464 5,412 17,227 22,077Financing fees 449 417 403 365 342 342 371 1,269 1,420Investment fees 335 293 323 395 326 297 325 951 1,343Service fees 8 6 10 7 4 4 10 24 25Fees generated by activities 792 716 736 767 672 643 706 2,244 2,788Financing fees 157 147 156 159 155 162 157 460 633Investment fees 995 948 828 1,188 831 807 823 2,771 3,649Service fees 694 670 684 649 603 580 566 2,048 2,398Fees generated by portfolios 1,846 1,765 1,668 1,996 1,589 1,549 1,546 5,279 6,680Net fee income 2,640 2,480 2,405 2,763 2,261 2,192 2,252 7,525 9,468Net trading income 1,525 2,195 1,865 1,467 413 2,148 1,771 5,585 5,799Other income 304 365 309 300 333 373 302 978 1,308Net income from insurance business 488 437 405 614 479 -346 341 1,330 1,088Total other income 2,317 2,997 2,579 2,381 1,225 2,175 2,414 7,893 8,195Total income 10,933 11,377 10,335 10,784 9,049 9,830 10,077 32,645 39,740Staff costs 3,226 3,321 3,279 3,409 3,040 3,465 3,470 9,826 13,384Severance pay 114 132 57 339 126 136 93 303 694IT expenses 493 477 412 557 523 502 436 1,382 2,018Other expenses 1,317 1,358 1,329 1,765 1,454 1,566 1,434 4,004 6,219Staff and administration expenses, total 5,150 5,288 5,077 6,070 5,143 5,669 5,433 15,515 22,315Depreciation, intangibles 197 198 193 201 212 203 203 588 819Depreciation, tangibles 184 92 168 295 70 75 77 444 517Other operating expenses -1 11 -6 21 35 -4 91 4 143Expenses 5,530 5,589 5,432 6,587 5,460 5,943 5,804 16,551 23,794Profit before loan impairment charges 5,403 5,788 4,903 4,197 3,589 3,887 4,274 16,094 15,947Loan impairment charges 668 626 641 916 944 813 1,438 1,935 4,111Profit before tax, core 4,735 5,162 4,262 3,282 2,646 3,074 2,834 14,159 11,836Profit before tax, Non-core -232 -162 -632 -420 -342 -397 -618 -1,026 -1,777Profit before tax 4,503 5,000 3,630 2,862 2,304 2,677 2,216 13,133 10,059Tax 1,231 953 818 939 768 493 744 3,002 2,944Net profit for the period 3,272 4,047 2,812 1,923 1,536 2,184 1,472 10,131 7,115Attributable to additional tier 1 capital holders 81 80 18 - - - - 179 -Attributable to non-controlling interests - 2 - -1 1 - - 2 -Attributable to shareholders of Danske Bank A/S (the parent Company) 3,191 3,965 2,794 1,924 1,535 2,184 1,472 9,950 7,115
11
Danske Bank Fact Book Q3 2014
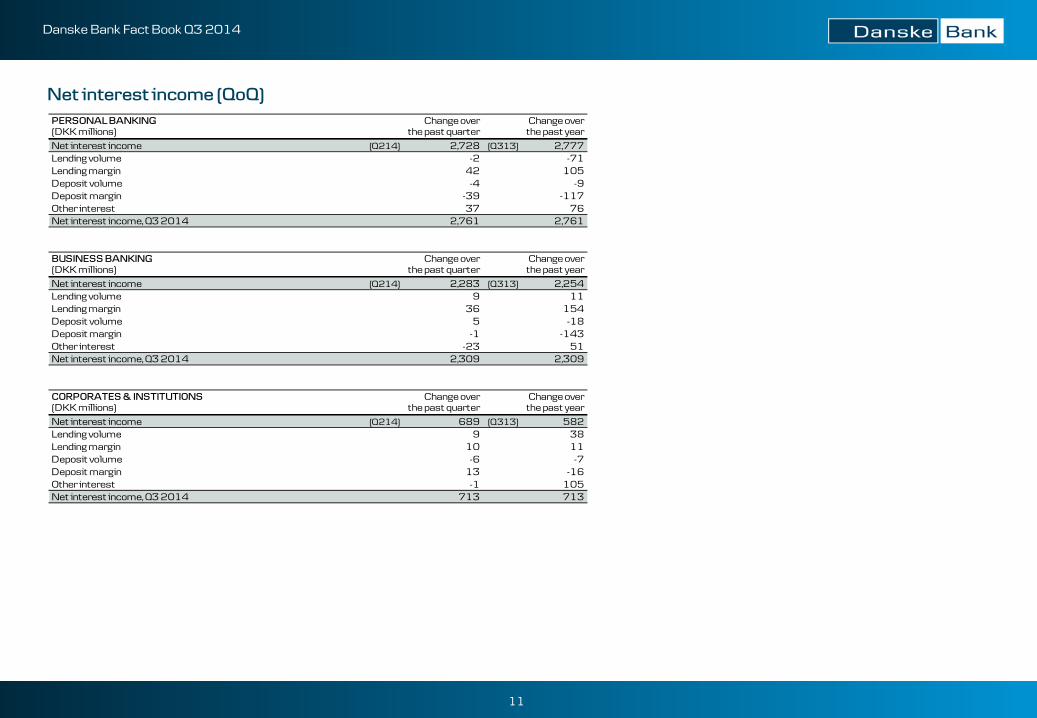
Net interest income (QoQ) PERSONAL BANKING Change over Change over(DKK millions) the past quarter the past yearNet interest income (Q214) 2,728 (Q313) 2,777Lending volume -2 -71Lending margin 42 105Deposit volume -4 -9Deposit margin -39 -117Other interest 37 76Net interest income, Q3 2014 2,761 2,761
BUSINESS BANKING Change over Change over(DKK millions) the past quarter the past yearNet interest income (Q214) 2,283 (Q313) 2,254Lending volume 9 11Lending margin 36 154Deposit volume 5 -18Deposit margin -1 -143Other interest -23 51Net interest income, Q3 2014 2,309 2,309
CORPORATES & INSTITUTIONS Change over Change over(DKK millions) the past quarter the past yearNet interest income (Q214) 689 (Q313) 582Lending volume 9 38Lending margin 10 11Deposit volume -6 -7Deposit margin 13 -16Other interest -1 105Net interest income, Q3 2014 713 713
12
Danske Bank Fact Book Q3 2014
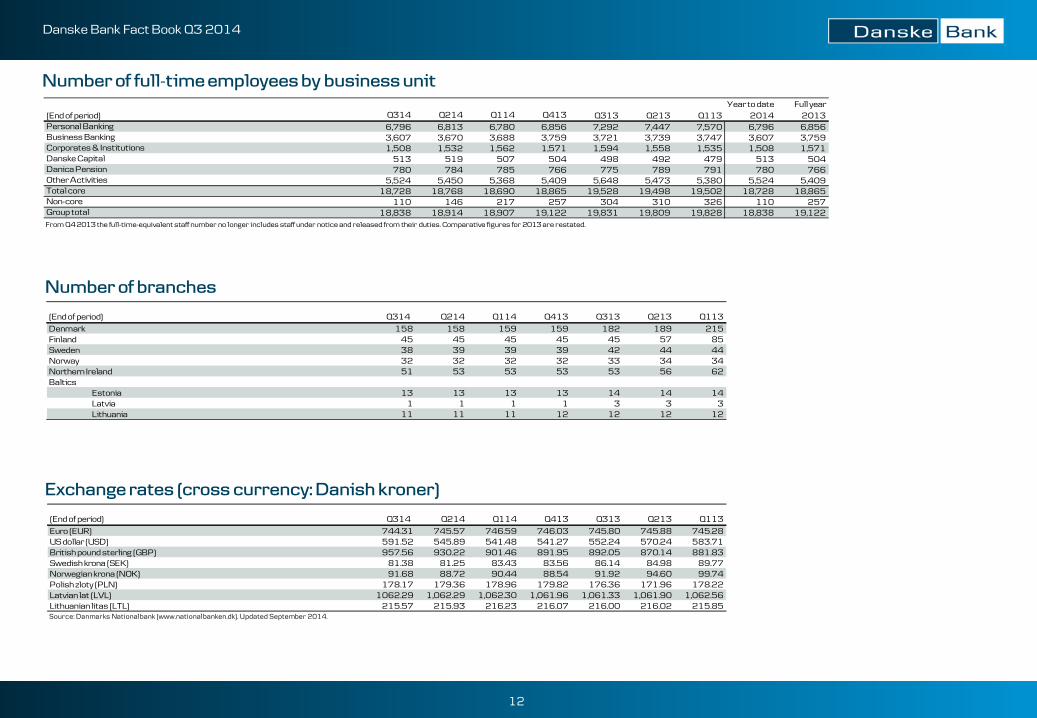
Number of full-time employees by business unit
Exchange rates (cross currency: Danish kroner)
Number of branches
Year to date Full year(End of period) Q314 Q214 Q114 Q413 Q313 Q213 Q113 2014 2013Personal Banking 6,796 6,813 6,780 6,856 7,292 7,447 7,570 6,796 6,856Business Banking 3,607 3,670 3,688 3,759 3,721 3,739 3,747 3,607 3,759Corporates & Institutions 1,508 1,532 1,562 1,571 1,594 1,558 1,535 1,508 1,571Danske Capital 513 519 507 504 498 492 479 513 504Danica Pension 780 784 785 766 775 789 791 780 766Other Activities 5,524 5,450 5,368 5,409 5,648 5,473 5,380 5,524 5,409Total core 18,728 18,768 18,690 18,865 19,528 19,498 19,502 18,728 18,865Non-core 110 146 217 257 304 310 326 110 257Group total 18,838 18,914 18,907 19,122 19,831 19,809 19,828 18,838 19,122From Q4 2013 the full-time-equivalent staff number no longer includes staff under notice and released from their duties. Comparative figures for 2013 are restated.
(End of period) Q314 Q214 Q114 Q413 Q313 Q213 Q113Denmark 158 158 159 159 182 189 215Finland 45 45 45 45 45 57 85Sweden 38 39 39 39 42 44 44Norway 32 32 32 32 33 34 34Northern Ireland 51 53 53 53 53 56 62Baltics Estonia 13 13 13 13 14 14 14 Latvia 1 1 1 1 3 3 3 Lithuania 11 11 11 12 12 12 12
(End of period) Q314 Q214 Q114 Q413 Q313 Q213 Q113Euro (EUR) 744.31 745.57 746.59 746.03 745.80 745.88 745.28US dollar (USD) 591.52 545.89 541.48 541.27 552.24 570.24 583.71British pound sterling (GBP) 957.56 930.22 901.46 891.95 892.05 870.14 881.83Swedish krona (SEK) 81.38 81.25 83.43 83.56 86.14 84.98 89.77Norwegian krona (NOK) 91.68 88.72 90.44 88.54 91.92 94.60 99.74Polish zloty (PLN) 178.17 179.36 178.96 179.82 176.36 171.96 178.22Latvian lat (LVL) 1062.29 1,062.29 1,062.30 1,061.96 1,061.33 1,061.90 1,062.56Lithuanian litas (LTL) 215.57 215.93 216.23 216.07 216.00 216.02 215.85Source: Danmarks Nationalbank (www.nationalbanken.dk). Updated September 2014.
13
Danske Bank Fact Book Q3 2014
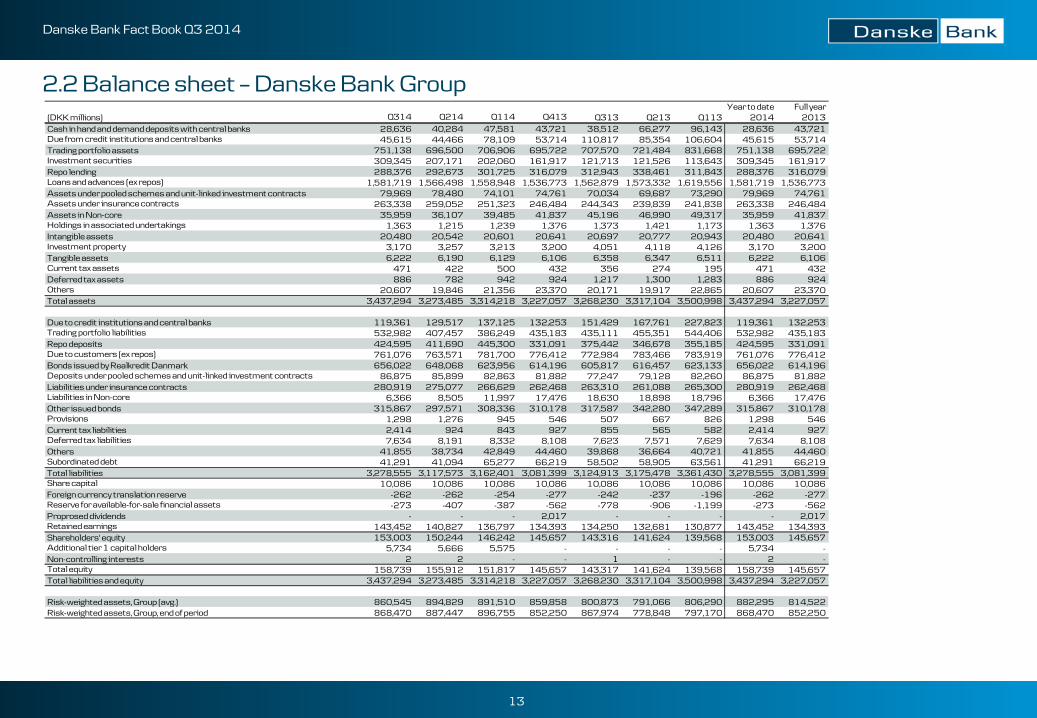
2.2 Balance sheet – Danske Bank Group Year to date Full year
(DKK millions) Q314 Q214 Q114 Q413 Q313 Q213 Q113 2014 2013Cash in hand and demand deposits with central banks 28,636 40,284 47,581 43,721 38,512 66,277 96,143 28,636 43,721Due from credit institutions and central banks 45,615 44,466 78,109 53,714 110,817 85,354 106,604 45,615 53,714Trading portfolio assets 751,138 696,500 706,906 695,722 707,570 721,484 831,668 751,138 695,722Investment securities 309,345 207,171 202,060 161,917 121,713 121,526 113,643 309,345 161,917Repo lending 288,376 292,673 301,725 316,079 312,943 338,461 311,843 288,376 316,079Loans and advances (ex repos) 1,581,719 1,566,498 1,558,948 1,536,773 1,562,879 1,573,332 1,619,556 1,581,719 1,536,773Assets under pooled schemes and unit-linked investment contracts 79,969 78,480 74,101 74,761 70,034 69,687 73,290 79,969 74,761Assets under insurance contracts 263,338 259,052 251,323 246,484 244,343 239,839 241,838 263,338 246,484Assets in Non-core 35,959 36,107 39,485 41,837 45,196 46,990 49,317 35,959 41,837Holdings in associated undertakings 1,363 1,215 1,239 1,376 1,373 1,421 1,173 1,363 1,376Intangible assets 20,480 20,542 20,601 20,641 20,697 20,777 20,943 20,480 20,641Investment property 3,170 3,257 3,213 3,200 4,051 4,118 4,126 3,170 3,200Tangible assets 6,222 6,190 6,129 6,106 6,358 6,347 6,511 6,222 6,106Current tax assets 471 422 500 432 356 274 195 471 432Deferred tax assets 886 782 942 924 1,217 1,300 1,283 886 924Others 20,607 19,846 21,356 23,370 20,171 19,917 22,865 20,607 23,370Total assets 3,437,294 3,273,485 3,314,218 3,227,057 3,268,230 3,317,104 3,500,998 3,437,294 3,227,057
Due to credit institutions and central banks 119,361 129,517 137,125 132,253 151,429 167,761 227,823 119,361 132,253Trading portfolio liabilities 532,982 407,457 386,249 435,183 435,111 455,351 544,406 532,982 435,183Repo deposits 424,595 411,690 445,300 331,091 375,442 346,678 355,185 424,595 331,091Due to customers (ex repos) 761,076 763,571 781,700 776,412 772,984 783,466 783,919 761,076 776,412Bonds issued by Realkredit Danmark 656,022 648,068 623,956 614,196 605,817 616,457 623,133 656,022 614,196Deposits under pooled schemes and unit-linked investment contracts 86,875 85,899 82,863 81,882 77,247 79,128 82,260 86,875 81,882Liabilities under insurance contracts 280,919 275,077 266,629 262,468 263,310 261,088 265,300 280,919 262,468Liabilities in Non-core 6,366 8,505 11,997 17,476 18,630 18,898 18,796 6,366 17,476Other issued bonds 315,867 297,571 308,336 310,178 317,587 342,280 347,289 315,867 310,178Provisions 1,298 1,276 945 546 507 667 826 1,298 546Current tax liabilities 2,414 924 843 927 855 565 582 2,414 927Deferred tax liabilities 7,634 8,191 8,332 8,108 7,623 7,571 7,629 7,634 8,108Others 41,855 38,734 42,849 44,460 39,868 36,664 40,721 41,855 44,460Subordinated debt 41,291 41,094 65,277 66,219 58,502 58,905 63,561 41,291 66,219Total liabilities 3,278,555 3,117,573 3,162,401 3,081,399 3,124,913 3,175,478 3,361,430 3,278,555 3,081,399Share capital 10,086 10,086 10,086 10,086 10,086 10,086 10,086 10,086 10,086Foreign currency translation reserve -262 -262 -254 -277 -242 -237 -196 -262 -277Reserve for available-for-sale financial assets -273 -407 -387 -562 -778 -906 -1,199 -273 -562Proprosed dividends - - - 2,017 - - - - 2,017Retained earnings 143,452 140,827 136,797 134,393 134,250 132,681 130,877 143,452 134,393Shareholders' equity 153,003 150,244 146,242 145,657 143,316 141,624 139,568 153,003 145,657Additional tier 1 capital holders 5,734 5,666 5,575 - - - - 5,734 -Non-controlling interests 2 2 - - 1 - - 2 -Total equity 158,739 155,912 151,817 145,657 143,317 141,624 139,568 158,739 145,657Total liabilities and equity 3,437,294 3,273,485 3,314,218 3,227,057 3,268,230 3,317,104 3,500,998 3,437,294 3,227,057
Risk-weighted assets, Group (avg.) 860,545 894,829 891,510 859,858 800,873 791,066 806,290 882,295 814,522Risk-weighted assets, Group, end of period 868,470 887,447 896,755 852,250 867,974 778,848 797,170 868,470 852,250
14
Danske Bank Fact Book Q3 2014
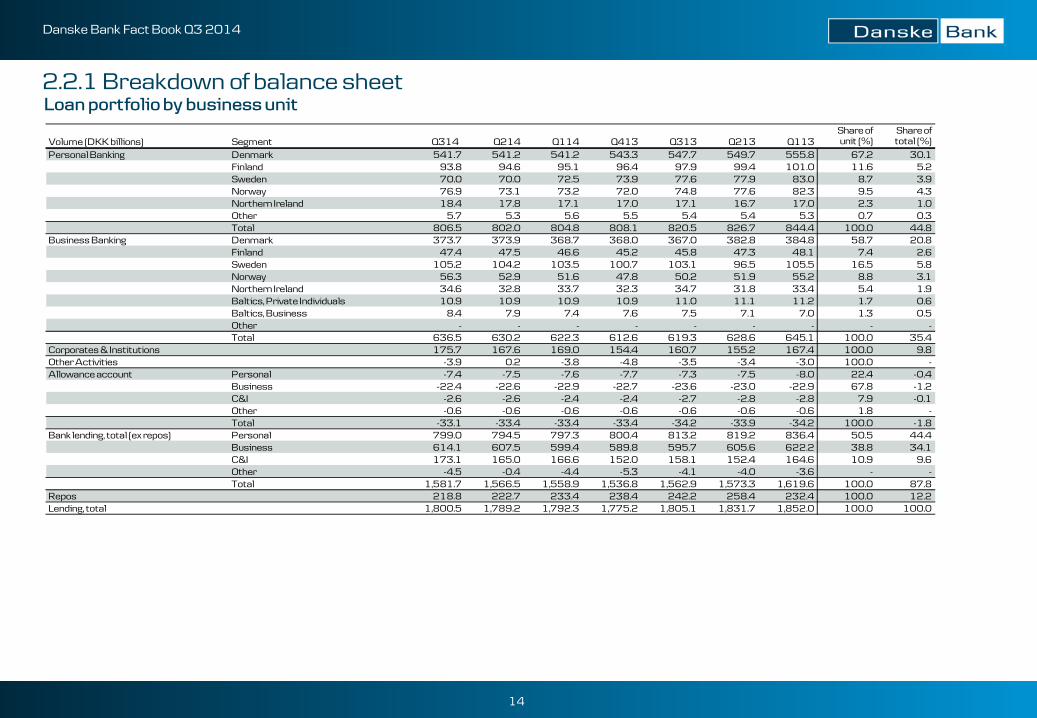
2.2.1 Breakdown of balance sheet
Loan portfolio by business unit Share of Share of
Volume (DKK billions) Segment Q314 Q214 Q114 Q413 Q313 Q213 Q113 unit (%) total (%)Personal Banking Denmark 541.7 541.2 541.2 543.3 547.7 549.7 555.8 67.2 30.1
Finland 93.8 94.6 95.1 96.4 97.9 99.4 101.0 11.6 5.2Sweden 70.0 70.0 72.5 73.9 77.6 77.9 83.0 8.7 3.9Norway 76.9 73.1 73.2 72.0 74.8 77.6 82.3 9.5 4.3Northern Ireland 18.4 17.8 17.1 17.0 17.1 16.7 17.0 2.3 1.0Other 5.7 5.3 5.6 5.5 5.4 5.4 5.3 0.7 0.3Total 806.5 802.0 804.8 808.1 820.5 826.7 844.4 100.0 44.8
Business Banking Denmark 373.7 373.9 368.7 368.0 367.0 382.8 384.8 58.7 20.8Finland 47.4 47.5 46.6 45.2 45.8 47.3 48.1 7.4 2.6Sweden 105.2 104.2 103.5 100.7 103.1 96.5 105.5 16.5 5.8Norway 56.3 52.9 51.6 47.8 50.2 51.9 55.2 8.8 3.1Northern Ireland 34.6 32.8 33.7 32.3 34.7 31.8 33.4 5.4 1.9Baltics, Private Individuals 10.9 10.9 10.9 10.9 11.0 11.1 11.2 1.7 0.6Baltics, Business 8.4 7.9 7.4 7.6 7.5 7.1 7.0 1.3 0.5Other - - - - - - - - -Total 636.5 630.2 622.3 612.6 619.3 628.6 645.1 100.0 35.4
Corporates & Institutions 175.7 167.6 169.0 154.4 160.7 155.2 167.4 100.0 9.8Other Activities -3.9 0.2 -3.8 -4.8 -3.5 -3.4 -3.0 100.0 -Allowance account Personal -7.4 -7.5 -7.6 -7.7 -7.3 -7.5 -8.0 22.4 -0.4
Business -22.4 -22.6 -22.9 -22.7 -23.6 -23.0 -22.9 67.8 -1.2C&I -2.6 -2.6 -2.4 -2.4 -2.7 -2.8 -2.8 7.9 -0.1Other -0.6 -0.6 -0.6 -0.6 -0.6 -0.6 -0.6 1.8 -Total -33.1 -33.4 -33.4 -33.4 -34.2 -33.9 -34.2 100.0 -1.8
Bank lending, total (ex repos) Personal 799.0 794.5 797.3 800.4 813.2 819.2 836.4 50.5 44.4Business 614.1 607.5 599.4 589.8 595.7 605.6 622.2 38.8 34.1C&I 173.1 165.0 166.6 152.0 158.1 152.4 164.6 10.9 9.6Other -4.5 -0.4 -4.4 -5.3 -4.1 -4.0 -3.6 - -Total 1,581.7 1,566.5 1,558.9 1,536.8 1,562.9 1,573.3 1,619.6 100.0 87.8
Repos 218.8 222.7 233.4 238.4 242.2 258.4 232.4 100.0 12.2Lending, total 1,800.5 1,789.2 1,792.3 1,775.2 1,805.1 1,831.7 1,852.0 100.0 100.0
15
Danske Bank Fact Book Q3 2014
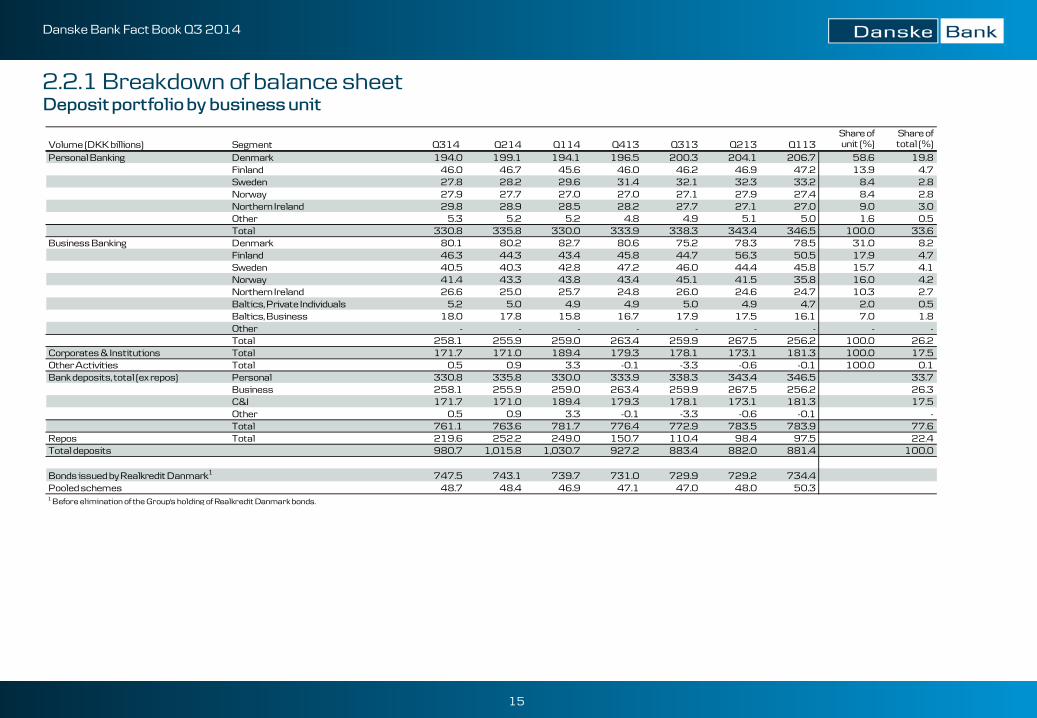
2.2.1 Breakdown of balance sheet
Deposit portfolio by business unit
Share of Share ofVolume (DKK billions) Segment Q314 Q214 Q114 Q413 Q313 Q213 Q113 unit (%) total (%)Personal Banking Denmark 194.0 199.1 194.1 196.5 200.3 204.1 206.7 58.6 19.8
Finland 46.0 46.7 45.6 46.0 46.2 46.9 47.2 13.9 4.7Sweden 27.8 28.2 29.6 31.4 32.1 32.3 33.2 8.4 2.8Norway 27.9 27.7 27.0 27.0 27.1 27.9 27.4 8.4 2.8Northern Ireland 29.8 28.9 28.5 28.2 27.7 27.1 27.0 9.0 3.0Other 5.3 5.2 5.2 4.8 4.9 5.1 5.0 1.6 0.5Total 330.8 335.8 330.0 333.9 338.3 343.4 346.5 100.0 33.6
Business Banking Denmark 80.1 80.2 82.7 80.6 75.2 78.3 78.5 31.0 8.2Finland 46.3 44.3 43.4 45.8 44.7 56.3 50.5 17.9 4.7Sweden 40.5 40.3 42.8 47.2 46.0 44.4 45.8 15.7 4.1Norway 41.4 43.3 43.8 43.4 45.1 41.5 35.8 16.0 4.2Northern Ireland 26.6 25.0 25.7 24.8 26.0 24.6 24.7 10.3 2.7Baltics, Private Individuals 5.2 5.0 4.9 4.9 5.0 4.9 4.7 2.0 0.5Baltics, Business 18.0 17.8 15.8 16.7 17.9 17.5 16.1 7.0 1.8Other - - - - - - - - -Total 258.1 255.9 259.0 263.4 259.9 267.5 256.2 100.0 26.2
Corporates & Institutions Total 171.7 171.0 189.4 179.3 178.1 173.1 181.3 100.0 17.5Other Activities Total 0.5 0.9 3.3 -0.1 -3.3 -0.6 -0.1 100.0 0.1Bank deposits, total (ex repos) Personal 330.8 335.8 330.0 333.9 338.3 343.4 346.5 33.7
Business 258.1 255.9 259.0 263.4 259.9 267.5 256.2 26.3C&I 171.7 171.0 189.4 179.3 178.1 173.1 181.3 17.5Other 0.5 0.9 3.3 -0.1 -3.3 -0.6 -0.1 -Total 761.1 763.6 781.7 776.4 772.9 783.5 783.9 77.6
Repos Total 219.6 252.2 249.0 150.7 110.4 98.4 97.5 22.4Total deposits 980.7 1,015.8 1,030.7 927.2 883.4 882.0 881.4 100.0
Bonds issued by Realkredit Danmark1 747.5 743.1 739.7 731.0 729.9 729.2 734.4Pooled schemes 48.7 48.4 46.9 47.1 47.0 48.0 50.31 Before elimination of the Group's holding of Realkredit Danmark bonds.
16
Danske Bank Fact Book Q3 2014
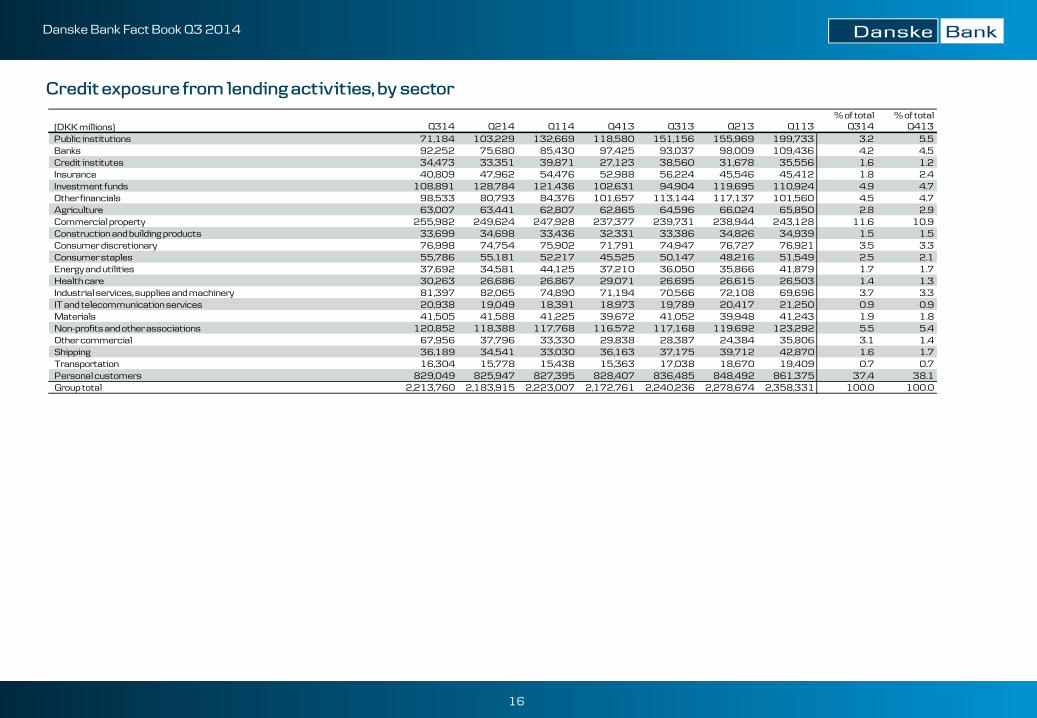
Credit exposure from lending activities, by sector % of total % of total
(DKK millions) Q314 Q214 Q114 Q413 Q313 Q213 Q113 Q314 Q413Public institutions 71,184 103,229 132,669 118,580 151,156 155,969 199,733 3.2 5.5Banks 92,252 75,680 85,430 97,425 93,037 98,009 109,436 4.2 4.5Credit institutes 34,473 33,351 39,871 27,123 38,560 31,678 35,556 1.6 1.2Insurance 40,809 47,962 54,476 52,988 56,224 45,546 45,412 1.8 2.4Investment funds 108,891 128,784 121,436 102,631 94,904 119,695 110,924 4.9 4.7Other financials 98,533 80,793 84,376 101,657 113,144 117,137 101,560 4.5 4.7Agriculture 63,007 63,441 62,807 62,865 64,596 66,024 65,850 2.8 2.9Commercial property 255,982 249,624 247,928 237,377 239,731 238,944 243,128 11.6 10.9Construction and building products 33,699 34,698 33,436 32,331 33,386 34,826 34,939 1.5 1.5Consumer discretionary 76,998 74,754 75,902 71,791 74,947 76,727 76,921 3.5 3.3Consumer staples 55,786 55,181 52,217 45,525 50,147 48,216 51,549 2.5 2.1Energy and utilities 37,692 34,581 44,125 37,210 36,050 35,866 41,879 1.7 1.7Health care 30,263 26,686 26,867 29,071 26,695 26,615 26,503 1.4 1.3Industrial services, supplies and machinery 81,397 82,065 74,890 71,194 70,566 72,108 69,696 3.7 3.3IT and telecommunication services 20,938 19,049 18,391 18,973 19,789 20,417 21,250 0.9 0.9Materials 41,505 41,588 41,225 39,672 41,052 39,948 41,243 1.9 1.8Non-profits and other associations 120,852 118,388 117,768 116,572 117,168 119,692 123,292 5.5 5.4Other commercial 67,956 37,796 33,330 29,838 28,387 24,384 35,806 3.1 1.4Shipping 36,189 34,541 33,030 36,163 37,175 39,712 42,870 1.6 1.7Transportation 16,304 15,778 15,438 15,363 17,038 18,670 19,409 0.7 0.7Personal customers 829,049 825,947 827,395 828,407 836,485 848,492 861,375 37.4 38.1Group total 2,213,760 2,183,915 2,223,007 2,172,761 2,240,236 2,278,674 2,358,331 100.0 100.0
17
Danske Bank Fact Book Q3 2014
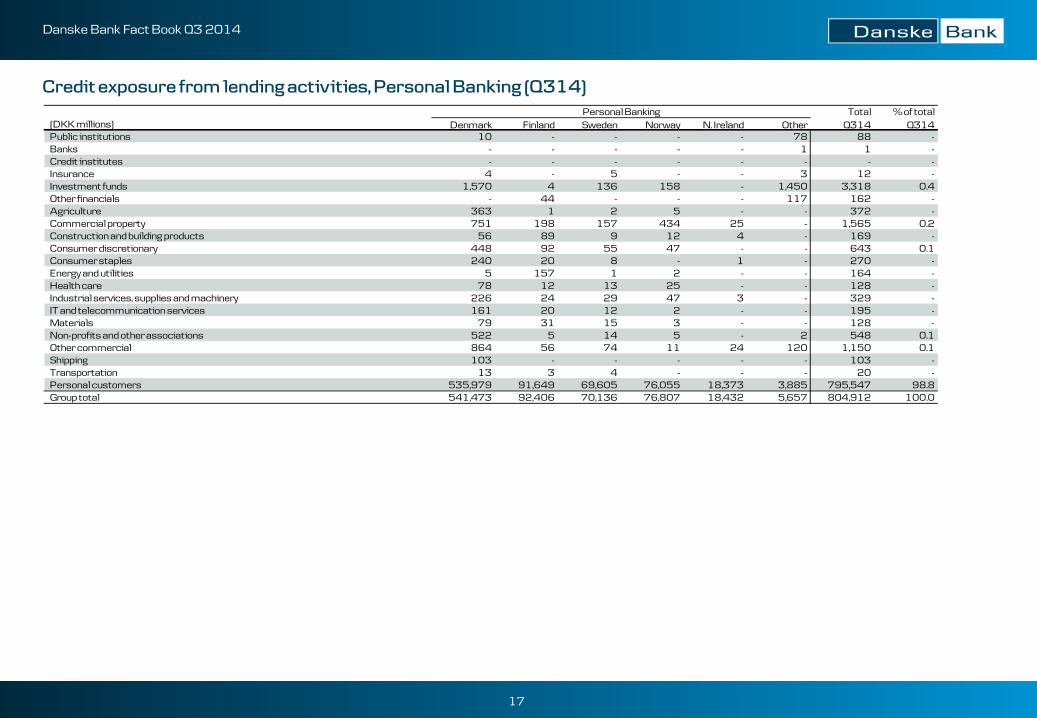
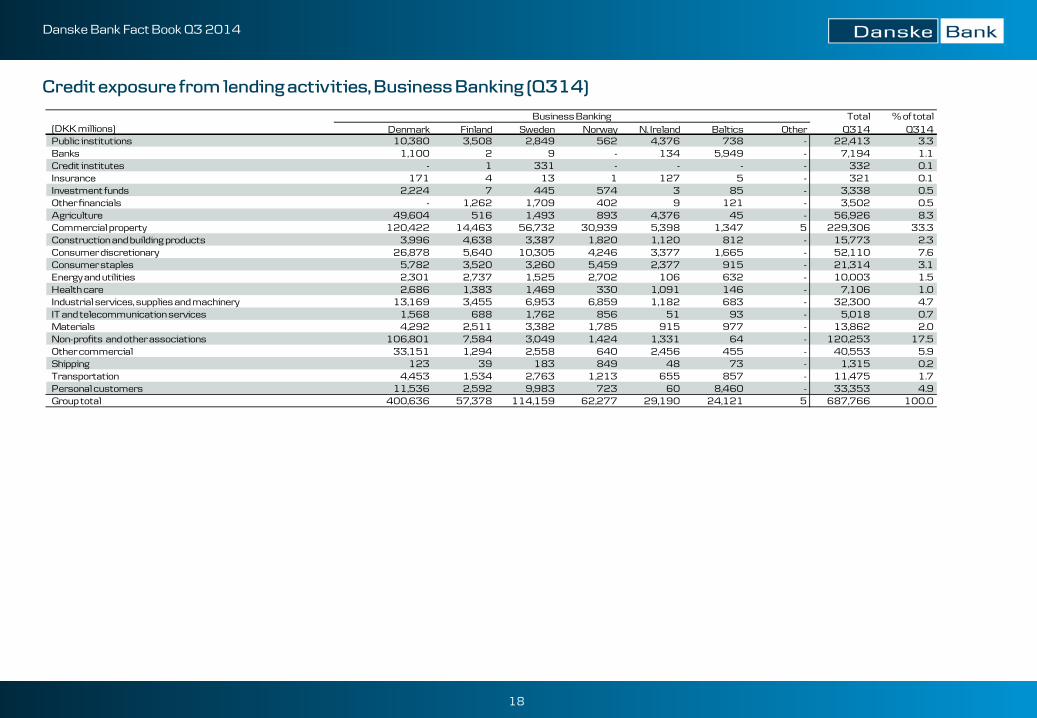
Credit exposure from lending activities, Personal Banking (Q314) Total % of total
(DKK millions) Denmark Finland Sweden Norway N. Ireland Other Q314 Q314Public institutions 10 - - - - 78 88 -Banks - - - - - 1 1 -Credit institutes - - - - - - - -Insurance 4 - 5 - - 3 12 -Investment funds 1,570 4 136 158 - 1,450 3,318 0.4Other financials - 44 - - - 117 162 -Agriculture 363 1 2 5 - - 372 -Commercial property 751 198 157 434 25 - 1,565 0.2Construction and building products 56 89 9 12 4 - 169 -Consumer discretionary 448 92 55 47 - - 643 0.1Consumer staples 240 20 8 - 1 - 270 -Energy and utilities 5 157 1 2 - - 164 -Health care 78 12 13 25 - - 128 -Industrial services, supplies and machinery 226 24 29 47 3 - 329 -IT and telecommunication services 161 20 12 2 - - 195 -Materials 79 31 15 3 - - 128 -Non-profits and other associations 522 5 14 5 - 2 548 0.1Other commercial 864 56 74 11 24 120 1,150 0.1Shipping 103 - - - - - 103 -Transportation 13 3 4 - - - 20 -Personal customers 535,979 91,649 69,605 76,055 18,373 3,885 795,547 98.8Group total 541,473 92,406 70,136 76,807 18,432 5,657 804,912 100.0
Personal Banking
18
Danske Bank Fact Book Q3 2014
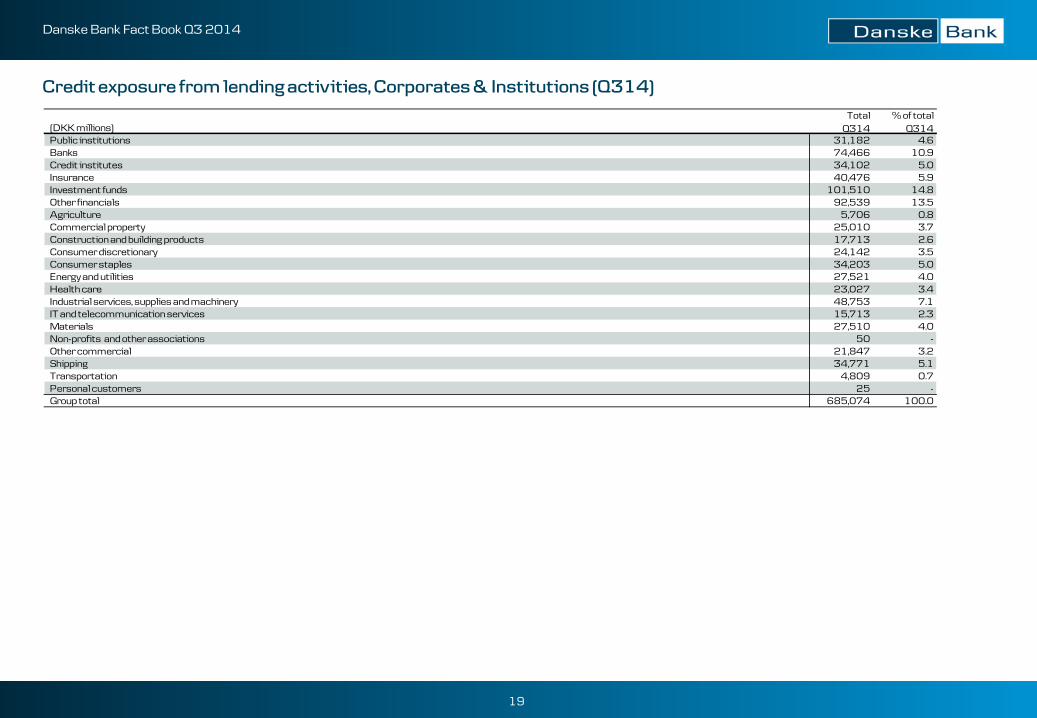
Credit exposure from lending activities, Business Banking (Q314)
Total % of total(DKK millions) Denmark Finland Sweden Norway N. Ireland Baltics Other Q314 Q314Public institutions 10,380 3,508 2,849 562 4,376 738 - 22,413 3.3Banks 1,100 2 9 - 134 5,949 - 7,194 1.1Credit institutes - 1 331 - - - - 332 0.1Insurance 171 4 13 1 127 5 - 321 0.1Investment funds 2,224 7 445 574 3 85 - 3,338 0.5Other financials - 1,262 1,709 402 9 121 - 3,502 0.5Agriculture 49,604 516 1,493 893 4,376 45 - 56,926 8.3Commercial property 120,422 14,463 56,732 30,939 5,398 1,347 5 229,306 33.3Construction and building products 3,996 4,638 3,387 1,820 1,120 812 - 15,773 2.3Consumer discretionary 26,878 5,640 10,305 4,246 3,377 1,665 - 52,110 7.6Consumer staples 5,782 3,520 3,260 5,459 2,377 915 - 21,314 3.1Energy and utilities 2,301 2,737 1,525 2,702 106 632 - 10,003 1.5Health care 2,686 1,383 1,469 330 1,091 146 - 7,106 1.0Industrial services, supplies and machinery 13,169 3,455 6,953 6,859 1,182 683 - 32,300 4.7IT and telecommunication services 1,568 688 1,762 856 51 93 - 5,018 0.7Materials 4,292 2,511 3,382 1,785 915 977 - 13,862 2.0Non-profits and other associations 106,801 7,584 3,049 1,424 1,331 64 - 120,253 17.5Other commercial 33,151 1,294 2,558 640 2,456 455 - 40,553 5.9Shipping 123 39 183 849 48 73 - 1,315 0.2Transportation 4,453 1,534 2,763 1,213 655 857 - 11,475 1.7Personal customers 11,536 2,592 9,983 723 60 8,460 - 33,353 4.9Group total 400,636 57,378 114,159 62,277 29,190 24,121 5 687,766 100.0
Business Banking
19
Danske Bank Fact Book Q3 2014
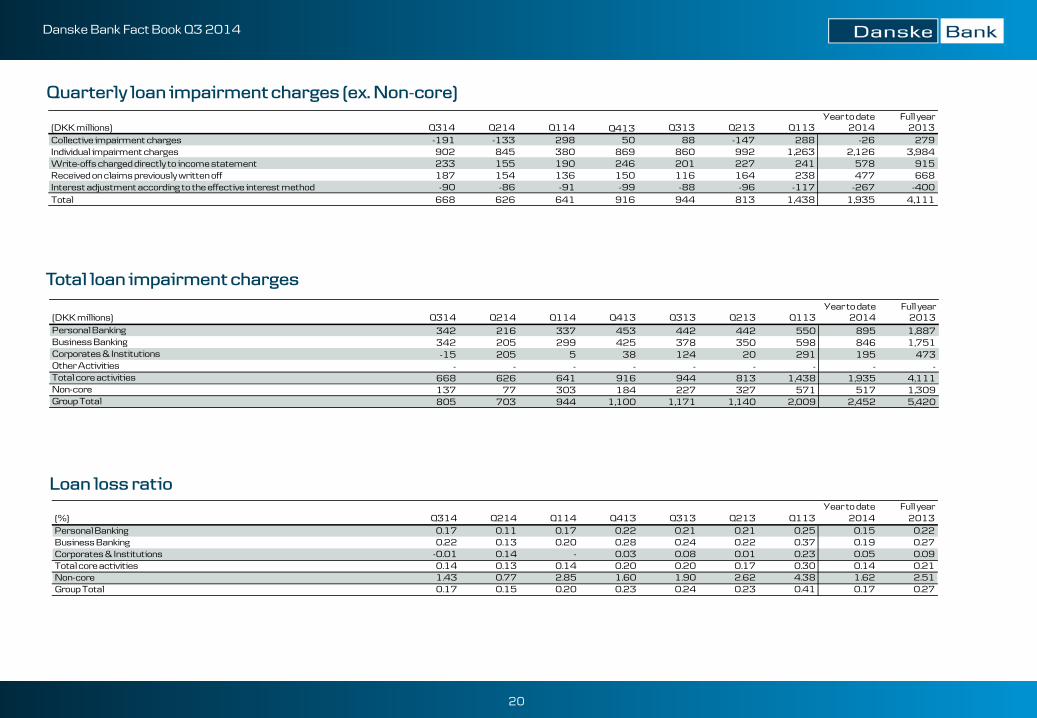
Credit exposure from lending activities, Corporates & Institutions (Q314)
Total % of total(DKK millions) Q314 Q314Public institutions 31,182 4.6Banks 74,466 10.9Credit institutes 34,102 5.0Insurance 40,476 5.9Investment funds 101,510 14.8Other financials 92,539 13.5Agriculture 5,706 0.8Commercial property 25,010 3.7Construction and building products 17,713 2.6Consumer discretionary 24,142 3.5Consumer staples 34,203 5.0Energy and utilities 27,521 4.0Health care 23,027 3.4Industrial services, supplies and machinery 48,753 7.1IT and telecommunication services 15,713 2.3Materials 27,510 4.0Non-profits and other associations 50 -Other commercial 21,847 3.2Shipping 34,771 5.1Transportation 4,809 0.7Personal customers 25 -Group total 685,074 100.0
20
Danske Bank Fact Book Q3 2014
Total loan impairment charges
Loan loss ratio
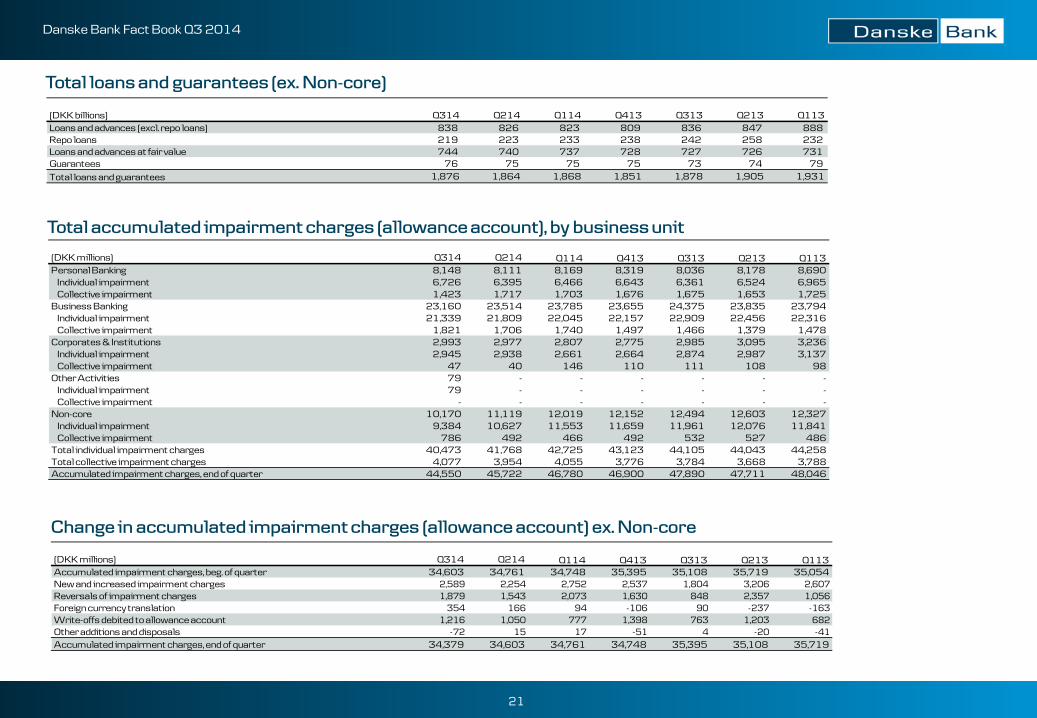
Quarterly loan impairment charges (ex. Non-core) Year to date Full year
(DKK millions) Q314 Q214 Q114 Q413 Q313 Q213 Q113 2014 2013Collective impairment charges -191 -133 298 50 88 -147 288 -26 279Individual impairment charges 902 845 380 869 860 992 1,263 2,126 3,984Write-offs charged directly to income statement 233 155 190 246 201 227 241 578 915Received on claims previously written off 187 154 136 150 116 164 238 477 668Interest adjustment according to the effective interest method -90 -86 -91 -99 -88 -96 -117 -267 -400Total 668 626 641 916 944 813 1,438 1,935 4,111
Year to date Full year(DKK millions) Q314 Q214 Q114 Q413 Q313 Q213 Q113 2014 2013Personal Banking 342 216 337 453 442 442 550 895 1,887Business Banking 342 205 299 425 378 350 598 846 1,751Corporates & Institutions -15 205 5 38 124 20 291 195 473Other Activities - - - - - - - - -Total core activities 668 626 641 916 944 813 1,438 1,935 4,111Non-core 137 77 303 184 227 327 571 517 1,309Group Total 805 703 944 1,100 1,171 1,140 2,009 2,452 5,420
Year to date Full year(%) Q314 Q214 Q114 Q413 Q313 Q213 Q113 2014 2013Personal Banking 0.17 0.11 0.17 0.22 0.21 0.21 0.25 0.15 0.22Business Banking 0.22 0.13 0.20 0.28 0.24 0.22 0.37 0.19 0.27Corporates & Institutions -0.01 0.14 - 0.03 0.08 0.01 0.23 0.05 0.09Total core activities 0.14 0.13 0.14 0.20 0.20 0.17 0.30 0.14 0.21Non-core 1.43 0.77 2.85 1.60 1.90 2.62 4.38 1.62 2.51Group Total 0.17 0.15 0.20 0.23 0.24 0.23 0.41 0.17 0.27
21
Danske Bank Fact Book Q3 2014
Change in accumulated impairment charges (allowance account) ex. Non-core
Total accumulated impairment charges (allowance account), by business unit
Total loans and guarantees (ex. Non-core)
(DKK billions) Q314 Q214 Q114 Q413 Q313 Q213 Q113Loans and advances (excl. repo loans) 838 826 823 809 836 847 888 Repo loans 219 223 233 238 242 258 232 Loans and advances at fair value 744 740 737 728 727 726 731 Guarantees 76 75 75 75 73 74 79 Total loans and guarantees 1,876 1,864 1,868 1,851 1,878 1,905 1,931
(DKK millions) Q314 Q214 Q114 Q413 Q313 Q213 Q113Personal Banking 8,148 8,111 8,169 8,319 8,036 8,178 8,690 Individual impairment 6,726 6,395 6,466 6,643 6,361 6,524 6,965 Collective impairment 1,423 1,717 1,703 1,676 1,675 1,653 1,725Business Banking 23,160 23,514 23,785 23,655 24,375 23,835 23,794 Individual impairment 21,339 21,809 22,045 22,157 22,909 22,456 22,316 Collective impairment 1,821 1,706 1,740 1,497 1,466 1,379 1,478Corporates & Institutions 2,993 2,977 2,807 2,775 2,985 3,095 3,236 Individual impairment 2,945 2,938 2,661 2,664 2,874 2,987 3,137 Collective impairment 47 40 146 110 111 108 98Other Activities 79 - - - - - - Individual impairment 79 - - - - - - Collective impairment - - - - - - -Non-core 10,170 11,119 12,019 12,152 12,494 12,603 12,327 Individual impairment 9,384 10,627 11,553 11,659 11,961 12,076 11,841 Collective impairment 786 492 466 492 532 527 486Total individual impairment charges 40,473 41,768 42,725 43,123 44,105 44,043 44,258Total collective impairment charges 4,077 3,954 4,055 3,776 3,784 3,668 3,788Accumulated impairment charges, end of quarter 44,550 45,722 46,780 46,900 47,890 47,711 48,046
(DKK millions) Q314 Q214 Q114 Q413 Q313 Q213 Q113Accumulated impairment charges, beg. of quarter 34,603 34,761 34,748 35,395 35,108 35,719 35,054New and increased impairment charges 2,589 2,254 2,752 2,537 1,804 3,206 2,607Reversals of impairment charges 1,879 1,543 2,073 1,630 848 2,357 1,056Foreign currency translation 354 166 94 -106 90 -237 -163Write-offs debited to allowance account 1,216 1,050 777 1,398 763 1,203 682Other additions and disposals -72 15 17 -51 4 -20 -41Accumulated impairment charges, end of quarter 34,379 34,603 34,761 34,748 35,395 35,108 35,719
22
Danske Bank Fact Book Q3 2014
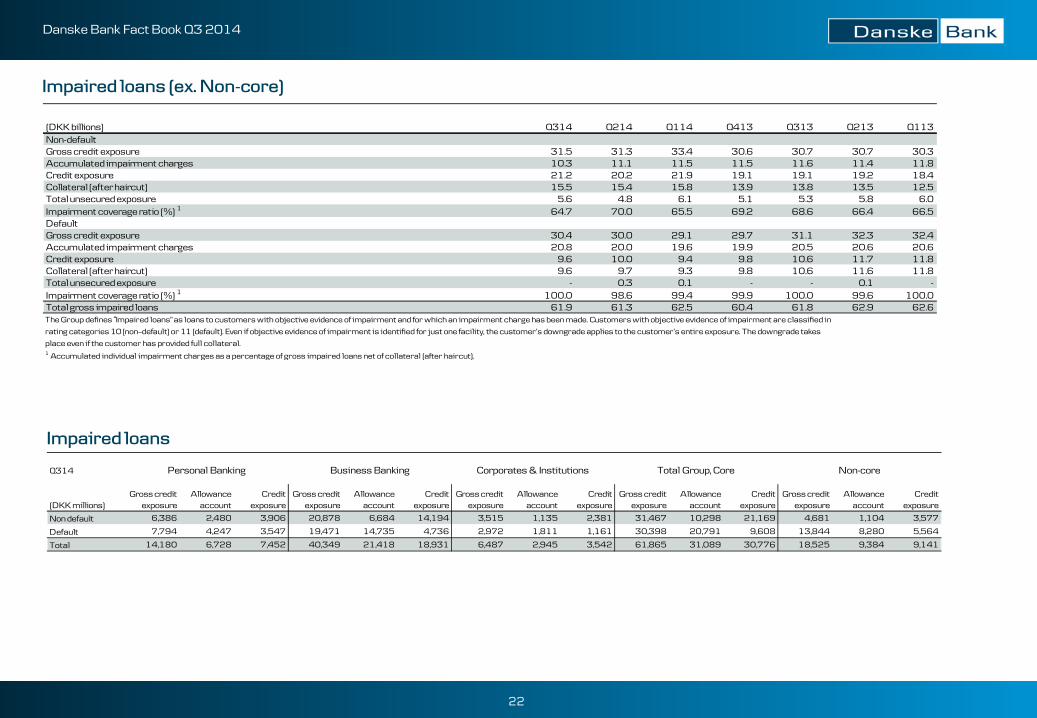
Impaired loans (ex. Non-core)
Impaired loans
(DKK billions) Q314 Q214 Q114 Q413 Q313 Q213 Q113Non-defaultGross credit exposure 31.5 31.3 33.4 30.6 30.7 30.7 30.3Accumulated impairment charges 10.3 11.1 11.5 11.5 11.6 11.4 11.8Credit exposure 21.2 20.2 21.9 19.1 19.1 19.2 18.4Collateral (after haircut) 15.5 15.4 15.8 13.9 13.8 13.5 12.5Total unsecured exposure 5.6 4.8 6.1 5.1 5.3 5.8 6.0Impairment coverage ratio (%) 1 64.7 70.0 65.5 69.2 68.6 66.4 66.5DefaultGross credit exposure 30.4 30.0 29.1 29.7 31.1 32.3 32.4Accumulated impairment charges 20.8 20.0 19.6 19.9 20.5 20.6 20.6Credit exposure 9.6 10.0 9.4 9.8 10.6 11.7 11.8Collateral (after haircut) 9.6 9.7 9.3 9.8 10.6 11.6 11.8Total unsecured exposure - 0.3 0.1 - - 0.1 -Impairment coverage ratio (%) 1 100.0 98.6 99.4 99.9 100.0 99.6 100.0Total gross impaired loans 61.9 61.3 62.5 60.4 61.8 62.9 62.6The Group defines “Impaired loans” as loans to customers with objective evidence of impairment and for which an impairment charge has been made. Customers with objective evidence of impairment are classified in
rating categories 10 (non–default) or 11 (default). Even if objective evidence of impairment is identified for just one facility, the customer’s downgrade applies to the customer’s entire exposure. The downgrade takes
place even if the customer has provided full collateral.1 Accumulated individual impairment charges as a percentage of gross impaired loans net of collateral (after haircut).
Q314
(DKK millions)
Non default 6,386 2,480 3,906 20,878 6,684 14,194 3,515 1,135 2,381 31,467 10,298 21,169 4,681 1,104 3,577
Default 7,794 4,247 3,547 19,471 14,735 4,736 2,972 1,811 1,161 30,398 20,791 9,608 13,844 8,280 5,564
Total 14,180 6,728 7,452 40,349 21,418 18,931 6,487 2,945 3,542 61,865 31,089 30,776 18,525 9,384 9,141
Allowance account
Credit exposure
Gross credit exposure
Allowance account
Credit exposure
Credit exposure
Gross credit exposure
Allowance account
Credit exposure
Gross credit exposure
Gross credit exposure
Allowance account
Credit exposure
Gross credit exposure
Allowance account
Personal Banking Business Banking Corporates & Institutions Total Group, Core Non-core
23
Danske Bank Fact Book Q3 2014
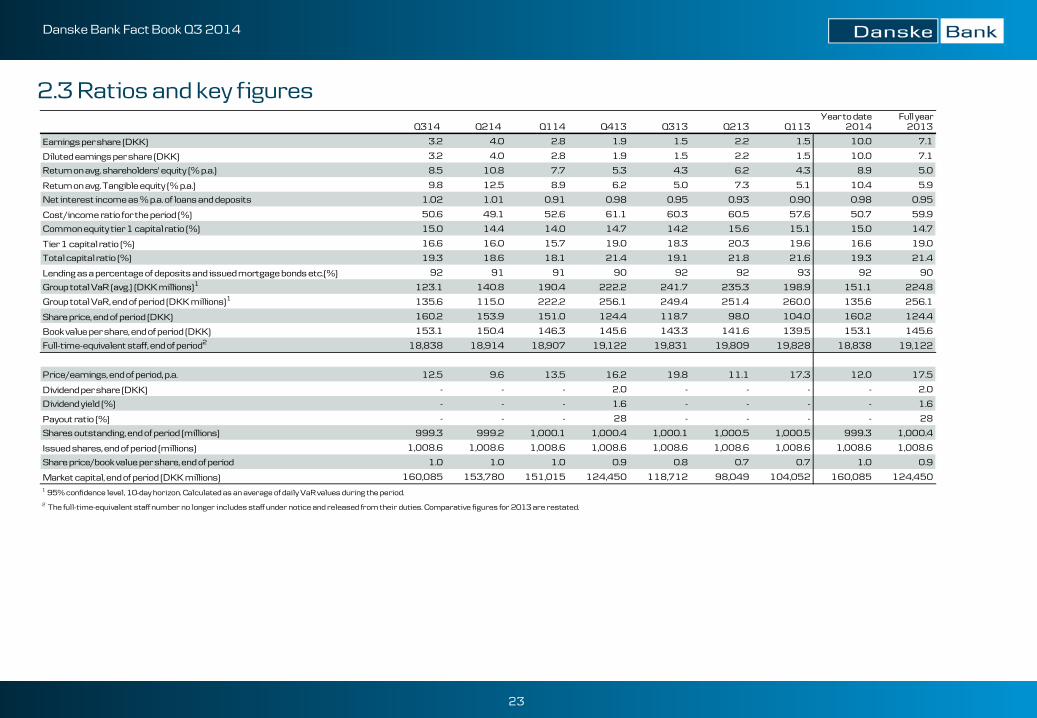
2.3 Ratios and key figures Year to date Full year
Q314 Q214 Q114 Q413 Q313 Q213 Q113 2014 2013
Earnings per share (DKK) 3.2 4.0 2.8 1.9 1.5 2.2 1.5 10.0 7.1
Diluted earnings per share (DKK) 3.2 4.0 2.8 1.9 1.5 2.2 1.5 10.0 7.1
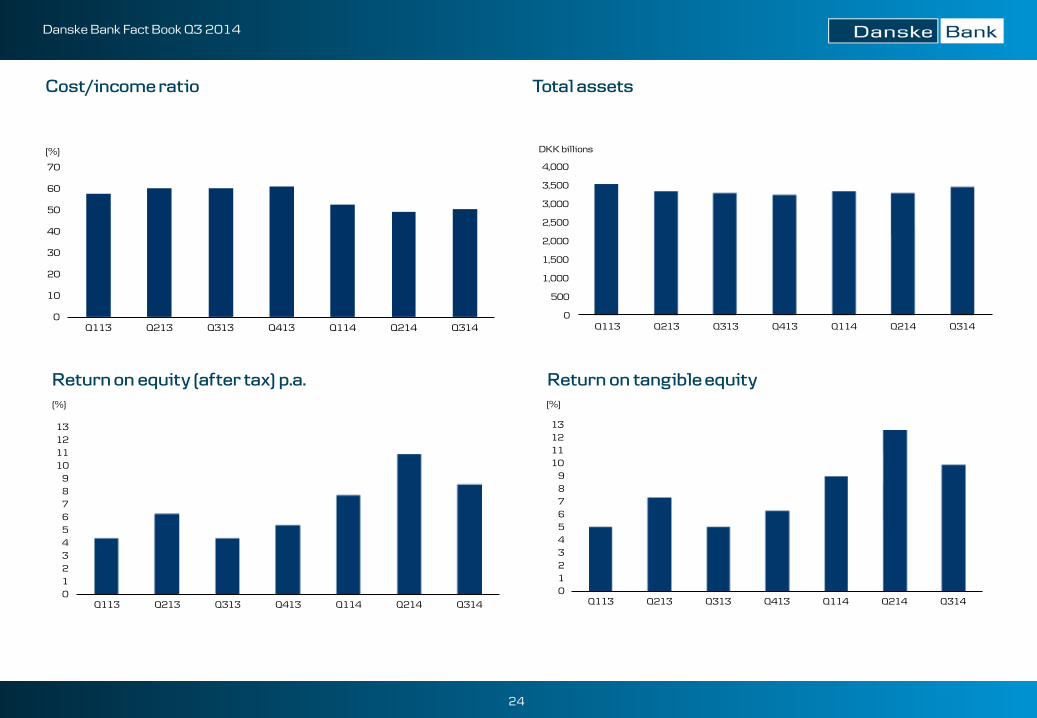
Return on avg. shareholders' equity (% p.a.) 8.5 10.8 7.7 5.3 4.3 6.2 4.3 8.9 5.0
Return on avg. Tangible equity (% p.a.) 9.8 12.5 8.9 6.2 5.0 7.3 5.1 10.4 5.9
Net interest income as % p.a. of loans and deposits 1.02 1.01 0.91 0.98 0.95 0.93 0.90 0.98 0.95
Cost/income ratio for the period (%) 50.6 49.1 52.6 61.1 60.3 60.5 57.6 50.7 59.9
Common equity tier 1 capital ratio (%) 15.0 14.4 14.0 14.7 14.2 15.6 15.1 15.0 14.7
Tier 1 capital ratio (%) 16.6 16.0 15.7 19.0 18.3 20.3 19.6 16.6 19.0
Total capital ratio (%) 19.3 18.6 18.1 21.4 19.1 21.8 21.6 19.3 21.4
Lending as a percentage of deposits and issued mortgage bonds etc.(%) 92 91 91 90 92 92 93 92 90
Group total VaR (avg.) (DKK millions)1 123.1 140.8 190.4 222.2 241.7 235.3 198.9 151.1 224.8
Group total VaR, end of period (DKK millions)1 135.6 115.0 222.2 256.1 249.4 251.4 260.0 135.6 256.1
Share price, end of period (DKK) 160.2 153.9 151.0 124.4 118.7 98.0 104.0 160.2 124.4
Book value per share, end of period (DKK) 153.1 150.4 146.3 145.6 143.3 141.6 139.5 153.1 145.6
Full-time-equivalent staff, end of period2 18,838 18,914 18,907 19,122 19,831 19,809 19,828 18,838 19,122
Price/earnings, end of period, p.a. 12.5 9.6 13.5 16.2 19.8 11.1 17.3 12.0 17.5
Dividend per share (DKK) - - - 2.0 - - - - 2.0
Dividend yield (%) - - - 1.6 - - - - 1.6
Payout ratio (%) - - - 28 - - - - 28
Shares outstanding, end of period (millions) 999.3 999.2 1,000.1 1,000.4 1,000.1 1,000.5 1,000.5 999.3 1,000.4
Issued shares, end of period (millions) 1,008.6 1,008.6 1,008.6 1,008.6 1,008.6 1,008.6 1,008.6 1,008.6 1,008.6
Share price/book value per share, end of period 1.0 1.0 1.0 0.9 0.8 0.7 0.7 1.0 0.9
Market capital, end of period (DKK millions) 160,085 153,780 151,015 124,450 118,712 98,049 104,052 160,085 124,4501 95% confidence level, 10-day horizon. Calculated as an average of daily VaR values during the period. 2 The full-time-equivalent staff number no longer includes staff under notice and released from their duties. Comparative figures for 2013 are restated.
24
Danske Bank Fact Book Q3 2014
Cost/income ratio Total assets
Return on equity (after tax) p.a. Return on tangible equity
0
10
20
30
40
50
60
70
Q113 Q213 Q313 Q413 Q114 Q214 Q314
(%)
0
500
1,000
1,500
2,000
2,500
3,000
3,500
4,000
Q113 Q213 Q313 Q413 Q114 Q214 Q314
DKK billions
0123456789
10111213
Q113 Q213 Q313 Q413 Q114 Q214 Q314
(%)
0123456789
10111213
Q113 Q213 Q313 Q413 Q114 Q214 Q314
(%)

25
Business segments and key statistics
26
Danske Bank Fact Book Q3 2014
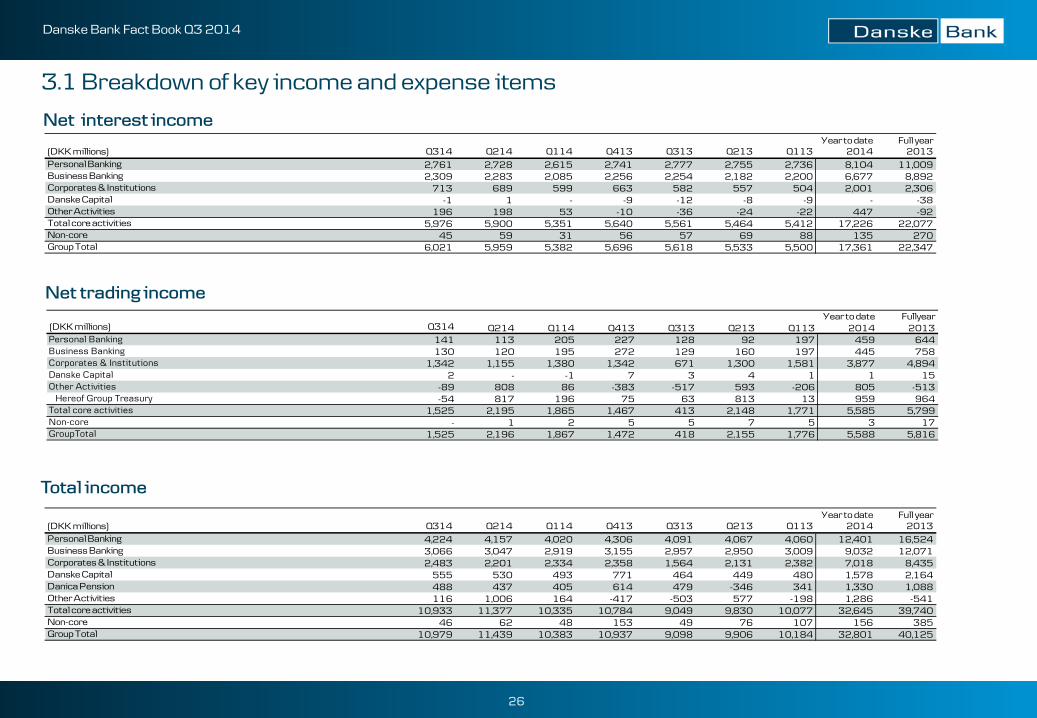
3.1 Breakdown of key income and expense items
Net interest income
Total income
Net trading income
Year to date Full year(DKK millions) Q314 Q214 Q114 Q413 Q313 Q213 Q113 2014 2013Personal Banking 2,761 2,728 2,615 2,741 2,777 2,755 2,736 8,104 11,009Business Banking 2,309 2,283 2,085 2,256 2,254 2,182 2,200 6,677 8,892Corporates & Institutions 713 689 599 663 582 557 504 2,001 2,306Danske Capital -1 1 - -9 -12 -8 -9 - -38Other Activities 196 198 53 -10 -36 -24 -22 447 -92Total core activities 5,976 5,900 5,351 5,640 5,561 5,464 5,412 17,226 22,077Non-core 45 59 31 56 57 69 88 135 270Group Total 6,021 5,959 5,382 5,696 5,618 5,533 5,500 17,361 22,347
Year to date Fullyear(DKK millions) Q314 Q214 Q114 Q413 Q313 Q213 Q113 2014 2013Personal Banking 141 113 205 227 128 92 197 459 644Business Banking 130 120 195 272 129 160 197 445 758Corporates & Institutions 1,342 1,155 1,380 1,342 671 1,300 1,581 3,877 4,894Danske Capital 2 - -1 7 3 4 1 1 15Other Activities -89 808 86 -383 -517 593 -206 805 -513 Hereof Group Treasury -54 817 196 75 63 813 13 959 964Total core activities 1,525 2,195 1,865 1,467 413 2,148 1,771 5,585 5,799Non-core - 1 2 5 5 7 5 3 17GroupTotal 1,525 2,196 1,867 1,472 418 2,155 1,776 5,588 5,816
Year to date Full year(DKK millions) Q314 Q214 Q114 Q413 Q313 Q213 Q113 2014 2013Personal Banking 4,224 4,157 4,020 4,306 4,091 4,067 4,060 12,401 16,524Business Banking 3,066 3,047 2,919 3,155 2,957 2,950 3,009 9,032 12,071Corporates & Institutions 2,483 2,201 2,334 2,358 1,564 2,131 2,382 7,018 8,435Danske Capital 555 530 493 771 464 449 480 1,578 2,164Danica Pension 488 437 405 614 479 -346 341 1,330 1,088Other Activities 116 1,006 164 -417 -503 577 -198 1,286 -541Total core activities 10,933 11,377 10,335 10,784 9,049 9,830 10,077 32,645 39,740Non-core 46 62 48 153 49 76 107 156 385Group Total 10,979 11,439 10,383 10,937 9,098 9,906 10,184 32,801 40,125
27
Danske Bank Fact Book Q3 2014
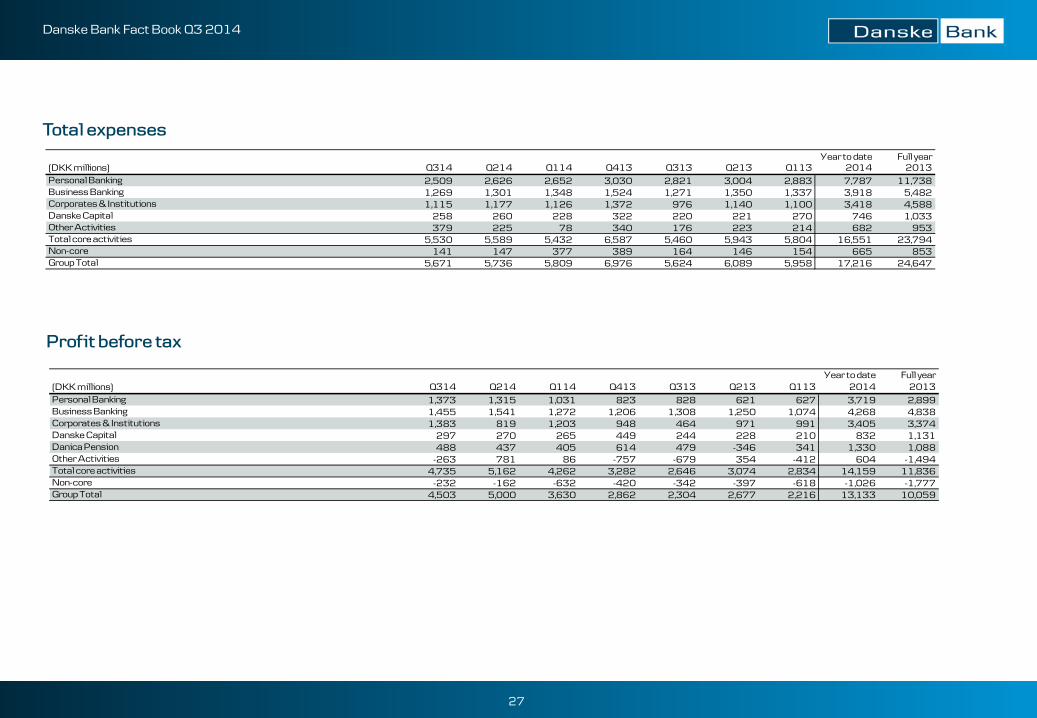
Total expenses
Profit before tax
Year to date Full year(DKK millions) Q314 Q214 Q114 Q413 Q313 Q213 Q113 2014 2013Personal Banking 2,509 2,626 2,652 3,030 2,821 3,004 2,883 7,787 11,738Business Banking 1,269 1,301 1,348 1,524 1,271 1,350 1,337 3,918 5,482Corporates & Institutions 1,115 1,177 1,126 1,372 976 1,140 1,100 3,418 4,588Danske Capital 258 260 228 322 220 221 270 746 1,033Other Activities 379 225 78 340 176 223 214 682 953Total core activities 5,530 5,589 5,432 6,587 5,460 5,943 5,804 16,551 23,794Non-core 141 147 377 389 164 146 154 665 853Group Total 5,671 5,736 5,809 6,976 5,624 6,089 5,958 17,216 24,647
Year to date Full year(DKK millions) Q314 Q214 Q114 Q413 Q313 Q213 Q113 2014 2013Personal Banking 1,373 1,315 1,031 823 828 621 627 3,719 2,899Business Banking 1,455 1,541 1,272 1,206 1,308 1,250 1,074 4,268 4,838Corporates & Institutions 1,383 819 1,203 948 464 971 991 3,405 3,374Danske Capital 297 270 265 449 244 228 210 832 1,131Danica Pension 488 437 405 614 479 -346 341 1,330 1,088Other Activities -263 781 86 -757 -679 354 -412 604 -1,494Total core activities 4,735 5,162 4,262 3,282 2,646 3,074 2,834 14,159 11,836Non-core -232 -162 -632 -420 -342 -397 -618 -1,026 -1,777Group Total 4,503 5,000 3,630 2,862 2,304 2,677 2,216 13,133 10,059
28
Danske Bank Fact Book Q3 2014
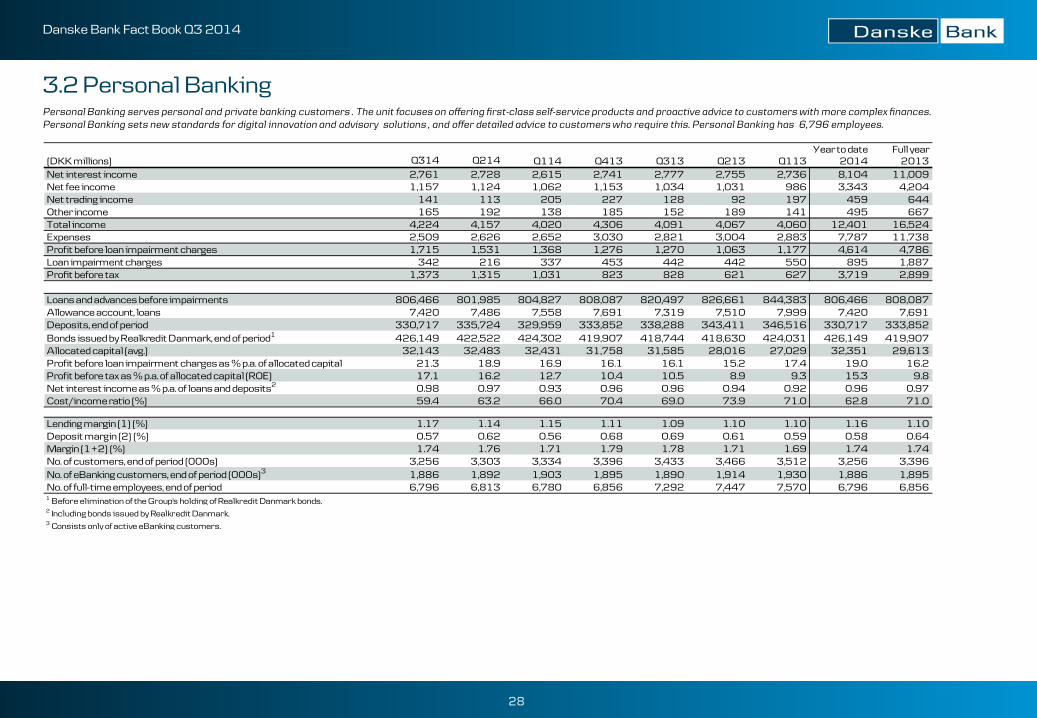
3.2 Personal Banking Personal Banking serves personal and private banking customers . The unit focuses on offering first-class self-service products and proactive advice to customers with more complex finances. Personal Banking sets new standards for digital innovation and advisory solutions , and offer detailed advice to customers who require this. Personal Banking has 6,796 employees.
Year to date Full year(DKK millions) Q314 Q214 Q114 Q413 Q313 Q213 Q113 2014 2013Net interest income 2,761 2,728 2,615 2,741 2,777 2,755 2,736 8,104 11,009Net fee income 1,157 1,124 1,062 1,153 1,034 1,031 986 3,343 4,204Net trading income 141 113 205 227 128 92 197 459 644Other income 165 192 138 185 152 189 141 495 667Total income 4,224 4,157 4,020 4,306 4,091 4,067 4,060 12,401 16,524Expenses 2,509 2,626 2,652 3,030 2,821 3,004 2,883 7,787 11,738Profit before loan impairment charges 1,715 1,531 1,368 1,276 1,270 1,063 1,177 4,614 4,786Loan impairment charges 342 216 337 453 442 442 550 895 1,887Profit before tax 1,373 1,315 1,031 823 828 621 627 3,719 2,899
Loans and advances before impairments 806,466 801,985 804,827 808,087 820,497 826,661 844,383 806,466 808,087Allowance account, loans 7,420 7,486 7,558 7,691 7,319 7,510 7,999 7,420 7,691Deposits, end of period 330,717 335,724 329,959 333,852 338,288 343,411 346,516 330,717 333,852Bonds issued by Realkredit Danmark, end of period1 426,149 422,522 424,302 419,907 418,744 418,630 424,031 426,149 419,907Allocated capital (avg.) 32,143 32,483 32,431 31,758 31,585 28,016 27,029 32,351 29,613Profit before loan impairment charges as % p.a. of allocated capital 21.3 18.9 16.9 16.1 16.1 15.2 17.4 19.0 16.2Profit before tax as % p.a. of allocated capital (ROE) 17.1 16.2 12.7 10.4 10.5 8.9 9.3 15.3 9.8Net interest income as % p.a. of loans and deposits2 0.98 0.97 0.93 0.96 0.96 0.94 0.92 0.96 0.97Cost/income ratio (%) 59.4 63.2 66.0 70.4 69.0 73.9 71.0 62.8 71.0
Lending margin (1) (%) 1.17 1.14 1.15 1.11 1.09 1.10 1.10 1.16 1.10Deposit margin (2) (%) 0.57 0.62 0.56 0.68 0.69 0.61 0.59 0.58 0.64Margin (1+2) (%) 1.74 1.76 1.71 1.79 1.78 1.71 1.69 1.74 1.74No. of customers, end of period (000s) 3,256 3,303 3,334 3,396 3,433 3,466 3,512 3,256 3,396No. of eBanking customers, end of period (000s)3 1,886 1,892 1,903 1,895 1,890 1,914 1,930 1,886 1,895No. of full-time employees, end of period 6,796 6,813 6,780 6,856 7,292 7,447 7,570 6,796 6,8561 Before elimination of the Group's holding of Realkredit Danmark bonds.2 Including bonds issued by Realkredit Danmark.3 Consists only of active eBanking customers.
29
Danske Bank Fact Book Q3 2014
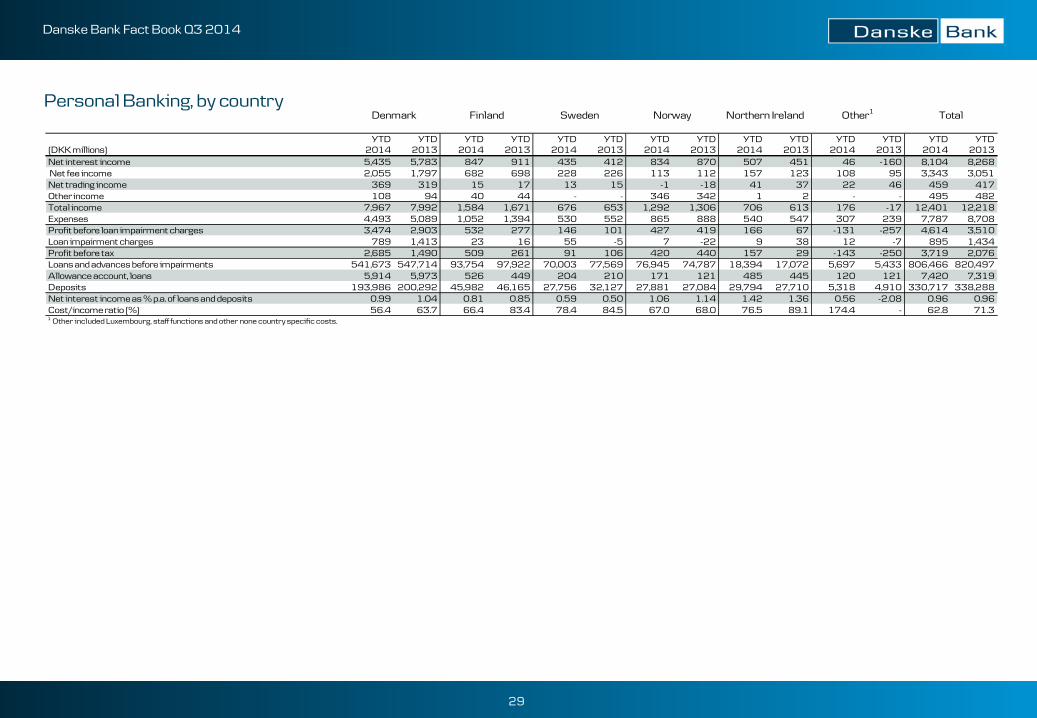
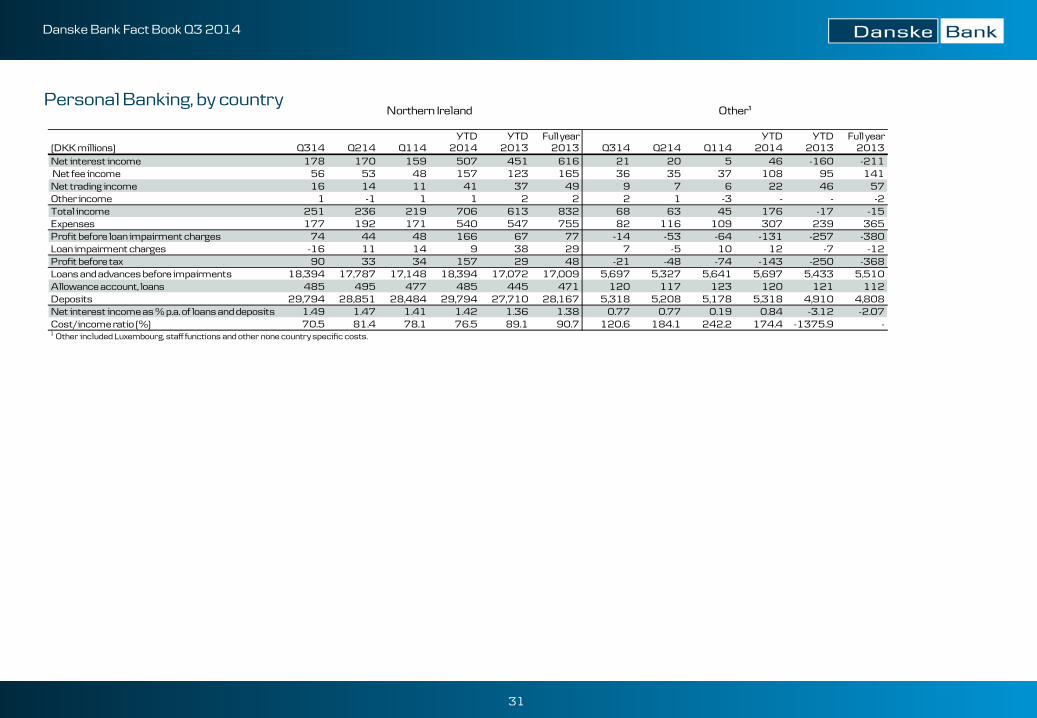
YTD YTD YTD YTD YTD YTD YTD YTD YTD YTD YTD YTD YTD YTD(DKK millions) 2014 2013 2014 2013 2014 2013 2014 2013 2014 2013 2014 2013 2014 2013Net interest income 5,435 5,783 847 911 435 412 834 870 507 451 46 -160 8,104 8,268Net fee income 2,055 1,797 682 698 228 226 113 112 157 123 108 95 3,343 3,051Net trading income 369 319 15 17 13 15 -1 -18 41 37 22 46 459 417Other income 108 94 40 44 - - 346 342 1 2 - - 495 482Total income 7,967 7,992 1,584 1,671 676 653 1,292 1,306 706 613 176 -17 12,401 12,218Expenses 4,493 5,089 1,052 1,394 530 552 865 888 540 547 307 239 7,787 8,708Profit before loan impairment charges 3,474 2,903 532 277 146 101 427 419 166 67 -131 -257 4,614 3,510Loan impairment charges 789 1,413 23 16 55 -5 7 -22 9 38 12 -7 895 1,434Profit before tax 2,685 1,490 509 261 91 106 420 440 157 29 -143 -250 3,719 2,076Loans and advances before impairments 541,673 547,714 93,754 97,922 70,003 77,569 76,945 74,787 18,394 17,072 5,697 5,433 806,466 820,497Allowance account, loans 5,914 5,973 526 449 204 210 171 121 485 445 120 121 7,420 7,319Deposits 193,986 200,292 45,982 46,165 27,756 32,127 27,881 27,084 29,794 27,710 5,318 4,910 330,717 338,288Net interest income as % p.a. of loans and deposits 0.99 1.04 0.81 0.85 0.59 0.50 1.06 1.14 1.42 1.36 0.56 -2.08 0.96 0.96Cost/income ratio (%) 56.4 63.7 66.4 83.4 78.4 84.5 67.0 68.0 76.5 89.1 174.4 - 62.8 71.31 Other included Luxembourg, staff functions and other none country specific costs.
TotalOther1Finland Sweden Norway Northern IrelandDenmarkPersonal Banking, by country
30
Danske Bank Fact Book Q3 2014
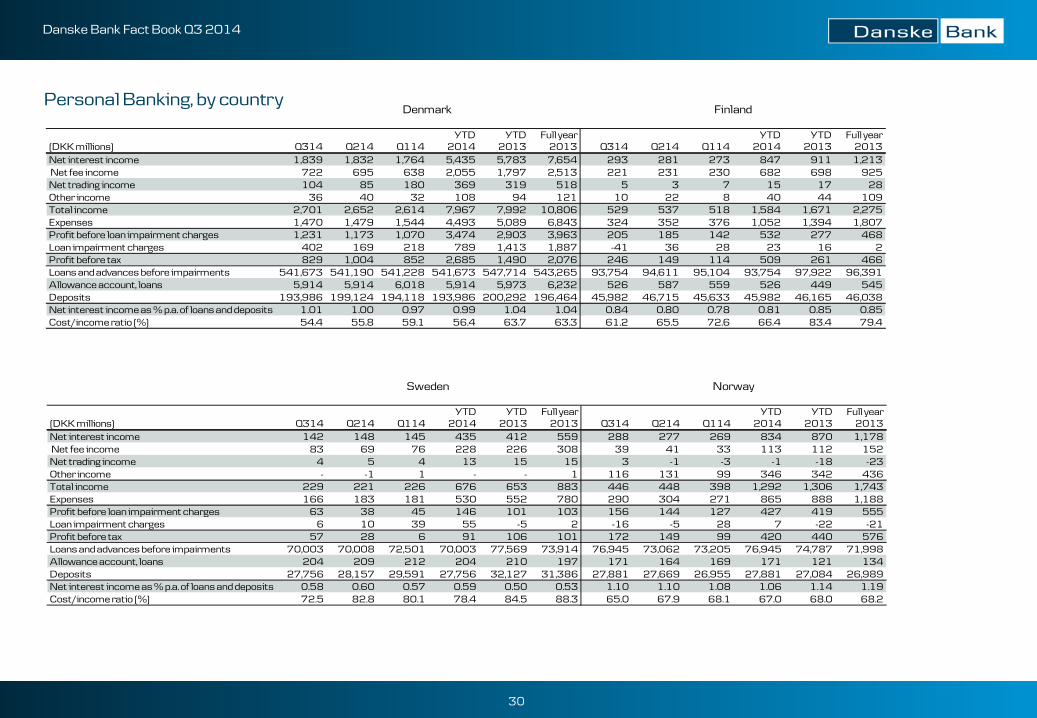
YTD YTD Full year YTD YTD Full year(DKK millions) Q314 Q214 Q114 2014 2013 2013 Q314 Q214 Q114 2014 2013 2013Net interest income 142 148 145 435 412 559 288 277 269 834 870 1,178Net fee income 83 69 76 228 226 308 39 41 33 113 112 152Net trading income 4 5 4 13 15 15 3 -1 -3 -1 -18 -23Other income - -1 1 - - 1 116 131 99 346 342 436Total income 229 221 226 676 653 883 446 448 398 1,292 1,306 1,743Expenses 166 183 181 530 552 780 290 304 271 865 888 1,188Profit before loan impairment charges 63 38 45 146 101 103 156 144 127 427 419 555Loan impairment charges 6 10 39 55 -5 2 -16 -5 28 7 -22 -21Profit before tax 57 28 6 91 106 101 172 149 99 420 440 576Loans and advances before impairments 70,003 70,008 72,501 70,003 77,569 73,914 76,945 73,062 73,205 76,945 74,787 71,998Allowance account, loans 204 209 212 204 210 197 171 164 169 171 121 134Deposits 27,756 28,157 29,591 27,756 32,127 31,386 27,881 27,669 26,955 27,881 27,084 26,989Net interest income as % p.a. of loans and deposits 0.58 0.60 0.57 0.59 0.50 0.53 1.10 1.10 1.08 1.06 1.14 1.19Cost/income ratio (%) 72.5 82.8 80.1 78.4 84.5 88.3 65.0 67.9 68.1 67.0 68.0 68.2
Sweden Norway
YTD YTD Full year YTD YTD Full year(DKK millions) Q314 Q214 Q114 2014 2013 2013 Q314 Q214 Q114 2014 2013 2013Net interest income 1,839 1,832 1,764 5,435 5,783 7,654 293 281 273 847 911 1,213Net fee income 722 695 638 2,055 1,797 2,513 221 231 230 682 698 925Net trading income 104 85 180 369 319 518 5 3 7 15 17 28Other income 36 40 32 108 94 121 10 22 8 40 44 109Total income 2,701 2,652 2,614 7,967 7,992 10,806 529 537 518 1,584 1,671 2,275Expenses 1,470 1,479 1,544 4,493 5,089 6,843 324 352 376 1,052 1,394 1,807Profit before loan impairment charges 1,231 1,173 1,070 3,474 2,903 3,963 205 185 142 532 277 468Loan impairment charges 402 169 218 789 1,413 1,887 -41 36 28 23 16 2Profit before tax 829 1,004 852 2,685 1,490 2,076 246 149 114 509 261 466Loans and advances before impairments 541,673 541,190 541,228 541,673 547,714 543,265 93,754 94,611 95,104 93,754 97,922 96,391Allowance account, loans 5,914 5,914 6,018 5,914 5,973 6,232 526 587 559 526 449 545Deposits 193,986 199,124 194,118 193,986 200,292 196,464 45,982 46,715 45,633 45,982 46,165 46,038Net interest income as % p.a. of loans and deposits 1.01 1.00 0.97 0.99 1.04 1.04 0.84 0.80 0.78 0.81 0.85 0.85Cost/income ratio (%) 54.4 55.8 59.1 56.4 63.7 63.3 61.2 65.5 72.6 66.4 83.4 79.4
Denmark FinlandPersonal Banking, by country
31
Danske Bank Fact Book Q3 2014
YTD YTD Full year YTD YTD Full year(DKK millions) Q314 Q214 Q114 2014 2013 2013 Q314 Q214 Q114 2014 2013 2013Net interest income 178 170 159 507 451 616 21 20 5 46 -160 -211Net fee income 56 53 48 157 123 165 36 35 37 108 95 141Net trading income 16 14 11 41 37 49 9 7 6 22 46 57Other income 1 -1 1 1 2 2 2 1 -3 - - -2Total income 251 236 219 706 613 832 68 63 45 176 -17 -15Expenses 177 192 171 540 547 755 82 116 109 307 239 365Profit before loan impairment charges 74 44 48 166 67 77 -14 -53 -64 -131 -257 -380Loan impairment charges -16 11 14 9 38 29 7 -5 10 12 -7 -12Profit before tax 90 33 34 157 29 48 -21 -48 -74 -143 -250 -368Loans and advances before impairments 18,394 17,787 17,148 18,394 17,072 17,009 5,697 5,327 5,641 5,697 5,433 5,510Allowance account, loans 485 495 477 485 445 471 120 117 123 120 121 112Deposits 29,794 28,851 28,484 29,794 27,710 28,167 5,318 5,208 5,178 5,318 4,910 4,808Net interest income as % p.a. of loans and deposits 1.49 1.47 1.41 1.42 1.36 1.38 0.77 0.77 0.19 0.84 -3.12 -2.07Cost/income ratio (%) 70.5 81.4 78.1 76.5 89.1 90.7 120.6 184.1 242.2 174.4 -1375.9 -1 Other included Luxembourg, staff functions and other none country specific costs.
Other¹Northern IrelandPersonal Banking, by country
32
Danske Bank Fact Book Q3 2014
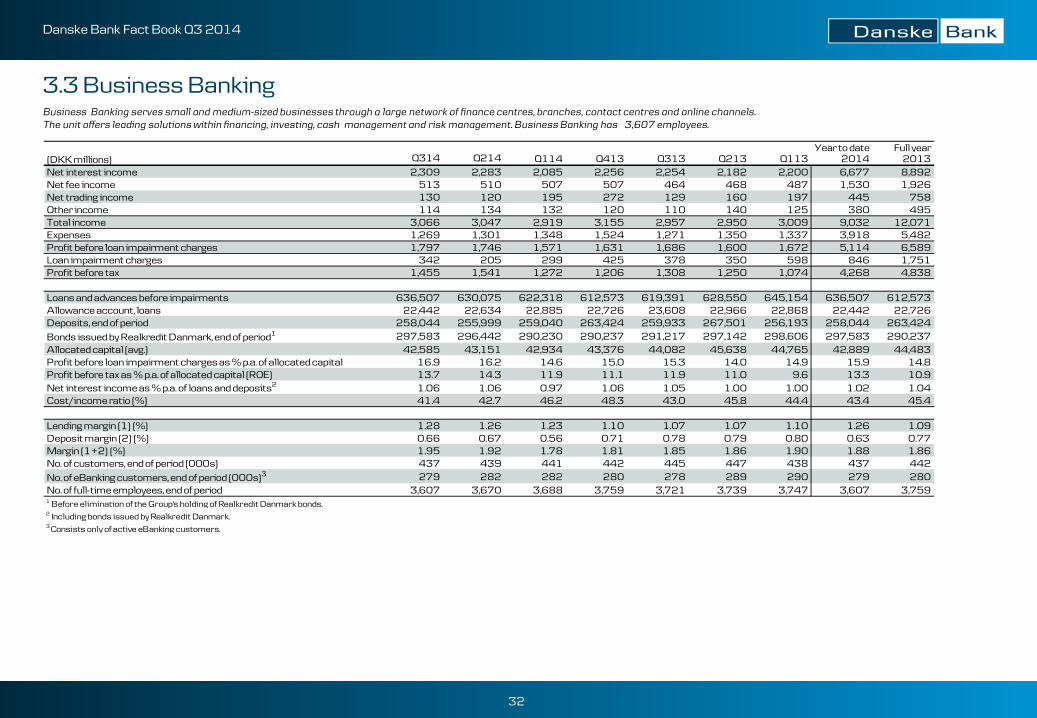
3.3 Business Banking Business Banking serves small and medium-sized businesses through a large network of finance centres, branches, contact centres and online channels. The unit offers leading solutions within financing, investing, cash management and risk management. Business Banking has 3,607 employees.
Year to date Full year(DKK millions) Q314 Q214 Q114 Q413 Q313 Q213 Q113 2014 2013Net interest income 2,309 2,283 2,085 2,256 2,254 2,182 2,200 6,677 8,892Net fee income 513 510 507 507 464 468 487 1,530 1,926Net trading income 130 120 195 272 129 160 197 445 758Other income 114 134 132 120 110 140 125 380 495Total income 3,066 3,047 2,919 3,155 2,957 2,950 3,009 9,032 12,071Expenses 1,269 1,301 1,348 1,524 1,271 1,350 1,337 3,918 5,482Profit before loan impairment charges 1,797 1,746 1,571 1,631 1,686 1,600 1,672 5,114 6,589Loan impairment charges 342 205 299 425 378 350 598 846 1,751Profit before tax 1,455 1,541 1,272 1,206 1,308 1,250 1,074 4,268 4,838
Loans and advances before impairments 636,507 630,075 622,318 612,573 619,391 628,550 645,154 636,507 612,573Allowance account, loans 22,442 22,634 22,885 22,726 23,608 22,966 22,868 22,442 22,726Deposits, end of period 258,044 255,999 259,040 263,424 259,933 267,501 256,193 258,044 263,424Bonds issued by Realkredit Danmark, end of period1 297,583 296,442 290,230 290,237 291,217 297,142 298,606 297,583 290,237Allocated capital (avg.) 42,585 43,151 42,934 43,376 44,082 45,638 44,765 42,889 44,483Profit before loan impairment charges as % p.a. of allocated capital 16.9 16.2 14.6 15.0 15.3 14.0 14.9 15.9 14.8Profit before tax as % p.a. of allocated capital (ROE) 13.7 14.3 11.9 11.1 11.9 11.0 9.6 13.3 10.9Net interest income as % p.a. of loans and deposits2 1.06 1.06 0.97 1.06 1.05 1.00 1.00 1.02 1.04Cost/income ratio (%) 41.4 42.7 46.2 48.3 43.0 45.8 44.4 43.4 45.4
Lending margin (1) (%) 1.28 1.26 1.23 1.10 1.07 1.07 1.10 1.26 1.09Deposit margin (2) (%) 0.66 0.67 0.56 0.71 0.78 0.79 0.80 0.63 0.77Margin (1+2) (%) 1.95 1.92 1.78 1.81 1.85 1.86 1.90 1.88 1.86No. of customers, end of period (000s) 437 439 441 442 445 447 438 437 442No. of eBanking customers, end of period (000s)3 279 282 282 280 278 289 290 279 280No. of full-time employees, end of period 3,607 3,670 3,688 3,759 3,721 3,739 3,747 3,607 3,7591 Before elimination of the Group's holding of Realkredit Danmark bonds.2 Including bonds issued by Realkredit Danmark.3 Consists only of active eBanking customers.
33
Danske Bank Fact Book Q3 2014
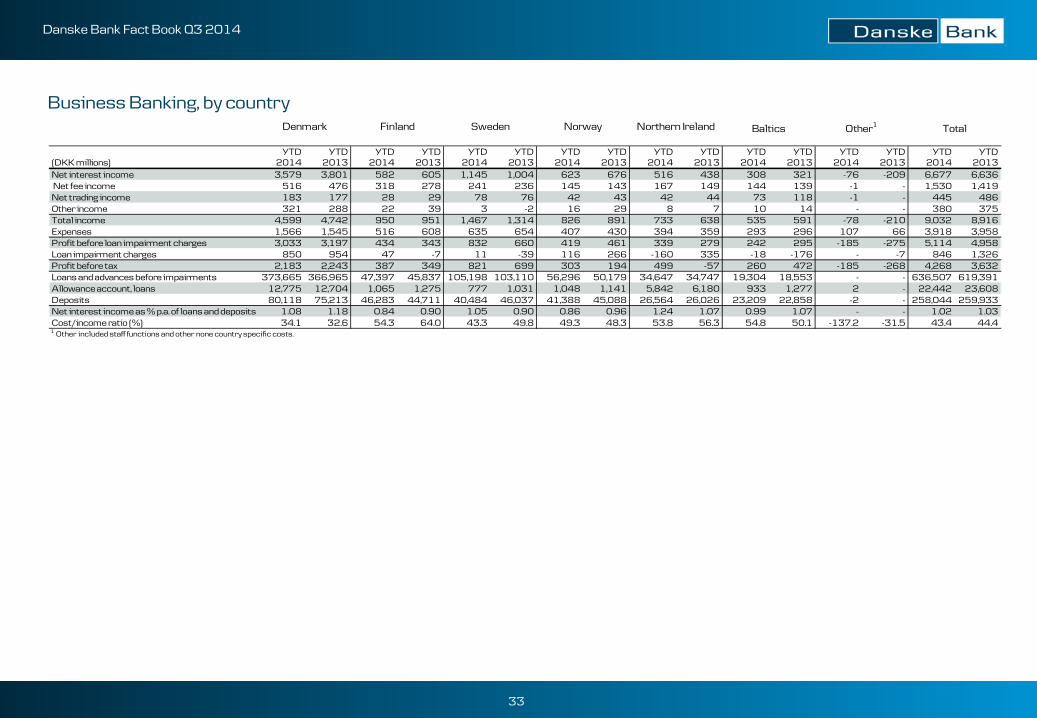
YTD YTD YTD YTD YTD YTD YTD YTD YTD YTD YTD YTD YTD YTD YTD YTD(DKK millions) 2014 2013 2014 2013 2014 2013 2014 2013 2014 2013 2014 2013 2014 2013 2014 2013Net interest income 3,579 3,801 582 605 1,145 1,004 623 676 516 438 308 321 -76 -209 6,677 6,636Net fee income 516 476 318 278 241 236 145 143 167 149 144 139 -1 - 1,530 1,419Net trading income 183 177 28 29 78 76 42 43 42 44 73 118 -1 - 445 486Other income 321 288 22 39 3 -2 16 29 8 7 10 14 - - 380 375Total income 4,599 4,742 950 951 1,467 1,314 826 891 733 638 535 591 -78 -210 9,032 8,916Expenses 1,566 1,545 516 608 635 654 407 430 394 359 293 296 107 66 3,918 3,958Profit before loan impairment charges 3,033 3,197 434 343 832 660 419 461 339 279 242 295 -185 -275 5,114 4,958Loan impairment charges 850 954 47 -7 11 -39 116 266 -160 335 -18 -176 - -7 846 1,326Profit before tax 2,183 2,243 387 349 821 699 303 194 499 -57 260 472 -185 -268 4,268 3,632Loans and advances before impairments 373,665 366,965 47,397 45,837 105,198 103,110 56,296 50,179 34,647 34,747 19,304 18,553 - - 636,507 619,391Allowance account, loans 12,775 12,704 1,065 1,275 777 1,031 1,048 1,141 5,842 6,180 933 1,277 2 - 22,442 23,608Deposits 80,118 75,213 46,283 44,711 40,484 46,037 41,388 45,088 26,564 26,026 23,209 22,858 -2 - 258,044 259,933Net interest income as % p.a. of loans and deposits 1.08 1.18 0.84 0.90 1.05 0.90 0.86 0.96 1.24 1.07 0.99 1.07 - - 1.02 1.03Cost/income ratio (%) 34.1 32.6 54.3 64.0 43.3 49.8 49.3 48.3 53.8 56.3 54.8 50.1 -137.2 -31.5 43.4 44.41 Other included staff functions and other none country specific costs.
TotalDenmark Finland Sweden Norway Northern Ireland Baltics Other1
Business Banking, by country
34
Danske Bank Fact Book Q3 2014
Business Banking, by country
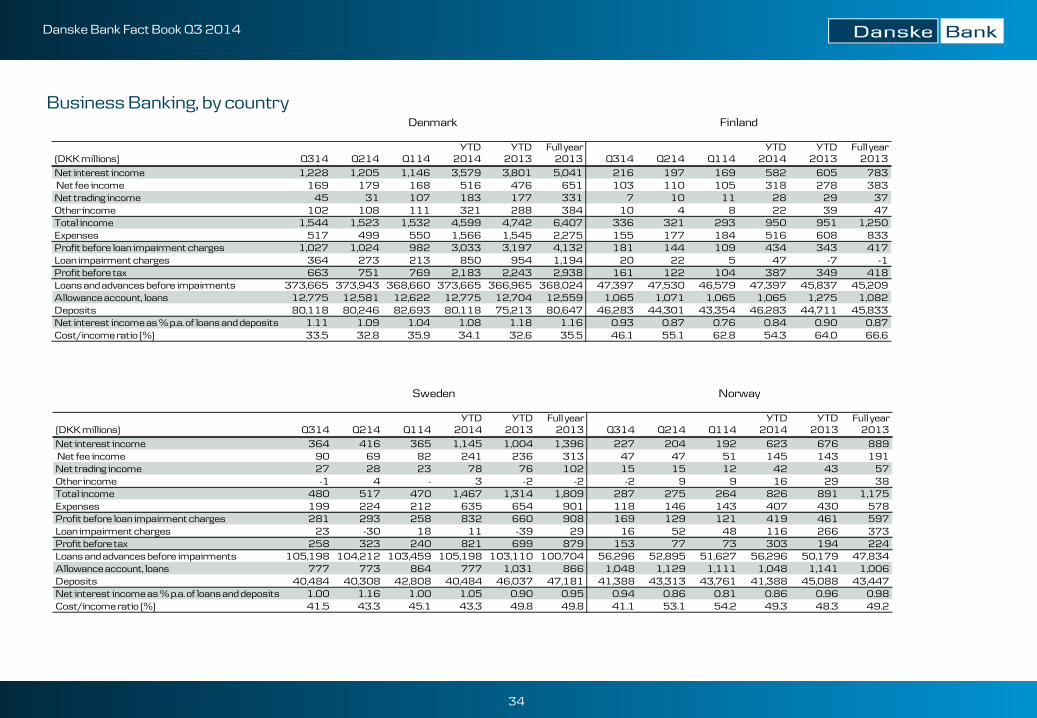
YTD YTD Full year YTD YTD Full year(DKK millions) Q314 Q214 Q114 2014 2013 2013 Q314 Q214 Q114 2014 2013 2013Net interest income 1,228 1,205 1,146 3,579 3,801 5,041 216 197 169 582 605 783Net fee income 169 179 168 516 476 651 103 110 105 318 278 383Net trading income 45 31 107 183 177 331 7 10 11 28 29 37Other income 102 108 111 321 288 384 10 4 8 22 39 47Total income 1,544 1,523 1,532 4,599 4,742 6,407 336 321 293 950 951 1,250Expenses 517 499 550 1,566 1,545 2,275 155 177 184 516 608 833Profit before loan impairment charges 1,027 1,024 982 3,033 3,197 4,132 181 144 109 434 343 417Loan impairment charges 364 273 213 850 954 1,194 20 22 5 47 -7 -1Profit before tax 663 751 769 2,183 2,243 2,938 161 122 104 387 349 418Loans and advances before impairments 373,665 373,943 368,660 373,665 366,965 368,024 47,397 47,530 46,579 47,397 45,837 45,209Allowance account, loans 12,775 12,581 12,622 12,775 12,704 12,559 1,065 1,071 1,065 1,065 1,275 1,082Deposits 80,118 80,246 82,693 80,118 75,213 80,647 46,283 44,301 43,354 46,283 44,711 45,833Net interest income as % p.a. of loans and deposits 1.11 1.09 1.04 1.08 1.18 1.16 0.93 0.87 0.76 0.84 0.90 0.87Cost/income ratio (%) 33.5 32.8 35.9 34.1 32.6 35.5 46.1 55.1 62.8 54.3 64.0 66.6
FinlandDenmark
YTD YTD Full year YTD YTD Full year(DKK millions) Q314 Q214 Q114 2014 2013 2013 Q314 Q214 Q114 2014 2013 2013Net interest income 364 416 365 1,145 1,004 1,396 227 204 192 623 676 889Net fee income 90 69 82 241 236 313 47 47 51 145 143 191Net trading income 27 28 23 78 76 102 15 15 12 42 43 57Other income -1 4 - 3 -2 -2 -2 9 9 16 29 38Total income 480 517 470 1,467 1,314 1,809 287 275 264 826 891 1,175Expenses 199 224 212 635 654 901 118 146 143 407 430 578Profit before loan impairment charges 281 293 258 832 660 908 169 129 121 419 461 597Loan impairment charges 23 -30 18 11 -39 29 16 52 48 116 266 373Profit before tax 258 323 240 821 699 879 153 77 73 303 194 224Loans and advances before impairments 105,198 104,212 103,459 105,198 103,110 100,704 56,296 52,895 51,627 56,296 50,179 47,834Allowance account, loans 777 773 864 777 1,031 866 1,048 1,129 1,111 1,048 1,141 1,006Deposits 40,484 40,308 42,808 40,484 46,037 47,181 41,388 43,313 43,761 41,388 45,088 43,447Net interest income as % p.a. of loans and deposits 1.00 1.16 1.00 1.05 0.90 0.95 0.94 0.86 0.81 0.86 0.96 0.98Cost/income ratio (%) 41.5 43.3 45.1 43.3 49.8 49.8 41.1 53.1 54.2 49.3 48.3 49.2
Sweden Norway
35
Danske Bank Fact Book Q3 2014
Business Banking, by country
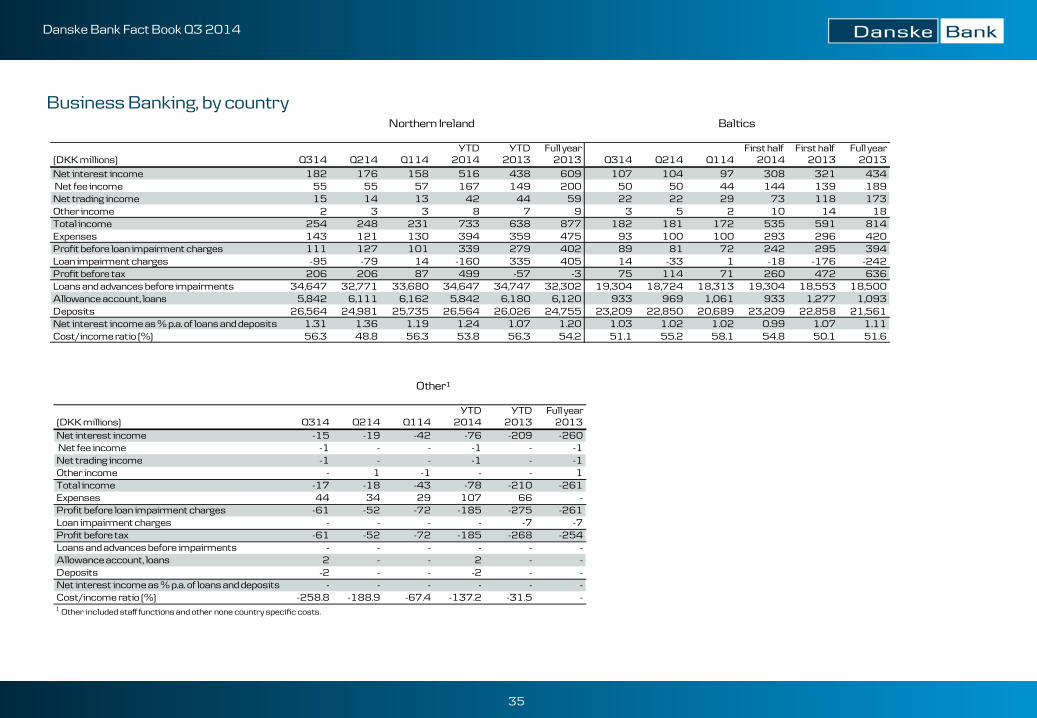
YTD YTD Full year First half First half Full year(DKK millions) Q314 Q214 Q114 2014 2013 2013 Q314 Q214 Q114 2014 2013 2013Net interest income 182 176 158 516 438 609 107 104 97 308 321 434Net fee income 55 55 57 167 149 200 50 50 44 144 139 189Net trading income 15 14 13 42 44 59 22 22 29 73 118 173Other income 2 3 3 8 7 9 3 5 2 10 14 18Total income 254 248 231 733 638 877 182 181 172 535 591 814Expenses 143 121 130 394 359 475 93 100 100 293 296 420Profit before loan impairment charges 111 127 101 339 279 402 89 81 72 242 295 394Loan impairment charges -95 -79 14 -160 335 405 14 -33 1 -18 -176 -242Profit before tax 206 206 87 499 -57 -3 75 114 71 260 472 636Loans and advances before impairments 34,647 32,771 33,680 34,647 34,747 32,302 19,304 18,724 18,313 19,304 18,553 18,500Allowance account, loans 5,842 6,111 6,162 5,842 6,180 6,120 933 969 1,061 933 1,277 1,093Deposits 26,564 24,981 25,735 26,564 26,026 24,755 23,209 22,850 20,689 23,209 22,858 21,561Net interest income as % p.a. of loans and deposits 1.31 1.36 1.19 1.24 1.07 1.20 1.03 1.02 1.02 0.99 1.07 1.11Cost/income ratio (%) 56.3 48.8 56.3 53.8 56.3 54.2 51.1 55.2 58.1 54.8 50.1 51.6
BalticsNorthern Ireland
YTD YTD Full year(DKK millions) Q314 Q214 Q114 2014 2013 2013Net interest income -15 -19 -42 -76 -209 -260Net fee income -1 - - -1 - -1Net trading income -1 - - -1 - -1Other income - 1 -1 - - 1Total income -17 -18 -43 -78 -210 -261Expenses 44 34 29 107 66 -Profit before loan impairment charges -61 -52 -72 -185 -275 -261Loan impairment charges - - - - -7 -7Profit before tax -61 -52 -72 -185 -268 -254Loans and advances before impairments - - - - - -Allowance account, loans 2 - - 2 - -Deposits -2 - - -2 - -Net interest income as % p.a. of loans and deposits - - - - - -Cost/income ratio (%) -258.8 -188.9 -67.4 -137.2 -31.5 -1 Other included staff functions and other none country specific costs.
Other¹
36
Danske Bank Fact Book Q3 2014
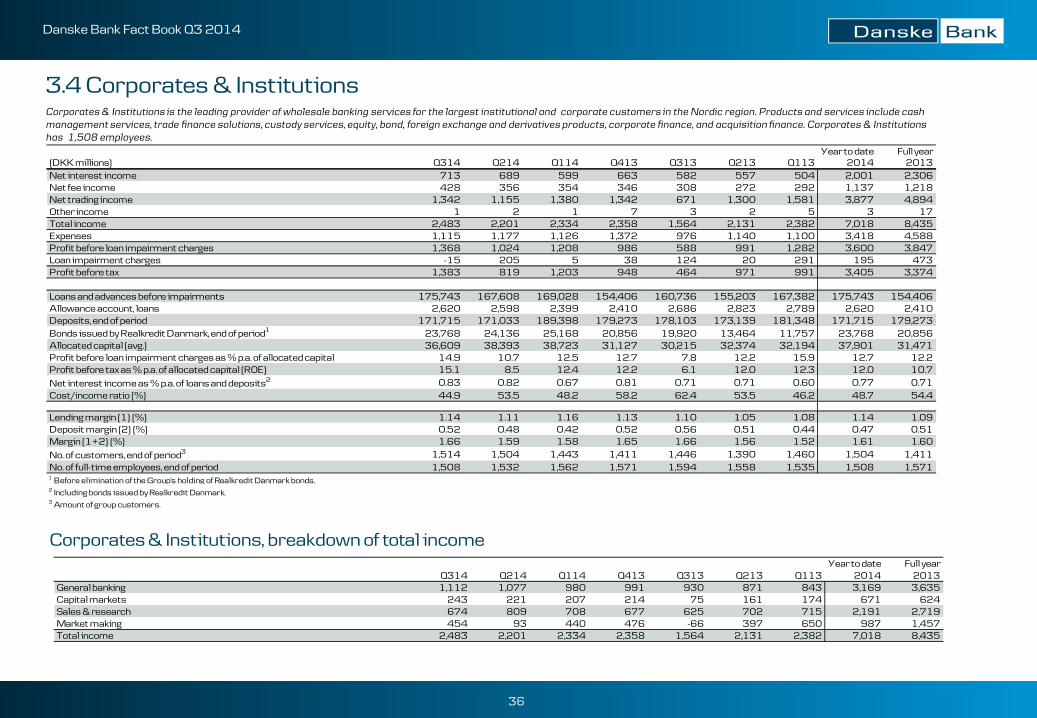
3.4 Corporates & Institutions Corporates & Institutions is the leading provider of wholesale banking services for the largest institutional and corporate customers in the Nordic region. Products and services include cash management services, trade finance solutions, custody services, equity, bond, foreign exchange and derivatives products, corporate finance, and acquisition finance. Corporates & Institutions has 1,508 employees.
Corporates & Institutions, breakdown of total income
Year to date Full year(DKK millions) Q314 Q214 Q114 Q413 Q313 Q213 Q113 2014 2013Net interest income 713 689 599 663 582 557 504 2,001 2,306Net fee income 428 356 354 346 308 272 292 1,137 1,218Net trading income 1,342 1,155 1,380 1,342 671 1,300 1,581 3,877 4,894Other income 1 2 1 7 3 2 5 3 17Total income 2,483 2,201 2,334 2,358 1,564 2,131 2,382 7,018 8,435Expenses 1,115 1,177 1,126 1,372 976 1,140 1,100 3,418 4,588Profit before loan impairment charges 1,368 1,024 1,208 986 588 991 1,282 3,600 3,847Loan impairment charges -15 205 5 38 124 20 291 195 473Profit before tax 1,383 819 1,203 948 464 971 991 3,405 3,374
Loans and advances before impairments 175,743 167,608 169,028 154,406 160,736 155,203 167,382 175,743 154,406Allowance account, loans 2,620 2,598 2,399 2,410 2,686 2,823 2,789 2,620 2,410Deposits, end of period 171,715 171,033 189,398 179,273 178,103 173,139 181,348 171,715 179,273Bonds issued by Realkredit Danmark, end of period1 23,768 24,136 25,168 20,856 19,920 13,464 11,757 23,768 20,856Allocated capital (avg.) 36,609 38,393 38,723 31,127 30,215 32,374 32,194 37,901 31,471Profit before loan impairment charges as % p.a. of allocated capital 14.9 10.7 12.5 12.7 7.8 12.2 15.9 12.7 12.2Profit before tax as % p.a. of allocated capital (ROE) 15.1 8.5 12.4 12.2 6.1 12.0 12.3 12.0 10.7Net interest income as % p.a. of loans and deposits2 0.83 0.82 0.67 0.81 0.71 0.71 0.60 0.77 0.71Cost/income ratio (%) 44.9 53.5 48.2 58.2 62.4 53.5 46.2 48.7 54.4
Lending margin (1) (%) 1.14 1.11 1.16 1.13 1.10 1.05 1.08 1.14 1.09Deposit margin (2) (%) 0.52 0.48 0.42 0.52 0.56 0.51 0.44 0.47 0.51Margin (1+2) (%) 1.66 1.59 1.58 1.65 1.66 1.56 1.52 1.61 1.60No. of customers, end of period3 1,514 1,504 1,443 1,411 1,446 1,390 1,460 1,504 1,411No. of full-time employees, end of period 1,508 1,532 1,562 1,571 1,594 1,558 1,535 1,508 1,5711 Before elimination of the Group's holding of Realkredit Danmark bonds.2 Including bonds issued by Realkredit Danmark.3 Amount of group customers.
Year to date Full yearQ314 Q214 Q114 Q413 Q313 Q213 Q113 2014 2013
General banking 1,112 1,077 980 991 930 871 843 3,169 3,635Capital markets 243 221 207 214 75 161 174 671 624Sales & research 674 809 708 677 625 702 715 2,191 2,719Market making 454 93 440 476 -66 397 650 987 1,457Total income 2,483 2,201 2,334 2,358 1,564 2,131 2,382 7,018 8,435
37
Danske Bank Fact Book Q3 2014
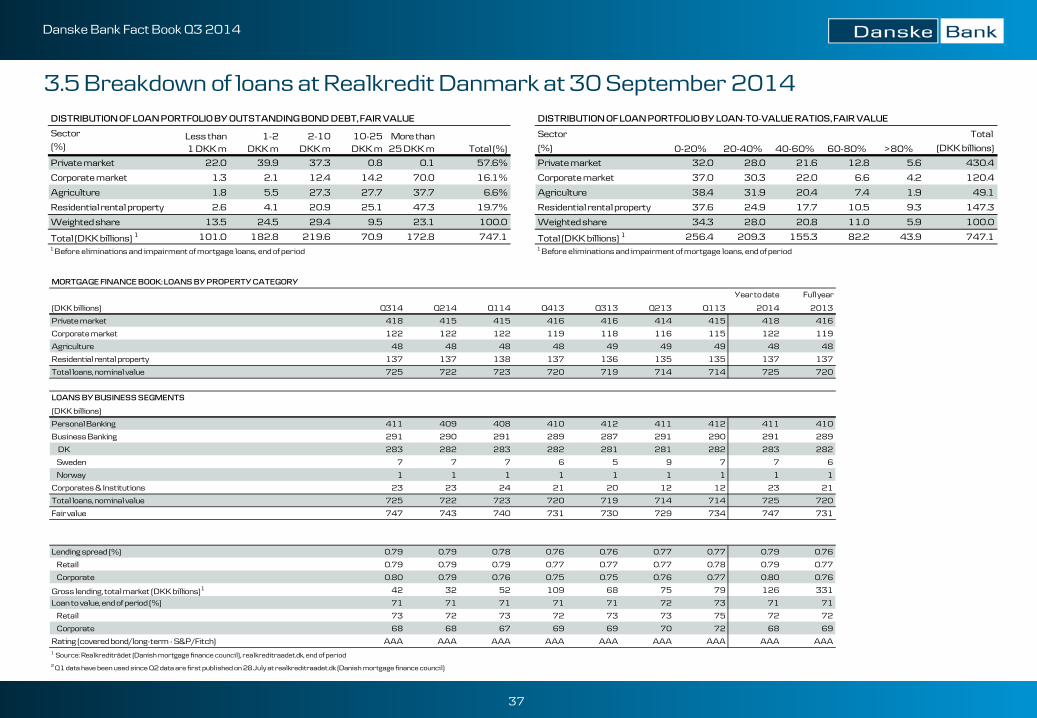
3.5 Breakdown of loans at Realkredit Danmark at 30 September 2014
MORTGAGE FINANCE BOOK: LOANS BY PROPERTY CATEGORY
Year to date Full year
(DKK billions) Q314 Q214 Q114 Q413 Q313 Q213 Q113 2014 2013
Private market 418 415 415 416 416 414 415 418 416
Corporate market 122 122 122 119 118 116 115 122 119
Agriculture 48 48 48 48 49 49 49 48 48
Residential rental property 137 137 138 137 136 135 135 137 137
Total loans, nominal value 725 722 723 720 719 714 714 725 720
LOANS BY BUSINESS SEGMENTS
(DKK billions)
Personal Banking 411 409 408 410 412 411 412 411 410
Business Banking 291 290 291 289 287 291 290 291 289
DK 283 282 283 282 281 281 282 283 282
Sweden 7 7 7 6 5 9 7 7 6
Norway 1 1 1 1 1 1 1 1 1
Corporates & Institutions 23 23 24 21 20 12 12 23 21
Total loans, nominal value 725 722 723 720 719 714 714 725 720
Fair value 747 743 740 731 730 729 734 747 731
Lending spread (%) 0.79 0.79 0.78 0.76 0.76 0.77 0.77 0.79 0.76
Retail 0.79 0.79 0.79 0.77 0.77 0.77 0.78 0.79 0.77
Corporate 0.80 0.79 0.76 0.75 0.75 0.76 0.77 0.80 0.76
Gross lending, total market (DKK billions)1 42 32 52 109 68 75 79 126 331
Loan to value, end of period (%) 71 71 71 71 71 72 73 71 71
Retail 73 72 73 72 73 73 75 72 72
Corporate 68 68 67 69 69 70 72 68 69
Rating (covered bond/long-term - S&P/Fitch) AAA AAA AAA AAA AAA AAA AAA AAA AAA1 Source: Realkreditrådet (Danish mortgage finance council), realkreditraadet.dk, end of period2 Q1 data have been used since Q2 data are first published on 28 July at realkreditraadet.dk (Danish mortgage finance council)
DISTRIBUTION OF LOAN PORTFOLIO BY OUTSTANDING BOND DEBT, FAIR VALUE
Sector(%)
Private market 22.0 39.9 37.3 0.8 0.1 57.6%
Corporate market 1.3 2.1 12.4 14.2 70.0 16.1%
Agriculture 1.8 5.5 27.3 27.7 37.7 6.6%
Residential rental property 2.6 4.1 20.9 25.1 47.3 19.7%
Weighted share 13.5 24.5 29.4 9.5 23.1 100.0
Total (DKK billions) 1 101.0 182.8 219.6 70.9 172.8 747.11 Before eliminations and impairment of mortgage loans, end of period
Total (%)Less than 1 DKK m
1-2 DKK m
2-10 DKK m
10-25 DKK m
More than 25 DKK m
DISTRIBUTION OF LOAN PORTFOLIO BY LOAN-TO-VALUE RATIOS, FAIR VALUE
Sector Total
(%) (DKK billions)
Private market 32.0 28.0 21.6 12.8 5.6 430.4
Corporate market 37.0 30.3 22.0 6.6 4.2 120.4
Agriculture 38.4 31.9 20.4 7.4 1.9 49.1
Residential rental property 37.6 24.9 17.7 10.5 9.3 147.3
Weighted share 34.3 28.0 20.8 11.0 5.9 100.0
Total (DKK billions) 1 256.4 209.3 155.3 82.2 43.9 747.11 Before eliminations and impairment of mortgage loans, end of period
0-20% 20-40% 40-60% 60-80% >80%
38
Danske Bank Fact Book Q3 2014
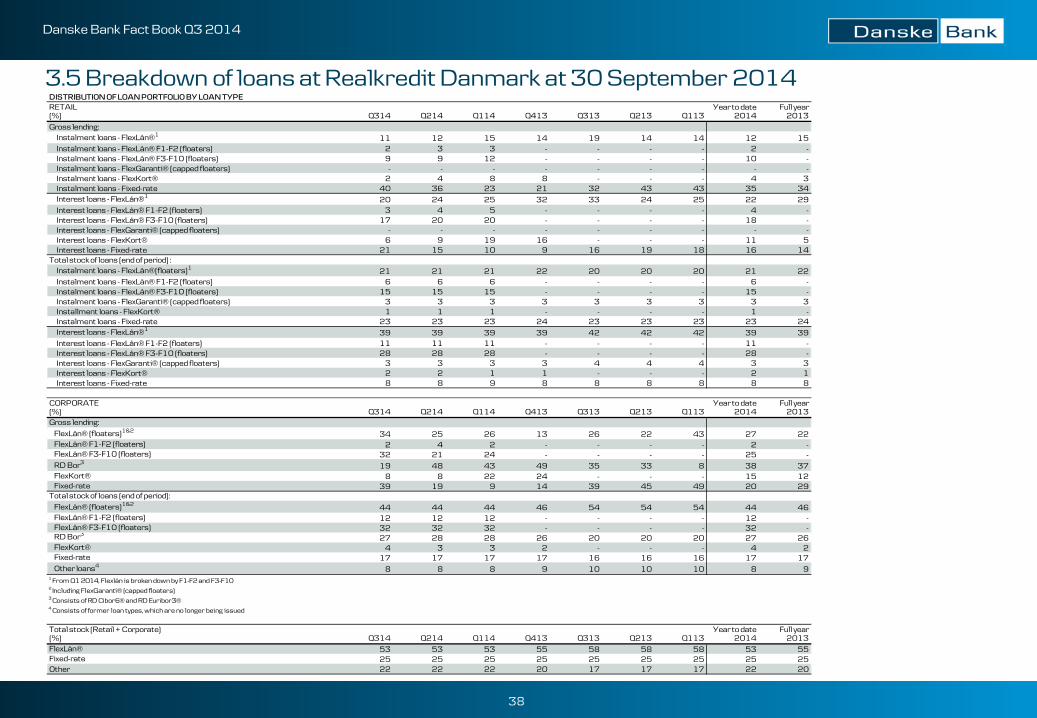
3.5 Breakdown of loans at Realkredit Danmark at 30 September 2014
DISTRIBUTION OF LOAN PORTFOLIO BY LOAN TYPERETAIL Year to date Full year(%) Q314 Q214 Q114 Q413 Q313 Q213 Q113 2014 2013Gross lending: Instalment loans - FlexLån®1 11 12 15 14 19 14 14 12 15 Instalment loans - FlexLån® F1-F2 (floaters) 2 3 3 - - - - 2 - Instalment loans - FlexLån® F3-F10 (floaters) 9 9 12 - - - - 10 - Instalment loans - FlexGaranti® (capped floaters) - - - - - - - - - Instalment loans - FlexKort® 2 4 8 8 - - - 4 3 Instalment loans - Fixed-rate 40 36 23 21 32 43 43 35 34 Interest loans - FlexLån®1 20 24 25 32 33 24 25 22 29 Interest loans - FlexLån® F1-F2 (floaters) 3 4 5 - - - - 4 - Interest loans - FlexLån® F3-F10 (floaters) 17 20 20 - - - - 18 - Interest loans - FlexGaranti® (capped floaters) - - - - - - - - - Interest loans - FlexKort® 6 9 19 16 - - - 11 5 Interest loans - Fixed-rate 21 15 10 9 16 19 18 16 14Total stock of loans (end of period) : Instalment loans - FlexLån®(floaters)1 21 21 21 22 20 20 20 21 22 Instalment loans - FlexLån® F1-F2 (floaters) 6 6 6 - - - - 6 - Instalment loans - FlexLån® F3-F10 (floaters) 15 15 15 - - - - 15 - Instalment loans - FlexGaranti® (capped floaters) 3 3 3 3 3 3 3 3 3 Installment loans - FlexKort® 1 1 1 - - - - 1 - Instalment loans - Fixed-rate 23 23 23 24 23 23 23 23 24 Interest loans - FlexLån®1 39 39 39 39 42 42 42 39 39 Interest loans - FlexLån® F1-F2 (floaters) 11 11 11 - - - - 11 - Interest loans - FlexLån® F3-F10 (floaters) 28 28 28 - - - - 28 - Interest loans - FlexGaranti® (capped floaters) 3 3 3 3 4 4 4 3 3 Interest loans - FlexKort® 2 2 1 1 - - - 2 1 Interest loans - Fixed-rate 8 8 9 8 8 8 8 8 8
CORPORATE Year to date Full year(%) Q314 Q214 Q114 Q413 Q313 Q213 Q113 2014 2013Gross lending: FlexLån® (floaters)1&2 34 25 26 13 26 22 43 27 22 FlexLån® F1-F2 (floaters) 2 4 2 - - - - 2 - FlexLån® F3-F10 (floaters) 32 21 24 - - - - 25 - RD Bor3 19 48 43 49 35 33 8 38 37 FlexKort® 8 8 22 24 - - - 15 12 Fixed-rate 39 19 9 14 39 45 49 20 29Total stock of loans (end of period): FlexLån® (floaters)1&2 44 44 44 46 54 54 54 44 46 FlexLån® F1-F2 (floaters) 12 12 12 - - - - 12 - FlexLån® F3-F10 (floaters) 32 32 32 - - - - 32 - RD Bor3
27 28 28 26 20 20 20 27 26 FlexKort® 4 3 3 2 - - - 4 2 Fixed-rate 17 17 17 17 16 16 16 17 17 Other loans4 8 8 8 9 10 10 10 8 91 From Q1 2014, Flexlån is broken down by F1-F2 and F3-F102 Including FlexGaranti® (capped floaters)3 Consists of RD Cibor6® and RD Euribor3®4 Consists of former loan types, which are no longer being issued
Total stock (Retail + Corporate) Year to date Full year(%) Q314 Q214 Q114 Q413 Q313 Q213 Q113 2014 2013FlexLån® 53 53 53 55 58 58 58 53 55Fixed-rate 25 25 25 25 25 25 25 25 25Other 22 22 22 20 17 17 17 22 20
39
sdfzsdfzsdfzdf Danske Bank Fact Book Q3 2014
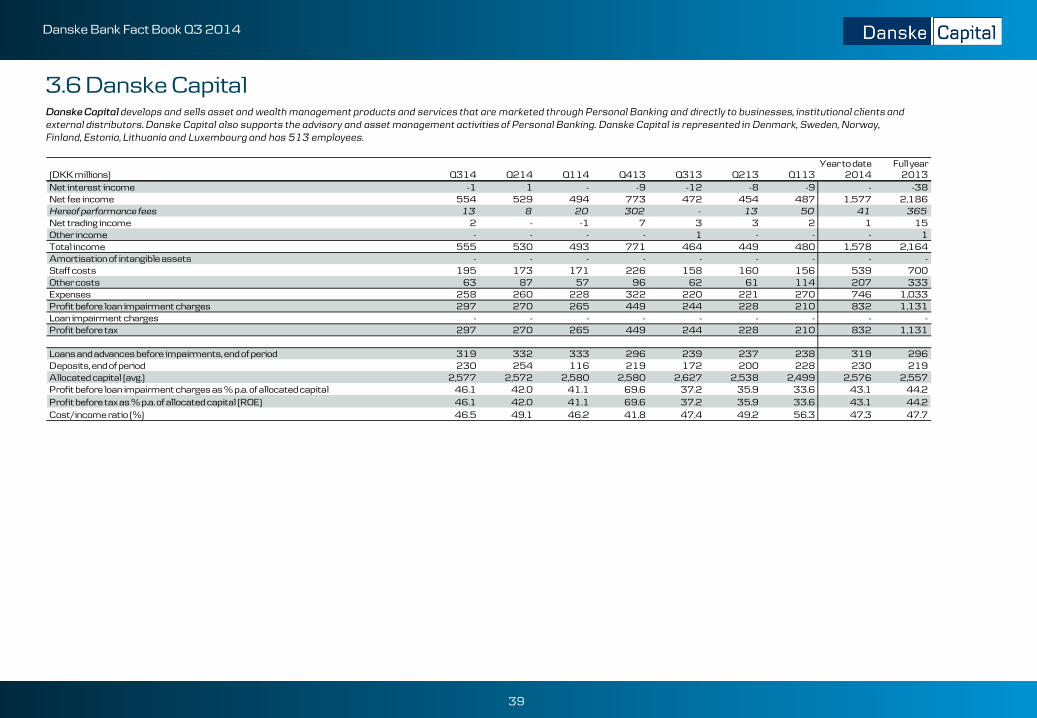
3.6 Danske Capital Danske Capital develops and sells asset and wealth management products and services that are marketed through Personal Banking and directly to businesses, institutional clients and external distributors. Danske Capital also supports the advisory and asset management activities of Personal Banking. Danske Capital is represented in Denmark, Sweden, Norway, Finland, Estonia, Lithuania and Luxembourg and has 513 employees.
Year to date Full year(DKK millions) Q314 Q214 Q114 Q413 Q313 Q213 Q113 2014 2013Net interest income -1 1 - -9 -12 -8 -9 - -38Net fee income 554 529 494 773 472 454 487 1,577 2,186Hereof performance fees 13 8 20 302 - 13 50 41 365Net trading income 2 - -1 7 3 3 2 1 15Other income - - - - 1 - - - 1Total income 555 530 493 771 464 449 480 1,578 2,164Amortisation of intangible assets - - - - - - - - -Staff costs 195 173 171 226 158 160 156 539 700Other costs 63 87 57 96 62 61 114 207 333Expenses 258 260 228 322 220 221 270 746 1,033Profit before loan impairment charges 297 270 265 449 244 228 210 832 1,131Loan impairment charges - - - - - - - - -Profit before tax 297 270 265 449 244 228 210 832 1,131
Loans and advances before impairments, end of period 319 332 333 296 239 237 238 319 296Deposits, end of period 230 254 116 219 172 200 228 230 219Allocated capital (avg.) 2,577 2,572 2,580 2,580 2,627 2,538 2,499 2,576 2,557Profit before loan impairment charges as % p.a. of allocated capital 46.1 42.0 41.1 69.6 37.2 35.9 33.6 43.1 44.2Profit before tax as % p.a. of allocated capital (ROE) 46.1 42.0 41.1 69.6 37.2 35.9 33.6 43.1 44.2Cost/income ratio (%) 46.5 49.1 46.2 41.8 47.4 49.2 56.3 47.3 47.7
40
sdfzsdfzsdfzdf Danske Bank Fact Book Q3 2014
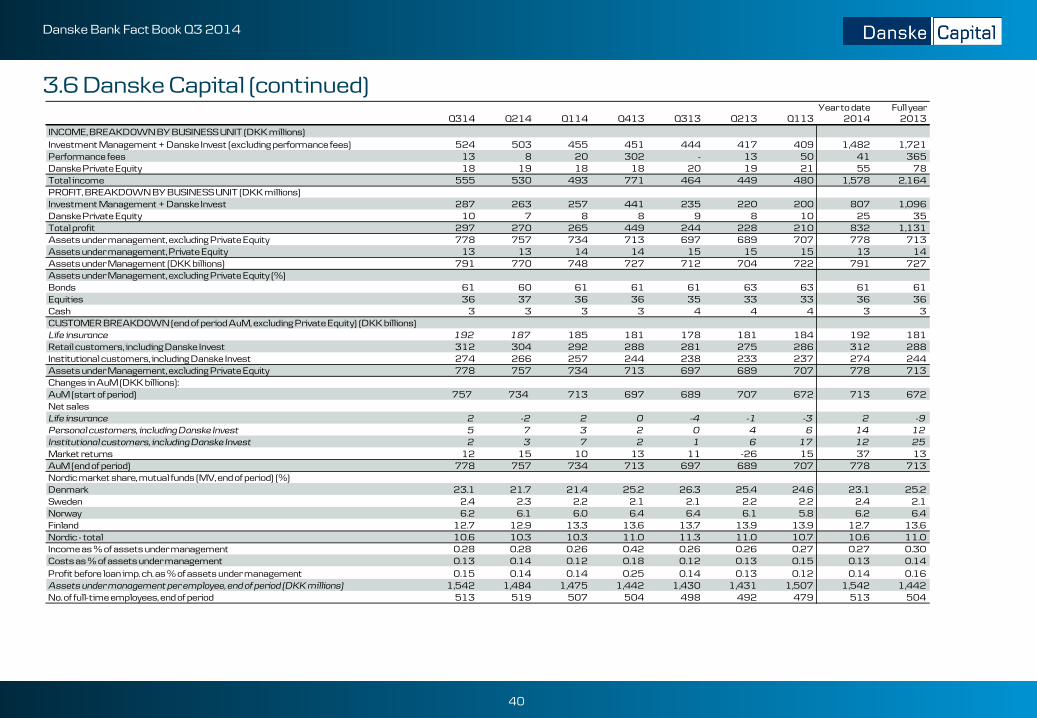
3.6 Danske Capital (continued)
Year to date Full yearQ314 Q214 Q114 Q413 Q313 Q213 Q113 2014 2013
INCOME, BREAKDOWN BY BUSINESS UNIT (DKK millions)Investment Management + Danske Invest (excluding performance fees) 524 503 455 451 444 417 409 1,482 1,721Performance fees 13 8 20 302 - 13 50 41 365Danske Private Equity 18 19 18 18 20 19 21 55 78Total income 555 530 493 771 464 449 480 1,578 2,164PROFIT, BREAKDOWN BY BUSINESS UNIT (DKK millions)Investment Management + Danske Invest 287 263 257 441 235 220 200 807 1,096Danske Private Equity 10 7 8 8 9 8 10 25 35Total profit 297 270 265 449 244 228 210 832 1,131Assets under management, excluding Private Equity 778 757 734 713 697 689 707 778 713Assets under management, Private Equity 13 13 14 14 15 15 15 13 14Assets under Management (DKK billions) 791 770 748 727 712 704 722 791 727Assets under Management, excluding Private Equity (%)Bonds 61 60 61 61 61 63 63 61 61Equities 36 37 36 36 35 33 33 36 36Cash 3 3 3 3 4 4 4 3 3CUSTOMER BREAKDOWN (end of period AuM, excluding Private Equity) (DKK billions)Life insurance 192 187 185 181 178 181 184 192 181Retail customers, including Danske Invest 312 304 292 288 281 275 286 312 288Institutional customers, including Danske Invest 274 266 257 244 238 233 237 274 244Assets under Management, excluding Private Equity 778 757 734 713 697 689 707 778 713Changes in AuM (DKK billions):AuM (start of period) 757 734 713 697 689 707 672 713 672Net salesLife insurance 2 -2 2 0 -4 -1 -3 2 -9Personal customers, including Danske Invest 5 7 3 2 0 4 6 14 12Institutional customers, including Danske Invest 2 3 7 2 1 6 17 12 25Market returns 12 15 10 13 11 -26 15 37 13AuM (end of period) 778 757 734 713 697 689 707 778 713Nordic market share, mutual funds (MV, end of period) (%)Denmark 23.1 21.7 21.4 25.2 26.3 25.4 24.6 23.1 25.2Sweden 2.4 2.3 2.2 2.1 2.1 2.2 2.2 2.4 2.1Norway 6.2 6.1 6.0 6.4 6.4 6.1 5.8 6.2 6.4Finland 12.7 12.9 13.3 13.6 13.7 13.9 13.9 12.7 13.6Nordic - total 10.6 10.3 10.3 11.0 11.3 11.0 10.7 10.6 11.0Income as % of assets under management 0.28 0.28 0.26 0.42 0.26 0.26 0.27 0.27 0.30Costs as % of assets under management 0.13 0.14 0.12 0.18 0.12 0.13 0.15 0.13 0.14Profit before loan imp. ch. as % of assets under management 0.15 0.14 0.14 0.25 0.14 0.13 0.12 0.14 0.16Assets under management per employee, end of period (DKK millions) 1,542 1,484 1,475 1,442 1,430 1,431 1,507 1,542 1,442No. of full-time employees, end of period 513 519 507 504 498 492 479 513 504
41
sdfzsdfzsdfzdf Danske Bank Fact Book Q3 2014
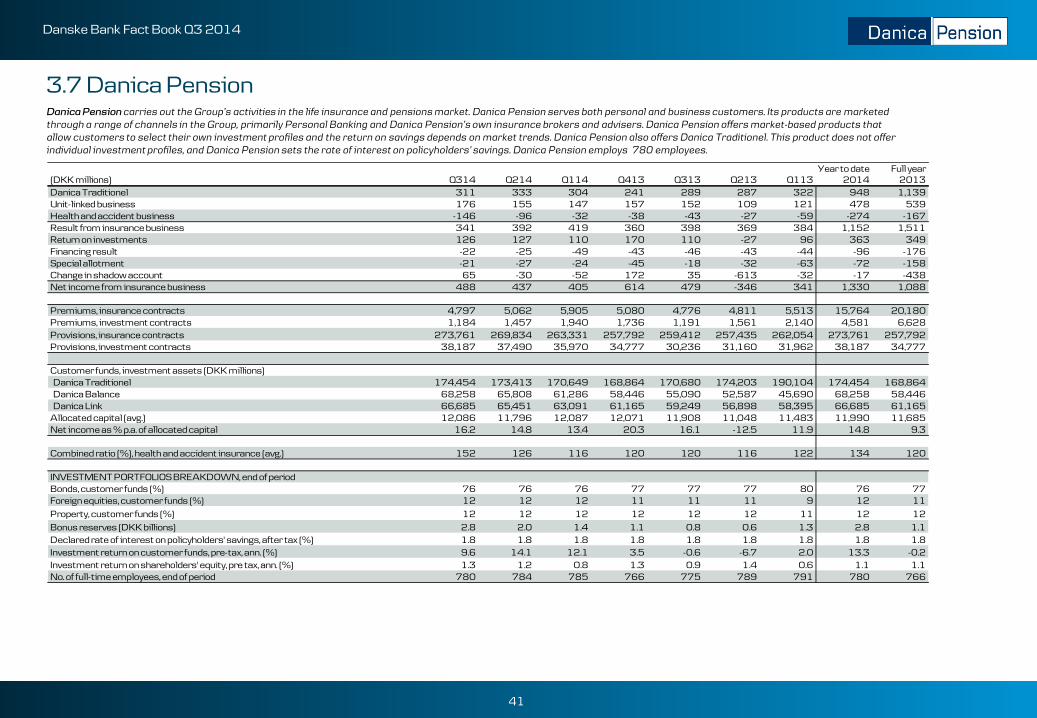
3.7 Danica Pension Danica Pension carries out the Group’s activities in the life insurance and pensions market. Danica Pension serves both personal and business customers. Its products are marketed through a range of channels in the Group, primarily Personal Banking and Danica Pension’s own insurance brokers and advisers. Danica Pension offers market-based products that allow customers to select their own investment profiles and the return on savings depends on market trends. Danica Pension also offers Danica Traditionel. This product does not offer individual investment profiles, and Danica Pension sets the rate of interest on policyholders’ savings. Danica Pension employs 780 employees.
Year to date Full year(DKK millions) Q314 Q214 Q114 Q413 Q313 Q213 Q113 2014 2013Danica Traditionel 311 333 304 241 289 287 322 948 1,139Unit-linked business 176 155 147 157 152 109 121 478 539Health and accident business -146 -96 -32 -38 -43 -27 -59 -274 -167Result from insurance business 341 392 419 360 398 369 384 1,152 1,511Return on investments 126 127 110 170 110 -27 96 363 349Financing result -22 -25 -49 -43 -46 -43 -44 -96 -176Special allotment -21 -27 -24 -45 -18 -32 -63 -72 -158Change in shadow account 65 -30 -52 172 35 -613 -32 -17 -438Net income from insurance business 488 437 405 614 479 -346 341 1,330 1,088
Premiums, insurance contracts 4,797 5,062 5,905 5,080 4,776 4,811 5,513 15,764 20,180Premiums, investment contracts 1,184 1,457 1,940 1,736 1,191 1,561 2,140 4,581 6,628Provisions, insurance contracts 273,761 269,834 263,331 257,792 259,412 257,435 262,054 273,761 257,792Provisions, investment contracts 38,187 37,490 35,970 34,777 30,236 31,160 31,962 38,187 34,777
Customer funds, investment assets (DKK millions) Danica Traditionel 174,454 173,413 170,649 168,864 170,680 174,203 190,104 174,454 168,864 Danica Balance 68,258 65,808 61,286 58,446 55,090 52,587 45,690 68,258 58,446 Danica Link 66,685 65,451 63,091 61,165 59,249 56,898 58,395 66,685 61,165Allocated capital (avg.) 12,086 11,796 12,087 12,071 11,908 11,048 11,483 11,990 11,685Net income as % p.a. of allocated capital 16.2 14.8 13.4 20.3 16.1 -12.5 11.9 14.8 9.3
Combined ratio (%), health and accident insurance (avg.) 152 126 116 120 120 116 122 134 120
INVESTMENT PORTFOLIOS BREAKDOWN, end of periodBonds, customer funds (%) 76 76 76 77 77 77 80 76 77Foreign equities, customer funds (%) 12 12 12 11 11 11 9 12 11Property, customer funds (%) 12 12 12 12 12 12 11 12 12Bonus reserves (DKK billions) 2.8 2.0 1.4 1.1 0.8 0.6 1.3 2.8 1.1Declared rate of interest on policyholders' savings, after tax (%) 1.8 1.8 1.8 1.8 1.8 1.8 1.8 1.8 1.8Investment return on customer funds, pre-tax, ann. (%) 9.6 14.1 12.1 3.5 -0.6 -6.7 2.0 13.3 -0.2Investment return on shareholders' equity, pre tax, ann. (%) 1.3 1.2 0.8 1.3 0.9 1.4 0.6 1.1 1.1No. of full-time employees, end of period 780 784 785 766 775 789 791 780 766
42
Danske Bank Fact Book Q3 2014
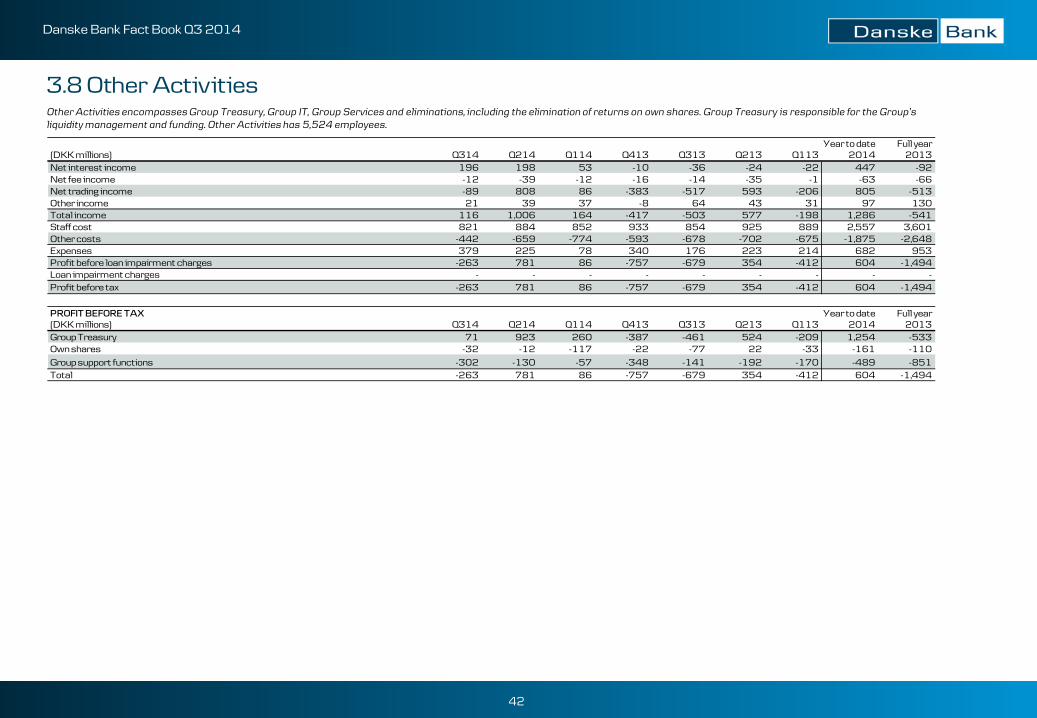
3.8 Other Activities Other Activities encompasses Group Treasury, Group IT, Group Services and eliminations, including the elimination of returns on own shares. Group Treasury is responsible for the Group’s liquidity management and funding. Other Activities has 5,524 employees.
Year to date Full year(DKK millions) Q314 Q214 Q114 Q413 Q313 Q213 Q113 2014 2013Net interest income 196 198 53 -10 -36 -24 -22 447 -92Net fee income -12 -39 -12 -16 -14 -35 -1 -63 -66Net trading income -89 808 86 -383 -517 593 -206 805 -513Other income 21 39 37 -8 64 43 31 97 130Total income 116 1,006 164 -417 -503 577 -198 1,286 -541Staff cost 821 884 852 933 854 925 889 2,557 3,601Other costs -442 -659 -774 -593 -678 -702 -675 -1,875 -2,648Expenses 379 225 78 340 176 223 214 682 953Profit before loan impairment charges -263 781 86 -757 -679 354 -412 604 -1,494Loan impairment charges - - - - - - - - -Profit before tax -263 781 86 -757 -679 354 -412 604 -1,494
PROFIT BEFORE TAX Year to date Full year(DKK millions) Q314 Q214 Q114 Q413 Q313 Q213 Q113 2014 2013Group Treasury 71 923 260 -387 -461 524 -209 1,254 -533Own shares -32 -12 -117 -22 -77 22 -33 -161 -110Group support functions -302 -130 -57 -348 -141 -192 -170 -489 -851Total -263 781 86 -757 -679 354 -412 604 -1,494
43
Danske Bank Fact Book Q3 2014
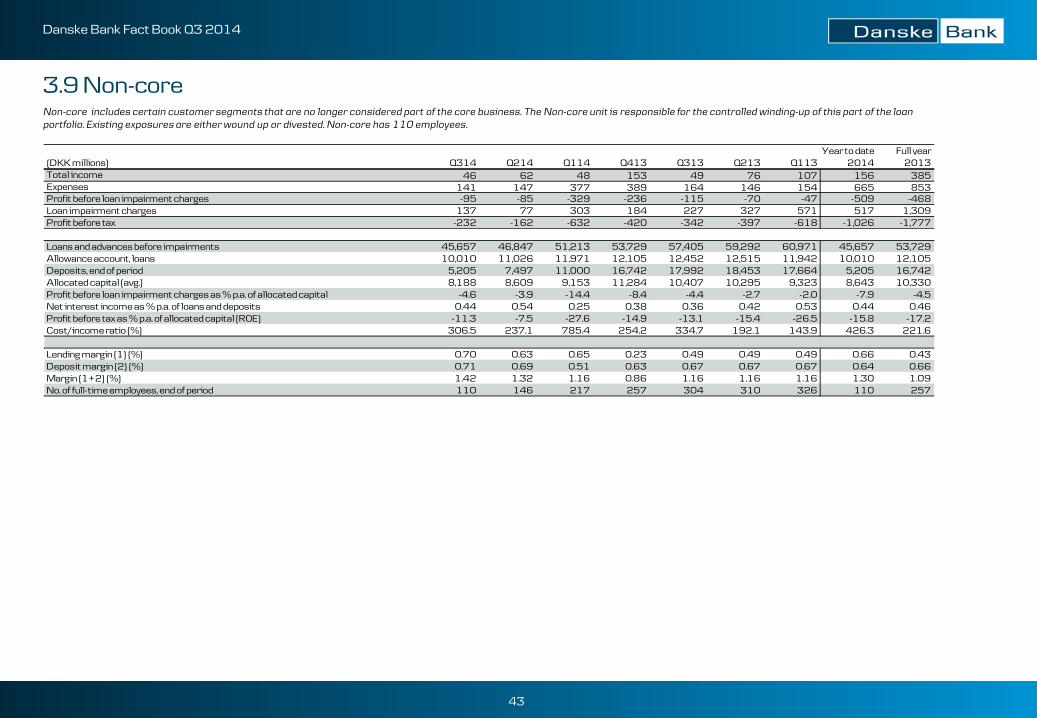
3.9 Non-core Non-core includes certain customer segments that are no longer considered part of the core business. The Non-core unit is responsible for the controlled winding-up of this part of the loan portfolio. Existing exposures are either wound up or divested. Non-core has 110 employees.
Year to date Full year(DKK millions) Q314 Q214 Q114 Q413 Q313 Q213 Q113 2014 2013Total income 46 62 48 153 49 76 107 156 385Expenses 141 147 377 389 164 146 154 665 853Profit before loan impairment charges -95 -85 -329 -236 -115 -70 -47 -509 -468Loan impairment charges 137 77 303 184 227 327 571 517 1,309Profit before tax -232 -162 -632 -420 -342 -397 -618 -1,026 -1,777
Loans and advances before impairments 45,657 46,847 51,213 53,729 57,405 59,292 60,971 45,657 53,729Allowance account, loans 10,010 11,026 11,971 12,105 12,452 12,515 11,942 10,010 12,105Deposits, end of period 5,205 7,497 11,000 16,742 17,992 18,453 17,664 5,205 16,742Allocated capital (avg.) 8,188 8,609 9,153 11,284 10,407 10,295 9,323 8,643 10,330Profit before loan impairment charges as % p.a. of allocated capital -4.6 -3.9 -14.4 -8.4 -4.4 -2.7 -2.0 -7.9 -4.5Net interest income as % p.a. of loans and deposits 0.44 0.54 0.25 0.38 0.36 0.42 0.53 0.44 0.46Profit before tax as % p.a. of allocated capital (ROE) -11.3 -7.5 -27.6 -14.9 -13.1 -15.4 -26.5 -15.8 -17.2Cost/income ratio (%) 306.5 237.1 785.4 254.2 334.7 192.1 143.9 426.3 221.6
Lending margin (1) (%) 0.70 0.63 0.65 0.23 0.49 0.49 0.49 0.66 0.43Deposit margin (2) (%) 0.71 0.69 0.51 0.63 0.67 0.67 0.67 0.64 0.66Margin (1+2) (%) 1.42 1.32 1.16 0.86 1.16 1.16 1.16 1.30 1.09No. of full-time employees, end of period 110 146 217 257 304 310 326 110 257
44
Danske Bank Fact Book Q3 2014
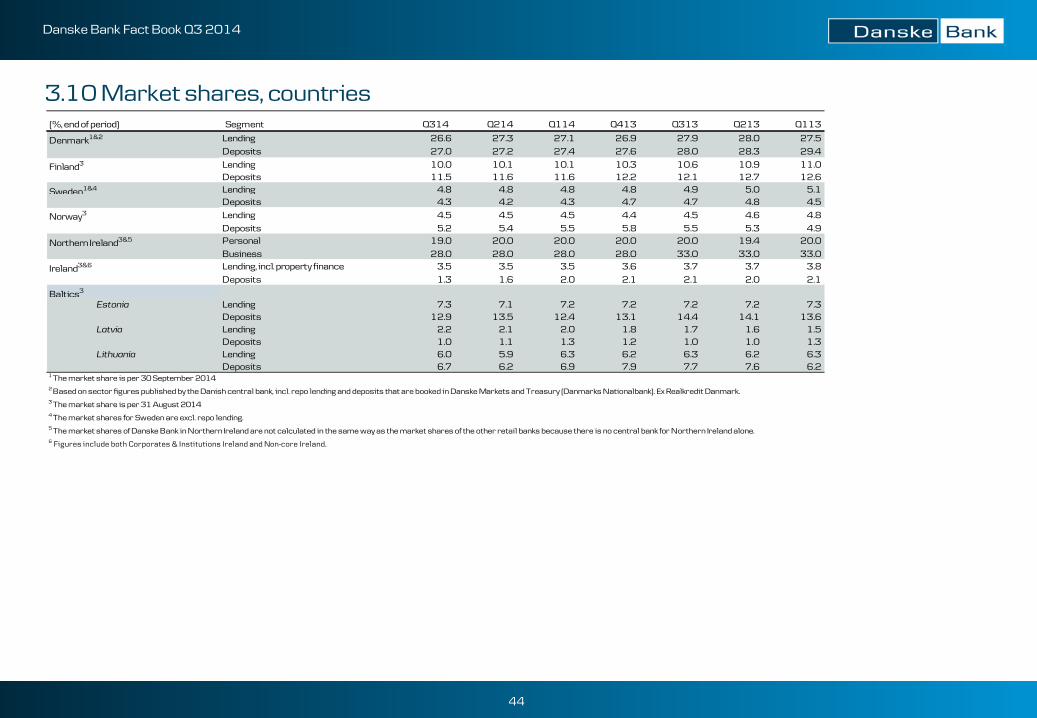
3.10 Market shares, countries
(%, end of period) Segment Q314 Q214 Q114 Q413 Q313 Q213 Q113
Denmark1&2 Lending 26.6 27.3 27.1 26.9 27.9 28.0 27.5Deposits 27.0 27.2 27.4 27.6 28.0 28.3 29.4
Finland3 Lending 10.0 10.1 10.1 10.3 10.6 10.9 11.0Deposits 11.5 11.6 11.6 12.2 12.1 12.7 12.6
Sweden1&4 Lending 4.8 4.8 4.8 4.8 4.9 5.0 5.1Deposits 4.3 4.2 4.3 4.7 4.7 4.8 4.5
Norway3 Lending 4.5 4.5 4.5 4.4 4.5 4.6 4.8Deposits 5.2 5.4 5.5 5.8 5.5 5.3 4.9
Northern Ireland3&5 Personal 19.0 20.0 20.0 20.0 20.0 19.4 20.0Business 28.0 28.0 28.0 28.0 33.0 33.0 33.0
Ireland3&6 Lending, incl. property finance 3.5 3.5 3.5 3.6 3.7 3.7 3.8Deposits 1.3 1.6 2.0 2.1 2.1 2.0 2.1
Baltics3
Estonia Lending 7.3 7.1 7.2 7.2 7.2 7.2 7.3Deposits 12.9 13.5 12.4 13.1 14.4 14.1 13.6
Latvia Lending 2.2 2.1 2.0 1.8 1.7 1.6 1.5Deposits 1.0 1.1 1.3 1.2 1.0 1.0 1.3
Lithuania Lending 6.0 5.9 6.3 6.2 6.3 6.2 6.3Deposits 6.7 6.2 6.9 7.9 7.7 7.6 6.2
1 The market share is per 30 September 20142 Based on sector figures published by the Danish central bank, incl. repo lending and deposits that are booked in Danske Markets and Treasury (Danmarks Nationalbank). Ex Realkredit Danmark. 3 The market share is per 31 August 20144 The market shares for Sweden are excl. repo lending.5 The market shares of Danske Bank in Northern Ireland are not calculated in the same way as the market shares of the other retail banks because there is no central bank for Northern Ireland alone.6 Figures include both Corporates & Institutions Ireland and Non-core Ireland.
45
Danske Bank Fact Book Q3 2014
3.11 Online banking
3.12 MobilePay
(End of period) Q314 Q214 Q114 Q413 Q313 Q213 Q113
No. of eBanking customers, end of period (000s)1 2,165 2,174 2,185 2,175 2,168 2,203 2,220
Hereof eBanking customers from Denmark (000s) 1,149 1,145 1,147 1,131 1,128 1,144 1,165
No. of Mobile Banking customers, Denmark, end of period 627,469 594,946 561,109 524,142 491,622 456,467 418,578
Mobile Banking customers/eBanking customers, Denmark (%) 55% 52% 49% 46% 44% 40% 36%
No. of app downloads2 155,757 152,775 170,171 193,948 183,380 181,431 186,819
No. of app downloads, aggregated2 2,380,274 2,224,517 2,071,742 1,901,571 1,707,623 1,524,243 1,342,812
Number of self-service eBanking payments and transactions (000s)3 17,936 19,142 20,119 20,501 20,210 21,443 22,474
Number of self-service Mobile Banking payments and transactions (000s) 6,810 6,552 6,047 4,807 4,441 3,808 3,104
Number of self-service Tablet Banking payments and transactions (000s) 1,546 1,526 1,496 1,395 1,259 1,144 950
Number of teller payments and transactions (000s) 4,720 4,785 4,756 5,211 5,619 5,830 5,974 1 Consists of active eBanking customers including Mobile Banking and Tablet Banking. 2 iPhone, iPads, windows and Android applications. The iPad app was launched in mid-November 2011. 3 Direct debits and automatic payments are not included.
Q314 Q214 Q114 Q413 Q313 Q213 Q113
Number of transactions (000s) 8,592 6,831 3,967 2,341 987 263 -
Number of transactions, aggregated (000s) 22,981 14,389 7,558 3,590 1,250 263 -
Volume of transactions, DKK (000s) 2,079,775 1,557,535 907,957 531,708 171,954 36,707 -
Volume of transactions, DKK, aggregated (000s) 5,285,637 3,205,861 1,648,326 740,369 208,662 36,707 -
Number of app downloads 413,948 380,349 380,910 361,447 303,228 255,192 -
Number of app downloads, aggregated 2,095,074 1,681,126 1,300,777 919,867 558,420 255,192 -
Number of registrations 285,617 351,268 307,938 289,140 237,477 187,230 -
Number of registrations, aggregated 1,658,670 1,373,053 1,021,785 713,847 424,707 187,230 -
The MobilePay app was launched on 7 May 2013.
46
Macroeconomics
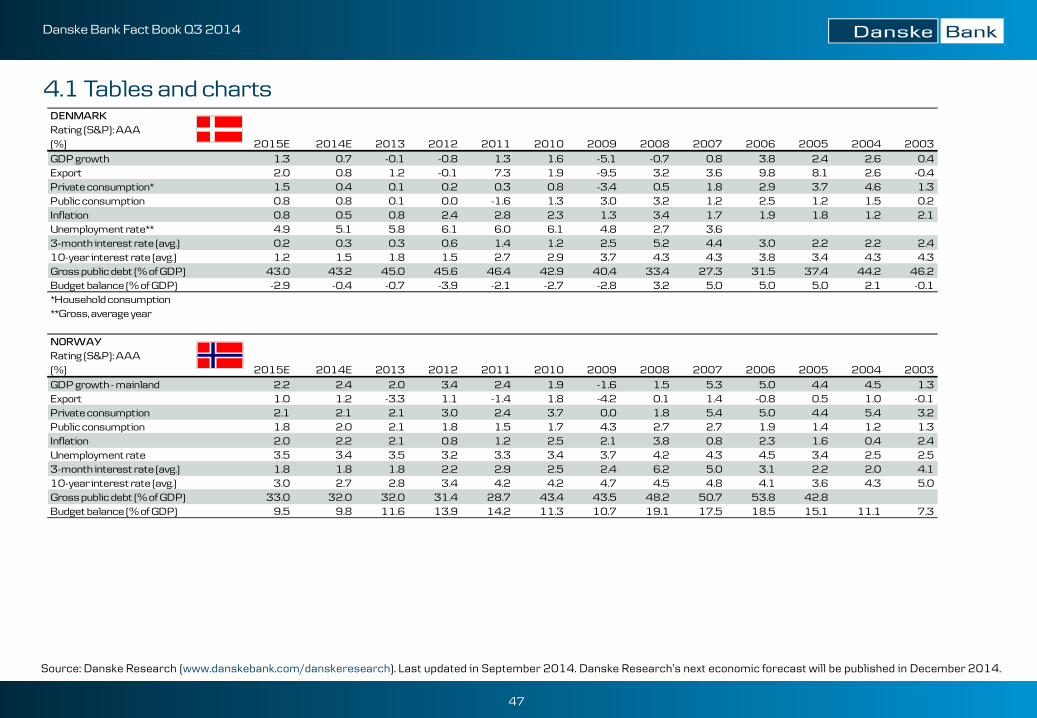
47
Danske Bank Fact Book Q3 2014
DENMARK Rating (S&P): AAA(%) 2015E 2014E 2013 2012 2011 2010 2009 2008 2007 2006 2005 2004 2003GDP growth 1.3 0.7 -0.1 -0.8 1.3 1.6 -5.1 -0.7 0.8 3.8 2.4 2.6 0.4Export 2.0 0.8 1.2 -0.1 7.3 1.9 -9.5 3.2 3.6 9.8 8.1 2.6 -0.4Private consumption* 1.5 0.4 0.1 0.2 0.3 0.8 -3.4 0.5 1.8 2.9 3.7 4.6 1.3Public consumption 0.8 0.8 0.1 0.0 -1.6 1.3 3.0 3.2 1.2 2.5 1.2 1.5 0.2Inflation 0.8 0.5 0.8 2.4 2.8 2.3 1.3 3.4 1.7 1.9 1.8 1.2 2.1Unemployment rate** 4.9 5.1 5.8 6.1 6.0 6.1 4.8 2.7 3.63-month interest rate (avg.) 0.2 0.3 0.3 0.6 1.4 1.2 2.5 5.2 4.4 3.0 2.2 2.2 2.410-year interest rate (avg.) 1.2 1.5 1.8 1.5 2.7 2.9 3.7 4.3 4.3 3.8 3.4 4.3 4.3Gross public debt (% of GDP) 43.0 43.2 45.0 45.6 46.4 42.9 40.4 33.4 27.3 31.5 37.4 44.2 46.2Budget balance (% of GDP) -2.9 -0.4 -0.7 -3.9 -2.1 -2.7 -2.8 3.2 5.0 5.0 5.0 2.1 -0.1*Household consumption**Gross, average year
NORWAY Rating (S&P): AAA(%) 2015E 2014E 2013 2012 2011 2010 2009 2008 2007 2006 2005 2004 2003GDP growth - mainland 2.2 2.4 2.0 3.4 2.4 1.9 -1.6 1.5 5.3 5.0 4.4 4.5 1.3Export 1.0 1.2 -3.3 1.1 -1.4 1.8 -4.2 0.1 1.4 -0.8 0.5 1.0 -0.1Private consumption 2.1 2.1 2.1 3.0 2.4 3.7 0.0 1.8 5.4 5.0 4.4 5.4 3.2Public consumption 1.8 2.0 2.1 1.8 1.5 1.7 4.3 2.7 2.7 1.9 1.4 1.2 1.3Inflation 2.0 2.2 2.1 0.8 1.2 2.5 2.1 3.8 0.8 2.3 1.6 0.4 2.4Unemployment rate 3.5 3.4 3.5 3.2 3.3 3.4 3.7 4.2 4.3 4.5 3.4 2.5 2.53-month interest rate (avg.) 1.8 1.8 1.8 2.2 2.9 2.5 2.4 6.2 5.0 3.1 2.2 2.0 4.110-year interest rate (avg.) 3.0 2.7 2.8 3.4 4.2 4.2 4.7 4.5 4.8 4.1 3.6 4.3 5.0Gross public debt (% of GDP) 33.0 32.0 32.0 31.4 28.7 43.4 43.5 48.2 50.7 53.8 42.8 Budget balance (% of GDP) 9.5 9.8 11.6 13.9 14.2 11.3 10.7 19.1 17.5 18.5 15.1 11.1 7.3
4.1 Tables and charts
Source: Danske Research (www.danskebank.com/danskeresearch). Last updated in September 2014. Danske Research’s next economic forecast will be published in December 2014.
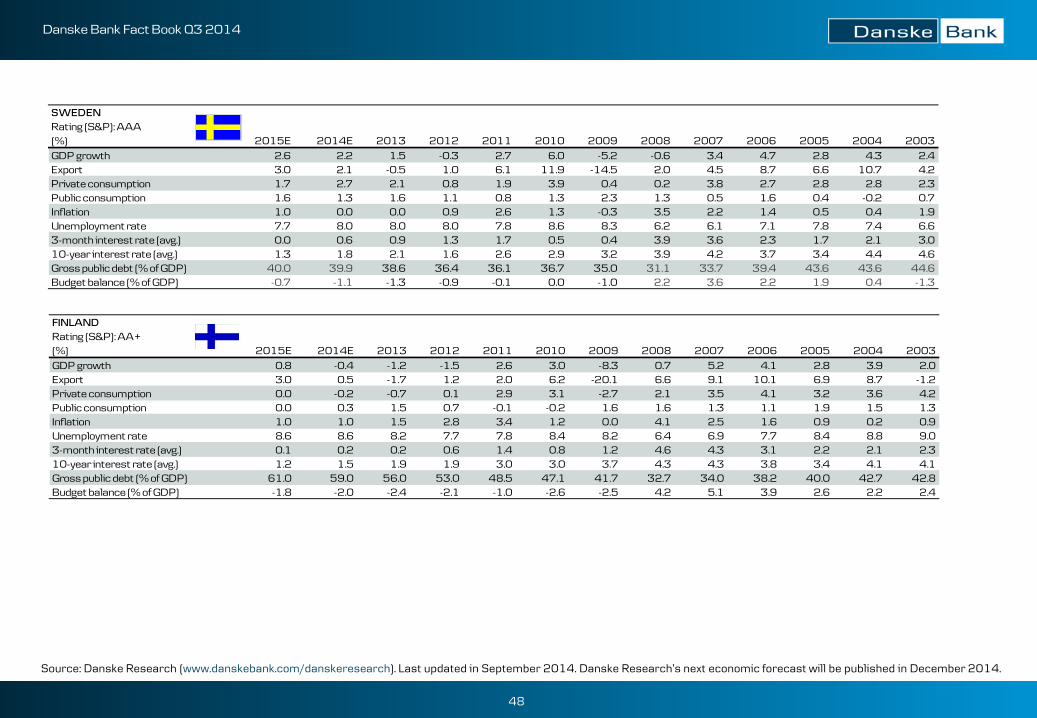
48
Danske Bank Fact Book Q3 2014
FINLAND Rating (S&P): AA+(%) 2015E 2014E 2013 2012 2011 2010 2009 2008 2007 2006 2005 2004 2003GDP growth 0.8 -0.4 -1.2 -1.5 2.6 3.0 -8.3 0.7 5.2 4.1 2.8 3.9 2.0Export 3.0 0.5 -1.7 1.2 2.0 6.2 -20.1 6.6 9.1 10.1 6.9 8.7 -1.2Private consumption 0.0 -0.2 -0.7 0.1 2.9 3.1 -2.7 2.1 3.5 4.1 3.2 3.6 4.2Public consumption 0.0 0.3 1.5 0.7 -0.1 -0.2 1.6 1.6 1.3 1.1 1.9 1.5 1.3Inflation 1.0 1.0 1.5 2.8 3.4 1.2 0.0 4.1 2.5 1.6 0.9 0.2 0.9Unemployment rate 8.6 8.6 8.2 7.7 7.8 8.4 8.2 6.4 6.9 7.7 8.4 8.8 9.03-month interest rate (avg.) 0.1 0.2 0.2 0.6 1.4 0.8 1.2 4.6 4.3 3.1 2.2 2.1 2.310-year interest rate (avg.) 1.2 1.5 1.9 1.9 3.0 3.0 3.7 4.3 4.3 3.8 3.4 4.1 4.1Gross public debt (% of GDP) 61.0 59.0 56.0 53.0 48.5 47.1 41.7 32.7 34.0 38.2 40.0 42.7 42.8Budget balance (% of GDP) -1.8 -2.0 -2.4 -2.1 -1.0 -2.6 -2.5 4.2 5.1 3.9 2.6 2.2 2.4
SWEDEN Rating (S&P): AAA(%) 2015E 2014E 2013 2012 2011 2010 2009 2008 2007 2006 2005 2004 2003GDP growth 2.6 2.2 1.5 -0.3 2.7 6.0 -5.2 -0.6 3.4 4.7 2.8 4.3 2.4Export 3.0 2.1 -0.5 1.0 6.1 11.9 -14.5 2.0 4.5 8.7 6.6 10.7 4.2Private consumption 1.7 2.7 2.1 0.8 1.9 3.9 0.4 0.2 3.8 2.7 2.8 2.8 2.3Public consumption 1.6 1.3 1.6 1.1 0.8 1.3 2.3 1.3 0.5 1.6 0.4 -0.2 0.7Inflation 1.0 0.0 0.0 0.9 2.6 1.3 -0.3 3.5 2.2 1.4 0.5 0.4 1.9Unemployment rate 7.7 8.0 8.0 8.0 7.8 8.6 8.3 6.2 6.1 7.1 7.8 7.4 6.63-month interest rate (avg.) 0.0 0.6 0.9 1.3 1.7 0.5 0.4 3.9 3.6 2.3 1.7 2.1 3.010-year interest rate (avg.) 1.3 1.8 2.1 1.6 2.6 2.9 3.2 3.9 4.2 3.7 3.4 4.4 4.6Gross public debt (% of GDP) 40.0 39.9 38.6 36.4 36.1 36.7 35.0 31.1 33.7 39.4 43.6 43.6 44.6Budget balance (% of GDP) -0.7 -1.1 -1.3 -0.9 -0.1 0.0 -1.0 2.2 3.6 2.2 1.9 0.4 -1.3
Source: Danske Research (www.danskebank.com/danskeresearch). Last updated in September 2014. Danske Research’s next economic forecast will be published in December 2014.
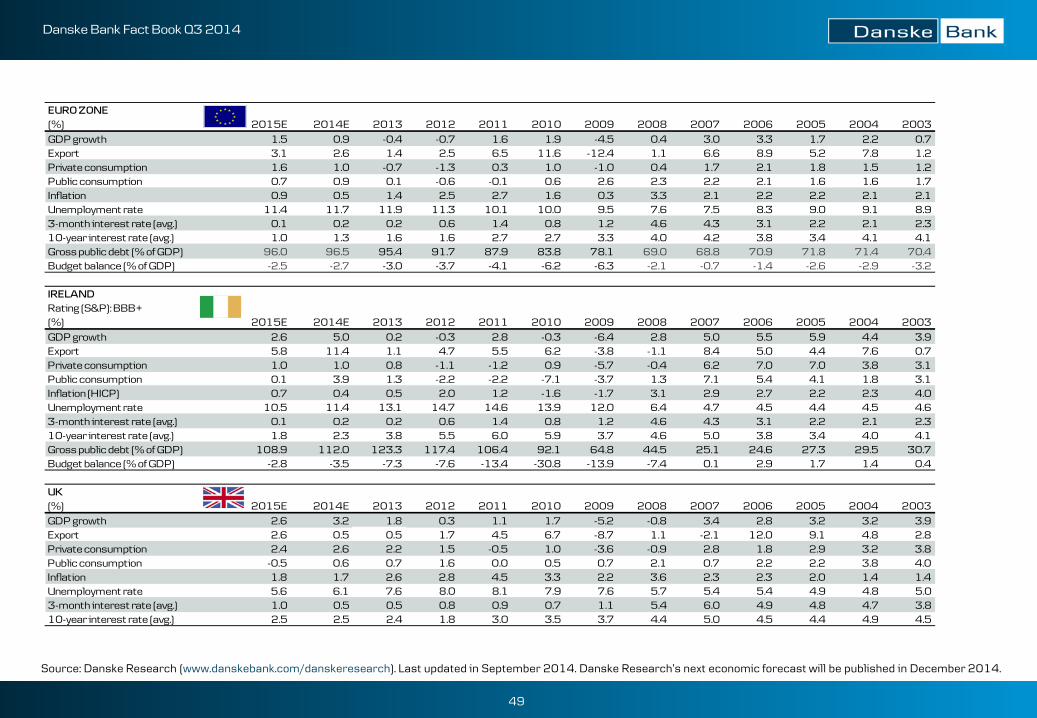
49
Danske Bank Fact Book Q3 2014
EURO ZONE(%) 2015E 2014E 2013 2012 2011 2010 2009 2008 2007 2006 2005 2004 2003GDP growth 1.5 0.9 -0.4 -0.7 1.6 1.9 -4.5 0.4 3.0 3.3 1.7 2.2 0.7Export 3.1 2.6 1.4 2.5 6.5 11.6 -12.4 1.1 6.6 8.9 5.2 7.8 1.2Private consumption 1.6 1.0 -0.7 -1.3 0.3 1.0 -1.0 0.4 1.7 2.1 1.8 1.5 1.2Public consumption 0.7 0.9 0.1 -0.6 -0.1 0.6 2.6 2.3 2.2 2.1 1.6 1.6 1.7Inflation 0.9 0.5 1.4 2.5 2.7 1.6 0.3 3.3 2.1 2.2 2.2 2.1 2.1Unemployment rate 11.4 11.7 11.9 11.3 10.1 10.0 9.5 7.6 7.5 8.3 9.0 9.1 8.93-month interest rate (avg.) 0.1 0.2 0.2 0.6 1.4 0.8 1.2 4.6 4.3 3.1 2.2 2.1 2.310-year interest rate (avg.) 1.0 1.3 1.6 1.6 2.7 2.7 3.3 4.0 4.2 3.8 3.4 4.1 4.1Gross public debt (% of GDP) 96.0 96.5 95.4 91.7 87.9 83.8 78.1 69.0 68.8 70.9 71.8 71.4 70.4Budget balance (% of GDP) -2.5 -2.7 -3.0 -3.7 -4.1 -6.2 -6.3 -2.1 -0.7 -1.4 -2.6 -2.9 -3.2
IRELAND Rating (S&P): BBB+(%) 2015E 2014E 2013 2012 2011 2010 2009 2008 2007 2006 2005 2004 2003GDP growth 2.6 5.0 0.2 -0.3 2.8 -0.3 -6.4 2.8 5.0 5.5 5.9 4.4 3.9Export 5.8 11.4 1.1 4.7 5.5 6.2 -3.8 -1.1 8.4 5.0 4.4 7.6 0.7Private consumption 1.0 1.0 0.8 -1.1 -1.2 0.9 -5.7 -0.4 6.2 7.0 7.0 3.8 3.1Public consumption 0.1 3.9 1.3 -2.2 -2.2 -7.1 -3.7 1.3 7.1 5.4 4.1 1.8 3.1Inflation (HICP) 0.7 0.4 0.5 2.0 1.2 -1.6 -1.7 3.1 2.9 2.7 2.2 2.3 4.0Unemployment rate 10.5 11.4 13.1 14.7 14.6 13.9 12.0 6.4 4.7 4.5 4.4 4.5 4.63-month interest rate (avg.) 0.1 0.2 0.2 0.6 1.4 0.8 1.2 4.6 4.3 3.1 2.2 2.1 2.310-year interest rate (avg.) 1.8 2.3 3.8 5.5 6.0 5.9 3.7 4.6 5.0 3.8 3.4 4.0 4.1Gross public debt (% of GDP) 108.9 112.0 123.3 117.4 106.4 92.1 64.8 44.5 25.1 24.6 27.3 29.5 30.7Budget balance (% of GDP) -2.8 -3.5 -7.3 -7.6 -13.4 -30.8 -13.9 -7.4 0.1 2.9 1.7 1.4 0.4
UK (%) 2015E 2014E 2013 2012 2011 2010 2009 2008 2007 2006 2005 2004 2003GDP growth 2.6 3.2 1.8 0.3 1.1 1.7 -5.2 -0.8 3.4 2.8 3.2 3.2 3.9Export 2.6 0.5 0.5 1.7 4.5 6.7 -8.7 1.1 -2.1 12.0 9.1 4.8 2.8Private consumption 2.4 2.6 2.2 1.5 -0.5 1.0 -3.6 -0.9 2.8 1.8 2.9 3.2 3.8Public consumption -0.5 0.6 0.7 1.6 0.0 0.5 0.7 2.1 0.7 2.2 2.2 3.8 4.0Inflation 1.8 1.7 2.6 2.8 4.5 3.3 2.2 3.6 2.3 2.3 2.0 1.4 1.4Unemployment rate 5.6 6.1 7.6 8.0 8.1 7.9 7.6 5.7 5.4 5.4 4.9 4.8 5.03-month interest rate (avg.) 1.0 0.5 0.5 0.8 0.9 0.7 1.1 5.4 6.0 4.9 4.8 4.7 3.810-year interest rate (avg.) 2.5 2.5 2.4 1.8 3.0 3.5 3.7 4.4 5.0 4.5 4.4 4.9 4.5
Source: Danske Research (www.danskebank.com/danskeresearch). Last updated in September 2014. Danske Research’s next economic forecast will be published in December 2014.
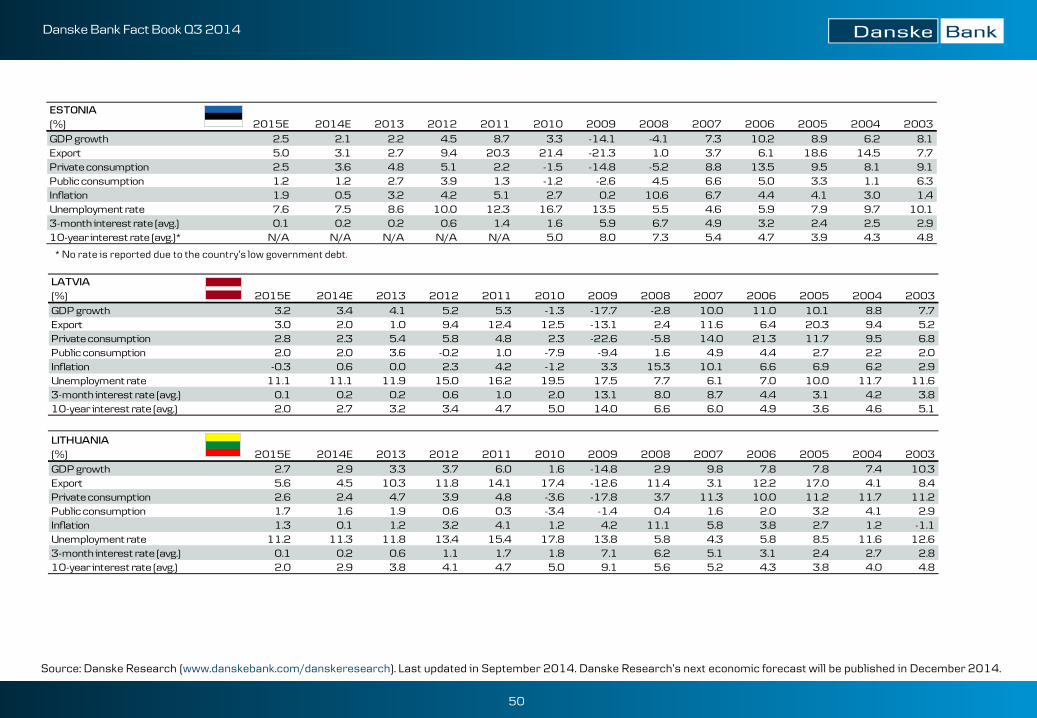
50
Danske Bank Fact Book Q3 2014
LATVIA (%) 2015E 2014E 2013 2012 2011 2010 2009 2008 2007 2006 2005 2004 2003GDP growth 3.2 3.4 4.1 5.2 5.3 -1.3 -17.7 -2.8 10.0 11.0 10.1 8.8 7.7Export 3.0 2.0 1.0 9.4 12.4 12.5 -13.1 2.4 11.6 6.4 20.3 9.4 5.2Private consumption 2.8 2.3 5.4 5.8 4.8 2.3 -22.6 -5.8 14.0 21.3 11.7 9.5 6.8Public consumption 2.0 2.0 3.6 -0.2 1.0 -7.9 -9.4 1.6 4.9 4.4 2.7 2.2 2.0Inflation -0.3 0.6 0.0 2.3 4.2 -1.2 3.3 15.3 10.1 6.6 6.9 6.2 2.9Unemployment rate 11.1 11.1 11.9 15.0 16.2 19.5 17.5 7.7 6.1 7.0 10.0 11.7 11.63-month interest rate (avg.) 0.1 0.2 0.2 0.6 1.0 2.0 13.1 8.0 8.7 4.4 3.1 4.2 3.810-year interest rate (avg.) 2.0 2.7 3.2 3.4 4.7 5.0 14.0 6.6 6.0 4.9 3.6 4.6 5.1
LITHUANIA (%) 2015E 2014E 2013 2012 2011 2010 2009 2008 2007 2006 2005 2004 2003GDP growth 2.7 2.9 3.3 3.7 6.0 1.6 -14.8 2.9 9.8 7.8 7.8 7.4 10.3Export 5.6 4.5 10.3 11.8 14.1 17.4 -12.6 11.4 3.1 12.2 17.0 4.1 8.4Private consumption 2.6 2.4 4.7 3.9 4.8 -3.6 -17.8 3.7 11.3 10.0 11.2 11.7 11.2Public consumption 1.7 1.6 1.9 0.6 0.3 -3.4 -1.4 0.4 1.6 2.0 3.2 4.1 2.9Inflation 1.3 0.1 1.2 3.2 4.1 1.2 4.2 11.1 5.8 3.8 2.7 1.2 -1.1Unemployment rate 11.2 11.3 11.8 13.4 15.4 17.8 13.8 5.8 4.3 5.8 8.5 11.6 12.63-month interest rate (avg.) 0.1 0.2 0.6 1.1 1.7 1.8 7.1 6.2 5.1 3.1 2.4 2.7 2.810-year interest rate (avg.) 2.0 2.9 3.8 4.1 4.7 5.0 9.1 5.6 5.2 4.3 3.8 4.0 4.8
ESTONIA (%) 2015E 2014E 2013 2012 2011 2010 2009 2008 2007 2006 2005 2004 2003GDP growth 2.5 2.1 2.2 4.5 8.7 3.3 -14.1 -4.1 7.3 10.2 8.9 6.2 8.1Export 5.0 3.1 2.7 9.4 20.3 21.4 -21.3 1.0 3.7 6.1 18.6 14.5 7.7Private consumption 2.5 3.6 4.8 5.1 2.2 -1.5 -14.8 -5.2 8.8 13.5 9.5 8.1 9.1Public consumption 1.2 1.2 2.7 3.9 1.3 -1.2 -2.6 4.5 6.6 5.0 3.3 1.1 6.3Inflation 1.9 0.5 3.2 4.2 5.1 2.7 0.2 10.6 6.7 4.4 4.1 3.0 1.4Unemployment rate 7.6 7.5 8.6 10.0 12.3 16.7 13.5 5.5 4.6 5.9 7.9 9.7 10.13-month interest rate (avg.) 0.1 0.2 0.2 0.6 1.4 1.6 5.9 6.7 4.9 3.2 2.4 2.5 2.910-year interest rate (avg.)* N/A N/A N/A N/A N/A 5.0 8.0 7.3 5.4 4.7 3.9 4.3 4.8
Source: Danske Research (www.danskebank.com/danskeresearch). Last updated in September 2014. Danske Research’s next economic forecast will be published in December 2014.
* No rate is reported due to the country’s low government debt.
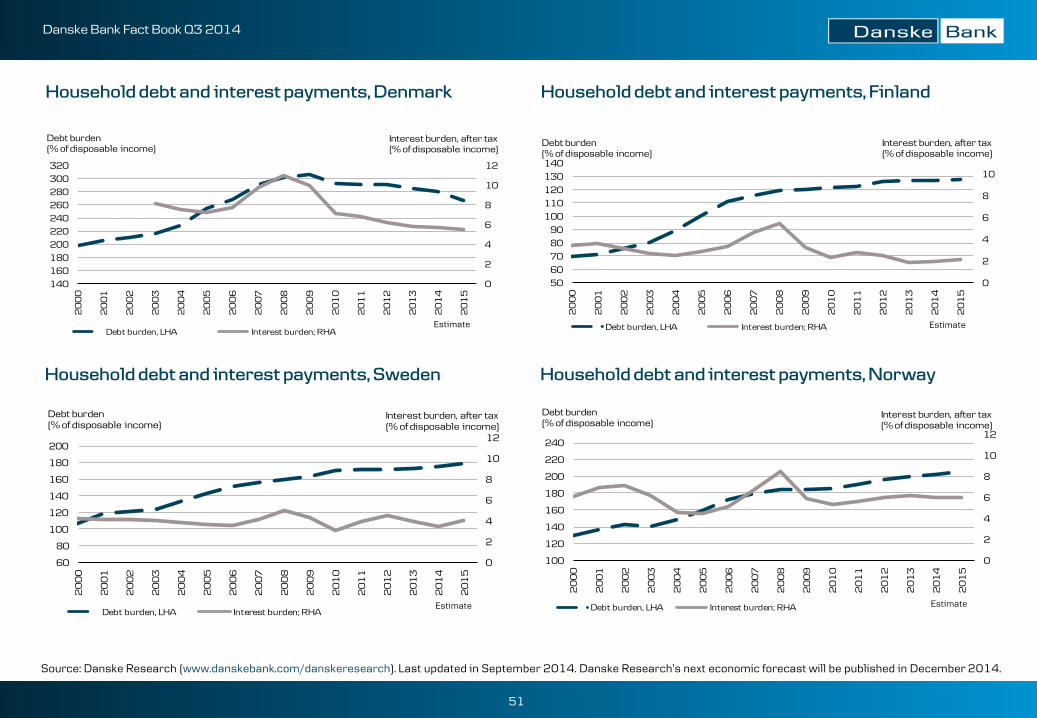
51
Danske Bank Fact Book Q3 2014
0
2
4
6
8
10
12
100
120
140
160
180
200
220
240
20
00
20
01
20
02
20
03
20
04
20
05
20
06
20
07
20
08
20
09
20
10
20
11
20
12
20
13
20
14
20
15
Debt burden, LHA Interest burden; RHA
Debt burden(% of disposable income)
Interest burden, after tax(% of disposable income)
0
2
4
6
8
10
12
60
80
100
120
140
160
180
200
20
00
20
01
20
02
20
03
20
04
20
05
20
06
20
07
20
08
20
09
20
10
20
11
20
12
20
13
20
14
20
15
Debt burden, LHA Interest burden; RHA
Debt burden(% of disposable income)
Interest burden, after tax(% of disposable income)
0
2
4
6
8
10
12
140160180200220240260280300320
20
00
20
01
20
02
20
03
20
04
20
05
20
06
20
07
20
08
20
09
20
10
20
11
20
12
20
13
20
14
20
15
Debt burden, LHA Interest burden; RHA
Debt burden(% of disposable income)
Interest burden, after tax(% of disposable income)
0
2
4
6
8
10
5060708090
100110120130140
20
00
20
01
20
02
20
03
20
04
20
05
20
06
20
07
20
08
20
09
20
10
20
11
20
12
20
13
20
14
20
15
Debt burden, LHA Interest burden; RHA
Debt burden(% of disposable income)
Interest burden, after tax(% of disposable income)
Household debt and interest payments, Sweden Household debt and interest payments, Norway
Household debt and interest payments, Denmark Household debt and interest payments, Finland
Estimate
Estimate
Estimate
Estimate
Source: Danske Research (www.danskebank.com/danskeresearch). Last updated in September 2014. Danske Research’s next economic forecast will be published in December 2014.
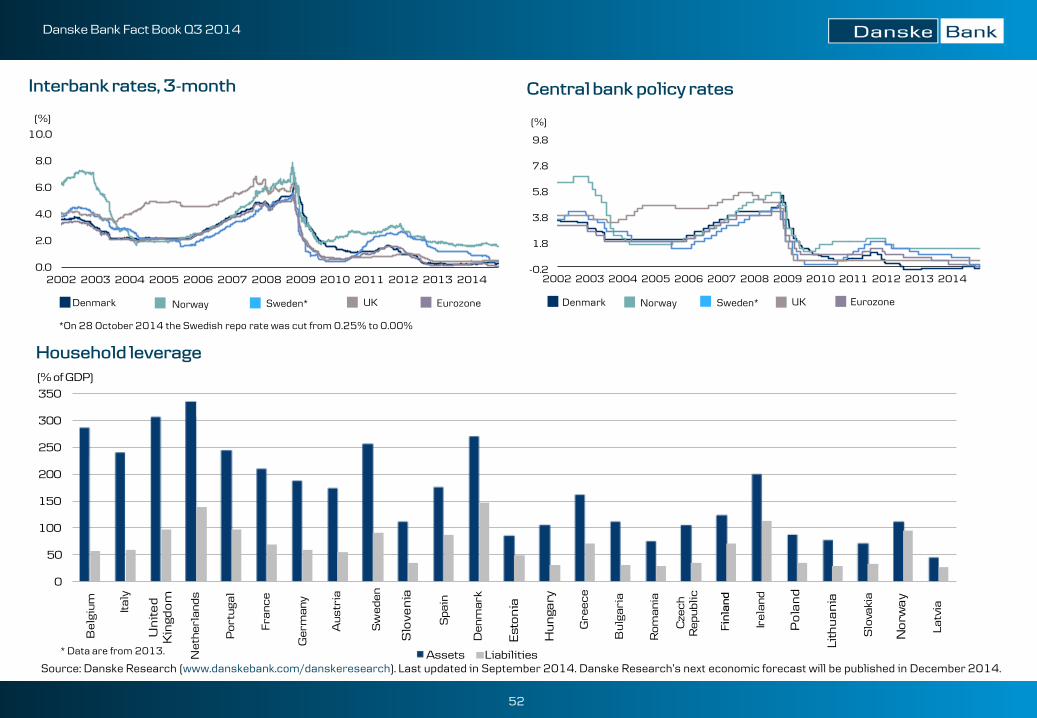
52
Danske Bank Fact Book Q3 2014
Bel
gium Ita
ly
Un
ite
d
Kin
gdo
m
Net
herl
ands
Por
tuga
l
Fran
ce
Ger
man
y
Aus
tria
Sw
eden
Slo
ven
ia
Spa
in
Den
mar
k
Est
on
ia
Hu
nga
ry
Gre
ece
Bul
gari
a
Rom
ania
Cze
ch
Rep
ublic
Finl
and
Irel
and
Po
lan
d
Lith
ua
nia
Slo
vaki
a
No
rwa
y
Latv
ia
0
50
100
150
200
250
300
350
(% of GDP)
Assets Liabilities
-0.2
1.8
3.8
5.8
7.8
9.8
2002 2003 2004 2005 2006 2007 2008 2009 2010 2011 2012 2013 2014
(%)
0.0
2.0
4.0
6.0
8.0
10.0
2002 2003 2004 2005 2006 2007 2008 2009 2010 2011 2012 2013 2014
(%)
Interbank rates, 3-month
Household leverage
* Data are from 2013.
Source: Danske Research (www.danskebank.com/danskeresearch). Last updated in September 2014. Danske Research’s next economic forecast will be published in December 2014.
Central bank policy rates
Denmark Norway Sweden* UK Eurozone Denmark Norway Sweden* UK Eurozone
*On 28 October 2014 the Swedish repo rate was cut from 0.25% to 0.00%