ROADSHOW - Danske Bank
57
Financial results for Q3 2012 New strategy 30 October 2012 ROADSHOW
Transcript of ROADSHOW - Danske Bank

Financial results for Q3 2012 New strategy
30 October 2012
ROADSHOW
2
Financial results for Q3 2012 New strategy
Agenda
Financial results
Capital, funding and liquidity
Outlook for 2012
Q&A session
Appendix: Trends in focus areas & business units
New strategy

3
Financial results for Q3 2012 New strategy
3
New Standards
for Danske Bank

4
Financial results for Q3 2012 New strategy
Recognised as the most
trusted financial partner
New vision for 2015
4
Setting new standards
in financial services
New mission

5
Financial results for Q3 2012 New strategy
Lithuania
Strategic units
• Danica
• Danske Capital
• Nordania
Estonia
Latvia
Finland
Nordic relationship bank with expertise
Sweden
Norway
Northern Ireland
Denmark
Ireland
6
Financial results for Q3 2012 New strategy
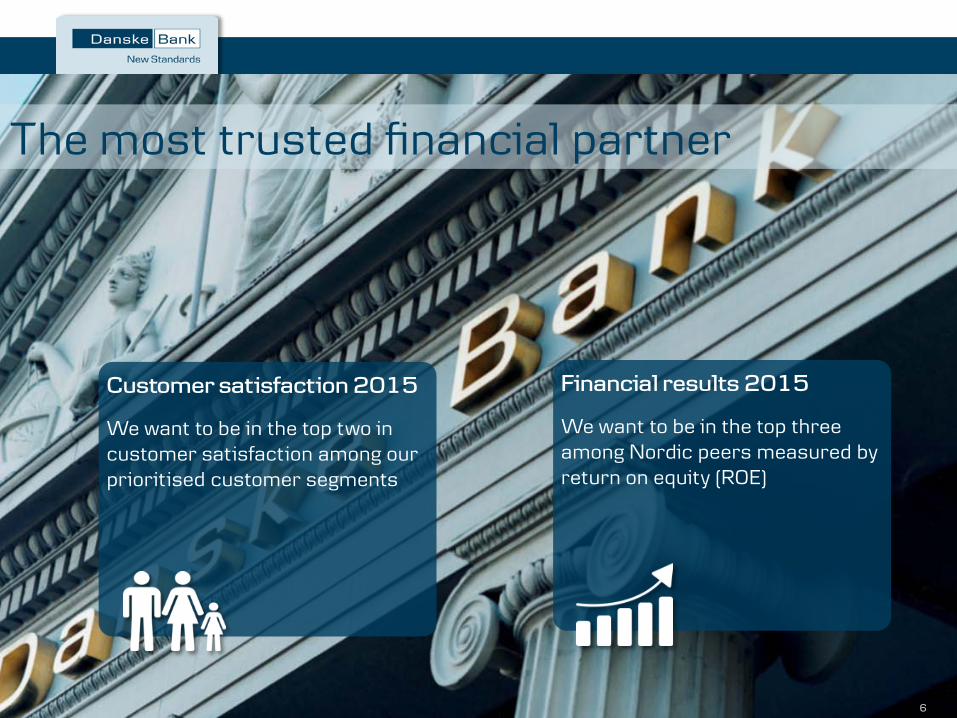
The most trusted financial partner
Customer satisfaction 2015
We want to be in the top two in customer satisfaction among our prioritised customer segments
Financial results 2015
We want to be in the top three among Nordic peers measured by return on equity (ROE)
6

7
Financial results for Q3 2012 New strategy
Financial targets
ROE 3.8% Above 12% in 2015
Dividend payments
Nil for 2012 About 40% of annual net profit, but lower until we have reached capital and rating targets
Core tier 1 Total capital Liquidity
12.7% Minimum 13% by the end of 2013 19.4% Minimum 17% by the end of 2013 Meet EU 2015 LCR requirement by the end of 2012
Ratings S&P/Moody’s/Fitch Improve ratings at least one notch A-/Baa1/A
Nominal cost FTE C/I ratio
2012 guidance at 27bn Below DKK 26 bn in 2015 20,651 To be reduced by 2,000 in 2013-2015 55% Below 48% in 2015
Q3 2012 Ambitions

8
Financial results for Q3 2012 New strategy
ROE above 12% in 2015
ROE development from 2012 to 2015
2015E (after tax) ROE above 12% in 2015
Capital, regulation, inflation, tax 6–7% points
Short term rates (pre-tax) 4–5% points
Declining loan losses (pre-tax) 5–6% points
Management actions (pre-tax) 4–6% points
9M 2012 annualised (after tax) 3.8%

9
Financial results for Q3 2012 New strategy
Financial results: 9M 2012 shows strong improvement, Q3 showed stable development Income statement & key figures (DKK m) Key points for the first nine months
• Strong improvement in net profit
• Improvement driven by strong income growth
• Expenses flat despite restructuring charges
• Impairments higher than 9M 2011 owing to deterioration of the macroeconomic climate
Key points Q3
• Flat net interest income despite lower short-term rates
• Solid trading income within guidance
• Declining expenses, mainly seasonal effect
• Lower impairments, drop in Denmark but increase in CIB
• Lower RWA and higher CT1 ratio
9M 2012 9M 2011 Index Q3 2012 Q2 2012 Index
Net interest income 18,588 17,355 107 6,198 6,218 100
Net fee income 6,129 6,080 101 2,116 2,026 104
Net trading income 7,469 5,687 131 1,785 2,462 73
Other income 2,323 2,799 83 689 846 81
Net income from insurance business 1,310 -407 - 427 699 61
Total income 35,819 31,514 114 11,215 12,251 92
Expenses 19,598 19,528 100 6,116 6,632 92
Profit bef. loan imp. charges 16,221 11,986 135 5,099 5,619 91
Loan impairment charges 9,910 8,396 118 2,879 3,109 93
Profit before tax 6,311 3,590 176 2,220 2,510 88
Tax 2,708 2,067 131 903 1,007 90
Net profit 3,603 1,523 237 1,317 1,503 88
Net profit ex non-core Ireland 7,216 - - 2,645 2,840 93
Return on avg. shareholders' equity (%) 3.8 1.7 222 4.1 4.7 87
C/I ratio (%) 54.7 62.0 88 54.5 54.1 101
Core tier 1 capital ratio (%) 12.7 11.8 108 12.7 12.1 105
Risk-weighted assets (bn) 851 895 95 851 893 95
Total loans ex repos (bn) 1,700 1,694 100 1,700 1,704 100
Deposits (ex repos) & RD bonds (bn) 1,471 1,505 98 1,471 1,460 101
Total assets (bn) 3,599 3,381 106 3,599 3,481 103
Loan loss ratio (bp) 68 58 117 56 62 90

10
Financial results for Q3 2012 New strategy
Net interest income: Headwind from lower short-term rates neutralised by higher lending margins Quarterly net interest income (DKK m) Net interest income drivers
Positive
• Increased lending rates, mainly in Denmark
Negative
• Low and declining central bank rates
Sensitivity
Short-term interest rate sensitivity across all currencies
+ 25 bp = DKK +800 m
– 25 bp = DKK – 800 m
Q312
6,218 6,172
6,198
Q212
6,182
Q112 Q411 Q311
6,016

11
Financial results for Q3 2012 New strategy
Net fee income: Growth in financing fees because of repayment of state-guaranteed bonds Quarterly net fee income (DKK m)
640
Q312 Q112
688
1,386
2,026 2,116
Q212
659
1,457
1,987
1,299
Q411
2,218
719
1,499
Q311
1,938
564
1,374
Portfolio fees
Activity fees
Fee income drivers
• Activity levels remain stable
• Increase in portfolio-based fees driven by repayment of bonds issued with state guarantee (quarterly effect of DKK 70 m)
• Activity-based fees stable despite summer season
Fee income split, Q3 2012 (%)
20
71
9
Banking Activities ex CIB
CIB
Danske Capital

12
Financial results for Q3 2012 New strategy
Quarterly trading income (DKK m)
Trading income: Q3 2012 within expectations, strong improvement over Q3 2011
267
Q312
1,785
Q212
2,462
Q112
3,222
Q411
1,638
Q311
• Solid trading income, mainly from bond and derivatives activities
• Q3 includes DKK 124 m realised loss from AFS portfolio off set in total income
Interest rate sensitivity (Group) • 1 pp increase in yield curve: DKK -316 m
Trading income drivers
Trading income split, Q3 2012 (%)
42
95
43
Equities
Bonds & DCM
Repos & derivatives
FX & money market

13
Financial results for Q3 2012 New strategy
Quarterly insurance income (DKK m)
Insurance: Result closer to normal, boosted by good investment returns
427
699
184
976
-735
Q212 Q411 Q112 Q311 Q312
Key points
• Risk allowance booked for three out of four groups
• Strong result for unit-linked products
• Danish and German interest rate spread declined in Q3, increasing liabilities by DKK 700 m
• Shadow account of DKK 1.3 bn
• Expect risk allowance for three groups for the full year
• Premiums declining because of intensified price competition in Denmark and Sweden
14
Financial results for Q3 2012 New strategy
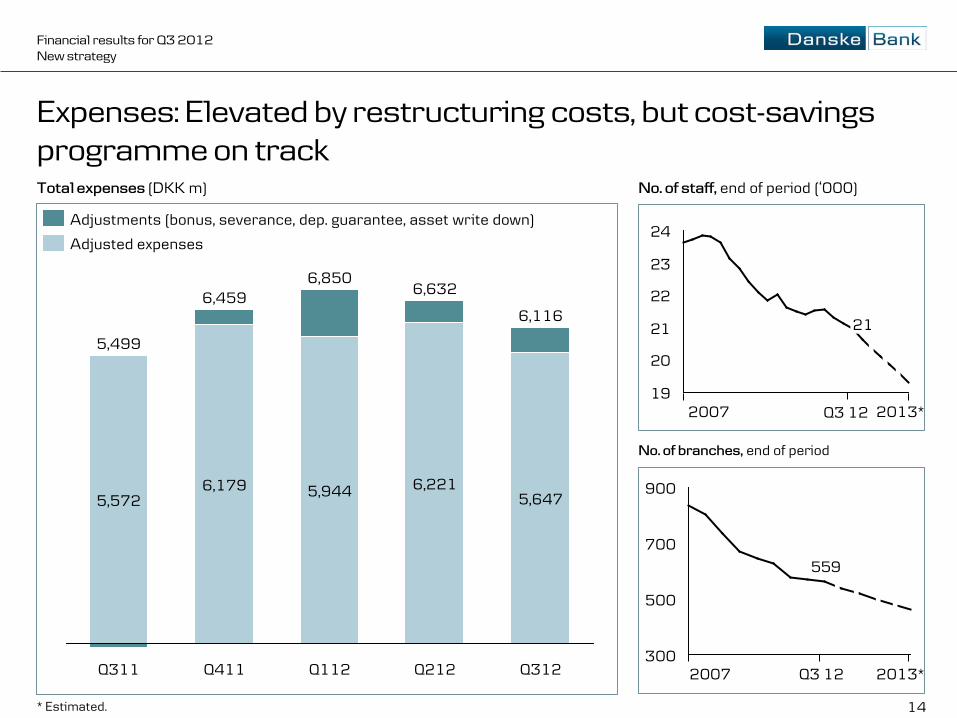
Expenses: Elevated by restructuring costs, but cost-savings programme on track Total expenses (DKK m)
No. of staff, end of period (‘000)
No. of branches, end of period
559
900
700
500
300
19
20
21
22
23
24
21
Q312
6,116
5,647
Q212
6,632
6,221
Q112
6,850
5,944
Q411
6,459
6,179
Q311
5,499
5,572
2007
2007 2013* Q3 12
* Estimated.
2013*
Adjustments (bonus, severance, dep. guarantee, asset write down)
Adjusted expenses
Q3 12

15
Financial results for Q3 2012 New strategy
Impairments by customer segment (DKK bn)
Impairments: Declining trend continues, mainly among personal customers and financials
Impairment drivers
Q212
3.1
Q112
3.9
Q411
4.8
Q311
2.8
Q312
2.9
Personal
Large corp.
SMEs
Financials • Decline in impairments of DKK 230 m in Q3
• Drop in impairments in Denmark and Finland; increase at CIB
• Lower impairments for personal and financial customers
• Some increases for large corporates and SMEs
• Q3 impairments related primarily to
• CRE in Non-core Ireland
• Shipping in CIB
• Impaired loans declined because of write-offs and new definition, which excludes loans with no impairments

16
Financial results for Q3 2012 New strategy
Impairments (DKK m)
Impairments: Lower impairments in Denmark, Finland and Northern Ireland
Loan loss ratio (bp, annualised)
960
260
206
1,374
-91
84
7
61
151
-138
39
34
44
48
Group 2,879 3,109
Non-core Ireland 1,350
CIB 630
Baltics
Ireland
Northern Ireland 214
Norway
Sweden
Finland
Denmark 737 Q312
Q212 Q312 Q212
Denmark 30 40
Finland 12 39
Sweden 9 13
Norway 9 2
Northern Ireland 186 225
Ireland 65 137
Baltics -303 -195
CIB 189 63
Non-core Ireland 2,477 2,329
Group 56 62

17
Financial results for Q3 2012 New strategy
Capital: Earnings, tier 2 issue and sale of securitisation assets boost capital ratios
Capital drivers Capital ratios, under CRD/Basel II (%)
---- Solvency need
17.0
19.4
Q4 11
11.8
16.0
17.9
Q3 12
12.7
Core tier 1
Tier 1 (including state hybrid)
Total capital
----------- 10.8 ----------
• State hybrid represents 2.8 percentage points of the tier 1 and total capital ratios
• Issuance of tier 2 capital in September 2012 raised total capital ratio by 0.7 of a percentage point
• Risk Adjusted Capital (RAC) ratio from S&P rose from 6.3% YE-11 to estimated 6.9%*
RWA (DKK bn)
13
29
851
Q2 12
Market risk
893
Securitisation etc.
Q3 12
* Assuming unchanged S&P RWA.

18
Financial results for Q3 2012 New strategy
18
Details on the equity issue 5-years senior bond spread vs. peers; 6M ASW-Spread (bp)*
Raised DKK 7.1 bn through an accelerated book-building; significant tightening in spreads since September Amount: DKK 7,150 m
Price: DKK 93 per new share
Method: Accelerated book-building without pre-emption rights to current shareholders
Why: To accelerate rating improvements and achievement of our capital targets, strengthen our funding position and better align us with our Nordic peers
Outcome: A outlook change from Stable to Positive from S&P and a positive reaction from Moody’s
New shares: 76.9 m shares
Total number of shares: 1,008.6 m shares
200
150
100
50
0 Jun
2012
-96bp
Jul 2012
Aug 2012
Sep 2012
Oct 2012
Nov 2012
* Outstanding senior benchmark issues with maturity in February 2017 (SHB in July 2017).
Handelsbanken
Danske Bank Nordea
Swedbank
29/10 -5/11: -21bp

19
Financial results for Q3 2012 New strategy
Deposits and funding: Small improvement in deposits after rating downgrade, 2013 funding plan started
Long term funding (DKK bn)
Long term funding Deposits, end of period (DKK bn)
73
2013
40-70
2012*
85
2011
97 97 8659 52
Q3 12
743
623
68
Q2 12
736
620
57
Q1 12
774
616
72
Q4 11
795
629
69
Q3 11
789
624
68
BA, other
CIB
Markets
* End of Q3 2012.
• Funding raised by end of Q3 2012:
• 43 % covered bonds
• 48 % senior debt
• 9 % tier 2 capital
• DKK 25 bn of 2013 plan pre-funded
• Funding plan for 2013 reflects large redemptions in 2014
• Goal: LCR compliant end 2012
2013 pre-funded
2013 funding plan
Completed

20
Financial results for Q3 2012 New strategy
Liquidity: Strong liquidity buffer despite deposit outflow
Bond portfolio rating, DKK 502 bn (%)
Key points
3 mos 6 mos 9 mos 12 mos
300
200
100
0
Q3 2012 Q2 2012 Q3 2011
12-month liquidity*, end of period (DKK bn)
84
5 12 Other
AAA
≥A
• 12-month liquidity of more than DKK 150 bn
• 12-month liquidity curve remains positive for more than 2½ years
• Eligible liquidity buffer of more than DKK 300 bn
* Moody’s Financial Strength. Main assumptions: No access to capital markets; no refinancing of debt to credit institutions, issued bonds or subordinated capital; moderate reduction of business activities.

21
Financial results for Q3 2012 New strategy
Outlook for 2012 as a whole: Earnings remain low but are moving in the right direction
Macro Economic growth to remain low in most markets
Expenses Expected to increase 4% above 2011 level, including restructuring costs
Loan losses In line with 2011 level, around DKK 13 bn
Net profit Results remain low but represent a step in the right direction
Dividend No dividend payment is expected for 2012
Income Improvement of income is an ongoing process
22
Financial results for Q3 2012 New strategy
www.danskebank.com/ir

23
Financial results for Q3 2012 New strategy
Appendix
Macro 24
NII and margin developments 26
Credit 31
Funding and rating 40
Business units 44
Expenses 29
Tax 30

24
Financial results for Q3 2012 New strategy
Macro trends
Bankruptcies (index 1996 = 100)
Property prices, Nordic countries (index 1996 = 100) Rating upgrades*, corporates, 12-month rolling average (%)
Business confidence indicator (index 1996 = 100)
400
300
200
100
2012 2008 2004 2000 1996
Sweden Norway Finland Denmark
60
80
100
120
140
160
2012 2008 2004 2000 1996
Denmark Finland Sweden
100
50
0 2012 2011 2010 2009
CIB Finland Sweden Norway Denmark
Upgrades > downgrades
Downgrades > upgrades
100
200
300
400
2012 2008 2004 2000 1996
Finland Sweden Norway Denmark
* Relation between upgrades and total rating changes. From Q4 2011, ratings are affected by recalibration.

25
Financial results for Q3 2012 New strategy
Denmark: Stabilisation of house prices
Danish house price by region (%)
Unemployment and foreclosures (%)
* Leading indicator, based on monthly statistics from “home” (Danske Bank’s real estate agency) that cover about one-third of the market. Sources: Danske Research, Danmarks Statistik, Association of Danish Mortgage Banks, “home”, Adam, Danish Central Bank, Skat and own calculations.
0
5
10
0
200
400
600
2012 2004 1996
No. of forced sales (rha) Unemployment 10Y swap rate
16
14
12
10
80
70
60
50
40
30
Danish housing market (000’s)
House price per sq m (rhs) No. housing units for sale
2010 2009 2008 2007 2012
Affordability index, quarterly data from1985 – 2011
140
120
100
80
60
40
2012 2008 2004 2000 1996 1992 1988
Below average = cheap
Above average = expensive
Region Prices Change Change in Preview*
peaked since peak Q2 12 Q3 12
Copenhagen Q3 2006 -27,0 0,7
Zealand Q2 2007 -29,1 0,3
South Denmark Q2 2008 -18,8 -1,4
Central Jutland Q2 2008 -14,5 1,7
Northern Jutland Q1 2008 -12,2 1,6
Nationwide Q3 2007 -19,7 0,6 0,5
Mixed rate Fixed rate Average
26
Financial results for Q3 2012 New strategy
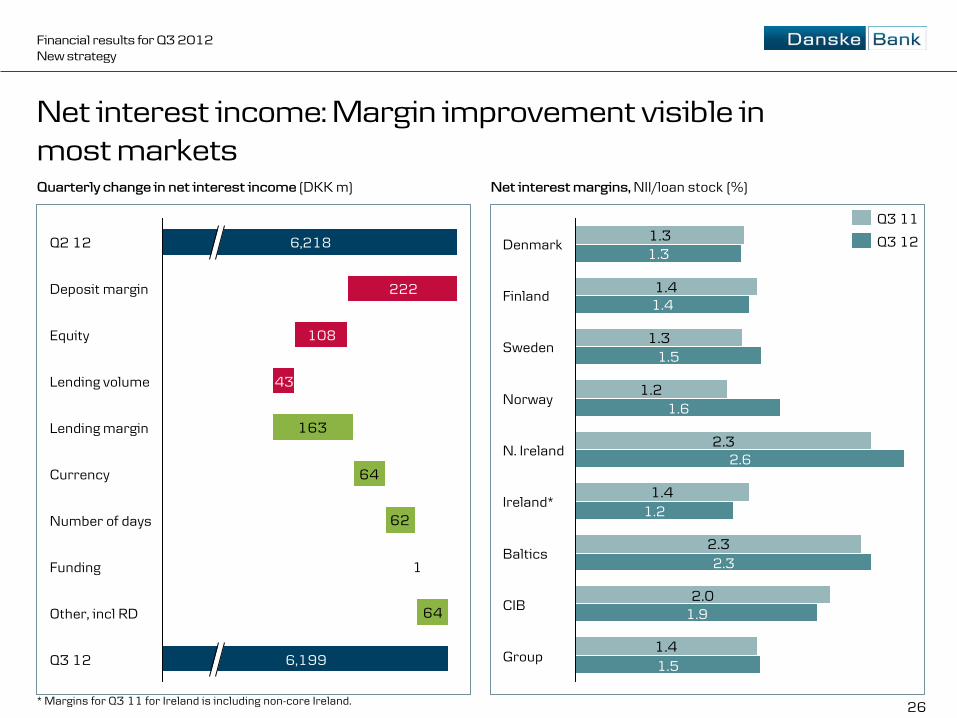
Net interest income: Margin improvement visible in most markets Quarterly change in net interest income (DKK m) Net interest margins, NII/loan stock (%)
1.3
1.4
1.3
1.2
2.3
1.4
2.3
2.0
1.4Group
1.5
CIB 1.9
Baltics 2.3
Ireland* 1.2
N. Ireland 2.6
Norway 1.6
Sweden
Finland 1.4
Denmark
1.5
1.3
Q3 11
Q3 12
163
64
62
64
Q3 12
Number of days
6,199
Other, incl RD
Currency
Funding
Lending margin
1
Lending volume 43
Equity 108
Deposit margin 222
Q2 12 6,218
* Margins for Q3 11 for Ireland is including non-core Ireland.

27
Financial results for Q3 2012 New strategy
* Includes Realkredit Danmark. ** Non-core Ireland is included in margins for Ireland prior to Q112.
Quarterly lending margins (%)
0.60 0.69
0.55
0.65
0.68 0.73
0.67 0.75
0.06 0.16
0.05 0.19
0.84 0.86
0.75 0.77
0.63 0.65
0.77 1.05
0.72 0.72
0.57 0.75
0.36 0.38
0.16 0.36
0.09 0.33
0.29 0.60
Q3 12
Q2 12
Q1 12
Q4 11
Quarterly deposit margins (%)
Higher lending margins are beginning to feed through
Denmark*
Sweden
Norway
Northern Ireland
Ireland**
Baltics
CIB
Finland
1.90 1.61
1.58
1.27 1.23
1.11 1.09
1.18 1.18 1.18
1.29
1.35 1.38
1.17
1.32 1.20 1.19
0.61
0.64
1.17
0.66
0.91 1.09
1.24
2.11
1.31
0.68
2.18 2.09
2.16
1.60
0.77
28
Financial results for Q3 2012 New strategy
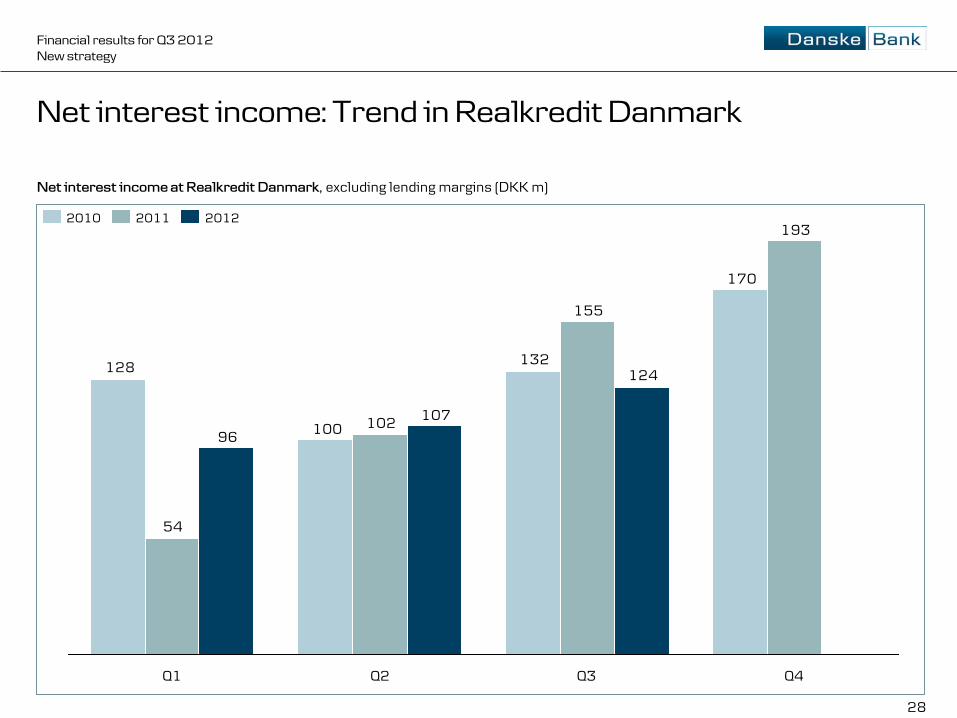
Net interest income: Trend in Realkredit Danmark
170
132
100
128
193
155
102
54
124
107
96
Q2 Q1 Q4 Q3
2011 2012 2010
Net interest income at Realkredit Danmark, excluding lending margins (DKK m)

29
Financial results for Q3 2012 New strategy
Expenses: Cost-savings programme on track
Expenses (DKK m) Quarterly change in expenses (DKK m)
Sales of leasing assets
Q3 12 6,116
Others
154
105
Holiday payments 257
Q2 12 6,632
Employees (number of FTEs)
20,651
21,32021,522
22,093
23,624
2011 2010 2008
-669
Q3 12 2009
9M 2012 9M 2011 Index Q3 2012 Q2 2012 Index
Expenses 19,598 19,528 100 6,116 6,632 92
Perf. based compensation 656 446 147 199 172 116
Severance payments etc. 590 209 282 227 303 75
Deposit guarantee scheme 77 962 - 43 -64 -
Asset write-down 463 113 410 0 0 -
Adjusted expenses 17,812 17,798 100 5,647 6,221 91

30
Financial results for Q3 2012 New strategy
Adjusted tax rate at 25%, but actual tax rate remains high owing to Ireland Actual and adjusted tax rates (DKK m)
* Permanent non-taxable differences are due primarily to value adjustments and the dividend from Nets. ** Taxes from previous years are due primarily to a reduction of the tax rate in the UK.
Q3 2012 Q2 2012 Q1 2012 Q4 2011 Q3 2011
Pre-tax profit 2,220 2,510 1,581 615 10
Pre-tax loss, Ireland core and non-core 1,374 1,616 1,371 1,524 1,490
Permanent non-taxable difference* -25 -93 34 -69 -8
Adjusted pre-tax profit, Group 3,569 4,034 2,986 2,070 1,492
Tax according to P&L 903 1,007 798 415 394
Taxes from previous years** -10 -22 -85 2 2
Adjusted tax 894 984 713 417 396
Adjusted tax rate 25.0% 24.4% 23.9% 20.1% 26.5%
Actual tax rate 40.7% 40.1% 50.5% 67.5% NM
31
Financial results for Q3 2012 New strategy
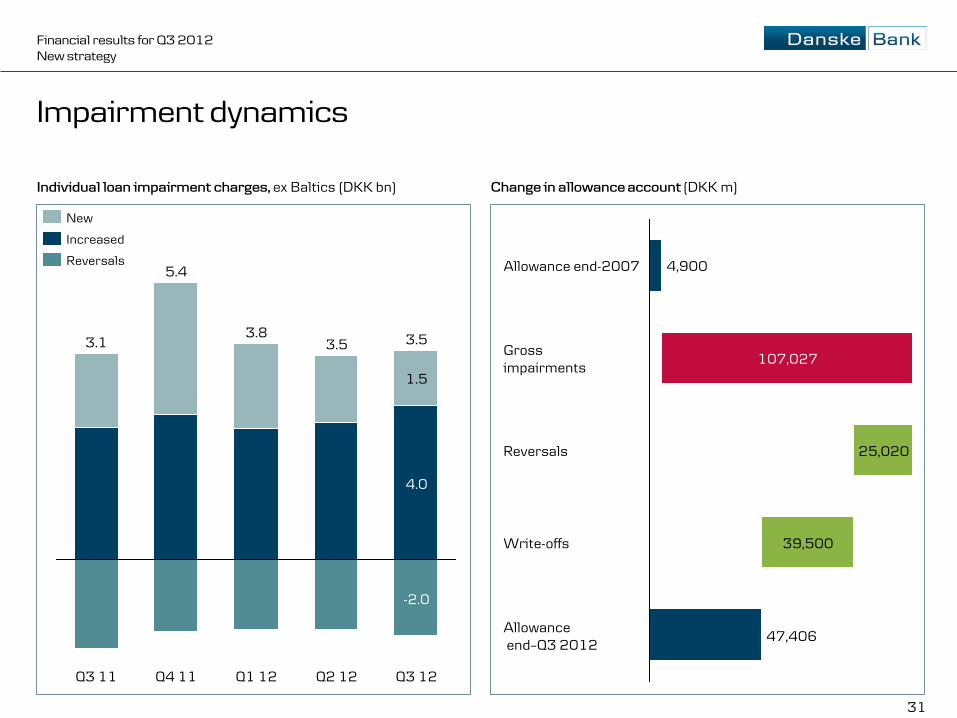
Impairment dynamics
Individual loan impairment charges, ex Baltics (DKK bn) Change in allowance account (DKK m)
Allowance end–Q3 2012
47,406
Write-offs 39,500
Reversals 25,020
Gross impairments
107,027
Allowance end-2007 4,900
Q3 12
3.5
-2.0
4.0
1.5
Q2 12
3.5
Q1 12
3.8
Q4 11
5.4
Q3 11
3.1
Increased
Reversals
New

32
Financial results for Q3 2012 New strategy
Loan quality
Coverage, individual allowance /impairment-tested loans (%) Impairment-tested loans (%)
7.0 Group 5.7
Non-core Ireland 64.1 68.1
CIB 5.1 4.8
Baltics 17.1 19.1
Ireland 9.2 13.9
Northern Ireland 18.4 18.9
Norway 2.6 3.2
Sweden 1.8 2.0
Finland 3.3 3.8
Denmark 4.9 5.8
Q3 12
Q2 12
31
31
34
33
63
52
47
35
56
40Group 37
Non-core Ireland 47
CIB 44
Baltics 48
Ireland 59
Northern Ireland 65
Norway 35
Sweden 32
Finland 30
Denmark 28
Q3 12
Q2 12
Note: Loans in rating categories 10 and 11 are subject to individual impairment testing. Q3 12 is excluding impaired portion. Rating category 10 contains exposures to customers which are not in default but for which evidence of impairment exists; rating category 11 contains exposures to customers in default.

33
Financial results for Q3 2012 New strategy
Retail Banking Denmark, including Realkredit Danmark
Loans by LTV and rating, Realkredit Danmark, end-Q3 2012 (%)
Portfolio facts, Realkredit Danmark, end-Q3 2012
398,045 loans (residential and commercial)
3,031 loans in 3- and 6-month arrears (0.8%)
157 repossessed properties
DKK 13 bn of loans with LTV > 100%, including DKK 3bn with
public guarantee
Average LTV ratio of 71%
LTV ratio on origination (legal requirement)
Residential: max. 80%
Commercial: max. 60%
Impairments at Retail Banking Denmark, Q3 2012 (DKK m)
Q310 Q111 Q311 Q112
1.0
0.8
0.6
0.4
0.6
Q312
1-month arrears, Realkredit Danmark (% of stock)
Rating 1-3 4-7 8-11 Total Public LTV ratio guarantee
0-20 7.5 22.0 3.8 33.3 0.4
20-40 5.2 18.7 3.4 27.4 0.4
40-60 3.4 14.5 2.9 20.7 0.4
60-80 1.8 8.9 1.9 12.6 0.4
80-100 0.7 2.9 0.7 4.3 0.4
>100 0.4 1.0 0.3 1.8 0.4
Total (DKK bn) 139 497 95 731 17
Individual Collective Total
Bank Personal customers 245 -4 241
Agriculture 44 -3 41
Commercial property 174 -154 21
Other 89 -19 71
Total 552 -179 373
RD Personal customers 119 -41 78
Commercial 294 -8 286
Total 413 -49 364
Retail Banking Denmark 965 -228 737

34
Financial results for Q3 2012 New strategy
Denmark, mortgage margins, 80 % LTV, owner occupied, (basis points)
Mortgages: More risk-sensitive pricing is the name of the game
52
73
81
98
106
All products Adjustable rate Fixed rate
+ 2
0 b
p pe
r re
finan
cing
+ 2
0 b
p pe
r re
finan
cing
Oct ‘12: with amortisation Oct ‘12: interest only 2011
2011-12 • Margin increase on personal
customers (Q1 12) • Refinancing fee of 5 bp at each
refinancing (introduced in Q4 11, booked as trading income)
July 2012 • Margin increase on loans with
LTV > 60% • Refinancing fee increased to
10 bp at each refinancing
October 2012 • Margin increase on loans with
LTV > 60% • Margin increase on interest only
loans with LTV > 60% • Refinancing fee increased to
20 bp at each refinancing
Margin increases

35
Financial results for Q3 2012 New strategy
Limited exposure to agriculture and shipping
Agriculture: breakdown of loan portfolio, Q3 2012 (%)
Agricultural exposure and allowance, Q3 2012 (DKK bn) Shipping exposure and allowance, Q3 2012 (DKK bn)
Shipping: breakdown of loan portfolio, Q3 2012 (%)
6
16
25
14
21
Pig farming 19
Cattle breeding
Agriculture Other
Mixed operations
Grocery trade
11
10
9
77 9
10
15
7
8
5
Other
Ro-Ro 2 Product tanker
Offshore supply
Offshore rig
Gas tanker
Dry bulk Cruise/Ferry
Crude tanker
Container
Chemical tanker Car carriers
Business unit Gross exposure
Allowance Coverage
CIB 43.7 1.6 3.8%
-portion from Danish customers 11.8 1.1 9.3%
-portion from Norwegian customers 13.1 0.2 1.4%
-portion from other customers 18.8 0.4 2.0%
Other business units 2.7 0.5 20.4%
Total exposure 46.3 2.2 4.7%
Business unit Allowance Coverage
Realkredit Danmark 45.7 0.4 0.9%
Retail Banking Denmark 11.1 2.5 22.2%
- portion from pig farmers 3.0 1.1 35.5%
Other business units 16.8 0.5 3.1%
Total exposure 73.6 3.4 4.6%
Gross exposure

36
Financial results for Q3 2012 New strategy
Denmark and Northern Ireland: Loan exposure
Note: Value of collateral is capped by size of loan and reflects a haircut of at least 20%. Impaired loans are individually impairment tested (rating categories 10 and 11). Rating category 10 contains exposures to customers which are not in default but for which evidence of impairment exists; rating category 11 contains exposures to customers in default.
Impaired loans
10.1
5.9
1.4
2.9
Gross exposure
519.0
Impaired loans
0.6
0.4
0.2
Gross exposure
16.6
Value of collateral
Individual impairments
Dividend
Denmark (DKK bn) Northern Ireland (DKK bn) Denmark (DKK bn) Northern Ireland (DKK bn)
Collective impairments 0.5 bn Impaired 2%
Collective impairments 0.0 bn Impaired 3%
Collective impairments 0.1 bn Impaired 14%
Collective impairments 0.2 bn Impaired 43%
Commercial property exposure Residential mortgage exposure
Impaired loans
4.8
1.9
3.0
Gross exposure
10.2
Impaired loans
16.7
8.4
3.4
4.9
Gross exposure
121.7

37
Financial results for Q3 2012 New strategy
Note: Value of collateral is capped by size of loan and reflects a haircut of at least 20%. Impaired loans are individually impairment tested (rating categories 10 and 11). Rating category 10 contains exposures to customers which are not in default but for which evidence of impairment exists; rating category 11 contains exposures to customers in default. *Number of arrears, excluding buy-to-let financing.
Collective impairments 0.1 bn Impaired 5%
Personal mortgages (DKK bn)
Collective impairments 0.4bn Impaired 12%
Ireland: Breakdown of loan portfolio
Arrears*, private customers (%)
Q2
12
3.4
10.9
Q4
11
Q2
11
Q4
10
Q2
10
Market
180+ days
91-180 days
Impaired loans
1.8
0.9
0.7
0.2
Gross exposure
15.6
Other (DKK bn)
Impaired loans
0.5
0.1
0.6
-0.2
Gross exposure
11.6
Collective impairments 0.4 bn Impaired 9%
-0.1
Impaired loans
2.3
1.1
1.3
Gross exposure
27.1
Total (DKK bn)
Value of collateral
Individual impairments
Dividend

38
Financial results for Q3 2012 New strategy
Non-core Ireland
Note: Value of collateral is capped by size of loan and reflects a haircut of at least 20%. Impaired loans are individually impairment tested (rating categories 10 and 11). Rating category 10 contains exposures to customers which are not in default but for which evidence of impairment exists; rating category 11 contains exposures to customers in default. * Consists primarily of consumer related industries.
Impaired loans
12.0
4.5
6.0
1.5
Gross exposure
14.4
Impaired loans
1.8
0.8
1.0
Gross exposure
8.9
Impaired loans
5.8
2.0
2.3
1.5
Gross exposure
7.8
Dividend
Value of collateral
Individual impairments
CRE (DKK bn) Personal mortgages (DKK bn) Other* (DKK bn)
Collective impairments 0.1 bn Impaired 83%
Collective impairments 0.3 bn Impaired 20%
Collective impairments 0.0 bn Impaired 75%
Collective impairments 0.4 bn Impaired 63%
Impaired loans
19.6
7.3
9.3
3.0
Gross exposure
31.1
Total (DKK bn)

39
Financial results for Q3 2012 New strategy
Update on conduits: Exposure and risk reduced in 2012
Credit exposure, rating categories, Q3 2012 (DKK bn)
Credit exposure, mortgages, Q3 2012 (DKK bn)
Gross credit exposure 2007-12 (DKK bn)
Credit exposure underlying asset class, Q3 2012 (DKK bn)
Q3 12
20
Q2 12
28
Q1 12
28
2011
31
2010
40
2009
48
2008
56
2007
62
Rating category 1-9
Rating category 10-11
011
1
23
2
4
6
111
23
2
4
6
1 9 8 7 6 5 4 3 2 11 10
Net Credit Exposure Gross Credit Exposure
6%
55%
7%
12%
20%
Non-prime residential mortgages
Corporate risk
Commercial mortgages
Other
Prime residential mortgages
5%
70%
1% 13%
11% Other, non-prime
NL, non-prime
NL, prime
UK, prime
UK, non-prime
Total: DKK 10.1 bn Total: DKK 19.7 bn

40
Financial results for Q3 2012 New strategy
Solid funding structure and liquidity position
Loan portfolio and long-term funding, Q3 2012 (DKK bn)
167
374
743
597
1211,700
729 Issued RD bonds RD mortgages
Covered bonds
Bank mortgages
Deposits
Bank loans
Senior debt
Funding
1,760
729
Loans 2031
2 1
2021
10
4
24
2018
26
41
52
2015
58
70
48
2012
3 1
9
2024
2 1 0
2027
1 0
Senior
Hybrid T1*
Subordinated T2*
Covered bonds
Maturing funding (DKK bn)
* Maturity calculated to first possible call.

41
Financial results for Q3 2012 New strategy
Well-diversified funding position
Funding sources (%)
57
12
7
6
6 25
293
Equity Central banks
Subordinated debt
Repos
Banks
S-T bonds 1
L-T bonds
Covered bonds Match-funded
DK mortgage bonds
Deposits
Funding position Q3 12(%)
30
20
10
0
Sha
reho
lder
s’ e
q.
Sub
ord.
deb
t
Long
-ter
m b
onds
Cov
. bon
ds
Mor
tgag
e fin
ance
(m
atch
fund
ed)
Dep
osit
s
Sho
rt-t
erm
bon
ds
Rep
os
Due
to c
redi
t in
st.
(ex
CIB
)
Cen
tral
ban
ks
40
Q4 11
Q3 12
Short-term funding Long-term funding

42
Financial results for Q3 2012 New strategy
Danske Bank’s long term issuer rating
Danske Bank’s ratings
Rating agency issues
Moody’s S&P Fitch
Aaa AAA AAA
Aa1 AA+ AA+
Aa2 AA AA
Aa3 AA- AA-
A1 A+ A+
A2 A A
A3 A- A-
Baa1 BBB+ BBB+
Baa2 BBB BBB
Baa3 BBB- BBB-
… … …
Ca D D
General focus
• Profitability: a sustainable improvement in net profit will be positive
• Asset quality: a significant decrease in non-performing loans, impairments and actual losses will be positive
• Macroeconomic environment: an improvement of the economic conditions in Denmark and Ireland will be positive
Standard & Poor’s
• Capital strength: quality of current capital is good, but a RAC ratio sustainable above 7 % will have a positive effect on the rating (Q4 2011 level of 6.3%)
Moody’s
• Liquidity: refinancing risks in the Danish mortgage system creates an instability in the Danish housing market
• Systemic support: only 1 notch uplift for Danske Bank, Swedish peers have 3 notches of uplift

43
Financial results for Q3 2012 New strategy
Three different methods to rate banks
+ + = =
Bank Financial Strength
Rating
Baseline Credit
Assess- ment (BCA)
Parental and Cooperative
support
Adjusted
BCA
Systemic Support
Issuer Rating
Anchor SACP*
Business position
Capital & Earnings
Risk position
Funding & Liquidity
SACP Extraord. Support
Issuer rating
+ = + = + + +
C- Baa2 0 notches Baa2 1 notch Baa1
BBB+ +1 notch -1 notch -1 notch 0 notches
BBB 2
notches A-
Individual rating/Viability rating
Support rating/support rating floor
Issuer Default Rating (IDR)
IDR is the higher of the Viability Rating and the support floor
a
A-
A
Rating method Danske Bank’s rating
* Stand-alone credit profile (SACP)

44
Financial results for Q3 2012 New strategy
Retail Banking Denmark: Higher NII owing to several margin increases, but higher impairments reduce the result Income statement (DKK m) Trend in lending volume, average (DKK bn)
Margin trends, ex RD (%) Market shares, incl. CIB and repo lending*, ex RD (%)
* Danske Markets.
20
24
28
32
36
Q312 Q212 Q112 Q411 Q311
Deposits Lending
0
1
2
3
4
Q312 Q212 Q112 Q411 Q311
Deposits Lending
548550555558559
383385386390391
Q312 Q212 Q112 Q411 Q311
-2%
-2%
Corporate Retail 9M 2012 9M 2011 Index
Net interest income 9,387 9,097 103
Net fee income 2,408 2,400 100
Other income 695 808 86
Total income 12,490 12,305 102
Total expenses 6,813 6,523 104
Profit bef. loan imp. charges 5,677 5,782 98
Loan impairment charges 3,027 2,649 114
Profit before tax 2,650 3,133 85
ROE before loan imp. charges 16.9 18.3

45
Financial results for Q3 2012 New strategy
Retail Banking Finland: Visible increase in net interest income, but low result because of low margins and higher loan losses
Trend in lending volume, average (DKK bn)
Margin trends (%) Market shares, incl. CIB (%)
10
12
14
Q312 Q212 Q112 Q411 Q311
0.9
0.6
0.3
0.0 Q312 Q212 Q112 Q411 Q311
Deposits Lending Deposits Lending
1011001009896
5151505050
+3%
+5%
Q312 Q212 Q112 Q411 Q311
Corporate Retail
Income statement (DKK m)
9M 2012 9M 2011 Index
Net interest income 1,650 1,531 108 Net fee income 815 741 110 Other income 240 385 62 Total income 2,705 2,657 102 Total integration expenses 315 395 80 Expenses ex total intgr. exp. 1,902 1,976 96 Profit bef. loan imp. charges 488 286 171 Loan impairment charges 309 57 -Profit before tax 179 229 78
325,809 ROE before loan imp. charges 9.2 6.1

46
Financial results for Q3 2012 New strategy
Retail Banking Sweden: High return held up by 19 % increase in net interest income partly due to stronger SEK
6.0
5.5
5.0
4.5
4.0 Q312 Q212 Q112 Q411 Q311
1.5
1.0
0.5
0.0 Q312 Q212 Q112 Q411 Q311
Deposits Lending Deposits Lending
928686838210399100101100
+3%
+12%
Q312 Q212 Q112 Q411 Q311
Corporate Retail
Trend in lending volume, average (DKK bn)
Margin trends (%) Market shares, incl. CIB (%)
Income statement (DKK m)
9M 2012 9M 2011 Index
Net interest income 2,082 1,754 119
Net fee income 415 452 92
Other income 140 159 88
Total income 2,637 2,365 112
Expenses 1,260 1,256 100
Profit bef. loan imp. charges 1,377 1,109 124
Loan impairment charges 315 47 -
Profit before tax 1,062 1,062 100
ROE before loan imp. charges 17.1 15.0

47
Financial results for Q3 2012 New strategy
Retail Banking Norway: Solid increase in total income; pre-tax profit more than doubles as impairments losses decline
6
5
4 Q312 Q212 Q112 Q411 Q311
1.5
1.0
0.5
0.0 Q312 Q212 Q112 Q411 Q311
81787774716160585860
Q312 Q212 Q112 Q411 Q311
+1%
+13%
Corporate Retail
Deposits Lending Deposits Lending
Trend in lending volume, average (DKK bn)
Margin trends (%) Market shares, incl. CIB (%)
Income statement (DKK m)
9M 2012 9M 2011 Index
Net interest income 1.544 1.149 134
Net fee income 226 187 121
Other income 538 554 97
Total income 2.308 1.890 122
Expenses 1.365 1.358 101
Profit bef. loan imp. charges 943 532 177
Loan impairment charges 155 271 57
Profit before tax 788 261 302
ROE before loan imp. charges 16,1 10,4

48
Financial results for Q3 2012 New strategy
Banking Activities Northern Ireland: Moving in the right direction with higher income and lower impairments
* Corporate lending volume excludes lending to public sector. Volume positive affected by currency change
Q212 Q112 10
Q312
40
30
20
Q411 Q311
3
2
1
0 Q312 Q212 Q112 Q411 Q311
1817171616
25252525 25
-2%
+14%
Q311 Q112 Q312 Q212 Q411
Corporate Retail
Deposits Lending Corporate Retail
Trend in lending volume*, average (DKK bn)
Margin trends (%) Market shares (%)
Income statement (DKK m)
9M 2012 9M 2011 Index
Net interest income 916 845 108
Net fee income 277 231 120
Other income 92 103 89
Total income 1,285 1,179 109
Expenses 807 842 96
Profit bef. loan imp. charges 478 337 142
Loan impairment charges 1,120 1,654 68
Profit before tax -642 -1,317 -
ROE before loan imp. charges 31.0 21.2

49
Financial results for Q3 2012 New strategy
Banking Activities Ireland: Still higher expenses owing to restructuring of the continuing business
181717
2727
799
3740
Q312 Q212 Q112 Q411 Q311
-82%
-33%
Corporate Retail
2
1
0 Q312 Q212 Q112 Q411 Q311
4
3
2
1 Q312 Q212 Q112 Q411 Q311
Deposits Lending Deposits Lending
Trend in lending volume, end of period (DKK bn)
Margin trends (%) Market shares (%)
Income statement (DKK m)
Note: Figures from Q4 2011 and back are not restated after non-core split-up from Banking Activities Ireland.
9M 2012 9M 2011 Index
Net interest income 300 686 44
Net fee income 62 48 129
Other income 31 35 89
Total income 393 769 51
Expenses 583 532 110
Profit bef. loan imp. charges -190 237 -
Loan impairment charges 559 4,711 12
Profit before tax -749 -4,474 -
ROE before loan imp. charges -17.0 10.0

50
Financial results for Q3 2012 New strategy
Non-core Ireland: Dominated by high impairments
899
222727
-19%
-17%
Q312 Q212 Q112 Q411 Q311
Corporate
Retail
Trend in lending volume, end-of-period (DKK bn)
Margin trends (%) Portfolio breakdown, Q3 2012(%)
Income statement (DKK m)
Note: Figures from Q4 2011 and back are not restated after non-core split-up from Banking Activities Ireland.
Q312
0.1
1.4
Q212
0.6
1.5
Q112
0.5
1.6
Q411 Q311
Deposits
Lending
Included in BA Ireland
25%
29%
46%
Other
Personal mortgages
CRE
Included in BA Ireland
9M 2012 9M 2011 IndexNet interest income 298 - -Net fee income 2 - -Other income 3 - -Total income 303 - -Expenses 176 - -Profit bef. loan imp. charges 127 - -Loan impairment charges 3,740 - -Profit before tax -3,613 - -

51
Financial results for Q3 2012 New strategy
Banking Activities Baltics: Higher income and impairment reversals raise pre-tax profit by 60 %
Market shares, lending (%)
1111121212
78889
-10%
-19%
Q312 Q212 Q112 Q411 Q311
Corporate Retail
0
1
2
3
Q312 Q212 Q112 Q411 Q311
12
9
6
3
0 Q312 Q212 Q112 Q411 Q311
Deposits Lending Lithuania Latvia Estonia
Trend in lending volume, average (DKK bn)
Margin trends (%)
Income statement (DKK m)
9M 2012 9M 2011 Index
Net interest income 357 363 98
Net fee income 114 109 105
Other income 103 72 143
Total income 574 544 106
Expenses 267 264 101
Profit bef. loan imp. charges 307 280 110
Loan impairment charges -395 -156 -
Profit before tax 702 436 161
ROE before loan imp. charges 31.8 28.7

52
Financial results for Q3 2012 New strategy
CIB: Solid NII growth but significantly higher loan losses, mainly from shipping
Trend in lending volume, average (DKK bn)
Geographical breakdown of lending, Q3 2012 (%)
110109108107103
Q312 Q212 Q112 Q411 Q311
1.6
Q312
1.2
0.8
0.4
0.0 Q212 Q112 Q411 Q311
Deposits Lending
20
15
36
30
Sweden
Finland
Norway
Denmark
Margin trends (%)
Income statement (DKK m)
9M 2012 9M 2011 Index
Net interest income 1,584 1,483 107 Net fee income 573 604 95 Other income 78 127 61 Total income 2,235 2,214 101 Total integration expenses 18 92 20 Expenses ex total intgr. exp. 766 721 106 Profit bef. loan imp. charges 1,451 1,401 104 Loan impairment charges 1,054 95 -Profit before tax 397 1,306 30
ROE before loan imp. charges 15.5 16.8

53
Financial results for Q3 2012 New strategy
Danske Markets & Treasury: Solid earnings due to high activity including Q3
Impairments (DKK m)
-750
-65
52
-27
Q112 Q411
-52
Q311 Q312 Q212
Trading income split, Q3 2012 Income statement (DKK m)
Trading activities , accumulated income (DKK bn)
8,000
6,000
4,000
2,000
0
2012 2011 2010
Q4 Q3 Q2 Q1
42
95
43
Equities
Bonds & DCM
Repos & derivatives
FX & money market 9M 2012 9M 2011 IndexDanske Markets 6,775 3,877 175 Group Treasury -220 593 -Total income 6,555 4,470 147 Expenses 2,297 1,968 117 Profit bef. loan imp. charges 4,258 2,502 170 Loan impairment charges -40 -981 -Profit before tax 4,298 3,483 123
ROE before loan imp. charges 45.5 40.3

54
Financial results for Q3 2012 New strategy
Danske Capital: Lower fee income owing to change in asset mix and one-offs; margins remain flattish
AuM – customer breakdown (DKK bn)
AuM – asset breakdown (%)
* Retail includes Danske Invest. ** Margin for asset management is adjusted income, including performance fees, divided by business volume, end of period.
30
Q212 Q112 Q411 Q311
4
Q312
66
Bonds Equities Cash
201
Q212 Q112 Q411 Q311
191
Q312
16
258
Life insurance Retail* Institutional Private equity
0.4
0.3
0.2
0.1
0.0 Q312 Q212 Q112 Q411 Q311
Margin trends** (%)
Income statement (DKK m)
9M 2012 9M 2011 Index
Net interest income 87 88 99
Net fee income 1.208 1.229 98
- portion from performance fees 10 17 -
Other income 30 49 61
Total income 1.325 1.366 97
Expenses 774 780 99
Profit bef. loan imp. charges 551 586 94
Loan impairment charges 8 -47 -
Profit before tax 543 633 86

55
Financial results for Q3 2012 New strategy
-100%
-50%
0%
50%
100%
-2.00% -1.00% 0.00% 1.00% 2.00%
Danica Pension: Strong investment result and partially booked risk allowance
48 70 68 73
19
6 6
High
10
14
3
Medium
9
17
Low
10
14
New schemes
12
21
Investment allocation for Danica Traditionel, end-Q3 2012 (%) Income statement (DKK m)
Possibility of booking risk allowance in 2012*, end-Q3 2012 (%)
No risk allowance
Partial risk allowance
Full risk allowance
% c
hang
e in
equ
itie
s
% point change in interest rate
* Under assumption of a rolling yield spread of 0 between Danish and German government bonds at the end of 2012.
Credit bonds Bonds Equities Property 9M 2012 9M 2011 Index
Premiums (bn) 18.4 20.0 92
Danica Traditionel (insurance result) 950 822 116
Unit-linked (insurance result) 267 245 109
Health and accident (ins. result) -94 33 -
Investment result 435 345 126
Financing result -73 -126 -
Special allotments -69 -150 -
Net income bef. postp. risk allow. 1,416 1,169 121
Change in shadow account -106 -1,576 -
Net income 1,310 -407 -

56
Financial results for Q3 2012 New strategy
Danica Pension’s profit model
Profit model Condition/ sensitivity Q1-Q3 2012 DKK m
Danica Traditionel. Mainly risk allowance 69 bp of technical provisions (DKK 173 bn)
Can be booked only if investment return is high enough and if no use of bonus potential of paid-up policies
Risk allowance Other
1,008 -58
Unit-linked business. Long-term: approximately 0.4% of AuM
Prices and volume Solid income base but also price competition
267
Health and accident business Combined ratio Price competition -94
Return on investment portfolio at shareholders’ risk
Equity markets, interest rates Annualised investment return: 3.6%
435
Financing result
S-T interest rate (equity – allocated capital)
Low short-term interest rate -73
Special allotments, depending on profit and business volume
Expected to be around DKK 0.1 billion in 2012 if investment return is at normal level
-69
Shadow account Uncertainty because of dependency on investment return for the rest of the year
-106
Total 1,310
+
1
2
3
4
5
6
+
+
+
=
+
7
+
∑

57
Financial results for Q3 2012 New strategy
Disclaimer
Important Notice
• This presentation does not constitute or form part of and should not be construed as, an offer to sell or issue or the solicitation of
an offer to buy or acquire securities of Danske Bank A/S in any jurisdiction, including the United States, or an inducement to enter into investment activity. No part of this presentation, nor the fact of its distribution, should form the basis of, or be relied on in connection with, any contract or commitment or investment decision whatsoever. The securities referred to herein have not been, and will not be, registered under the Securities Act of 1933, as amended (“Securities Act”), and may not be offered or sold in the United States absent registration or an applicable exemption from the registration requirements of the Securities Act.
• This presentation contains forward-looking statements that reflect management’s current views with respect to certain future events and potential financial performance. Although Danske Bank believes that the expectations reflected in such forward-looking statements are reasonable, no assurance can be given that such expectations will prove to have been correct. Accordingly, results could differ materially from those set out in the forward-looking statements as a result of various factors many of which are beyond Danske Bank’s control.
• This presentation does not imply that Danske Bank has undertaken to revise these forward-looking statements, beyond what is required by applicable law or applicable stock exchange regulations if and when circumstances arise that will lead to changes compared to the date when these statements were provided.