Expert System for Modelling Stopover Site Selection by ...
23
1 Expert System for Modelling Stopover Site Selection by Barnacle Geese 1 2 Mitra Shariati a, *, Andrew K. Skidmore a , Roshanak Darvishzadeh a , Klaus-Michael Exo b , 3 Andrea Kölzsch c,d , Larry Griffin e , Julia Stahl f , David Cabot g , Albertus G. Toxopeus a 4 a Faculty of Geo-Information Science and Earth Observation (ITC), University of Twente, 5 Enschede, The Netherlands 6 b Institute of Avian Research, Wilhelmshaven, Germany 7 c Max Plank Institute for Ornithology, Department of Migration and Immuno-Ecology, 8 Vogelwarte Radolfzell, Germany 9 d Department of Animal Ecology and Project group Movement Ecology, Netherlands Institute of 10 Ecology (NIOO-KNAW), Wageningen, The Netherlands 11 e Wildfowl & Wetlands Trust, Slimbridge, Gloucestershire, UK 12 f Sovon Dutch Centre for Field Ornithology, Nijmegen, The Netherlands 13 g Environmental Consultancy Services, Carrigskeewaun, Carrowniskey, Westport, Co. Mayo, 14 Ireland 15 * Corresponding author: 16 E-mail address; [email protected] 17 Phone number: +31 (0)644367861 18 Fax number: +31 (0)53 487 44 00 19 Postal address: PO Box 217 7500 AE Enschede, The Netherlands 20 Email addresses: [email protected]; [email protected]; [email protected]; 21 [email protected]; [email protected]; [email protected]; [email protected]; 22 [email protected] 23 24
Transcript of Expert System for Modelling Stopover Site Selection by ...

1
Expert System for Modelling Stopover Site Selection by Barnacle Geese 1
2
Mitra Shariati a,
*, Andrew K. Skidmore a, Roshanak Darvishzadeh
a,
Klaus-Michael Exo
b, 3
Andrea Kölzsch c,d
, Larry Griffin e, Julia Stahl
f, David Cabot
g, Albertus G. Toxopeus
a 4
a Faculty of Geo-Information Science and Earth Observation (ITC), University of Twente, 5
Enschede, The Netherlands 6
b Institute of Avian Research, Wilhelmshaven, Germany 7
c Max Plank Institute for Ornithology, Department of Migration and Immuno-Ecology, 8
Vogelwarte Radolfzell, Germany 9
d Department of Animal Ecology and Project group Movement Ecology, Netherlands Institute of 10
Ecology (NIOO-KNAW), Wageningen, The Netherlands 11
e Wildfowl & Wetlands Trust, Slimbridge, Gloucestershire, UK 12
f Sovon Dutch Centre for Field Ornithology, Nijmegen, The Netherlands 13
g Environmental Consultancy Services, Carrigskeewaun, Carrowniskey, Westport, Co. Mayo, 14
Ireland 15
*Corresponding author: 16
E-mail address; [email protected] 17
Phone number: +31 (0)644367861 18
Fax number: +31 (0)53 487 44 00 19
Postal address: PO Box 217 7500 AE Enschede, The Netherlands 20
Email addresses: [email protected]; [email protected]; [email protected]; 21
[email protected]; [email protected]; [email protected]; [email protected]; 22
24
2
Abstract 25
The study of stopover sites has received a lot of attention in avian ecology, being especially 26
important for many long-distance migrants, some of which have to pause several times during 27
migration. The survival of many migratory birds depends primarily on food availability at these 28
stopovers. However, previous studies show that there is a lack of knowledge about site selection 29
where migratory birds stop to refuel energy stores. In the present study, a Bayesian expert system 30
has been used to incorporate environmental parameters, to determine their relationship with the 31
presence of barnacle geese at stopover sites. Data on stopover sites was obtained from satellite-32
tracked barnacle geese (Branta leucopsis) for three different breeding populations in the Western 33
Palearctic (i.e. Russian, Svalbard and Greenland). The results from the present study showed that 34
the posterior probability of presence at the stopover sites obtained from the Bayesian model was 35
close to one. Therefore, the Bayesian expert system detected the stopover sites of the geese 36
correctly and can be used as a proper method for modelling the presence of barnacle geese at the 37
stopover sites in the future. This study introduces a new method into movement ecology to 38
identify and predict the importance of different environmental parameters for stopover site 39
selection by migratory geese. This is particularly important from both a conservation and an 40
agro-economic point of view with the goal of reducing possible conflicts between geese and 41
agricultural interests. 42
Keywords: Foraging habitat, GPS locations, human disturbance, roosting areas, site safety 43
44
45
46
47
48
49

3
1. Introduction 50
Stopovers are places along a migration route where birds mostly rest and forage to replenish 51
energy reserves before continuing their journeys (Newton, 2008). Having such breaks during 52
migration is especially important for Arctic-nesting geese as many of them are partial capital 53
breeders and may bring body stores to the breeding grounds, in order to survive initial adverse 54
conditions and produce a clutch of eggs soon after arrival (Gauthier et al., 2003). However, there 55
is a lack of knowledge about the selection of these sites, where birds choose to stop and forage 56
(Newton, 2008). 57
Habitat selection is greatly influenced by a variety of environmental parameters, which includes 58
food availability and the costs related to predation or disturbance risks, e.g. from farmers, as well 59
as inter- and intra-specific competition (Chudzińska et al., 2015). Since, herbivore species follow 60
peaks in the availability of high-quality forage, it is presumed that variation in this resource 61
drives annual migration (Owen, 1980; Shariatinajafabadi et al., 2014; van der Graaf et al., 2006). 62
Sites selected by the geese were generally located in a lowland region and far from woodland 63
edges, possibly to minimize predation risk (Jankowiak et al., 2008; Roder et al., 2008; Rosin et 64
al., 2012). Moreover, geese prefer large fields that are remote from human settlements (Rosin et 65
al., 2012). The negative impact of human settlements on foraging sites has been attributed by 66
farmers, domestic dogs, foxes, traffic volumes and windfarms (for more information see Jensen 67
et al., 2008; Keller, 1991; Langston, 2013; Rosin et al., 2012) 68
Lakes and coastal waters are usually used by geese as roosting and daily resting sites during 69
migration (Rosin et al., 2012). Distance to open water (i.e. sea or lakes) is related to energy 70
expenditure as geese must use additional energy to move from a roosting site to a distant 71
foraging site. It is also shown in studies that goose occurrence declined significantly with the 72
4
increase in distance from feeding sites to open water (Jensen et al., 2008). Therefore, geese 73
primarily use fields that are closer to roosting sites (e.g. Jensen et al., 2008). 74
It is seen that effective conservation and management of migratory birds, requires species 75
distributional data to determine the distribution of stopovers and the pathways used between 76
them (Faaborg et al., 2010). It is recommended that specific attention should be given to stopover 77
sites, as the functional role of a given stopover site in meeting the needs of migrants is highly 78
dynamic with respect to resource availability, landscape context, the physiological condition of 79
the migrants and mortality risks (Mehlman et al., 2005). Moreover, recent technological 80
advances, such as satellite tracking, allow to track birds throughout the annual cycle, determine 81
their migratory routes and map the often remote stopovers with great accuracy (Klaassen et al., 82
2014; Pedrana et al., 2015). For instance, the migration routes and location of stopover sites of 83
bar-headed geese (Anser indicus) in China (Guo-Gang et al., 2011) and Svalbard barnacle geese 84
has been determined (Griffin, 2008) with the use of satellite tracking. 85
Moreover, species distribution modelling (SDM) has been widely applied to quantify the 86
relationship between species distribution and environmental parameters and to predict species’ 87
occurrence across un-sampled areas (Guisan and Thuiller, 2005; Miller, 2010). Currently, a 88
variety of statistical models are being used for modelling species distributions (see review by 89
Guisan and Thuiller, 2005). However, an intensive field survey for generating in-situ data is 90
costly in terms of time and resources (James et al., 2001). In such cases, expert knowledge can 91
be a less expensive source of information where there is insufficient field data for remote 92
breeding and wintering areas (Murray et al., 2009). In addition, Bayesian statistics provide a 93
mechanism to incorporate such knowledge into species distribution models (Choy et al., 2009). 94
With the use of a priori probability of occurrence (prior knowledge), conditional to the value of 95

5
each environmental parameter (likelihood function) which is obtained based on experts’ rules, 96
the Bayesian expert system could be formulated (Skidmore, 1989). 97
Bayesian method has been argued to be advantageous over frequentist statistics and its use in 98
ecological studies has been encouraged (Ellison, 1996). For instance, the Bayesian method has 99
the ability to incorporate various kinds of uncertainty into the analysis (e.g. uncertainty of the 100
estimate) even for unknown parameters (Taylor et al., 1996). Moreover, the results that are 101
presented in Bayesian frameworks can be understood more easily by decision-makers. Also, 102
additional environmental parameters can be quickly incorporated into a Bayesian expert system 103
as data layers and the posterior probability can be kept updated (Skidmore, 1989; Wade, 2000). 104
However, despite the beneficial aspects of using the Bayesian method, it has been used relatively 105
rarely in ecological studies (McCarthy, 2007). 106
The Bayesian approach can also be applied in habitat distribution modelling (Guisan and 107
Zimmermann, 2000; Niamir et al., 2011). Aspinall (1992) applied a GIS-based Bayesian 108
modelling method for predicting the spatial distribution of red deer (Cervus elaphus) in Scotland. 109
Moreover, Kynn (2005) also incorporated expert knowledge as prior knowledge, to a Bayesian 110
logistic regression for modelling species habitat distribution. Nevertheless, as far as we know, 111
this method has never been used to model stopover selection of migratory birds. 112
The present study investigates stopover behaviour of 37 satellite-tracked barnacle geese from 113
three different populations in the Western Palearctic, transiting between temperate and high 114
Arctic latitudes. Considering the practical advantages of Bayesian statistics, such as taking 115
uncertainty into account and simplicity in explaining the results (Wade, 2000) we were interested 116
to assess, whether a Bayesian expert system can appropriately model stopover site selection of 117
barnacle geese during spring migration, by utilizing the detailed knowledge of goose ecologists. 118
6
2. Material and Method 119
2.1. Satellite tracking data and stopover sites 120
Barnacle geese from three long-distance migratory populations in the Western Palearctic (Russia, 121
Svalbard and Greenland) were captured at their overwintering sites and equipped with solar 122
GPS/ARGOS transmitters attached to the back of the birds, using a nylon elasticated harness. 123
The transmitters used in this study were 30g Solar GPS 100 PTT (PTT-platform transmitter 124
terminal; Microwave Telemetry, Inc., Columbia, MD, USA) for the Russian birds and a mix of 125
30g and 45g PTTs for the Svalbard and Greenland birds (Table 1). In total 30 full data tracks for 126
12 individuals of the Russian population (2008-2011), 20 full data tracks for 18 individuals of 127
the Svalbard population (2006-2011) and 7 full data tracks for 7 individuals of the Greenland 128
population (2008-2010) were collected during spring migration (Table 1). The barnacle goose 129
tracking data has been stored in Movebank (www.movebank.org: Russian population: 130
‘‘Migration timing in barnacle geese (Barents Sea), data from Kölzsch et al. 2015 and 131
Shariatinajafabadi et al. 2014’’, DOI:10.5441/001/1.ps244r11 (ii) Svalbard population: 132
‘‘Migration timing in barnacle geese (Svalbard), data from Kölzsch et al. 2015 and 133
Shariatinajafabadi et al. 2014’’, DOI:10.5441/001/1.5k6b1364 (iii) Greenland population: 134
‘‘Migration timing in barnacle geese (Greenland), data from Kölzsch et al. 2015 and 135
Shariatinajafabadi et al. 2014’’, DOI:10.5441/001/1.5d3f0664. 136
For each GPS track, stopover sites were defined as an area where the geese would remain within 137
a radius of 30 km for at least 48 h (for more information see Shariati-Najafabadi et al., 2015). In 138
total, 64 stopover sites were identified along the Russian flyway (2008-2011), 32 along the 139
Svalbard flyway (2006-2011), and 14 along the Greenland flyway (2008-2010) for 12, 18 and 7 140
geese, respectively, during the spring migration (see Table 1 and Figure 1). Also, from the 141
Russian and Svalbard barnacle geese that were tracked for more than 1 year, only two 142

7
individuals have occupied the same stopover sites from year to year. Nevertheless, none of them 143
arrived at this stopover sites and breeding sites on the same date as in other years. 144
Table 1. Bird ID, tracking year for spring migration and the number of stopover sites for 12 Russian 145 barnacle geese from 2008 to 2011, 18 Svalbard barnacle geese from 2006 to 2011 and 7 Greenland 146 barnacle geese from 2008 to 2010. 147
148
Russian population (n=12) Svalbard population (n=18) Greenland population (n=7)
Bird ID Track year No. of
stopover
sites
(sum=64)
Bird ID Track year No. of
stopover
sites
(sum=32)
Bird ID Track year No. of
stopover
sites
(sum=14)
78033 2009-2011 3 33103 2011 1 65698 2009 2
78034 2009-2011 4 33953 2010 2 70563 2010 2
78035 2009-2011 3 33954 2010 1 78199 2010 2
78036 2009-2010 3 64685 2006 1 78207 2008 2
78037 2009 2 64687 2006-2007 2 78208 2008 2
78039 2009-2011 7 70564 2007 1 78209 2008 1
78041 2008-2010 6 70565 2007 1 78210 2008 3
78043 2008-2010 10 70566 2007 1
78044 2008-2010 10 70567 2007 1
78045 2008 4 70618 2007 1
78046 2008-2009 2 70619 2007 2
78047 2008-2010 10 78198 2008 5
78378 2008-2009 3
86824 2009 1
86828 2009 1
170563 2007 3
178199 2008 3
186827 2009 2
149
150

8
151
Figure 1. The blue, green and red arrows show spring migration routes from wintering to breeding sites 152 for the Russian, Svalbard and Greenland barnacle goose populations, respectively. The black triangles, 153 squares, and circles denote the stopover sites for 12 Russian geese from 2008 to 2011, 18 Svalbard geese 154 from 2006 to 2011 and 7 Greenland geese from 2008 to 2010, respectively. 155
2.2. Environmental parameters 156
A set of environmental parameters known to be important in determining stopover selection of 157
barnacle geese have been reviewed (Amano et al., 2006; Jensen et al., 2008; Rosin et al., 2012; 158
Si et al., 2011). The selected parameters have been categorized into four groups based on Rosin 159
et al. (2012): human disturbance (1), site safety (2), distance from the roosting area (3) and the 160
foraging habitat (4) (Table 2). Distance to roads, cities, towns and wind farms were used as 161
indicators of human disturbance, distance to the forest as an indicator of site safety from 162

9
predators, and distance to river, inland water and ocean as the proximity to roosting areas. The 163
maps of roads, cities, town, rivers, ocean area and inland waters were derived from ESRI (2016), 164
and the wind farm data was obtained from “The wind power (2016). 165
Also, in the present study, factors like the site elevation, greenness factor, percentage of 166
grassland/cropland, percentage of salt marsh and snow cover, at each stopover site were used to 167
describe foraging habitat. Study involved extracting site elevation from a digital elevation model 168
(DEM) generated by Global Multi-resolution Terrain Elevation Data 2010 (GMTED2010) at 7.5-169
arc-second (225 meters) resolution. The greenness factor, which is referred to as the satellite-170
derived “green wave index” (GWI) (Shariatinajafabadi et al., 2014) was calculated from the 171
MODIS 16-day composite NDVI dataset (MOD13A2) with a 1 km spatial resolution for the 172
period from 2006 to 2011 (Beck et al., 2008; Huete et al., 2002; Shariati-Najafabadi et al., 2015). 173
In addition, the study analysis included extracting the land cover types (i.e. forest, grassland/ 174
cropland and salt marsh) from Envisat’s Medium Resolution Imaging Spectrometer 175
(http://www.esa.int) and measuring the percentage of each land cover at each stopover site. The 176
percentage of snow cover (April-Jun) was obtained from MODIS/Terra Snow Cover Daily L3 177
Global for each 0.05 degree grid cell (c. 5 km by5 km). Raster data were converted to vector, and 178
the parameters have been extracted from a 15 km radius around each stopover site, which is the 179
distance of the foraging range for barnacle geese (Pendlebury et al., 2011). The study analysis 180
was performed using ArcGIS ver. 10.3.1 and ENVI-IDL ver. 5.3. 181
182
183
184
185
10
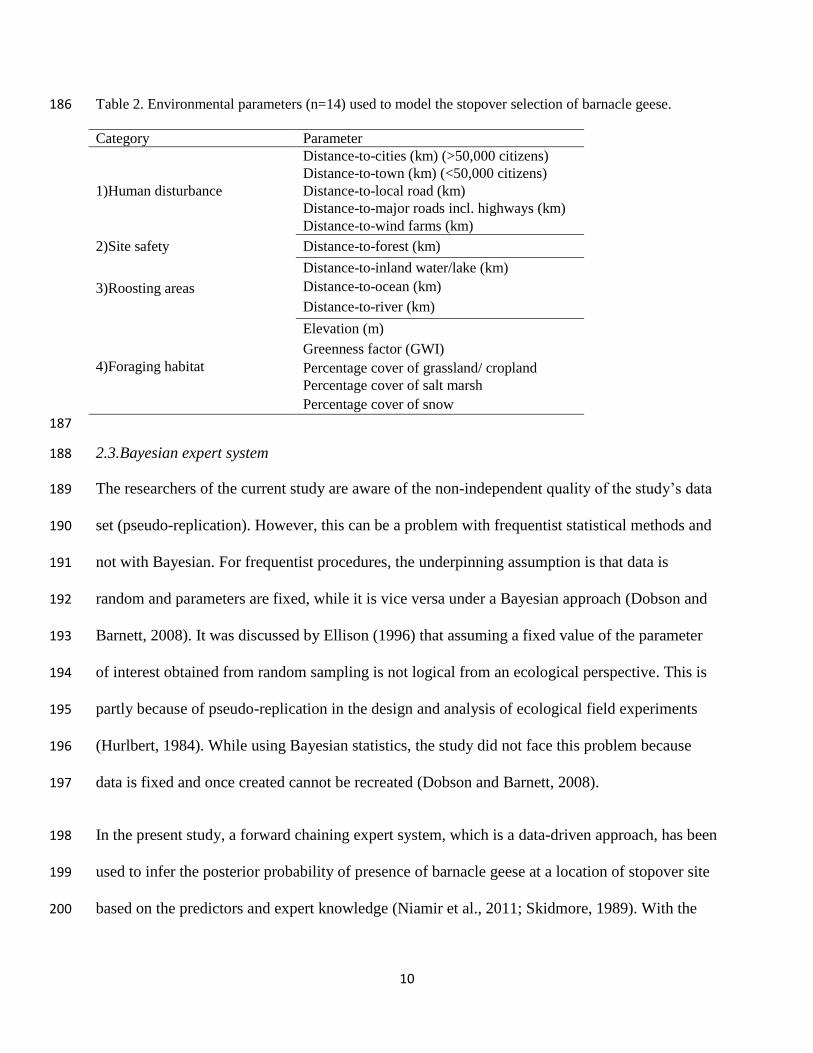
Table 2. Environmental parameters (n=14) used to model the stopover selection of barnacle geese. 186
Category Parameter
1)Human disturbance
Distance-to-cities (km) (>50,000 citizens)
Distance-to-town (km) (<50,000 citizens)
Distance-to-local road (km)
Distance-to-major roads incl. highways (km)
Distance-to-wind farms (km)
2)Site safety Distance-to-forest (km)
3)Roosting areas
Distance-to-inland water/lake (km)
Distance-to-ocean (km)
Distance-to-river (km)
4)Foraging habitat
Elevation (m)
Greenness factor (GWI)
Percentage cover of grassland/ cropland
Percentage cover of salt marsh
Percentage cover of snow
187
2.3.Bayesian expert system 188
The researchers of the current study are aware of the non-independent quality of the study’s data 189
set (pseudo-replication). However, this can be a problem with frequentist statistical methods and 190
not with Bayesian. For frequentist procedures, the underpinning assumption is that data is 191
random and parameters are fixed, while it is vice versa under a Bayesian approach (Dobson and 192
Barnett, 2008). It was discussed by Ellison (1996) that assuming a fixed value of the parameter 193
of interest obtained from random sampling is not logical from an ecological perspective. This is 194
partly because of pseudo-replication in the design and analysis of ecological field experiments 195
(Hurlbert, 1984). While using Bayesian statistics, the study did not face this problem because 196
data is fixed and once created cannot be recreated (Dobson and Barnett, 2008). 197
In the present study, a forward chaining expert system, which is a data-driven approach, has been 198
used to infer the posterior probability of presence of barnacle geese at a location of stopover site 199
based on the predictors and expert knowledge (Niamir et al., 2011; Skidmore, 1989). With the 200

11
use of forward chaining strategy, the expert system is able to reach a solution via a sequential 201
evaluation of all hypotheses or evidence (Naylor, 1989). 202
Our hypothesis implies that the site (Xij) is selected by barnacle geese (H). Bayes’ theorem is 203
used to predict the probability (H) that barnacle goose stopover selection occurs at a site (Xij), 204
given an environmental explanatory variable: 205
𝑃(𝐻|𝐸𝑏) =𝑃(𝐸𝑏|𝐻) × 𝑃(𝐻)
𝑃(𝐸𝑏) Equation 1
where 𝑃(𝐻|𝐸𝑏) is the posterior probability of presence. 𝑃(𝐸𝑏|𝐻) is the conditional probability 206
that a piece of evidence (Eb) (a specific environmental condition) occurs given that the site Xij 207
has been selected as a stopover site. These are estimated according to expert knowledge and 208
listed in Table A1. P(H) is the probability a priori that a concrete site is selected. P(H) was 209
initially set to one. On iterating with further pieces of evidence (environmental parameters), 210
𝑃(𝐻|𝐸𝑏): 𝑏 = 1 replaces P(H) in equations 1. 211
P(Eb) is the probability of the evidence alone, and was calculated from the following equation: 212
𝑃(𝐸𝑏) = ∑ 𝑖 = 1𝑛 𝑃(𝐸𝑏|𝐻𝑖) ∗ 𝑃(𝐻𝑖) Equation 2-1 213
To put it more clearly in the terms used in this manuscript: 214
215
𝑃(𝐸𝑏) = 𝑃(𝐸𝑏|𝐻) ∗ 𝑃(𝐻) + 𝑃(𝐸𝑏|−𝐻) ∗ 𝑃(−𝐻) Equation 2-2 216 217 where H is the hypothesis that a site is selected by the geese and –H is the hypothesis that the site 218
is not selected. In other words, it is not a summation across the pieces of evidences for the same 219
hypothesis, but it is a summation across the hypotheses for the same piece of evidence. 220
2.4.Model assessment 221
During the study analysis, the posterior probability of presence at each stopover site has been 222
calculated. The most likely hypothesis for each stopover site is the hypothesis with the maximum 223

12
posterior probability (Skidmore, 1989). A zero (0) probability means that there is no chance of 224
presence at stopovers, while a probability of one (1) means that it is highly likely to occur. The 225
value 0.5 is the central point and the probabilities above it are more likely to occur, whereas the 226
probabilities lower than 0.5 are less likely to occur (O'Hagan et al., 2006). Therefore, the 227
Bayesian expert system has modelled the stopover selection correctly if the posterior probability 228
of presence at stopover sites is higher than 0.5. 229
3. Results 230
When all parameters were included in the model, the mean of the posterior probabilities for 231
presence 𝜇𝑃(𝐻|𝐸𝑏) at the stopover sites was below 0.5 for all three populations (Russian: 232
𝜇𝑃(𝐻|𝐸𝑏) = 0.25; Svalbard: 𝜇𝑃(𝐻|𝐸𝑏) = 0.21; Greenland: 𝜇𝑃(𝐻|𝐸𝑏) = 0.34; Table 3). Next, 233
the study repeated the analysis by removing one parameter at a time from the Bayesian model 234
and then evaluated the posterior probability of presence. The results showed that the posterior 235
probability of presence was close to one when salt marsh was removed from the Bayesian model 236
(Table 3). 237
238
239
240
241
242
243

13
Table 3. The mean of the posterior probabilities for presence at the stopover sites for three populations of 244 barnacle geese (by removing one parameter at a time from the Bayesian model). The 𝜇𝑃(𝐻|𝐸𝑏) > 0.5 are 245 in bold type. 246
247
248
249
250
251
252
253
254
255
256
𝜇𝑃(𝐻|𝐸𝑏) : mean of posterior probability of presence 257 258
4. Discussion 259
The Bayesian expert system correctly identified the presence of barnacle geese at stopover sites 260
using environmental parameters and expert knowledge. The resultant posterior probability of 261
barnacle goose presence was rather low when all 14 parameters were included in the model (see 262
Table 3). However, excluding the salt marsh from the model increased the probability of 263
presence – in other words saltmarsh is not strongly linked with the presence of migrating geese. 264
With reference to the conditional probabilities generated by the current study’s avian experts 265
(Table A1), it is most likely that barnacle geese choose sites with more than 50% salt marsh and 266
grassland/ cropland coverage. Therefore, our study reveals a close match between experts’ 267
opinion and the reality for the grassland/cropland land cover since on average 60% of the 268
stopovers’ areas were covered by the grassland/cropland. In addition, note that saltmarsh 269
Removed parameter Russian pop. Svalbard pop. Greenland pop.
𝜇𝑃(𝐻|𝐸𝑏) 𝜇𝑃(𝐻|𝐸𝑏) 𝜇𝑃(𝐻|𝐸𝑏)
Pop > 50000 0.2543 0.2091 0.3400
Pop < 50000 0.2543 0.2091 0.3400
Local road 0.2543 0.2091 0.3400
Major road 0.2543 0.2091 0.3400
Wind farm 0.2567 0.1925 0.3238
Forest 0.2548 0.2091 0.3404
Inland water 0.2538 0.2093 0.3388
Ocean 0.2547 0.2086 0.3402
River 0.2549 0.2092 0.3405
Elevation 0.2535 0.2084 0.3374
GWI 0.2530 0.2089 0.3399
Grass/crop 0.2588 0.2100 0.3369
Salt marsh 0.8307 0.9110 0.9038
Snow cover 0.2362 0.1818 0.3089
14
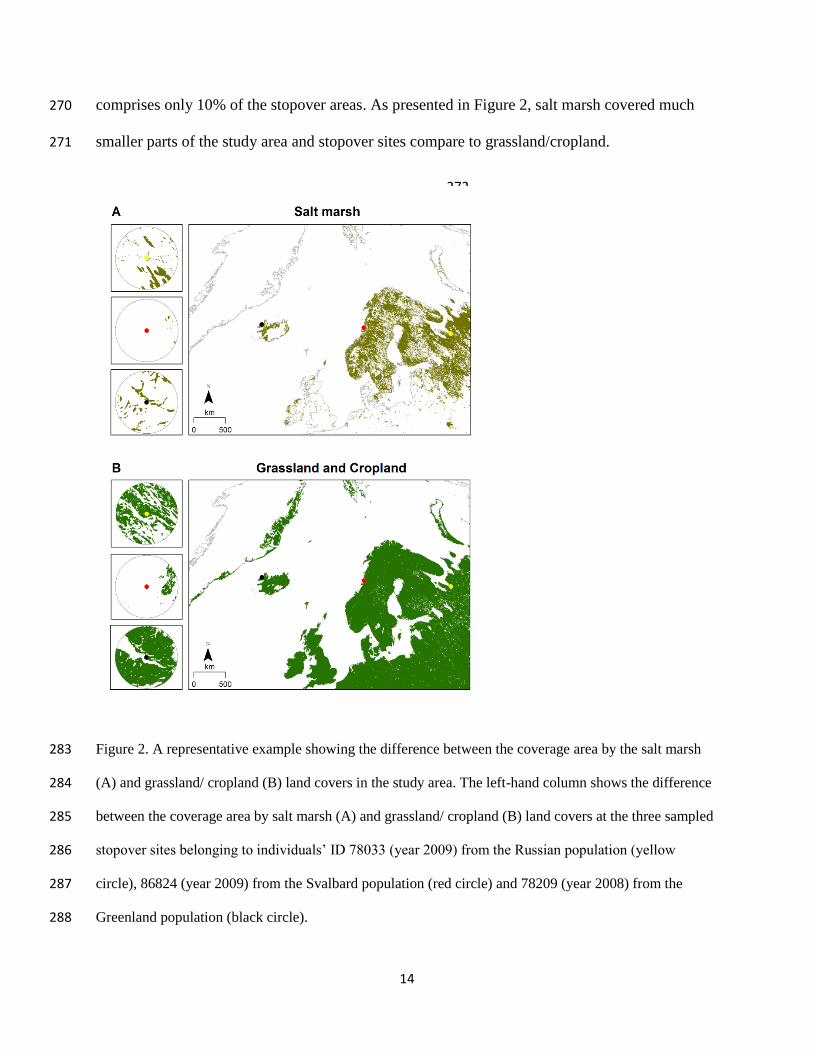
comprises only 10% of the stopover areas. As presented in Figure 2, salt marsh covered much 270
smaller parts of the study area and stopover sites compare to grassland/cropland. 271
272
273
274
275
276
277
278
279
280
281
282
Figure 2. A representative example showing the difference between the coverage area by the salt marsh 283
(A) and grassland/ cropland (B) land covers in the study area. The left-hand column shows the difference 284
between the coverage area by salt marsh (A) and grassland/ cropland (B) land covers at the three sampled 285
stopover sites belonging to individuals’ ID 78033 (year 2009) from the Russian population (yellow 286
circle), 86824 (year 2009) from the Svalbard population (red circle) and 78209 (year 2008) from the 287
Greenland population (black circle). 288

15
However, it is known that salt marsh is an important foraging habitat for barnacle geese (Prins 289
and Ydenberg, 1985; van der Graaf et al., 2004). Instead, our findings may indicate that experts 290
are under-estimating the importance of small areas of salt marsh. Thus, a smaller area of salt 291
marsh within a mosaic of other land covers at stopover sites may provide important habitat for 292
barnacle geese. More specifically, the individual geese are may be utilizing small linear fringes 293
of marsh surrounding an island, for example. This results hint at two potential disadvantages for 294
the expert system: Firstly that an expert may have a poor ability extrapolating beyond their 295
region of knowledge (Murray et al., 2009), and secondly that the questions used to elicit 296
responses from experts may not be explicit and obvious to an expert given the context of 297
extrapolating beyond their region of knowledge. 298
The probability of presence at a site is rarely calculated by ecologists because the statistical 299
methods used by most ecologists are not well-suited to this objective (McCarthy, 2007). 300
Frequentist statistical methods are not strictly suitable for predicting whether a species is present 301
or absent because they are strictly limited to assessing long-run averages, rather than predicting 302
individual observations (Quinn and Keough, 2002). However, as discussed by McCarthy (2007), 303
the Bayesian approach provides a satisfactory answer to this question. The advantage with 304
Bayesian statistics is that it can incorporate prior information and update the probability once 305
evidence is available (i.e. the probability that the null hypothesis is true). The importance of prior 306
knowledge can be understood with reference to an example provided by McCarthy (2007): if a 307
researcher visits a habitat that appears to be an excellent habitat for frogs, then a failure to detect 308
them on a single visit would not necessarily make the researcher believe that the frog was absent. 309
However, if the researcher visited a habitat that was very unlikely to be a proper location for this 310
species, even a single failure to detect the frog might be enough to convince the researchers of 311
16
their assumption that this is not an appropriate habitat for frogs. The current study focussed on 312
the probability that barnacle geese present at the stopover sites, which can be answered by 313
Bayesian analysis (Dobson and Barnett, 2008; McCarthy, 2007). 314
The informative prior probabilities were used to model the presence of geese at stopovers in this 315
current study using a forward chaining Bayesian expert system. Alternatively, the model can be 316
started with no information (objective or non-informative prior), and the posterior derived from 317
the first experiment can then be used as the prior for the next one (Ellison, 2004). However, it is 318
a possibility that the potential stopover sites, which are predicted by the model will never be used 319
by the geese. This is because, beside environmental parameters, there are other factors, such as 320
population growth, which may affect stopover selection. For instance, it has been observed that 321
barnacle geese skipped stopover sites in the Baltic Sea area, as a response to a population 322
explosion and increased competition for food, which in turn has caused the energy deposition 323
rate to fall below the limit of usefulness in time-selected migration (Eichhorn et al., 2009). 324
Nowadays, geese are highly dependent on agricultural food resources, and due to increasing 325
population sizes, there are often conflicts with farmers in different European countries (Cope et 326
al., 2003; Jensen et al., 2008). Solving of such conflict needs regional and even internationally 327
coordinated management plans and the latter depends on the correct identification of stopover 328
sites (Jensen et al., 2008; Madsen et al., 2014). Moreover, the study reveals that there is a lack of 329
knowledge concerning the distribution of migratory bird stopover areas in general and their 330
overlap with wind turbines, which implies difficulties for conservation planning (Piorkowski et 331
al., 2012). Although studies suggest that one way to reduce the impact of wind turbines is to 332
avoid the construction of turbines near to major migration stopovers and flyways (Smallwood et 333
al., 2009). Moreover, it has been reported by Langston (2013) and Rees (2012) that geese (e.g. 334

17
barnacle geese) are considered to be particularly sensitive to disturbance displacement and 335
collision risk, which is caused by wind farms. Therefore, to reduce the possible conflicts between 336
avian migratory concentrations and the siting of wind farm developments, Pocewicz et al. (2013) 337
developed a model to predict the potential stopover sites for wetland, riparian and sparse 338
grassland birds. It was suggested at a Meeting of Parties of the Agreement on the conservation of 339
African-Eurasian migratory waterbirds (AEWA, 2015) that providing of management plans 340
especially for all three barnacle goose populations (breeding in Greenland, Svalbard and 341
Russian/Baltic/North Sea, respectively) is necessary to mitigate conflicts with agricultural, air 342
safety and ecological interests, whilst ensuring their favourable conservation status. However, it 343
is rarely likely that any environmental decision making, would take all possible situations into 344
consideration. Thus, it becomes necessary to take uncertainty into account and update the 345
decisions based on new information (Ellison, 1996). This process is possible under adaptive 346
population management (Lee, 1994), which is based on changing decisions, according to the 347
consequences of previous decisions via feedback loops. Moreover, the forward chaining 348
Bayesian learning and decision-making process can be equivalent to this adaptive management. 349
In other words, once the decision is made based on prior information, the observed consequence 350
is treated as a new source of information (new prior probability) for the next experiment 351
(likelihood) that leads to new decisions and changing management plans accordingly (Ellison, 352
1996). 353
To our knowledge, this is the first time that expert knowledge has been incorporated into an 354
expert system for modelling bird site selection. The present study concentrated on the spring 355
migration routes. However, one of the advantages of the new technologies (e.g. satellite GPS 356
transmitters, GPS logger, etc.; (Fiedler, 2009)) is that it can be run throughout the annual cycle, 357

18
to include spring and autumn migration routes and stopover sites, wintering and breeding sites, 358
which is important for an internationally coordinated management and conservation plan to set 359
up a network of protected areas and improve linkages. 360
5. Conclusion 361
This study modelled the presence of barnacle geese at stopover sites with the use of Bayesian 362
expert system and environmental parameters. The parameters were categorized in four groups of 363
human disturbance, site safety, distance from the roosting area and the foraging habitat. The 364
results from the study indicate that the posterior probabilities of presence at the stopover sites 365
were low when all parameters were included in the model. However, removing salt marsh from 366
the model considerably increased the posterior probability of presence. The study also reveals 367
that the Bayesian expert system correctly identifies the presence of barnacle geese at stopover 368
sites and can be used to predict the potential stopping locations. The correct identification of 369
stopover is highly important to reduce conflicts between migratory geese and farmers, due to 370
population expanding of the geese and their dependency on agricultural food. Moreover, 371
predicting stopover site for migratory birds may help to solve the possible conflicts with wind 372
farm developments. 373
Acknowledgements 374
The barnacle goose data for the Russian population were provided by FlySafe, a project initiated 375
by the Integrated Applications Promotion (IAP) Programme of the European Space Agency. The 376
study was carried out in cooperation with the Institute of Avian Research, Germany, the Dutch 377
Centre of Field Ornithology (Sovon), and the University of Amsterdam from 2007 onwards. GPS 378
tracks of geese from the Svalbard population were collected by the Wildfowl & Wetlands Trust 379
(WWT), UK and for the Greenland population by David Cabot. The Svalbard barnacle geese 380

19
were caught with the help of the North Solway Ringing Group, and the Greenland barnacle geese 381
were caught with the help of the National Parks and Wildlife Service, Dublin, Ireland and WWT. 382
This work was supported by the EU Erasmus Mundus External Cooperation Window (EM8) 383
Action 2 project, http://www.erasmusmundus8.net/ (grant number 10438223); the FlySafe, a 384
project initiated by the Integrated Applications Promotion (IAP) Program of the ESA (contract 385
number C 20651/07/NL/), the Scottish Natural Heritage (grant number GRA APP 732 9438), the 386
Sustainable Development Fund (grant numbers SDF 0607 WWTVF, SDF 0806RB and SDF 387
WWT1209) for the Solway Coast Area of Outstanding Natural Beauty, the BBC and the 388
Heritage Lottery Fund (grant number AAS/4/010226001) Awards for All. We thank Willem 389
Nieuwenhuis for his help with the programming, and Bart Nolet, Thomas Groen, Jesper Madsen 390
and Thomas Lameris for their kindly participating in the questionnaires. We also thank THE 391
WIND POWER Company for sharing the wind farm data with us. 392

20
Reference 393
AEWA, 2015. 6th Session of the meeting of the parties (Outcomes of the international conference “Goose 394 management: challenges 2015”), Bonn, Germany. 395 Amano, T., Ushiyama, K., Fujita, G., Higuchi, H., 2006. Foraging Patch Selection and Departure by Non-396 Omniscient Foragers: A Field Example in White-Fronted Geese. Ethology 112, 544-553. 397 Aspinall, R., 1992. An inductive modelling procedure based on Bayes' theorem for analysis of pattern in 398 spatial data. Int. J. Geogr. Inf. Syst. 6, 105-121. 399 Beck, P.S.A., Wang, T.J., Skidmore, A.K., Liu, X.H., 2008. Displaying remotely sensed vegetation 400 dynamics along natural gradients for ecological studies. Int. J. Remote Sens. 29, 4277-4283. 401 Choy, S.L., O'Leary, R., Mengersen, K., 2009. Elicitation by design in ecology: using expert opinion to 402 inform priors for Bayesian statistical models. Ecology 90, 265-277. 403 Chudzińska, M.E., van Beest, F.M., Madsen, J., Nabe-Nielsen, J., 2015. Using habitat selection theories 404 to predict the spatiotemporal distribution of migratory birds during stopover – a case study of pink-footed 405 geese Anser brachyrhynchus. Oikos 124, 851-860. 406 Cope, D.R., Pettifor, R.A., Griffin, L.R., Rowcliffe, J.M., 2003. Integrating farming and wildlife 407 conservation: the Barnacle Goose Management Scheme. Biol. Conserv. 110, 113-122. 408 Dobson, A.J., Barnett, A., 2008. An introduction to generalized linear models. CRC press. 409 Eichhorn, G., Drent, R.H., Stahl, J., Leito, A., Alerstam, T., 2009. Skipping the Baltic: the emergence of a 410 dichotomy of alternative spring migration strategies in Russian barnacle geese. J. Anim. Ecol. 78, 63-72. 411 Ellison, A.M., 1996. An Introduction to Bayesian Inference for Ecological Research and Environmental 412 Decision-Making. Ecol. Appl. 6, 1036-1046. 413 Ellison, A.M., 2004. Bayesian inference in ecology. Ecol. Lett. 7, 509-520. 414 ESRI, 2016. Arc GIS online. 415 Faaborg, J., Holmes, R.T., Anders, A.D., Bildstein, K.L., Dugger, K.M., Gauthreaux, S.A., Heglund, P., 416 Hobson, K.A., Jahn, A.E., Johnson, D.H., Latta, S.C., Levey, D.J., Marra, P.P., Merkord, C.L., Nol, E., 417 Rothstein, S.I., Sherry, T.W., Sillett, T.S., Thompson, F.R., Warnock, N., 2010. Conserving migratory 418 land birds in the New World: Do we know enough? Ecol. Appl. 20, 398-418. 419 Fiedler, W., 2009. New technologies for monitoring bird migration and behaviour. Ringing. Migr. 24, 420 175-179. 421 Gauthier, G., Bety, J., Hobson, K.A., 2003. Are greater snow geese capital breeders? New evidence from 422 a stable-isotope model. Ecology 84, 3250-3264. 423 Griffin, L.R., 2008. Identifying the pre-breeding areas of the Svalbard Barnacle Goose Branta leucopsis 424 between mainland Norway and Svalbard: an application of GPS satellite-tracking techniques. Vogelwelt 425 129, 226-232. 426 Guisan, A., Thuiller, W., 2005. Predicting species distribution: offering more than simple habitat models. 427 Ecol. Lett. 8, 993-1009. 428 Guisan, A., Zimmermann, N.E., 2000. Predictive habitat distribution models in ecology. Ecol. Model. 429 135, 147-186. 430 Guo-Gang, Z., Dong-Ping, L., Yun-Qiu, H., Hong-Xing, J., Ming, D., Fa-Wen, Q., Jun, L., Zhi, X., Feng-431 Shan, L., 2011. Migration routes and stop-over sites determined with satellite tracking of bar-headed 432 geese Anser indicus breeding at Qinghai Lake, China. Waterbirds 34, 112-116. 433 Huete, A., Didan, K., Miura, T., Rodriguez, E.P., Gao, X., Ferreira, L.G., 2002. Overview of the 434 radiometric and biophysical performance of the MODIS vegetation indices. Remote Sens. Environ. 83, 435 195-213. 436 Hurlbert, S.H., 1984. Pseudoreplication and the Design of Ecological Field Experiments. Ecol. Monogr. 437 54, 187-211. 438 James, A., Gaston, K.J., Balmford, A., 2001. Can We Afford to Conserve Biodiversity? BioScience 51, 439 43-52. 440 Jankowiak, L., Antczak, M., Tryjanowski, P., 2008. Habitat use, food and the importance of poultry in the 441 diet of the red fox Vulpes vulpes in extensive farmland in Poland. World. Appl. Sci. J. 4, 886-890. 442
21
Jensen, R.A., Wisz, M.S., Madsen, J., 2008. Prioritizing refuge sites for migratory geese to alleviate 443 conflicts with agriculture. Biol. Conserv. 141, 1806-1818. 444 Keller, V., 1991. The effect of disturbance from roads on the distribution of feeding sites of geese (Anser-445 brachyrhynchus, A. anser), wintering in north-east Scotland. Ardea 79, 228-231. 446 Klaassen, R.H., Hake, M., Strandberg, R., Koks, B.J., Trierweiler, C., Exo, K.M., Bairlein, F., Alerstam, 447 T., 2014. When and where does mortality occur in migratory birds? Direct evidence from long‐term 448 satellite tracking of raptors. J. Anim. Ecol. 83, 176-184. 449 Kynn, M., 2005. Eliciting expert knowledge for Bayesian logistic regression in species habitat modelling. 450 Qeensland University of Technology. 451 Langston, R.H., 2013. Birds and wind projects across the pond: A UK perspective. Wildl. Soc. Bull. 37, 452 5-18. 453 Lee, K.N., 1994. Compass and gyroscope: integrating science and politics for the environment. Island 454 Press. 455 Madsen, J., Bjerrum, M., Tombre, I.M., 2014. Regional management of farmland feeding geese using an 456 ecological prioritization tool. Ambio 43, 801-809. 457 McCarthy, M.A., 2007. Bayesian methods for ecology. Cambridge University Press. 458 Mehlman, D.W., Mabey, S.E., Ewert, D.N., Duncan, C., Abel, B., Cimprich, D., Sutter, R.D., Woodrey, 459 M., 2005. Conserving stopover sites for forest-dwelling migratory landbirds. The Auk 122, 1281-1290. 460 Miller, J., 2010. Species distribution modeling. Geogr. Compass 4, 490-509. 461 Murray, J.V., Goldizen, A.W., O’Leary, R.A., McAlpine, C.A., Possingham, H.P., Choy, S.L., 2009. 462 How useful is expert opinion for predicting the distribution of a species within and beyond the region of 463 expertise? A case study using brush‐tailed rock‐wallabies Petrogale penicillata. J. Appl. Ecol. 46, 842-464 851. 465 Naylor, C., 1989. How to build an inferencing engine, Expert systems principles and case studies. 466 Chapman \& Hall, Ltd., p. 84. 467 Newton, L., 2008. The Migration Ecology of Birds. Academic Press is an imprint of Elsevier. 468 Niamir, A., Skidmore, A.K., Toxopeus, A.G., Muñoz, A.R., Real, R., 2011. Finessing atlas data for 469 species distribution models. Divers. Distrib. 17, 1173-1185. 470 O'Hagan, A., Buck, C.E., Daneshkhah, A., Eiser, J.R., Garthwaite, P.H., Jenkinson, D.J., Oakley, J.E., 471 Rakow, T., 2006. Uncertain judgements: eliciting experts' probabilities. John Wiley & Sons. 472 Owen, M., 1980. Wild Geese of the World. B. T. Batsford Ltd., London, UK 236 pp. 473 Pedrana, J., Pon, J.P.S., Isacch, J.P., Leiss, A., Rojas, P.O., Castresana, G., Calvo, J., Bernad, L., Muñoz, 474 S.D., Maceira, N.O., 2015. First insights into the migration pattern of an upland goose (Chloephaga picta) 475 based on satellite tracking. Ornitol. Neotrop. 26, 245-253. 476 Pendlebury, C., Zisman, S., Walls, R., Sweeney, J., McLoughlin, E., Robinson, C., Turner, L., Loughrey, 477 J., 2011. Literature review to assess bird species connectivity to Special Protection Areas. 478 Piorkowski, M.D., Farnsworth, A.J., Fry, M., Rohrbaugh, R.W., Fitzpatrick, J.W., Rosenberg, K.V., 479 2012. Research priorities for wind energy and migratory wildlife. J. Wildl. Manage. 76, 451-456. 480 Pocewicz, A., Estes-Zumpf, W.A., Andersen, M.D., Copeland, H.E., Keinath, D.A., Griscom, H.R., 2013. 481 Modeling the distribution of migratory bird stopovers to inform landscape-scale siting of wind 482 development. PloS one 8, e75363. 483 Prins, H.T., Ydenberg, R., 1985. Vegetation growth and a seasonal habitat shift of the barnacle goose 484 (Branta leucopsis). Oecologia 66, 122-125. 485 Quinn, G.P., Keough, M.J., 2002. Experimental design and data analysis for biologists. Cambridge 486 University Press. 487 Rees, E.C., 2012. Impacts of wind farms on swans and geese: a review. Wildfowl 62, 37-72. 488 Roder, F., Bijlsma, R., Klomp, J., 2008. Second breeding case of White-tailed Eagle Haliaeetus albicilla 489 in The Netherlands. De Takkeling 16, 100-123. 490 Rosin, Z., Skórka, P., Wylegała, P., Krąkowski, B., Tobolka, M., Myczko, Ł., Sparks, T., Tryjanowski, 491 P., 2012. Landscape structure, human disturbance and crop management affect foraging ground selection 492 by migrating geese. J. Ornithol. 153, 747-759. 493

22
Shariati-Najafabadi, M., Darvishzadeh, R., Skidmore, A.K., Kölzsch, A., Vrieling, A., Nolet, B.A., Exo, 494 K.-M., Meratnia, N., Havinga, P.J.M., Stahl, J., Toxopeus, A.G., 2015. Satellite- versus temperature-495 derived green wave indices for predicting the timing of spring migration of avian herbivores. Ecol. Indic. 496 58, 322-331. 497 Shariatinajafabadi, M., Wang, T., Skidmore, A.K., Toxopeus, A.G., Kölzsch, A., Nolet, B.A., Exo, K.M., 498 Griffin, L., Stahl, J., Cabot, D., 2014. Migratory herbivorous waterfowl track satellite-derived green wave 499 index. PLoS ONE 9, e108331. 500 Si, Y., Skidmore, A.K., Wang, T., de Boer, W.F., Toxopeus, A.G., Schlerf, M., Oudshoorn, M., Zwerver, 501 S., Jeugd, H.v.d., Exo, K.-M., 2011. Distribution of Barnacle Geese Branta leucopsis in relation to food 502 resources, distance to roosts, and the location of refuges. Ardea 99, 217-226. 503 Skidmore, A.K., 1989. An expert system classifies eucalypt forest types using thematic mapper data ans a 504 digital terrain model. Photogramm. Eng. Remote Sens. 55, 1449-1464. 505 Smallwood, K.S., Rugge, L., Morrison, M.L., 2009. Influence of behavior on bird mortality in wind 506 energy developments. J. Wildl. Manage. 73, 1082-1098. 507 Taylor, B., Wade, P., Stehn, R., Cochrane, J., 1996. A Bayesian approach to classification criteria for 508 spectacled eiders. Ecol. Appl. 6, 1077-1089. 509 The wind power, 2016. Wind energy database. http://www.thewindpower.net 510 van der Graaf, A., Lavrinenko, O., Elsakov, V., Van Eerden, M., Stahl, J., 2004. Habitat use of barnacle 511 geese at a subarctic salt marsh in the Kolokolkova Bay, Russia. Polar Biol. 27, 651-660. 512 van der Graaf, A.J., Stahl, J., Klimkowska, A., Bakker, J.P., Drent, R.H., 2006. Surfing on a green wave – 513 how plant growth drives spring migration in the Barnacle Goose Branta leucopsis. Ardea 94, 565-577. 514 Wade, P.R., 2000. Bayesian methods in conservation biology. Conserv. Biol. 14, 1308-1316. 515
516
517
518
519
520
521
522
523
524
525
526
527
528
529
530
531
23
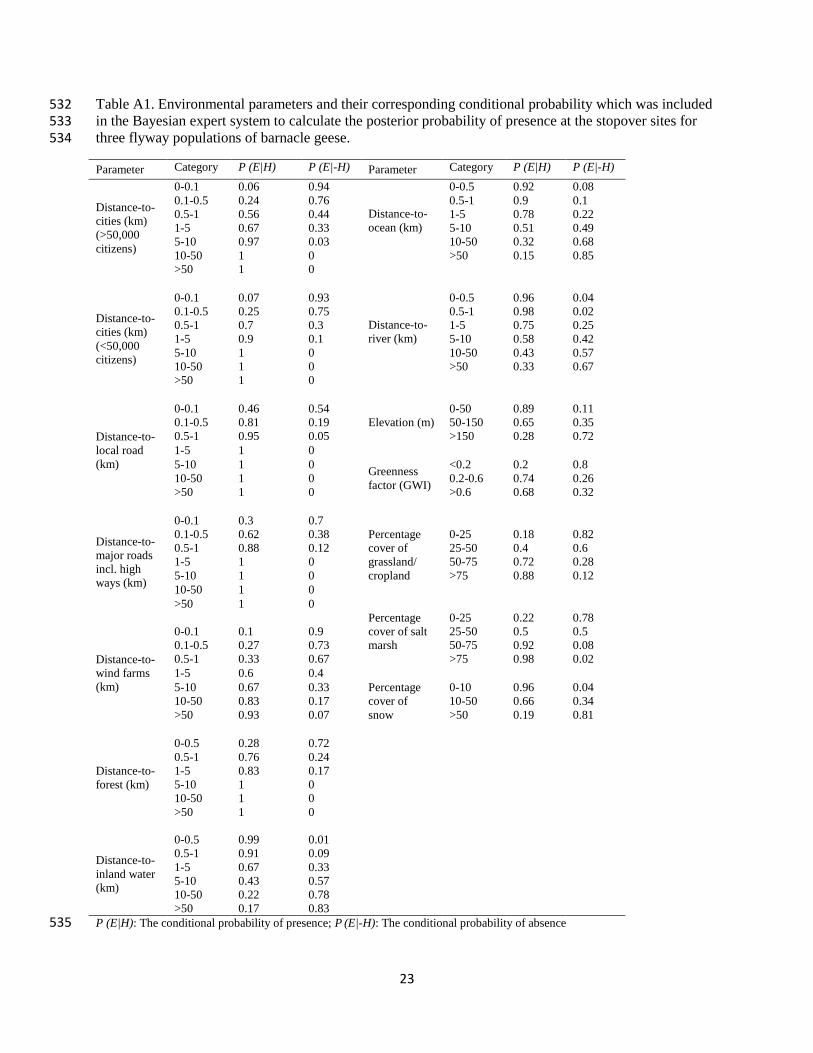
Table A1. Environmental parameters and their corresponding conditional probability which was included 532 in the Bayesian expert system to calculate the posterior probability of presence at the stopover sites for 533 three flyway populations of barnacle geese. 534
Parameter Category P (E|H) P (E|-H) Parameter Category P (E|H) P (E|-H)
Distance-to-
cities (km)
(>50,000
citizens)
0-0.1 0.06 0.94
Distance-to-
ocean (km)
0-0.5 0.92 0.08
0.1-0.5 0.24 0.76 0.5-1 0.9 0.1
0.5-1 0.56 0.44 1-5 0.78 0.22
1-5 0.67 0.33 5-10 0.51 0.49
5-10 0.97 0.03 10-50 0.32 0.68
10-50 1 0 >50 0.15 0.85
>50 1 0
Distance-to-
cities (km)
(<50,000
citizens)
0-0.1 0.07 0.93
Distance-to-
river (km)
0-0.5 0.96 0.04
0.1-0.5 0.25 0.75 0.5-1 0.98 0.02
0.5-1 0.7 0.3 1-5 0.75 0.25
1-5 0.9 0.1 5-10 0.58 0.42
5-10 1 0 10-50 0.43 0.57
10-50 1 0 >50 0.33 0.67
>50 1 0
Distance-to-
local road
(km)
0-0.1 0.46 0.54
Elevation (m)
0-50 0.89 0.11
0.1-0.5 0.81 0.19 50-150 0.65 0.35
0.5-1 0.95 0.05 >150 0.28 0.72
1-5 1 0
5-10 1 0 Greenness
factor (GWI)
<0.2 0.2 0.8
10-50 1 0 0.2-0.6 0.74 0.26
>50 1 0 >0.6 0.68 0.32
Distance-to-
major roads
incl. high
ways (km)
0-0.1 0.3 0.7
0.1-0.5 0.62 0.38 Percentage
cover of
grassland/
cropland
0-25 0.18 0.82
0.5-1 0.88 0.12 25-50 0.4 0.6
1-5 1 0 50-75 0.72 0.28
5-10 1 0 >75 0.88 0.12
10-50 1 0
>50 1 0
Percentage
cover of salt
marsh
0-25 0.22 0.78
Distance-to-
wind farms
(km)
0-0.1 0.1 0.9 25-50 0.5 0.5
0.1-0.5 0.27 0.73 50-75 0.92 0.08
0.5-1 0.33 0.67 >75 0.98 0.02
1-5 0.6 0.4
5-10 0.67 0.33 Percentage
cover of
snow
0-10 0.96 0.04
10-50 0.83 0.17 10-50 0.66 0.34
>50 0.93 0.07 >50 0.19 0.81
Distance-to-
forest (km)
0-0.5 0.28 0.72
0.5-1 0.76 0.24
1-5 0.83 0.17
5-10 1 0
10-50 1 0
>50 1 0
Distance-to-
inland water
(km)
0-0.5 0.99 0.01
0.5-1 0.91 0.09
1-5 0.67 0.33
5-10 0.43 0.57
10-50 0.22 0.78
>50 0.17 0.83
P (E|H): The conditional probability of presence; P (E|-H): The conditional probability of absence 535