![Sample loading and retrieval by centrifugation in a closed ... loading an… · implement this unique PCR protocol on a microfluidic chip [16]. PCR microdevices are implemented in](https://static.fdocuments.in/doc/165x107/5ffe62121040254886784f58/sample-loading-and-retrieval-by-centrifugation-in-a-closed-loading-an-implement.jpg)
Experimental Loading Conditions Used to Implement ... · PDF fileExperimental Loading...
14
1 Experimental Loading Conditions Used to Implement Hyperelastic and Plastic Material Models Kurt Miller Axel Products, Inc. Ann Arbor, MI USA [email protected] www.axelproducts.com Abstract Analytical material models do not entirely describe the stress-strain relationship in a material under all loading conditions. Therefore, experimental data needs to be created such that a reasonable material model may be selected to define material behavior pertinent to the application of interest. Loading variables such as strain rate, strain direction, maximum strain, relaxation, cyclic behavior and plasticity are outlined to provide a context for the design of experiments needed to define hyperelastic and plastic material models based on the needs of the application.
Transcript of Experimental Loading Conditions Used to Implement ... · PDF fileExperimental Loading...

1
Experimental Loading Conditions Used to Implement Hyperelastic and Plastic Material Models
Kurt Miller
Axel Products, Inc. Ann Arbor, MI USA
[email protected] www.axelproducts.com
Abstract Analytical material models do not entirely describe the stress-strain relationship in a material under all loading conditions. Therefore, experimental data needs to be created such that a reasonable material model may be selected to define material behavior pertinent to the application of interest. Loading variables such as strain rate, strain direction, maximum strain, relaxation, cyclic behavior and plasticity are outlined to provide a context for the design of experiments needed to define hyperelastic and plastic material models based on the needs of the application.

2
Introduction Analytical material models do not describe the structural properties of plastics and elastomers under all conditions. Most models describe a particular stress-strain relationship that exists under specific conditions. This paper will examine typical behaviors of plastics and elastomers under various loading conditions and the resulting effects on common analytical material models. By understanding the typical behavior, one can design material testing experiments to provide stress-strain data appropriate for particular simulation projects. Curve Fitters and Data Input Requirements Structural analytical material models need to be fitted to real materials. The material models each describe a particular material behavior when a material is subjected to stresses. To make the material model function, laboratory experiments are performed where material specimens are stressed in known states of strain. These experiments provide stress-strain data that allow the variables in the material model to be fitted. For rigid plastics, test data in the simple tension strain state may be sufficient. The stress-strain curve is generally expected to be of the form shown in Figure 1 [1]. Practical variations on this theme are shown in Figure 2 [1]. For elastomeric materials, experiments in multiple strain states such as simple tension, planar tension and biaxial extension may be needed to adequately define a material [2]. The stress-strain data set is generally expected to be of the form shown in Figure 3.
Figure 1. Typical Elastic-Plastic Form [1].

3
Figure 2. Practical variations on the Elastic-Plastic form [1].
Figure 3. Typical Elastomer Stress-Strain Data Set.
In addition to providing stress-strain data in the correct states of strain, one needs to develop an understanding of the manner in which stresses are applied to the component of interest so that the experimental stress loading may be meaningful.

4
The Initial Pull-to-Failure Experiment Most physical testing of plastics and elastomers is performed using a single pull-to-failure. For elastomers this falls under ASTM test method D412 and for most plastics this falls under ASTM test method D638. Figure 4 shows a typical test instrument.
Figure 4. Simple Tension Test in a Tensile Tester. A typical stress-strain curve from a single pull-to-failure experiment with an engineering silicone is shown in Figure 5. Notice that the material failed at over 400% strain. In this case, the material application was well under 100 % strain. While it may be valuable to understand the strain at failure, for engineering analysis, it may be more worthwhile to have precise stress and strain measurements in the range of use.
Figure 5. Single Pull-to-Failure Data.

5
Repeat Loading Effects In Figure 6, the same elastomer is loaded and unloaded such that the elastomer is stretched to 10% strain and then returned to zero stress, again stretched to 10% strain then returned to zero stress for a total of three stretches to 10%. The elastomer is then stretched to 20% three times, followed by 30 % three times and so on to a maximum total strain of 100%.
Figure 6. Single Pull-to-Failure Data and Repeat Loading Data. Two effects become apparent. The first effect is that is that repeated stretching to a particular strain level cause the stress strain curve to soften significantly and change shape. The second effect is that each time the elastomer is stretched to a larger maximum strain, additional softening and additional shape changes occur. Notice also that each time the elastomer is initially stretched to a new maximum strain level, the stress-strain curves returns to the single pull-to-failure stress-strain curve. This single pull-to-failure stress-strain curve acts as a maximum stress boundary for any strain level. In Figure 7, the third stretch to 10% maximum strain and the third stretch to 50% maximum strain and the third stretch to 100% maximum strain stress-strain curves are sliced out of the multiple loading experimental data set from Figure 6 and plotted with the single pull-to-failure stress-strain curve. Because of some plastic strain damage each of these curves were shifted [3]. It becomes very apparent that that multiple loadings and the maximum strain of the loading will significantly alter the stress-strain data set and therefore the hyperelastic material model fit.

6
Figure 7. Single Pull-to-Failure Data and Stabilized 10%, 50% and 100% Data Based on this information, one needs to decide whether the first time installation and therefore maximum stress condition is of interest such that first time pull-to-failure data is appropriate or whether the stabilized condition in a particular strain range is more significant. If it is critical to capture all of this behavior which is commonly referred to as damage in a material model, then the MSC.Marc Damage Models may be implemented using loading and unloading data in the form shown in Figure 6.

7
Viscoelastic Decay If this same elastomer is stretched to a particular strain and held, the stress will decrease over time [4]. This effect can be dramatic and appropriate to many applications where a mean strain condition is maintained. This effect is typically not captured in hyperelastic models. However, MSC.Marc allows a time-stress data set collected at a constant strain to be fitted with a Proney series and implemented in the material model as a viscoelastic component. Figure 9 shows a family of time-stress data sets. Each curve represents the elastomer strained to a particular strain and held for 2000 seconds. There is a stress value at 2000 seconds for each strain level. If all of these stress values at 2000 seconds are combined with the corresponding strain, a relaxed stress-strain curve can be constructed as shown in Figure 8. A relaxed hyperelastic model can be developed using similar relaxed stress-strain curves for tension, shear and equibiaxial experiments.
Figure 8. Building an Equilibrium Stress-strain Curve from Viscoelastic Decay Data at Multiple Strain Levels
In Figure 9, the extracted 2000 second relaxed data set is shown with the single pull-to-failure and the repeat loading effect stress strain data sets. The relaxed data set extracted at 0.1 seconds is also shown in Figure 9. Since the material stress decreases little in 0.1 seconds, the stress-strain curve falls nearly on top of the single pull-to-failure data.

8
Figure 9. Single Pull-to-Failure Data and Stabilized 10%, 50% and 100% Data and Equilibrium Stress-strain Data

9
Unloading Returning again to the repeat loading sequence shown in Figure 8, it is apparent that when the elastomer is stretched, the stress strain curve is stiffer than when it is unloaded. Some part designs are sensitive to the minimum stress condition. For example, an automotive door seal is required to maintain a contact force as the sealed gap changes size in normal use. The ability to maintain a minimum sealing force is the primary design concern. For purposes of illustration, the final unloading from 100% maximum strain is sliced out of the multiple loading experimental data set from Figure 6 and plotted with the previous data sets in Figure 10. The unloading stress strain curve for an elastomer represents the softest material condition.
Figure 10. Single Pull-to-Failure Data and Stabilized 10%, 50% and 100% Data and Equilibrium Stress-strain Data and Unloading Data
For a structural plastic, the generation of structural test data where the material is both loaded and unloaded through the range of anticipated strains is important because the assumption is often made that an elastic region exists where the material loads and unloads along the same Young’s Modulus line. One way to determine the elastic region is to unload the test specimen and separate the elastic and plastic strain components. A repeatable elastic component may emerge but the modulus may be different than the initial pull modulus.

10
Temperature The effect of temperature on the structural properties of plastics and elastomers can be dramatic. This is especially true in automotive powertrain applications where a temperature range spanning almost 200C. may be experienced. With such a broad temperature range, it isn’t always a simple matter of shifting properties the properties of a particular material model. The properties may change so significantly that different material models are required. In Figure 11, a common automotive powertrain elastomer is subjected the same repeat loading sequence discussed earlier. At 23C, the material loads and unloads as an elastomer. At –40C, the material experiences localized plastic straining and shows minimal recovery. Most would not consider this material to be an elastomer under these conditions.
Figure 11. Temperature Effects on Repeat Loading Data While this example is dramatic, it is not unusual for the nature of the stress strain curves to change markedly with temperature requiring a re-evaluation of the material model selection. Naturally, it can be critical to get actual laboratory structural test data at the temperatures of interest in the strain ranges of interest.

11
Rate Effects Plastics and elastomers change properties with the rate of loading. Figure 12 shows the stress strain curves for tensile experiments on a common structural plastic. The most remarkable aspect of this data set is that the modulus remained relatively insensitive to strain rate for over three orders of strain rate change. Of course, the plastic yield transition and the failure points changed significantly.
Figure 12. Strain Rate Effects on a Structural Plastic
Elastomeric components often experience dynamic sinusoidal loading superimposed on a larger mean strain as in Figure 13 [5]. This is common for mounts, bushings and body seals. The response to the dynamic loading is such that higher frequencies result in higher stiffness values. However, for most engineered elastomers, the effects of mean strain amplitude and dynamic sinusoidal amplitude may be greater.

12
Figure 13. Dynamic Sinusoidal Loading Superimposed on a Large Mean Strain in an Elastomer
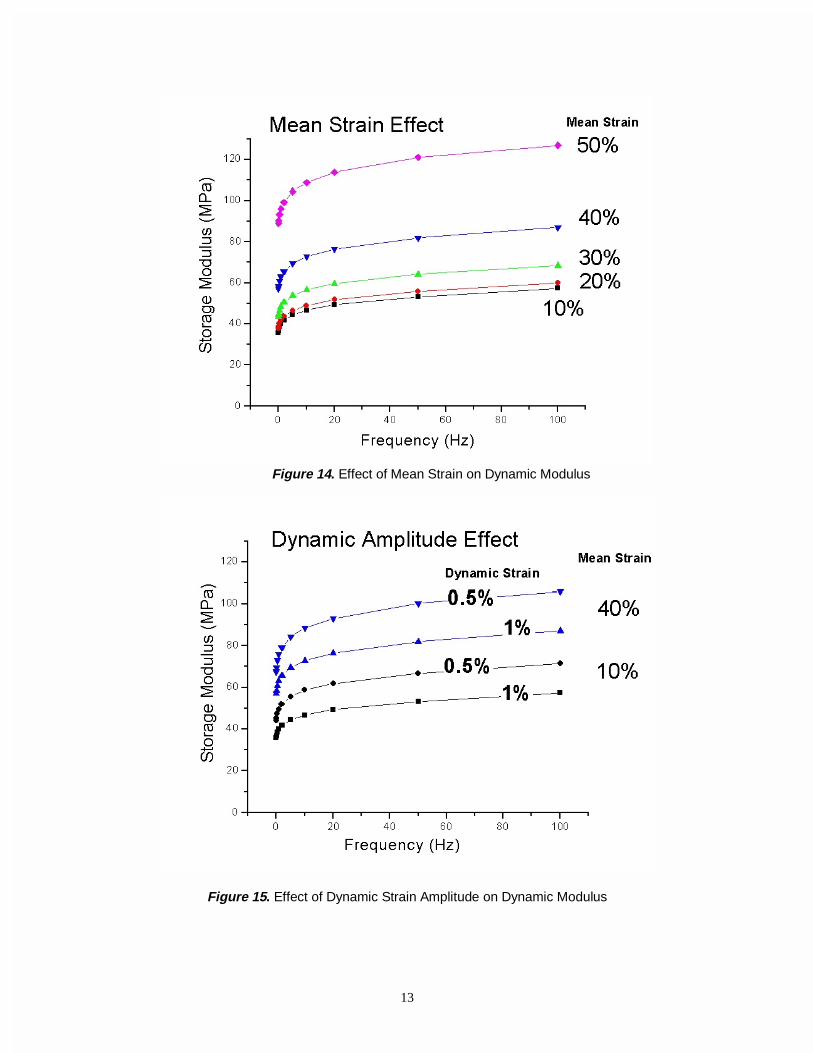
In Figure 14, the storage modulus of a typical filled natural rubber is shown as a function of frequency and mean strain [6]. The mean strain effect is dramatic. In Figure 15, the same material data at 2 selected mean strains is also shown at 2 dynamic sinusoidal amplitudes. Again, the effect is dramatic. As a result of this behavior, analytical predictions based solely on frequency or rate effects will fall short if the effects of mean strain and dynamic amplitude are ignored [7]. This is commonly the case when Dynamic Mechanical Analysis (DMA) testing is performed at very small amplitudes at a near zero mean strain.
13
Figure 14. Effect of Mean Strain on Dynamic Modulus
Figure 15. Effect of Dynamic Strain Amplitude on Dynamic Modulus

14
Summary Analytical material models do not entirely describe the stress-strain relationship in a material under all loading conditions. However, experiments can be performed to create appropriate loading conditions and therefore realistic analytical models.
References [1] MSC.Marc Volume A Theory and User Information, Version K7.3, The MSC.Software
Corporation, Los Angeles, CA, 1998. [2] Day, J. R. and Miller, K.A. “Equibiaxial Stretching of Elastomeric Sheets, An Analytical
Verification of Experimental Technique” ABAQUS 2000 User’s Conference Proceedings, Newport, Rhode Island, May 30-June 2, 2000.
[3] Miller, K., “Testing Elastomers for Hyperelastic Material Models in Finite Element Analysis”,
Rubber Technology International, 1999, p.88. [4] Ferry, J. D., Viscoelastic Properties of Polymers, 3rth ed. Wiley, 1980. [5] Morman, K. N. Jr., B.G. Kao and Nagtegaal, J. C., “ Finite Element Analysis of Viscoelastic
Elastomeric Structures Vibrating about Non-Linear Statically Stressed Configurations”, SAE Paper 811309, 1981.
[6] Payne, A. R. and Kraus, G., Reinforcement of Elastomers,(Interscience Publishers, New
York, 1965. [7] Miller, K., “Measuring the Dynamic Properties of Elastomers for Analysis”, Axel Products
Testing and Analysis Report, http://www.axelproducts.com/pages/Downloads.html, Ann Arbor, MI, 2000.


![[Brown] a Simple Trasnversely Isotropic Hyperelastic Model](https://static.fdocuments.in/doc/165x107/55cf9680550346d0338be74e/brown-a-simple-trasnversely-isotropic-hyperelastic-model.jpg)