Experiment HP-5: Heart Rate, Blood Pressure, and Vagal …€¦ · · 2013-05-21iWorx Sample Lab...
10
Copyright iWorx Systems Inc. Note: Only for evaluation by prospective customers. iWorx Sample Lab Experiment HP-5: Heart Rate, Blood Pressure, and Vagal Tone Heart Rate & Blood Pressure Section Note: If you choose to do Personality-Vagal Tone or Vigilance-Reaction Time experiments – choose those labs from the Human Psychophysiology section. Exercise 1: Baseline Heart Rate and Blood Pressure Aim: To determine the resting heart rate and blood pressure of the subject. Procedure 1. Select a subject. Instruct the subject to sit down and relax, with both hands in his or her lap. 2. While the subject is relaxing, place the blood pressure cuff of the BP-600 around the upper portion of the left arm, just above the elbow. Place the PT-104 pulse plethysmograph on the volar surface (where the fingerprints are located) of the distal segment of the left middle finger or thumb. Wrap the Velcro strap around the end of the finger to attach the unit firmly in place. 3. Click on the Record button, located on the upper right side of the LabScribe Main window. The signals being recorded should begin scrolling across the screen. Note: If the user clicks the Record button and there is no communication between the iWorx unit and computer, an error window will appear in the center of the Main window. Make sure the iWorx unit is turned on and connected to the USB port of the computer. Click OK and select the Find Hardware function from the LabScribe Tools menu. 4. Click on the AutoScale buttons at the upper margins of the Pulse and Heart Rate channels. The pulse signals and heart rate histogram should expand to fill the channel windows. 5. Click Stop to halt recording; your record should look like Figure HP-5-L1 . If the signal on the Pulse channel is upside down when compared to trace in figure, click on the downward arrow to the left of the channel title and select the Invert function. The trace should now look similar to the one in the figure. 6. Type Baseline HR/BP <Subject’s Name> in the Mark box to the right of the Mark button. 7. Click Record and press the Enter key on the keyboard to mark the recording. Continue recording. 8. After recording for one minute, inflate the blood pressure cuff until the finger pulse wave on the Pulse channel disappears (Figure HP-5-L2 ). 9. Once the pulse wave disappears, release the cuff pressure at the rate of ~10 mmHg/second. Continue to release the pressure in the cuff until the aneuroid gauge reads 20 mmHg. 10. Click the Stop button. Make sure the blood pressure cuff is completely deflated and is not putting any unnecessary pressure on the subject's arm. 11. The subject should continue to relax between Exercises 1 and 2. To improve circulation in his or her arm, the subject should flex and extend their fingers to encourage blood circulation. Human Psychophysiology – HeartRate-BP – Labs HP-5-1
Transcript of Experiment HP-5: Heart Rate, Blood Pressure, and Vagal …€¦ · · 2013-05-21iWorx Sample Lab...

Copyright iWorx Systems Inc. Note: Only for evaluation by prospective customers.
iWor
x Sam
ple La
b
Experiment HP-5: Heart Rate, Blood Pressure, and Vagal Tone
Heart Rate & Blood Pressure Section
Note: If you choose to do Personality-Vagal Tone or Vigilance-Reaction Time experiments – choose
those labs from the Human Psychophysiology section.
Exercise 1: Baseline Heart Rate and Blood Pressure
Aim: To determine the resting heart rate and blood pressure of the subject.
Procedure
1. Select a subject. Instruct the subject to sit down and relax, with both hands in his or her lap.
2. While the subject is relaxing, place the blood pressure cuff of the BP-600 around the upper
portion of the left arm, just above the elbow. Place the PT-104 pulse plethysmograph on the
volar surface (where the fingerprints are located) of the distal segment of the left middle finger
or thumb. Wrap the Velcro strap around the end of the finger to attach the unit firmly in place.
3. Click on the Record button, located on the upper right side of the LabScribe Main window. The
signals being recorded should begin scrolling across the screen.
Note: If the user clicks the Record button and there is no communication between the iWorx unit and
computer, an error window will appear in the center of the Main window. Make sure the iWorx unit is
turned on and connected to the USB port of the computer. Click OK and select the Find Hardware
function from the LabScribe Tools menu.
4. Click on the AutoScale buttons at the upper margins of the Pulse and Heart Rate channels. The
pulse signals and heart rate histogram should expand to fill the channel windows.
5. Click Stop to halt recording; your record should look like Figure HP-5-L1. If the signal on the
Pulse channel is upside down when compared to trace in figure, click on the downward arrow to
the left of the channel title and select the Invert function. The trace should now look similar to
the one in the figure.
6. Type Baseline HR/BP <Subject’s Name> in the Mark box to the right of the Mark button.
7. Click Record and press the Enter key on the keyboard to mark the recording. Continue
recording.
8. After recording for one minute, inflate the blood pressure cuff until the finger pulse wave on the
Pulse channel disappears (Figure HP-5-L2).
9. Once the pulse wave disappears, release the cuff pressure at the rate of ~10 mmHg/second.
Continue to release the pressure in the cuff until the aneuroid gauge reads 20 mmHg.
10. Click the Stop button. Make sure the blood pressure cuff is completely deflated and is not
putting any unnecessary pressure on the subject's arm.
11. The subject should continue to relax between Exercises 1 and 2. To improve circulation in his or
her arm, the subject should flex and extend their fingers to encourage blood circulation.
Human Psychophysiology – HeartRate-BP – Labs HP-5-1
Copyright iWorx Systems Inc. Note: Only for evaluation by prospective customers.
iWor
x Sam
ple La
b
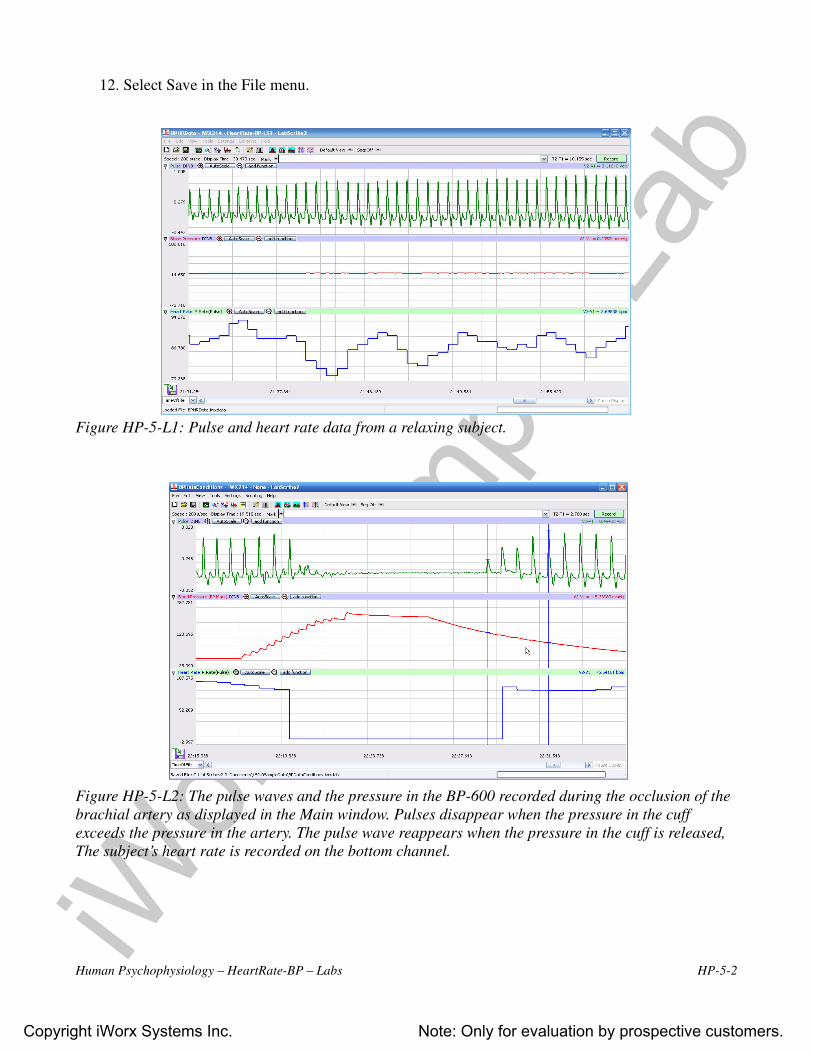
12. Select Save in the File menu.
Figure HP-5-L1: Pulse and heart rate data from a relaxing subject.
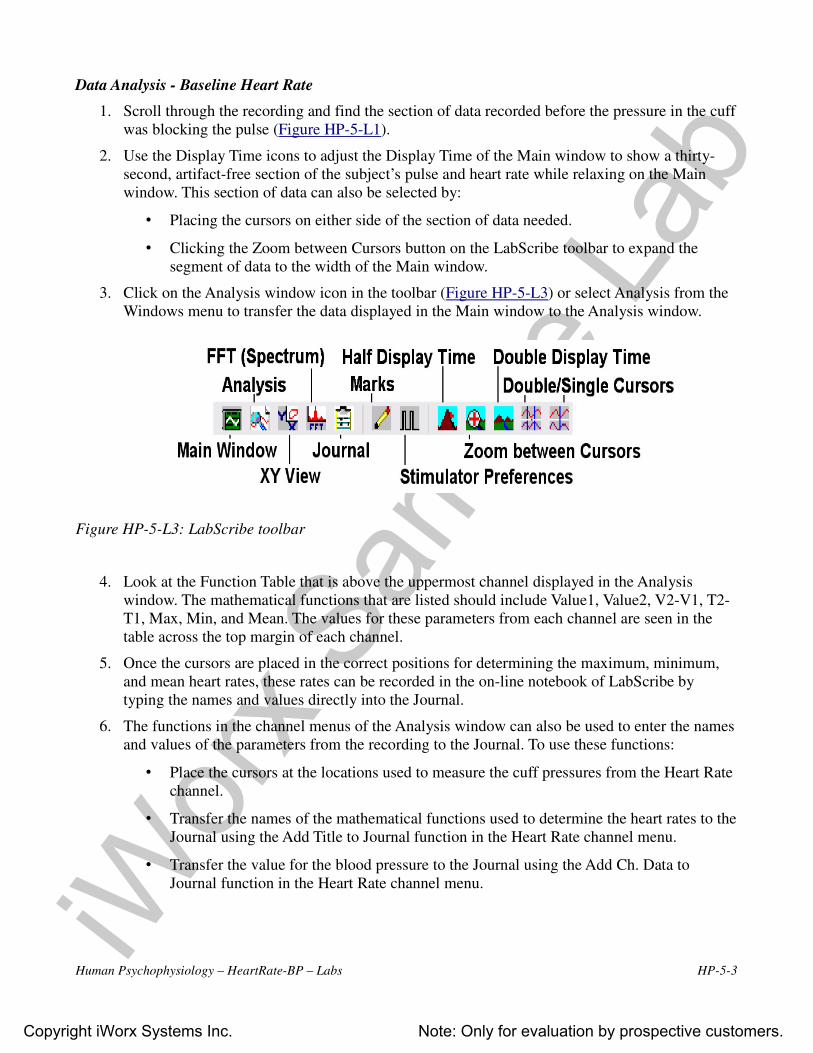
Figure HP-5-L2: The pulse waves and the pressure in the BP-600 recorded during the occlusion of the
brachial artery as displayed in the Main window. Pulses disappear when the pressure in the cuff
exceeds the pressure in the artery. The pulse wave reappears when the pressure in the cuff is released,
The subject’s heart rate is recorded on the bottom channel.
Human Psychophysiology – HeartRate-BP – Labs HP-5-2
Copyright iWorx Systems Inc. Note: Only for evaluation by prospective customers.
iWor
x Sam
ple La
b
Data Analysis - Baseline Heart Rate
1. Scroll through the recording and find the section of data recorded before the pressure in the cuff
was blocking the pulse (Figure HP-5-L1).
2. Use the Display Time icons to adjust the Display Time of the Main window to show a thirty-
second, artifact-free section of the subject’s pulse and heart rate while relaxing on the Main
window. This section of data can also be selected by:
• Placing the cursors on either side of the section of data needed.
• Clicking the Zoom between Cursors button on the LabScribe toolbar to expand the
segment of data to the width of the Main window.
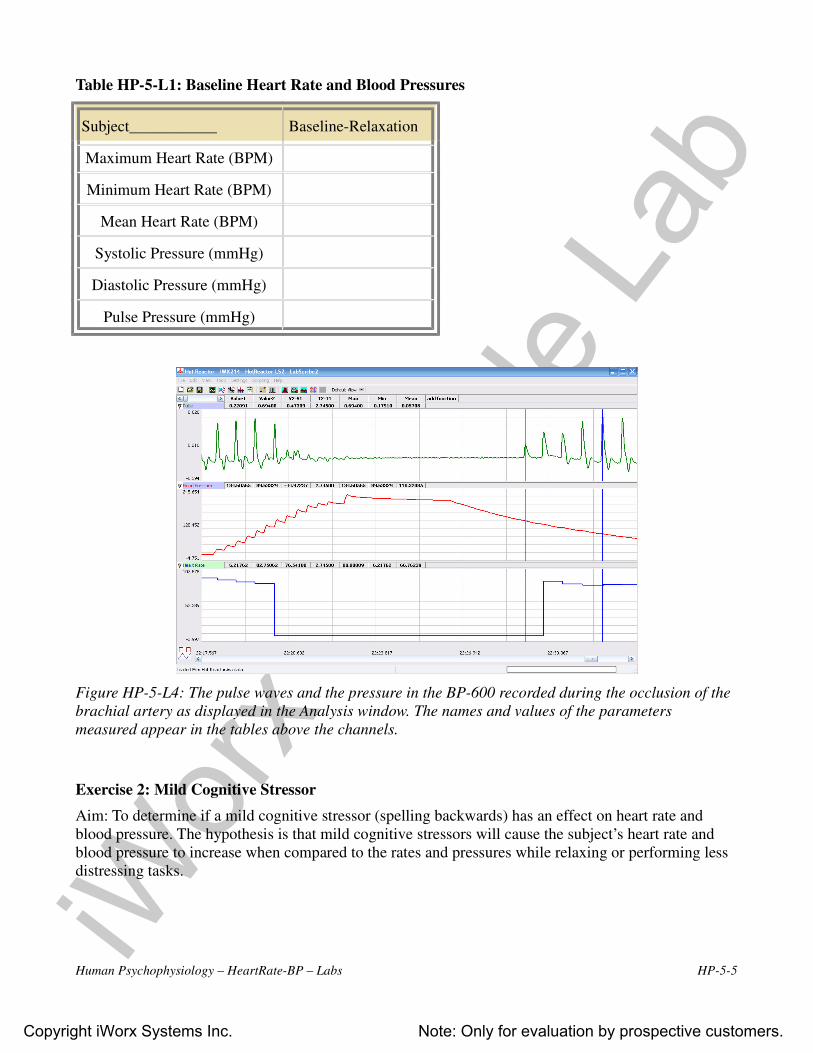
3. Click on the Analysis window icon in the toolbar (Figure HP-5-L3) or select Analysis from the
Windows menu to transfer the data displayed in the Main window to the Analysis window.
Figure HP-5-L3: LabScribe toolbar
4. Look at the Function Table that is above the uppermost channel displayed in the Analysis
window. The mathematical functions that are listed should include Value1, Value2, V2-V1, T2-
T1, Max, Min, and Mean. The values for these parameters from each channel are seen in the
table across the top margin of each channel.
5. Once the cursors are placed in the correct positions for determining the maximum, minimum,
and mean heart rates, these rates can be recorded in the on-line notebook of LabScribe by
typing the names and values directly into the Journal.
6. The functions in the channel menus of the Analysis window can also be used to enter the names
and values of the parameters from the recording to the Journal. To use these functions:
• Place the cursors at the locations used to measure the cuff pressures from the Heart Rate
channel.
• Transfer the names of the mathematical functions used to determine the heart rates to the
Journal using the Add Title to Journal function in the Heart Rate channel menu.
• Transfer the value for the blood pressure to the Journal using the Add Ch. Data to
Journal function in the Heart Rate channel menu.
Human Psychophysiology – HeartRate-BP – Labs HP-5-3

Copyright iWorx Systems Inc. Note: Only for evaluation by prospective customers.
iWor
x Sam
ple La
b
7. On the Heart Rate channel, click and drag one cursor to the left margin of the data displayed in
the Analysis window. Drag the other cursor to the right margin of the same data and measure
the following:
• Maximum Heart Rate. The value for Max on the Heart Rate channel is the subject’s
maximum heart rate while relaxing.
• Minimum Heart Rate. The value for Min on the Heart Rate channel is the subject’s
minimum heart rate while relaxing.
• Mean Heart Rate. The value for Mean on the Heart Rate channel is the subject’s mean
heart rate while relaxing.
8. Record the values for these rates in the Journal using one of the techniques described in Steps 5
or 6, and in Table HP-5-L1.
Data Analysis - Baseline Blood Pressure
1. Scroll through the recording and find the section of data recorded before, during, and after the
pressure in the cuff was blocking the pulse (Figure HP-5-L4).
2. Use the same procedures used in previous section to position the blood pressure data in the
Main window, display the selected data in the Analysis window, position the cursors to make
measurements, and record the values of the parameters in the Journal and in Table HP-5-L1.
3. On the Pulse channel, use the mouse to click on and drag the cursors to specific points on the
recording in the Analysis window to measure the following:
• Systolic blood pressure. To determine the subject’s systolic blood pressure, place a
cursor on the first pulse wave that reappears after the pressure from the cuff of the BP-
600 is released. The value for Value1 on the Blood Pressure channel is the subject’s
systolic blood pressure.
• Diastolic blood pressure. To determine the subject’s diastolic blood pressure, place the
other cursor on the first of the largest pulse waves that reappear as the pressure from the
cuff of the BP-600 is released. The value for Value1 on the Blood Pressure channel is the
subject’s diastolic blood pressure.
• Pulse pressure, or difference between the systolic and diastolic pressures. To measure the
pulse pressure, leave the cursors used to measure the systolic and diastolic pressures.
The value for V2-V1 on the Blood Pressure channel is the subject’s pulse pressure.
4. Record the values for these pressures in the Journal using one of the techniques described in
Steps 5 or 6 of the previous section, and in Table HP-5-L1.
Human Psychophysiology – HeartRate-BP – Labs HP-5-4
Copyright iWorx Systems Inc. Note: Only for evaluation by prospective customers.
iWor
x Sam
ple La
b
Table HP-5-L1: Baseline Heart Rate and Blood Pressures
Subject___________ Baseline-Relaxation
Maximum Heart Rate (BPM)
Minimum Heart Rate (BPM)
Mean Heart Rate (BPM)
Systolic Pressure (mmHg)
Diastolic Pressure (mmHg)
Pulse Pressure (mmHg)
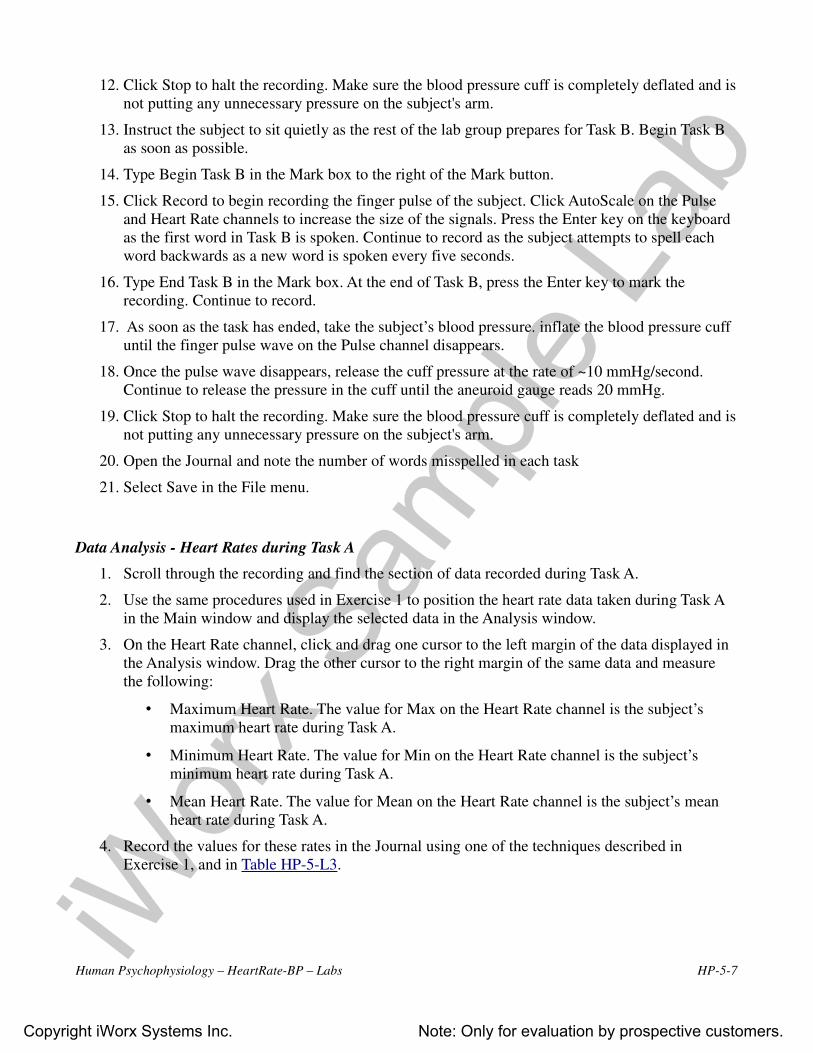
Figure HP-5-L4: The pulse waves and the pressure in the BP-600 recorded during the occlusion of the
brachial artery as displayed in the Analysis window. The names and values of the parameters
measured appear in the tables above the channels.
Exercise 2: Mild Cognitive Stressor
Aim: To determine if a mild cognitive stressor (spelling backwards) has an effect on heart rate and
blood pressure. The hypothesis is that mild cognitive stressors will cause the subject’s heart rate and
blood pressure to increase when compared to the rates and pressures while relaxing or performing less
distressing tasks.
Human Psychophysiology – HeartRate-BP – Labs HP-5-5

Copyright iWorx Systems Inc. Note: Only for evaluation by prospective customers.
iWor
x Sam
ple La
b
Procedure
1. In this exercise, use the same subject used in Exercise 1. Instruct the subject to sit quietly as the
rest of the lab group prepares for this exercise.
2. The pulse plethysmograph should be positioned on the subject’s finger in the same manner that
was used in Exercise 1. The blood pressure cuff should also be positioned around the subject’s
arm in the same manner that was used in Exercise 1.
3. The mild cognitive stressor that will be used in this exercise is spelling backwards. Lists of five-
letter words to be used in the spelling tasks are located in Table HP-5-L2.
4. Select twelve words at random from the list for Task A before the exercise begins. Words from
this list are mated with similar words from the list for Task B. For example, if above is selected
from A list, then abide from B list must be used. Note the twelve words from each list.
5. Designate a member of the lab group to speak the words to the subject during the tasks, and
another member of the group to record the words misspelled by the subject in each task.
6. Before beginning the exercise, inform the subject of the experimental conditions:
• Task A is performed first. In Task A, the subject will spell the twelve words selected
from the A list forwards, as printed.
• Task B is performed second. In Task B, the subject will spell the twelve words from the
B list backwards.
• The words from the B list are paired with the words selected from the A list. The words
from the B list should be spoken in the same order as the words to which they are mated
from the A list.
• The words in each task will be spoken by a member of the lab group at five-second
intervals, whether the subject has finished the spelling of the previous word or not. Since
each task contains twelve words, each task will last one minute.
• Another member of the lab group will keep track of the number of words spelled in error
in each task, whether forward or backward. Spelling of a word that is not completed
before the next word is spoken is considered to be misspelled.
7. Type Begin Task A <Subject’s Name> in the Mark box to the right of the Mark button.
8. Click Record to begin recording the finger pulse of the subject. Click AutoScale on the Pulse
and Heart Rate channels to increase the size of the signals. Press the Enter key on the keyboard
as the first word in Task A is spoken. Continue to record as the subject attempts to spell each
word forwards as a new word is spoken every five seconds.
9. Type End Task A in the Mark box. At the end of Task A, press the Enter key to mark the
recording. Continue to record.
10. As soon as the task has ended, take the subject’s blood pressure. inflate the blood pressure cuff
until the finger pulse wave on the Pulse channel disappears (Figure HP-5-L2).
11. Once the pulse wave disappears, release the cuff pressure at the rate of ~10 mmHg/second.
Continue to release the pressure in the cuff until the aneuroid gauge reads 20 mmHg.
Human Psychophysiology – HeartRate-BP – Labs HP-5-6
Copyright iWorx Systems Inc. Note: Only for evaluation by prospective customers.
iWor
x Sam
ple La
b
12. Click Stop to halt the recording. Make sure the blood pressure cuff is completely deflated and is
not putting any unnecessary pressure on the subject's arm.
13. Instruct the subject to sit quietly as the rest of the lab group prepares for Task B. Begin Task B
as soon as possible.
14. Type Begin Task B in the Mark box to the right of the Mark button.
15. Click Record to begin recording the finger pulse of the subject. Click AutoScale on the Pulse
and Heart Rate channels to increase the size of the signals. Press the Enter key on the keyboard
as the first word in Task B is spoken. Continue to record as the subject attempts to spell each
word backwards as a new word is spoken every five seconds.
16. Type End Task B in the Mark box. At the end of Task B, press the Enter key to mark the
recording. Continue to record.
17. As soon as the task has ended, take the subject’s blood pressure. inflate the blood pressure cuff
until the finger pulse wave on the Pulse channel disappears.
18. Once the pulse wave disappears, release the cuff pressure at the rate of ~10 mmHg/second.
Continue to release the pressure in the cuff until the aneuroid gauge reads 20 mmHg.
19. Click Stop to halt the recording. Make sure the blood pressure cuff is completely deflated and is
not putting any unnecessary pressure on the subject's arm.
20. Open the Journal and note the number of words misspelled in each task
21. Select Save in the File menu.
Data Analysis - Heart Rates during Task A
1. Scroll through the recording and find the section of data recorded during Task A.
2. Use the same procedures used in Exercise 1 to position the heart rate data taken during Task A
in the Main window and display the selected data in the Analysis window.
3. On the Heart Rate channel, click and drag one cursor to the left margin of the data displayed in
the Analysis window. Drag the other cursor to the right margin of the same data and measure
the following:
• Maximum Heart Rate. The value for Max on the Heart Rate channel is the subject’s
maximum heart rate during Task A.
• Minimum Heart Rate. The value for Min on the Heart Rate channel is the subject’s
minimum heart rate during Task A.
• Mean Heart Rate. The value for Mean on the Heart Rate channel is the subject’s mean
heart rate during Task A.
4. Record the values for these rates in the Journal using one of the techniques described in
Exercise 1, and in Table HP-5-L3.
Human Psychophysiology – HeartRate-BP – Labs HP-5-7

Copyright iWorx Systems Inc. Note: Only for evaluation by prospective customers.
iWor
x Sam
ple La
b
Table HP-5-L2: Five Letter Word Lists for Tasks A and B
Task A
Spell Forward
Task B
Spell Backward
Task A
Spell Forward
Task B
Spell Backward
above
adopt
ahead
barge
bread
cable
champ
clean
derby
dough
dream
earth
event
frame
flour
growl
house
joust
leach
learn
abide
adult
alarm
batch
brain
candy
chief
clear
deuce
dozen
drive
empty
exert
frost
flack
grant
heart
juror
lucky
laugh
maple
niche
nectar
prowl
pride
rusty
realm
rapid
sound
smock
start
shawl
tramp
treat
table
wrath
water
weary
young
zeros
mouse
nickel
novel
pearl
prune
rowdy
rafter
ruler
sober
smart
stomp
shock
tackle
truck
truth
whack
worth
woman
yours
zebra
Data Analysis - Blood Pressures after Task A
1. Scroll to the recording of the subject’s blood pressure taken after the completion of Task A.
2. Use the same procedures used in Exercise 1 to position the blood pressure data taken after Task
A in the Main window and display the selected data in the Analysis window.
3. Use the same procedures used in previous section to position the blood pressure data in the
Main window, display the selected data in the Analysis window, position the cursors to make
measurements, and record the values of the parameters in the Journal and in Table HP-5-L3.
4. On the Pulse channel, use the mouse to click on and drag the cursors to specific points on the
recording displayed in the Analysis window to measure the following:
• Systolic blood pressure. To determine the subject’s systolic blood pressure, place a
cursor on the first pulse wave that reappears after the pressure from the cuff of the BP-
600 is released. The value for Value1 on the Blood Pressure channel is the subject’s
systolic blood pressure.
• Diastolic blood pressure. To determine the subject’s diastolic blood pressure, place the
other cursor on the first of the largest pulse waves that reappear as the pressure from the
cuff of the BP-600 is released. The value for Value1 on the Blood Pressure channel is the
Human Psychophysiology – HeartRate-BP – Labs HP-5-8

Copyright iWorx Systems Inc. Note: Only for evaluation by prospective customers.
iWor
x Sam
ple La
b
subject’s diastolic blood pressure.
• Pulse pressure, or difference between the systolic and diastolic pressures. To measure the
pulse pressure, leave the cursors used to measure the systolic and diastolic pressures.
The value for V2-V1 on the Blood Pressure channel is the subject’s pulse pressure.
5. Record the values for these pressures in the Journal using one of the techniques described in
Exercise 1, and in Table HP-5-L3.
Data Analysis - Heart Rates during Task B
1. Scroll through the recording and find the section of data recorded during Task B.
2. Use the same procedures used to measure the heart rates during Task A to measure the heart
rates during Task B.
3. Record the values for these rates in the Journal using one of the techniques described in
Exercise 1, and in Table HP-5-L3.
Data Analysis - Blood Pressures after Task B
1. Scroll to the recording of the subject’s blood pressure taken after the completion of Task B.
2. Use the same procedures used to measure the blood pressures after Task A to measure the blood
pressures after Task B.
3. Record the values for these blood pressures in the Journal using one of the techniques described
in Exercise 1, and in Table HP-5-L3.
Questions
1. Is the subject’s mean heart rate and blood pressure higher during Task A (spelling forward) than
during the baseline measurements taken in Exercise 1?
2. Is the subject’s mean heart rate and blood pressure higher during Task B (spelling backward)
than in the baseline period?
3. Is the subject’s mean heart rate and blood pressure higher in Task B (spelling backward) than in
Task A (spelling forward)?
4. Does your data support the hypothesis that heart rate and blood pressure increases when tasks
that are more distressing are performed?
Human Psychophysiology – HeartRate-BP – Labs HP-5-9

Copyright iWorx Systems Inc. Note: Only for evaluation by prospective customers.
iWor
x Sam
ple La
b
Table HP-5-L3: Heart Rates and Blood Pressures of a Subject Tested for the Effects of a Mild
Stressor and for Reaction Times
Subject_______
Experimental
Condition
Maximum
Heart Rate
(BPM)
Minimum
Heart Rate
(BPM)
Mean
Heart
Rate
(BPM)
Systolic
Pressure
(mmHg)
Diastolic
Pressure
(mmHg)
Pulse
Pressure
(mmHg)
Baseline 1
Spelling Forward
Spelling
Backward
Baseline 2
Reaction Time
References
Cole, P. M., Zahn-Waxler, C., Fox, N. A., Usher, B. A., & Welsh, J. D. (1996). Individual Differences in
Emotion Regulation and Behavior Problems in Preschool children. Journal of Abnormal Psychology,
105(4), 518-529.
Eisenberg, N., Fabes, R. A., Karbon, M., Murphy, B. C., Carlo, G., & Wosinski, M. (1996). Relations
of School Children’s Comforting Behavior to Empathy-related Reactions and Shyness. Social
Development, 5(3), 330-351.
Harris, R. M., Porges, S. W., Carpenter, M. E., & Vincenz, L. M. (1993). Hypnotic Susceptibility, Mood
State, and Cardiovascular Reactivity. American Journal of Clinical Hypnosis, 36(1), 15-25.
Jemerin, J. M. & Boyce, W. T. (1990). Psychobiological Differences in Childhood Stress Response. II.
Cardiovascular Markers of Vulnerability. Journal of Developmental Behavioral Pediatrics, 11(3), 140-
150.
Kagan, J., Reznick, J. S., & Snidman, N. (1987). The Physiology and Psychology of Behavioral
Inhibition in Children. Child Development, 58, 1459-1473.
Lane, J. D., Adcock, R. A., & Burnett, R. E. (1992). Respiratory Sinus Arrhythmia and Cardiovascular
Responses to Stress. Psychophysiology, 29(4), 461-470.
Porges, S. W. (1992). Vagal tone: A Physiological Marker of Stress Vulnerability. Pediatrics, 90(3),
498-504.
Thayer, J. F., Friedman, B. H. & Borkovec, T. D. (1996). Autonomic Characteristics of Generalized
Anxiety Disorder and Worry. Biological Psychiatry, 39(4), 255-266.
Human Psychophysiology – HeartRate-BP – Labs HP-5-10