Executive Remuneration in Finland - EY · Executive Remuneration in Finland Empirical data ... so...
36
Executive Remuneration in Finland Empirical data analysis, legislation, taxation and vision 2016
Transcript of Executive Remuneration in Finland - EY · Executive Remuneration in Finland Empirical data ... so...

ExecutiveRemunerationin Finland Empirical data analysis, legislation,taxation and vision
2016


Contents
1. About the report . . . . . . . . . . . . . . . . . . . . . . . . . . . . . . . . . . . . . . . . . . . . .4
2. Executive summary . . . . . . . . . . . . . . . . . . . . . . . . . . . . . . . . . . . . . . . . . .5
3. Global trends. . . . . . . . . . . . . . . . . . . . . . . . . . . . . . . . . . . . . . . . . . . . . . . . . .6
4. Board and management team diversity. . . . . . . . . . . . . . . . . . .8
5. Board remuneration . . . . . . . . . . . . . . . . . . . . . . . . . . . . . . . . . . . . . . . 13
6. CEO and management team remuneration. . . . . . . . . . . . . 15
7. Regulatory perspective. . . . . . . . . . . . . . . . . . . . . . . . . . . . . . . . . . . . 26
8. Sustainability. . . . . . . . . . . . . . . . . . . . . . . . . . . . . . . . . . . . . . . . . . . . . . . . 29
9. Taxation. . . . . . . . . . . . . . . . . . . . . . . . . . . . . . . . . . . . . . . . . . . . . . . . . . . . . . 31
10. Our team . . . . . . . . . . . . . . . . . . . . . . . . . . . . . . . . . . . . . . . . . . . . . . . . . . . . 34

4 | Finnish Executive Remuneration Report | 2016
CHAPTER 1
About the report
Welcome to our first EY Executive Remuneration report produced in Finland, put together by our local People Advisory Services professionals in collaboration with EY’s Nordic network.
In this report, we aim to give you a comprehensive overview of the contemporary debates and developments in executive remuneration, contrasting both local and global findings. From a holistic perspective, we provide you with selected insights into how concepts such as gender diversity, nationality, sustainability, regulation and compliance come into play in executive remuneration strategies.
In this spirit, we invite you to read this report and consider how executive remuneration can bear a valuable impact upon your business − opening up new opportunities to achieve growth, innovation and success in the near and longer-term future.
Should any of the contents and viewpoints presented in this report provoke ideas or questions, please do not hesitate to contact us for further discussion. For more information on our services and knowhow, please visit our website at ey.com/fi.
Practical considerationsWe have based our studies on publicly available data on all companies listed on the OMX Helsinki’s main list stock exchange in the years 2012−2015.
Moreover, we have structured our analysis using identical size classification as is used in the OMX Helsinki (large capital, mid-size capital and small capital companies). Companies listed on First North were excluded from our analysis as they generally disclose only limited data on remuneration.
Lastly, we have included benefits in kind in the base salary figures since many of the studied companies do not disclose these figures separately. Also, as Finnish listed companies typically report salary costs for the management team (MT) as a total sum, the average levels per management member were calculated for each company, and the median levels were drawn from these values.
Sincerely,
Mikko NikunenPartner, People Advisory Services
Hannu TyyskäSenior Manager, People Advisory Services

Finnish Executive Remuneration Report | 2016 | 5
Executive remuneration has been, and continues to be, a hot topic both in Finland and abroad. Big rewards received by executives continue to make headlines year after year. At the same time, remuneration − and especially incentives − are seen as a means to steer executive performance, driving company performance, and to align executives’ and shareholders’ interests.
Because executive pay is considered to bear a large impact on company performance and economy, more and more regulation has been put in place for executive remuneration. Different regulation affecting executive pay includes, for instance, the Finnish Corporate Governance Code 2015 (“the Code”), multiple directives for remuneration within the financial sector, and the European Commission proposal for Shareholders’ Rights Directive. These regulations all aim to enhance transparency by demanding better disclosure of executive remuneration, to prevent excess risk-taking and too much focus on short-term returns, to increase shareholders’ influence over executive pay, and to boost companies’ long-term success.
The Code did, however, introduce a recommendation promoting the “diversity of the know-how, experience and opinions of the directors of the board”. This is a very welcome development as there is a lot of evidence that diversity in boards and management teams leads to better company performance. By looking at the time period of 2012−2015, we can see that the boards and management teams of Finnish companies are dominated by Finnish males. Even though the proportional number of females and non-Finns is on the increase, the pace of change is slow.
These new developments are in line with EY’s view on executive reward. Ideal remuneration arrangements strike the right balance between strategic and tactical business goals, attract and retain the right talent to deliver on such objectives, and discourage excessive risk-taking. On the other hand, remuneration structures should not reward executives for shortcomings, should be fair and valued by executives, and reflect performance both at individual and company level.
Reflecting international regulatory trends, we expect to see movement also in the Finnish market in the coming years, even though during the period of 2012−2015 no major changes were implemented in executive remuneration levels and instruments used in Finland.
There have been no significant changes to the Finnish tax or social security legislation in the years 2014–2016 as regards executive remuneration. However, Finnish tax and social security authorities have issued new guidance on the interpretation of rules allowing for long-term, equity-based incentives to be exempted from the different Finnish employee and employer social security contributions.
Moreover, increasing public and institutional investors’ interest in sustainability issues puts pressure on companies to take sustainability issues into account in their decision-making and incentive structures. So far, the actual influence of sustainability on salary policies in Finnish companies is very small, and only few companies have sustainability and ethics committees as part of their boards. However, we predict that especially in consumer goods, utilities, energy and automotive industries, sustainability and ethics committees will become more prevalent in the near future.
CHAPTER 2
Executive summary

6 | Finnish Executive Remuneration Report | 2016
CHAPTER 3
Global trends
Globally, EY has identified the following key trends in the current executive remuneration environment.
• Transparency and say on pay
Both in Europe and globally, an increased emphasis is seen on transparency and disclosure of executive remuneration policy and practice. In July 2015, the European Parliament voted to adopt several amendments to the Shareholders’ Rights Directive (SRD), including new reporting requirements that aim for higher degrees of transparency, and requirements aimed at strengthening stakeholders’ say on directors’ pay. An increased degree of say on pay has also led to a shift in executive compensation structure in the United States, whereby compensation packages are based on an increasing portion of long-term incentives. In Asia, many countries are focusing on disclosure of either remuneration principles and/or actual remuneration levels.
• Increased scrutiny of performance metric selection
As a growing awareness is seen globally about the alignment of pay and performance, so is an awareness of the importance of appropriate performance criteria. Several companies are adopting non-financial performance metrics into their incentive schemes, in addition to more traditional financial metrics. Among financial performance metrics, surveys from Europe and the US suggest that the popularity of relative Total Shareholder Return (TSR) has increased considerably over the past few years and that it is now the most widely used financial performance metric among listed companies. However, critics argue that the link between executive performance and TSR is generally low, and that its relevance in executive incentive plans is therefore questionable. Moreover, among the previously mentioned amendments to the SRD are also new requirements for share-based executive pay. The purpose of these amendments is to ensure that share-based remuneration does not represent the most significant part of directors’ variable remuneration. These amendments may potentially introduce a ceiling for pay-outs from schemes that use TSR.
• Tailored and data driven compensation programs design
A shift is seen away from the “one size fits all” compensation paradigm to a more tailored and analytical approach to executive remuneration. By designing and implementing a compensation program that truly reflects company goals, values and business strategy, companies may expect to experience a better alignment of executive and shareholder interests as well as a wider range of desirable leadership behaviors from executives. Moreover, an increased awareness is seen about the importance of identifying appropriate peer groups when benchmarking executive remuneration levels. The assessment and design of compensation elements are thus more data driven than previously, with an increased focus on obtaining and comparing data on relevant parameters from market practice.

Finnish Executive Remuneration Report | 2016 | 7
• Increased need for compliance
There is globally a growing concern around compliance. Compliance requirements typically include tax and social security compliance, but depending on the country in question, may also feature other registration or reporting obligations, currency controls, country-specific rules regarding executive remuneration or the publishing thereof, etc. It is expected that developments such as the OECD’s Base Erosion and Profit Shifting (BEPS) initiative will further increase this burden.
The BEPS initiative is an action plan, developed by OECD, aimed at addressing issues around global tax rules and their application by multi-national companies. Among the several implications BEPS will have for executive remuneration, rewarding and transfer pricing principles will be more aligned. In this regard, it is anticipated that tax authorities will, going forward, e.g. closely scrutinize the targets established for executives of subsidiaries to confirm whether the targets are in line with the operating model and the risk profile of the subsidiary.

8 | Finnish Executive Remuneration Report | 2016
CHAPTER 4
Board and management team diversity
The 2015 Code pays more attention to board diversity, meaning especially gender diversity, but also to the diversity of the knowhow, experience and opinions of the directors. By looking at gender and ethnic diversity in Finnish boards, we can see that even though current developments indicate diversifying boards, the change remains slow.
New research from The Peterson Institute for International Economics and EY shows that having more female leaders in business can significantly increase profitability. The report, Is Gender Diversity Profitable? Evidence from a Global Study, reveals that an organization with 30 percent female leaders could add up to 6 percentage points to its net margin. This in-depth study analyzes results from approximately 21,980 global publicly traded companies in 91 countries from a variety of industries and sectors.
Furthermore, it was discovered that nearly one-third of companies globally have no women on either board or C-suite positions, 60 percent have no female board members, 50 percent have no female top executives, and less than 5 percent have a female CEO. In Finnish companies in 2015, on the contrary, almost 90 percent of boards and top executive teams have female members. Even so, the proportional number of women sitting on the boards of Finnish companies still lies between 20 and 30 percent. There is an upward trend in the percentage of women over time (2012−2015), yet this growth remains very modest.
Also, the boards of Finnish companies are clearly dominated by Finnish nationals. In 2015, a little less than half of boards had a non-Finnish member. The median percentage of non-Finnish members in small companies was zero during the entire period of 2012−2015, and the same applied to mid-size companies until 2014. Large companies, meanwhile, had a median percentage of non-Finns of 30 to 35 percent in each year between 2012−2015.
As regards non-Finnish members, their number on management teams resembles the situation in gender diversity. Only 25 percent of Finnish companies have no non-Finnish top executives, but the median percentage of non-Finnish members is still low at 15 to 30 percent. Median percentage of non-Finnish members in small cap companies was 0 in 2015, and no clear upward trend can be detected in this regard.
“In Finnish companies almost 90 % of boards and top executive teams have female members. Globally 50 % have no female top executives.”

Finnish Executive Remuneration Report | 2016 | 9
Board member diversity
Figure 1: Median percentage of male and female board members by company size in 2012−2015
Figure 1 illustrates board diversity in terms of the percentage of male and female members. This measure of diversity is slightly higher among the large companies compared to mid-size and small companies. In all categories, the percentage of women is higher in 2015 than in 2012, but the 2015 levels for female participation are still considerably lower than the equivalent figures for their male counterparts.
0 % 20 % 40 % 60 % 80 % 100 %
2012
2013
2014
2015
2012
2013
2014
2015
2012
2013
2014
2015
Male Female
Larg
eSm
all
Mid
“In Finnish companies almost 90 % of boards and top executive teams have female members. Globally 50 % have no female top executives.”

10 | Finnish Executive Remuneration Report | 2016
Figure 2: Median percentage of Finnish and foreign board members by company size in 2012–2015
As seen in figure 2, boards are clearly dominated by Finnish nationals. The median percentage of non-Finnish members in small companies was zero during the entire period, and the same applied to mid-size companies up until 2014. Large companies, meanwhile, had a median percentage of non-Finns of 30 to 35 % in each year between 2012−2015.
Figures 3 and 4 show the portion of companies that had at least one female or non-Finnish board member per year in 2012−2015. The clear majority of companies had at least one female board member, although no significant change is seen in the portion of companies with zero female board members. Meanwhile, only approximately half of the companies had at least one non-Finnish board member in 2015. This portion has increased slightly since 2012, where companies with at least one non-Finnish board member represented the minority.
0 Females>0 Females
2012201320142015
0 Non-Finns>0 Non-Finns
2012201320142015
Figure 3: Portion of companies with at least one female board member in 2012–2015
Figure 4: Portion of companies with at least one non-Finnish board member in 2012−2015
0% 20% 40% 60% 80% 100%
2012
2013
2014
2015
2012
2013
2014
2015
2012
2013
2014
2015
Non-FinnishFinnish
Larg
eSm
all
Mid

Finnish Executive Remuneration Report | 2016 | 11
Management team diversity
Out of the CEOs of 123 companies listed on the Helsinki Stock Exchange in 2015, only one was female and three were non-Finnish nationals. Due to such low numbers, no further analyzes were carried out on CEO diversity.
Figure 5: Median percentage of male and female MT members by company size in 2012−2015
As seen in figure 5, the median percentage of female MT members has remained below 30 % in companies of all sizes throughout 2012–2015. Mid-size companies displayed the largest increase in median percentage of females, while small and large companies demonstrated little to no increase.
As for the prevalence of non-Finnish MT members, participation numbers were considerably higher among large companies compared to mid-size and small equivalents, as evidenced in figure 6. In small and mid-size companies, the median percentage of non-Finns decreased from 2012 to 2015.
Moreover, as figures 7 and 8 illustrate, the portion of companies with at least one female and/or non-Finnish MT member seems to have stayed fairly stable between 2012 and 2015.
0% 20% 40% 60% 80% 100%
2012
2013
2014
2015
2012
2013
2014
2015
2012
2013
2014
2015
Larg
eSm
all
Mid
Male Female

12 | Finnish Executive Remuneration Report | 2016
Figure 6: Median percentage of Finnish and non-Finnish MT members by company size in 2012−2015
0 Females>0 Females
2012201320142015
0 Non-Finns>0 Non-Finns
2012201320142015
Figure 7: Portion of companies with at least one Female MT member 2012 - 2015
Figure 8: Portion of companies with at least one Non-Finnish MT member 2012 - 2015
0% 20% 40% 60% 80% 100%
2012
2013
2014
2015
2012
2013
2014
2015
2012
2013
2014
2015
Non-Finnish Finnish
Larg
eSm
all
Mid
Finnish Executive Remuneration Report | 2016 | 13
Remuneration levels of board chairmen and members, as well as the number of board members, have remained practically constant over the time period of 2012–2015. Chairmen of the board tend to receive an annual fee that is roughly double compared to board members. Median board size ranges from 5 to 8 individuals depending on company size.
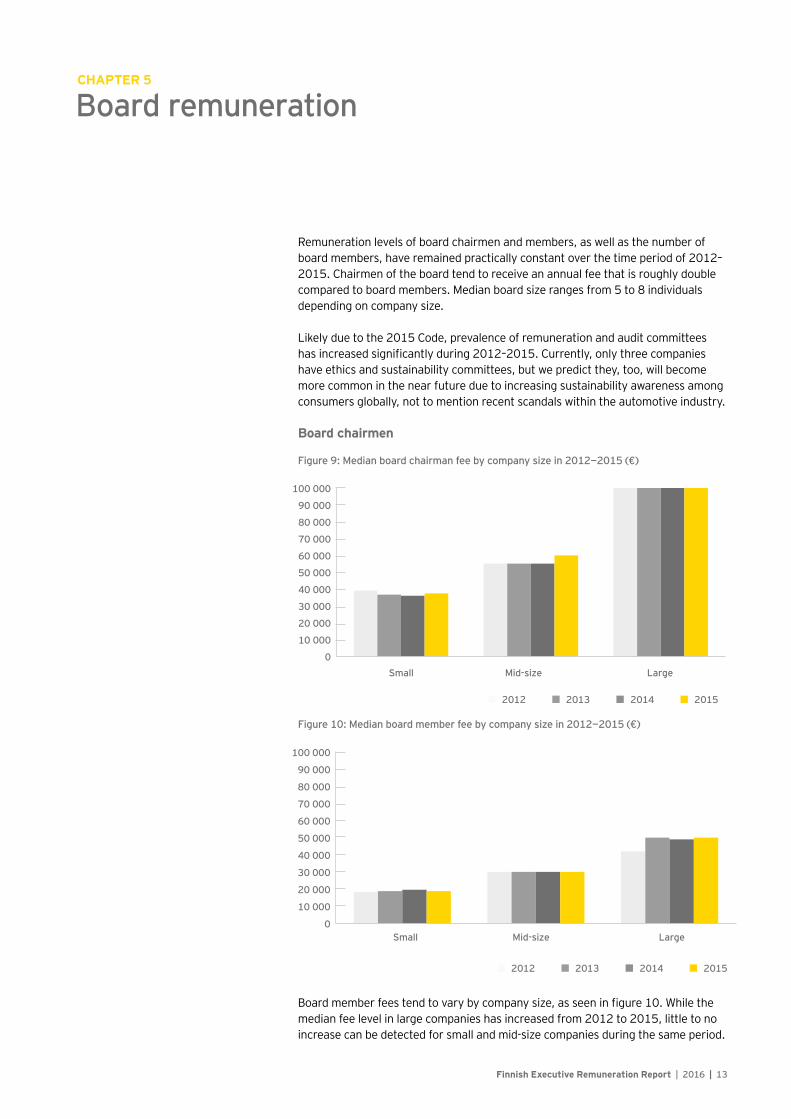
Likely due to the 2015 Code, prevalence of remuneration and audit committees has increased significantly during 2012–2015. Currently, only three companies have ethics and sustainability committees, but we predict they, too, will become more common in the near future due to increasing sustainability awareness among consumers globally, not to mention recent scandals within the automotive industry. Board chairmen
Figure 9: Median board chairman fee by company size in 2012−2015 (€)
Board member fees tend to vary by company size, as seen in figure 10. While the median fee level in large companies has increased from 2012 to 2015, little to no increase can be detected for small and mid-size companies during the same period.
CHAPTER 5
Board remuneration
201520142012 2013
0
10 000
20 000
30 000
40 000
50 000
60 000
70 000
80 000
90 000
100 000
Small Mid-size Large
201520142012 2013
0
10 000
20 000
30 000
40 000
50 000
60 000
70 000
80 000
90 000
100 000
Small Mid-size Large
201520142012 2013
Figure 10: Median board member fee by company size in 2012−2015 (€)
14 | Finnish Executive Remuneration Report | 2016
Committees
Figure 11: Portion of companies with an audit committee by company size in 2012−2015
Figure 12: Portion of companies with a remuneration committee by company size in 2012−2015
The prevalence of audit and remuneration committees varies by company size, as seen in figures 11 and 12. However, the portion of mid-size and small companies with an audit and/or remuneration committee increased between 2012 and 2015. Other existing committees are grouped around themes such as sustainability and ethics, corporate governance, research and development (R&D), as well as temporary working committees like demerger committees. We predict that sustainability and ethics committees, in particular, will become more prevalent in the future due to increasing attention to corporate sustainability and ethical behavior.
2012201320142015
Large Mid Small
2012201320142015
2012201320142015
NoYes
2012201320142015
Large Mid Small
2012201320142015
2012201320142015
NoYes

Finnish Executive Remuneration Report | 2016 | 15
This section provides insight into the remuneration levels for CEOs and other management team members over the period of 2012−2015. In general, no significant changes have occurred in remuneration of CEOs and other management team members during this time. Base salaries have seen a modest increase in most cases. Short-term incentive (STIs) and long-term incentive (LTIs) payouts have proved more volatile, but on aggregate level, it seems that the makeup of remuneration remains stable.
Variable pay has raised much debate recently, particularly the ratio between fixed and variable pay. Indeed, it is very important to offer executives an optimal pay mix that, on one hand, provides sufficient incentives for improving (long-term) business performance, and, on the other hand, prevents taking excessive risks. An optimal pay mix can be determined best by having a clear understanding of how performance is defined and how it can be measured.
It is widely accepted that the quality of performance measures depends on how much control the executive has over it, as well as the extent to which the said measures align with the interests of company owners. Consequently, when available performance measures are weak, variable remuneration should optimally also carry less emphasis, and vice versa. Therefore, optimal pay mix for an executive of a specific company cannot be determined by benchmarking alone. By taking the quality of available performance measures into account, remuneration committees can optimize a pay mix based on a benchmarked starting point.
Finally, behavioral aspects are also important in finding the right, attractive balance of pay. Altogether, remuneration committees must consider various, often complex factors in their decision-making, reflecting the level of challenge they face.
CHAPTER 6
CEO and management team remuneration
“Variable pay has raised much debate recently, particularly the ratio between fixed and variable pay.”

16 | Finnish Executive Remuneration Report | 2016
CEO and management team total compensation
In general, executive compensation is categorized into the following elements: base salary, benefits, STIs, LTIs and pension. As figure 13 illustrates, there are considerable differences in CEO compensation levels depending on company size. While neither large, mid-size nor small companies have seen a steady increase in median compensation levels between 2012 and 2015, the levels are higher at the end of the interval than at the beginning. Figure 13: Median CEO total compensation by company size in 2012−2015 (€)
Figure 14: CEO compensation elements in 2012−2015
0
20 0000
40 0000
60 0000
80 0000
100 0000
120 0000
Small Median Large
2012 2013 2014 2015
STIBase salary LTI
2012201320142015
All companies

Finnish Executive Remuneration Report | 2016 | 17
As seen in figure 15, company size also affects the relative size of compensation elements. For instance base salary and STI represented a more significant part of CEO compensation in small and mid-size companies than in large companies.
Figure 15: CEO median total compensation by element and company size in 2012–2015
Figure 16: Average MT member median total compensation by element and company size in 2012–2015
As Figures 15 and 16 suggest, CEOs receive considerably higher compensation compared to other management team members. This difference applies to the entire time bracket of 2012−2015 and for all compensation elements. Furthermore, compensation levels vary remarkably by company size. Median total compensation levels for CEOs in small companies were lower than median total compensation levels for average MT members in large companies. While neither large, mid-size nor small companies have seen a steady increase in median compensation levels between 2012 and 2015, the levels are higher at the end of the interval than at the beginning.
0
500 000
1 000 000
1 500 000
2012 2013 2014 2015
Large companies
0
500 000
1 000 000
1 500 000
2012 2013 2014 20150
500 000
1 000 000
1 500 000
2012 2013 2014 2015
LTISTIBase salary
Small companiesMid-size companies
0
100 000
200 000
300 000
400 000
500 000
2012 2013 2014 2015
Large companies
0
100 000
200 000
300 000
400 000
500 000
2012 2013 2014 20150
100 000
200 000
300 000
400 000
500 000
2012 2013 2014 2015
Small companiesMid-size companies
LTISTIBase salary

18 | Finnish Executive Remuneration Report | 2016
Pension plans
Defined contribution plan emerges as the preferred pension plan type, and the age of retirement in these pension plans has risen.
In 2017, a pension reform will be implemented in Finland. The reform will rise the earliest eligibility age for statutory, old-age pension gradually from 63 to 65 years. After that, it will be linked to life expectancy. Companies are faced with a choice on how to compensate for the rise of retirement age, or whether to compensate for it at all.
The retirement age of statutory pension is currently 63. With supplementary pension, a company may have offered employees the old-age pension track e.g. at age of 60. Now, when the retirement age of statutory pension rises, a company can rise the retirement age of the supplementary pension respectively.
Sticking to the existing retirement age policy will increase insurance premiums in defined benefit plans. In these cases, defined contribution plans are more flexible. For example, in order to keep the same payment program and the retirement age, the level of pension can be adjusted lower.
Available options also depend on the contracts between the company and the executive. It remains to be seen how companies deal with such cases.
Figure 17: Pension plan type 2015*
* Of companies that disclose this information
The majority of companies in the data did not report the type of pension plan they operate for executives. Among those that did, however, clearly the preferred plan type was defined contribution (DC), as seen in Figure 17.
DefinedBenefit
DefinedContribution
“In 2017, a pension reform will be implemented in Finland.”

Finnish Executive Remuneration Report | 2016 | 19
As shown in figure 18, the median retirement age for CEOs has increased gradually in the period of 2012–2015, among large companies in particular.
Figure 18: Median CEO retirement age by company size in 2012–2015
Short-term incentives (STIs)
Short term incentive levels, as reported each year, relate to performance over the previous one year period. As company performance varies from year to year, we typically see that STI payouts vary as well, indicating a “pay for performance” relationship.
Short term performance is typically measured by the level of profit that a company generates in a year. However, focusing on maximizing annual profit can be very harmful for sustainable profitability. For instance, executives who are solely incentivized to maximize annual profit might reject sound investments or cut R&D costs so as to increase the bottom line, thereby potentially harming long-term business performance.
Most companies have tried to mitigate this risk by providing executives with long-term incentives as well. In addition, in the absence of one perfect short-term performance measure, companies have chosen to combine different short-term performance measures to mitigate this risk.
2015
55
56
57
58
59
60
61
62
63
64
65
LargeMidSmall
20142012 2013
“In 2017, a pension reform will be implemented in Finland.”

20 | Finnish Executive Remuneration Report | 2016
Figure 19: Median CEO STI payment as percentage of base salary by company size in 2012–2015
Figure 20: Median average MT member STI payment as percentage of base salary by company size in 2012–2015
Figures 19 and 20 show that CEOs’ STI payments tend to represent equal to a notably higher percentage of their base salaries than the STIs of MT members. Moreover, the gap between maximum bonus potential (median STI cap) and actual payouts was larger for MT members than for CEOs. The differences in STI to base salary ratio by company size, on the other hand, are less significant than the differences in absolute levels (figures 15 and 16).
0%
10%
20%
30%
40%
50%
60%
70%
80%
Small Mid-size Large
Median STI cap
201520142012 2013
0%
10%
20%
30%
40%
50%
60%
Small Mid-size Large
Median STI cap
201520142012 2013
The most common STI performance criteria in descending order:• Profit measures: e.g. EBIT, EBITDA, gross margin• Return measures: e.g. TSR, ROCE• Growth measures: e.g. turnover growth, growth of net assets

Finnish Executive Remuneration Report | 2016 | 21
Long-term incentives (LTIs)
Long term incentives are offered to executives so as to increase their focus on the longer term, and thereby align the interests of executives and companies’ (long-term) shareholders. Plan length varies from 1 to 6 years, while majority of plans have a total length of 3 years in Finnish companies. Most companies offer LTI grants every year in order to continuously provide long-term incentives. This prevents longer-term focus from faltering, should performance targets of previous grants become or seem unattainable.
A viable alternative for strengthening the executives’ focus on the longer term is the use of shareholding requirements. Executives are, then, required to hold at least a certain amount of shares, often expressed in value as a percentage of fixed salary, in the company – typically 50 or 100 percent of annual base salary.
Figure 21: Median CEO LTI payment as percentage of base salary by company size in 2012–2015 (excluding zeros)
Figure 22: Median average MT member LTI payment as percentage of base salary by company size in 2012–2015 (excluding zeros)
While LTI to base salary ratio levels remained relatively stable for CEOs and MT members in large companies, the small and mid-size companies generally saw a greater degree of volatility between 2012 and 2015. These differences are seen in figures 21 and 22. For instance, the percentage of LTI of base salary among small-company CEOs more than doubled from 2012 to 2015, while MT members in
0%10%20%30%40%50%60%70%80%90%
Small Mid-size Large
201520142012 2013
0%
10%
20%
30%
40%
50%
60%
Small Mid-size Large
201520142012 2013

22 | Finnish Executive Remuneration Report | 2016
the same companies only saw a peak in 2013 before returning to roughly the same levels in 2015 as in 2012.
An LTI plan was in place in majority of companies in 2015, as seen in figure 23.
Figure 23: Companies with CEO LTI plan 2015
LTI design
Performance share plans (with and without restriction) continue to be the most common plan type implemented during 2014−2016. Popularity of all employee share plans is declining among all companies, and no new management holding companies have been set up. Moreover, the number of option plans implemented is also higher than in previous years, with majority of these plans implemented in small cap growth companies.
There also seems to be an upward trend in restricted share plans aimed at retention, especially in large cap companies. These plans typically complement a performance share plan, and are directed towards a smaller amount of key employees, in many cases CEOs and management team members only.
YesNot disclosed No
“In Finland only 63% of the companies have CEO LTI plan.”

Finnish Executive Remuneration Report | 2016 | 23
Figure 24: Frequency of plan types in all companies in 2010−2016
Figure 25: Frequency of plan types by company size in 2014−2016
FY 10/11
0% 10% 20% 30% 40% 50% 60%
Restricted shares / restricted share units
PSP with restrictions
Phantom option plan
Performance share plan (PSP)
Option plan
Matching Share Plan / PSP with own investment
Management holding company
Cash plan with purchase obligation
Cash plan
All employee share plan
FY 14-16 FY 12/13
Small 2014-2016
0% 10% 20% 30% 40% 50%
Restricted shares / restricted share units
PSP with restrictions
Phantom option plan
Performance share plan (PSP)
Option plan
Matching Share Plan / PSP with own investment
Management holding company
Cash plan with purchase obligation
Cash plan
All employee share plan
Mid 2014-2016Large 2014-2016
“In Finland only 63% of the companies have CEO LTI plan.”

24 | Finnish Executive Remuneration Report | 2016
The graph below shows the percentage of companies that have incorporated a certain performance measure in their LTI plan. Most prevalent metrics are related to, in this order, profitability, growth and total shareholder return (TSR) average. This is different from most developed countries where TSR in general and especially relative TSR have for a long time been the most prevalent performance metrics for LTI plans. We expect that TSR and relative TSR will become more prevalent in Finnish companies in case the Shareholders’ Rights Directive and say on pay policy are implemented in Finland.
In many cases, more than one metric is used per plan to ensure that different measurement aspects are taken into account. On average, around 1.6 metrics are used per plan.
Figure 26: Frequency of metrics used in performance based plans released in 2014−2016
Figure 27: Number of performance measures used per plan in 2014−2016
0% 10% 20% 30% 40% 50%
Profitability (EBIT, profit,…)
Growth (revenue, sales,…)
EPS
TSR
ROCE / ROI / Other returns
Relative measures
Cash Flow
Non-Financial
Board discretion
Other
0
5
10
15
20
25
1 2 3

Finnish Executive Remuneration Report | 2016 | 25
Figure 28: Plan length in 2014−2016 plans
0
1
2
3
4
5
6
7
Earning Restriction Total
Minimum MaximumMedian

26 | Finnish Executive Remuneration Report | 2016
CHAPTER 7
Regulatory perspective
• ►The Finnish Limited Liability Companies Act (FCA) lays the framework for companies’ organization, governing bodies, their roles, responsibilities and relation to each other. However, the FCA includes only few specific rules concerning directors’ and managing directors’ remuneration.
• When it concerns credit institutions and insurance companies, the Finnish Insurance Companies Act (Section 6:17) and especially the Act on Finnish Credit Institutions (Section 8) contain more detailed rules on remuneration.
• The Finnish Corporate Governance Code 2015 provides, however, by far the most important and pertinent guidelines, as it concerns the remuneration of directors, managing directors and other executives in companies listed on the Helsinki Nasdaq.
• The Code includes i) three recommendations (§ 22-24) on remuneration ii) a recommendation on remuneration committee (§ 17) and iii) a separate section on Remuneration Reporting.
The Code recommends the following vis-à-vis remuneration:
Recommendation 22: Decision-making relating to remunerationThe general meeting shall decide on the remuneration payable for board and committee work as well as on the basis for its determination. The board of directors shall decide on the remuneration of the managing director as well as on the other compensation payable to him or her. The company shall specify the decision-making procedure for the remuneration of the other executives.
According to the rationale in the recommendation, the remuneration of a person is generally decided on by the body responsible for the appointment of the said person. However, the general meeting of the shareholders shall always decide, or it may authorize the board of directors to decide, on the issue of shares or option rights as part of the remuneration package.
The Finnish Corporate Governance Code 2015 • ►The Code is a collection of recommendations on good corporate governance
for listed companies.• The Code is to be applied in accordance with the ‘comply or explain’
principle. Thus, the starting point is that the company shall comply with all recommendations of the Corporate Governance Code. The company may, however, depart from the specific recommendations, provided that it has good reasons for doing so. Any such departures from the Code, including reasons therefor, shall be disclosed on the company’s website and in its annual Corporate Governance Statement.
• Companies cannot, however, depart from the obligation to issue a Remuneration Statement as specified in the Code’s reporting section.
• ►The current Code has been in force as of 1 January 2016. • For more information regarding the Code and its recommendations
and rationale for the recommendations, please visit: http://cgfinland.fi/files/2015/10/hallinnointikoodi-2015eng.pdf

Finnish Executive Remuneration Report | 2016 | 27
If the company has a remuneration committee, it may be assigned the duty of conducting preparatory work for defining the remuneration of a managing director. The remuneration committee may also e.g. make preparations for the decision-making process on the remuneration of other executives.
Recommendation 23: Remuneration and shareholdings of the board of directorsRemuneration for board and committee work may be paid, either fully or in part, in the form of company shares. Remuneration of a non-executive director (of the board) shall be arranged separately from the share-based remuneration scheme applicable to the company’s managing director, other executives, or personnel.
According to the rationale in the recommendation, the use of share-based remuneration schemes for remunerating non-executive directors is not, as a rule, justified from the perspective of the interests of the shareholders. If the board of directors participates in the same share-based remuneration scheme as the other executives or personnel, the implementation of the supervisory duty of the board of directors may be hindered, and it may also lead to conflicts of interest.
Recommendation 24: Structure of remunerationThe objective of remuneration is to promote the long-term financial success and competitiveness of a company as well as favorable development of shareholder value. Remuneration must be based on predetermined and measurable performance and result criteria.
According to the rationale in the recommendation, with regard to variable components, the period for which the fulfilment of the set performance and result criteria are evaluated (earning period) must be specified. In addition, the company may require that the remuneration for the earning period be disposable only after a certain predetermined period of time once the earning period (restriction period) has closed.
Proposed amendments to the Shareholders’ Rights Directive (2007/36)• European Commission made a proposal for amending the Shareholders’
Rights Directive on 9 April 2014. The legislative process thereafter has been quite slow, but based on the most recent information, it seems that there is a lot of optimism that most of the proposed amendments will be accepted by the Parliament quite soon.
• From remuneration point of view, the most interesting new articles will be 9a (Right to vote on the remuneration policy) and 9 b (Information to be provided in the remuneration report and right to vote on the remuneration report)
• ►It is possible that the new rules will be implemented by EU member states in 2018.

28 | Finnish Executive Remuneration Report | 2016
Remuneration reporting: companies cannot depart from the obligation to issue a remuneration statement• A company shall issue a remuneration statement, which is a consistent
description of the remuneration of the directors and executives containing the following information:
• Up-to-date description of the decision-making procedures concerning the remuneration of the directors, the managing director, and the other executives
• ►Up-to-date description of the most important principles regarding the remuneration of the directors, the managing director, and the other executives
• ►A remuneration report, providing information on the remuneration paid during the previous financial period
The company shall publish its remuneration statement (that can also be incorporated into the corporate governance statement) in the corporate governance / investors section of the company’s website. Links may be used to provide the statement, but any links must lead directly to the information concerned.
Remuneration committee (recommendation 17): The board of directors may establish a remuneration committee to prepare matters pertaining to the remuneration and appointment of the managing director and the other executives as well as the remuneration principles observed by the company. The majority of the members of the remuneration committee shall be independent of the company. The managing director or the other executives of the company shall not be appointed to the remuneration committee.
“Remuneration for board and committee work may be paid, either fully or in part, in the form of company shares.”

Finnish Executive Remuneration Report | 2016 | 29
More and more companies have realized that sustainability is critical factor for long-term success, and are consequently setting targets and measuring their performance in the area of sustainability. The higher the sustainability targets such as reducing greenhouse gas emissions or improving employee health and safety climb up on a strategic level, the more natural it will be to link them to executive compensation. Although such practices have been slower to gain momentum than sustainability reporting in general, the trend is clearly picking up speed.
A recent report by Corporate Knights ranking the Global 100 Most Sustainable Corporations in 2016 found that 87 percent of the Global 100 firms provided a monetary bonus to executives who achieved sustainability targets. This is a significant share, as another report by Glass Lewis from 2014 found that only 40 percent of global companies provided a link between executive compensation. This portion was even lower in 2010 at only 29 percent.
The sectors leading on this subject are typically heavy industries, such as energy and manufacturing, where sustainability issues such as climate change, water availability, pollution and safety have long been understood as having material impacts on company performance and are, in many cases, also regulated.
An often-cited forerunner is the American materials company Alcoa, where 20 percent of executive cash compensation is tied to CO2 emissions, safety improvements and creating a more diverse workforce. In Europe, a groundbreaker is the French manufacturer Schneider-Electric, where 12 percent of CEO Jean-Pascal Tricoire’s compensation package is based on a number of sustainability metrics, including one directly tied to how successful the company was in meeting its goal to reduce emissions from transportation1.
In the Nordics, a link to sustainability can be found in the remuneration policies of e.g. Norwegian energy company Statoil and the Danish pharmaceutical company Novo Nordisk. At Statoil, the CEO’s variable pay includes strategic objectives related to HSE and sustainability, and performance is assessed by the board2. At Novo Nordisk, as part of the long-term incentive program, a proportion of executive management compensation may, subject to the board’s assessment, be reduced in the event of lower-than-planned performance on significant research and development projects or key sustainability projects3.
The executive compensation vs. sustainability link is a great indicator of how seriously a company’s leadership prioritizes sustainability. The old mantra of “what gets measured, get managed” rings true in this case. At the end of the day, everyone is motivated by their paychecks, so when a company’s leadership is incentivized to focus on environmental and social performance, it sets a clear tone from the top for the entire organization. Sustainability targets can also be used in incentive programs for employees. Some companies have, for example, created bonus programs that are tied to competitions related to sustainability initiatives.
1 Source: Schneider-Electric 2014 annual report 2 Source: Statoil 2014 Statement on remuneration 3 Source: Novo Nordisk remuneration principles 2016
CHAPTER 8
Sustainability
“Remuneration for board and committee work may be paid, either fully or in part, in the form of company shares.”

30 | Finnish Executive Remuneration Report | 2016
However, challenges still remain related to using sustainability indicators as compensation criteria. The lack of standardized methodologies for measuring and comparing sustainability indicators presents a major issue. And, as opposed to financial performance, most companies do not subject sustainability information to a similarly strict assurance process so as to ensure its reliability. This can lead to unintended misstatements, or even deliberate manipulation of the information, as we have seen in recent cases including that of Volkswagen.
EY’s newest Global Fraud Survey on corporate misconduct revealed that 36 % of respondents, mainly CFOs and finance team members, appeared ready to justify unethical conduct when under financial pressure. This raises the concern that certain compensation arrangements could encourage such behavior. Therefore, when planning sustainability-related compensation schemes, it is important to ensure that the criteria used for performance evaluation is well-managed and monitored.
Did you know, that…
“36 % of CFOs and finance team members are ready to justify unethical conduct when under financial pressure.”

Finnish Executive Remuneration Report | 2016 | 31
CHAPTER 9
Taxation
Changes in Finnish tax and social security rules and practices
There have been no significant changes in the Finnish tax or social security legislation in the years of 2014–2016 as far as it pertains to executive remuneration. However, the Finnish tax and social security authorities have issued new guidance on the interpretation of rules allowing for long-term, equity-based incentives to be exempted from the different Finnish employee and employer social security contributions.
In this regard, the rule of thumb is that equity-based awards issued by listed companies may be exempt from such contributions if there is at least one year between the grant and vesting of the award. Specific rules have also been set regarding employee stock option plans and synthetic option plans as well as share plans for all employees, which may exempt such awards from social security contributions also in the case of non-listed companies.
The rules, as such, are identical for the various different contributions payable in Finland. However, some problems are caused by the fact that the rules are administered by several authorities, which also interpret some of the rules differently.
Finnish LTI plans are generally structured to take advantage of these rules on exemption from employee and employer social security contributions. Below, we introduce some of the main developments from this perspective that should be taken into account when designing or administering incentive plans for Finnish stakeholders.
• The Finnish pension insurance authorities have recently updated their position on whether sales restriction periods are taken into account in determining whether the requirement for the one year vesting period is met. They concluded that such periods are not taken into account, eliminating some structuring alternatives that have previously been approved by the said authorities.
• Also, the Finnish tax authorities have updated their guidance in this regard, with the main focus on whether the contributions payable to the tax authorities (employer’s social security contribution and employee’s health insurance contribution) are payable on any part of the award in cash.
• Compared to prior practice, the principal change is that the exemption may not apply if the cash component is paid in addition to the share award, whereas the exemption may apply to awards where the gross reward is determined in shares, and a part of this gross reward is then converted into cash to cover tax and other withholding obligations. This interpretation also differs from the interpretation of the pension and other social security authorities, which may lead to administrative difficulties e.g. in relation to the payroll treatment of the awards.
• One specific area where the Finnish social security exemption rules may be challenging to apply, are transactions where a company is acquired or merged, and existing awards are replaced with new ones. In such cases, it is generally appropriate to conduct a case-by-case analysis, even on the level of individual executives, on whether such transactions have tax and/or social security implications.

32 | Finnish Executive Remuneration Report | 2016
Furthermore, the guidance issued by the Finnish tax authorities amended the practice regarding the obligation to pay transfer tax (1.6 %) on options granted to employees on the basis of employee stock option plans. The authorities assumed a new position, stating that the granting of a stock option is a taxable transaction, but the tax is only payable at the time when the option is exercised. Administratively speaking, this is highly burdensome and the position has been challenged, but the requirement should currently be taken into account by all Finnish companies operating employee stock option plans.
Finally, it should be noted that recent case law and tax authority opinions have restricted the possibilities for incentivizing executives and other key employees tax efficiently by way of management holding companies or carried interest arrangements. On the other hand, a recent Supreme Administrative Court ruling has clarified the treatment of so-called “naked in, naked out” ownership structures, typically applied by professional services companies, where an employee may be entitled to purchase shares in the company for their net asset value, but is also required to sell them back for net asset value if the employment relationship ends. Based on the ruling, an employee is not considered to receive a benefit taxed as salary income in such situations. These rulings and opinions should be taken into account when considering incentive plans and facilitation of executives’ ownership or their participation in investment targets.
International aspects of taxation and social security treatment of executive remuneration
Tax benefitsIn Finland, there are only limited possibilities to obtain tax benefits in relation to executive remuneration, with the most important possibilities relating to the social security exemptions discussed above and collective pension insurance arrangements, which remain a tax efficient way to provide for the supplementary pension insurance coverage of executives.
However, in other countries there may exist tax benefits available both in relation to equity-based plans as well as pension arrangements that should be reviewed when planning and implementing such structures. For instance, France has recently amended the rules regarding qualified restricted shares / restricted share units (RSU) awards that allow for the gains from such plans to be taxed under the rules that apply to capital gains, rather than rules that apply to employment income. Typically, taking advantage of these types of rules has required meeting certain criteria, and often also implementing a country-specific sub-plan.
Base erosion and profit shifting (BEPS) initiativeThe BEPS initiative is an action plan developed by OECD to address issues around global tax rules and their application by multi-national companies. One of the several implications BEPS will have for executive remuneration is the alignment between rewarding and transfer pricing principles. In this respect, it is anticipated that tax authorities will, going forward, e.g. closely scrutinize targets established for executives of subsidiaries to confirm whether these targets are in line with the operating model and the risk profile of the subsidiary. For example, targets emphasizing local sales activities may bring into question an operating model in

Finnish Executive Remuneration Report | 2016 | 33
which the subsidiary is remunerated as a limited risk service provider. It is thus highly advisable to review all incentive plans to make sure that they are in line with the group’s operating model, and will not raise questions or concerns in case of a tax authority audit.
ComplianceWe at EY often note that when companies implement share plans for a global group of participants, associated compliance poses key issues. Compliance requirements typically include tax and social security compliance, but depending on the country in question, may also feature other registration or reporting obligations, currency controls, country-specific rules regarding executive remuneration or the publishing thereof, etc. It is expected that developments such as the BEPS initiative will further increase this reporting burden.
The US regulation on nonqualified deferred compensation plans, Section 409A of the Internal Revenue Code, has proved to be one important case of a tax-related compliance issue that is crucial to consider when implementing a plan involving foreign participants. Where deferred compensation (such as share awards) does not meet the requirements of Section 409A, the compensation is subject to certain additional taxes, including a 20 % additional income tax. Non-US equity incentive plans are typically problematic from a Section 409A perspective, have you not taken its requirements into account already when the terms of the plan have been drafted.
Altogether, the compliance requirements related to executive remuneration represent an area that all companies will need to consider at all stages of executive remuneration planning and administration − not only because the financial implications in terms of penalties etc. can be significant, but also because of the continuing public interest regarding executive remuneration. As remuneration already in itself comes under public debate and scrutiny increasingly frequently, companies typically wish to make sure that no additional issues are caused by non-compliance in the countries where activities are located.
“We at EY often note that when companies implement share plans for a global group of participants, associated compliance poses key issues.”

Mikko NikunenPartner, People Advisory Services +358 44 547 [email protected]
Hannu TyyskäSenior Manager, People Advisory Services+358 50 544 [email protected]
Tuomas AnttilaSenior Manager, People Advisory Services+358 40 867 1332 [email protected]
Sakari HelminenPartner, Law +358 40 5454 [email protected]
Jani AleniusSenior Manager, Climate Change & Sustainability Services +358 50 598 [email protected]
Tuula LempiäinenSenior Manager, Actuary, Assurance+358 50 381 [email protected]
Susanna BarstadConsultant, People Advisory Services+47 954 14 [email protected]
Our
team

Finnish Executive Remuneration Report | 2016 | 35

EY | Assurance | Tax | Transactions | Advisory
About EYEY is a global leader in assurance, tax, law, transaction and advisory services. The insights and quality services we deliver help build trust and confidence in the capital markets and in economies the world over. We develop outstanding leaders who team to deliver on our promises to all of our stakeholders. In so doing, we play a critical role in building a better working world for our people, for our clients and for our communities. For more information, please visit www.ey.com/fi. You can also follow us on Twitter at @EY_Suomi. EY refers to the global organization, and may refer to one or more, of the member firms of Ernst & Young Global Limited, each of which is a separate legal entity. Ernst & Young Global Limited, a UK company limited by guarantee, does not provide services to clients. For more information about our organization, please visit ey.com.
© 2016 Ernst & Young Oy.All Rights Reserved.
This report is based on data collected from public resources. EY takes no responsibility of the accuracy of the data.
All the information presented in this publication has been prepared forgeneral informational purposes only and is not intended to be relied upon asaccounting, tax, or other professional advice. Please refer to your advisors forspecific advice.
ey.com/fi
B16001fi