Executive Remuneration in the Netherlands 2016 - EY · PDF fileJan van Duren Executive...
40
Executive Remuneration in the Netherlands 2016 Empirical Data Analysis 2013 - 2015, governance, insights and vision
Transcript of Executive Remuneration in the Netherlands 2016 - EY · PDF fileJan van Duren Executive...
Executive Remuneration in the Netherlands 2016Empirical Data Analysis 2013 - 2015, governance, insights and vision

2 | Executive Remuneration in the Netherlands 2016
About this reportEY’s 2016 Executive Remuneration Report will provide you with insight on trends in executive remuneration levels and practices over the last 3 years. Furthermore, it contains interesting views and perspectives on sustainable remuneration and governance.
This report shows that in the Netherlands performance at the largest listed companies has improved over the last 3 years. At the same time there is still a lot of uncertainty on future performance. Globalization of nearly everything has created new opportunities for companies to grow and be profitable, but also means that potential threats to economic stability are more diverse than ever before. In the light of these developments, remuneration committees are continuously challenged to properly balance executive remuneration packages for sustainable growth.
The data and analyses contained in this report are based on information from the annual reports of 2013, 2014 and 2015 and other relevant public disclosures. A list of the companies included in the analysis as well as information on numbers of incumbents and companies per reported position are provided in Appendix 1. A glossary of terms is provided in Appendix 3.
Since the major changes in Dutch pension legislation have been implemented in 2015, we examined how Dutch listed companies dealt with this for their board members. Disclosure on this matter could have been more transparent, but the results of our analysis as shown in chapter 3.3 give a fair impression.
Last year we announced that we were planning an in depth analysis of the actual LTI pay out in 2015, related to the targets on the moment of grant. Unfortunately, it turned out that the disclosure on this topic is in most cases missing or not transparent. Not only for this, we agree with the major findings of the Dutch Monitoring Committee on corporate governance (published in 2015), stating that despite increased disclosure and transparency guidelines over the years, companies still fail to meet the aimed standards of insight in executive remuneration.
This year we devoted a special chapter in our report to sustainability. For this chapter we included, besides disclosed reports, information we gathered from literature and additional interviews.
This report is intended to provide insight in trends in executive remuneration levels and practices for the above noted companies. It is not intended to be used as a benchmarking tool. Tailored analysis of the data presented in this report is available by request.
EY is happy to share these results with clients, relations and others with interest in the Dutch world of executive remuneration. EY’s Executive Remuneration Team is available for further information.
Jan van DurenExecutive Director People Advisory Services
Executive Remuneration in the Netherlands 2016 | 3

4 | Executive Remuneration in the Netherlands 2016
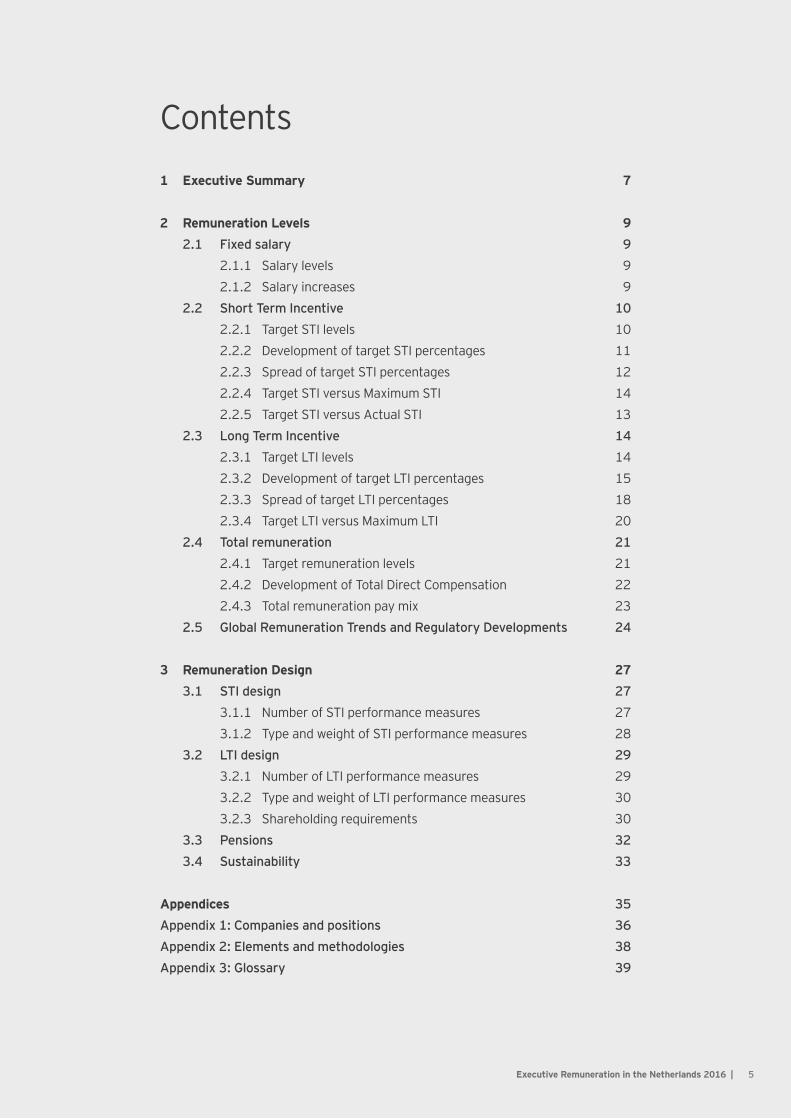
Contents1 Executive Summary 7
2 Remuneration Levels 9 2.1 Fixed salary 9 2.1.1 Salary levels 9 2.1.2 Salary increases 9 2.2 Short Term Incentive 10 2.2.1 Target STI levels 10 2.2.2 Development of target STI percentages 11 2.2.3 Spread of target STI percentages 12 2.2.4 Target STI versus Maximum STI 14 2.2.5 Target STI versus Actual STI 13 2.3 Long Term Incentive 14 2.3.1 Target LTI levels 14 2.3.2 Development of target LTI percentages 15 2.3.3 Spread of target LTI percentages 18 2.3.4 Target LTI versus Maximum LTI 20 2.4 Total remuneration 21 2.4.1 Target remuneration levels 21 2.4.2 Development of Total Direct Compensation 22 2.4.3 Total remuneration pay mix 23 2.5 Global Remuneration Trends and Regulatory Developments 24
3 Remuneration Design 27 3.1 STI design 27 3.1.1 Number of STI performance measures 27 3.1.2 Type and weight of STI performance measures 28 3.2 LTI design 29 3.2.1 Number of LTI performance measures 29 3.2.2 Type and weight of LTI performance measures 30 3.2.3 Shareholding requirements 30 3.3 Pensions 32 3.4 Sustainability 33
Appendices 35Appendix 1: Companies and positions 36Appendix 2: Elements and methodologies 38Appendix 3: Glossary 39
Executive Remuneration in the Netherlands 2016 | 5

6 | Executive Remuneration in the Netherlands 2016
Remuneration trends from 2013 to 2015
• Fixed salary levels increased by 4.7% in 2014 and 5.3% in 2015 on average, the median of the fixed salary levels increase is 1.8% in 2014 and 2.0% in 2015;
• Median and average target STI levels increased significantly for the CEO and CFO at AEX companies;
• The median ratio target to maximum STI remains at 1.5 for all positions in the three indices;
• Median and average target LTI levels increased for the CEO position at AEX companies and for all positions at AMX companies;
• The median ratio target to maximum LTI remains between 1.75 and 2.0 for all positions in the three indices;
• CEO total remuneration increased stronger than that of CFO’s and Other Board Members (OM), especially in the AEX, due to increasing variable pay opportunities, both in absolute and in relative terms;
• The number of companies which have a shareholding requirement in place increased significantly at AEX companies and AMX companies;
• Most companies offered a gross allowance to compensate for the 100K pension cap;
• On average sustainability still has relatively limited impact on total variable pay, however the number of companies reporting the use of sustainable remuneration increased from 10 in 2014 to 22 in 2015;
• Incomplete disclosure makes it impossible to report on facts and trends in actual LTI pay out.
1. Executive Summary
Average bonus pay-outs have increased to levels above target level at AEX and AMX companies, which indicates an improved (financial) company performance. However, a lot of CEO’s indicate that there is still a lot of uncertainty with regard to future performance. The increase in bonus pay-outs and total remuneration levels already fuels the debate on the CEO pay ratio, although Dutch listed companies are not reporting about this yet.
Executive Remuneration in the Netherlands 2016 | 7

8 | Executive Remuneration in the Netherlands 2016
2. Remuneration Levels
2.1 Fixed salary
In analysing fixed salary levels from 2013 to 2015, we have chosen to use all data points rather than focussing on a same sample. Therefore, the reported salary levels (see table below) include the effect of salary increases for existing executives, the effect of changing salary levels due to replacements and the effect of different salary levels due to replacement of a company in the index.
When a position is replaced, we see that the newly nominated executive does not always receive the same salary as the predecessor. Somewhat lower salaries, but also significantly higher salary levels apply to new executives. Since companies are replaced in the indices as compared to the previous year, we see that in some cases this has a significant impact on the median value.
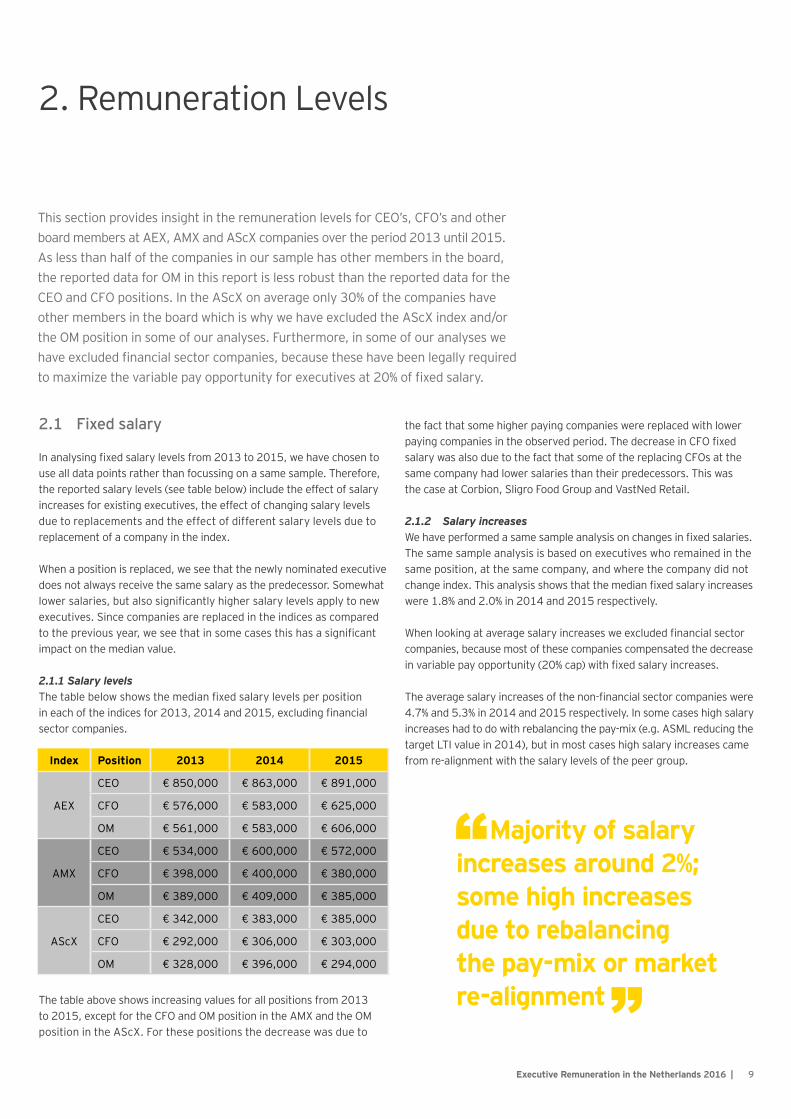
2.1.1 Salary levelsThe table below shows the median fixed salary levels per position in each of the indices for 2013, 2014 and 2015, excluding financial sector companies.
The table above shows increasing values for all positions from 2013 to 2015, except for the CFO and OM position in the AMX and the OM position in the AScX. For these positions the decrease was due to
the fact that some higher paying companies were replaced with lower paying companies in the observed period. The decrease in CFO fixed salary was also due to the fact that some of the replacing CFOs at the same company had lower salaries than their predecessors. This was the case at Corbion, Sligro Food Group and VastNed Retail.
2.1.2 Salary increasesWe have performed a same sample analysis on changes in fixed salaries. The same sample analysis is based on executives who remained in the same position, at the same company, and where the company did not change index. This analysis shows that the median fixed salary increases were 1.8% and 2.0% in 2014 and 2015 respectively.
When looking at average salary increases we excluded financial sector companies, because most of these companies compensated the decrease in variable pay opportunity (20% cap) with fixed salary increases.
The average salary increases of the non-financial sector companies were 4.7% and 5.3% in 2014 and 2015 respectively. In some cases high salary increases had to do with rebalancing the pay-mix (e.g. ASML reducing the target LTI value in 2014), but in most cases high salary increases came from re-alignment with the salary levels of the peer group.
This section provides insight in the remuneration levels for CEO’s, CFO’s and other board members at AEX, AMX and AScX companies over the period 2013 until 2015. As less than half of the companies in our sample has other members in the board, the reported data for OM in this report is less robust than the reported data for the CEO and CFO positions. In the AScX on average only 30% of the companies have other members in the board which is why we have excluded the AScX index and/or the OM position in some of our analyses. Furthermore, in some of our analyses we have excluded financial sector companies, because these have been legally required to maximize the variable pay opportunity for executives at 20% of fixed salary.
Index Position 2013 2014 2015
AEX
CEO € 850,000 € 863,000 € 891,000
CFO € 576,000 € 583,000 € 625,000
OM € 561,000 € 583,000 € 606,000
AMX
CEO € 534,000 € 600,000 € 572,000
CFO € 398,000 € 400,000 € 380,000
OM € 389,000 € 409,000 € 385,000
AScX
CEO € 342,000 € 383,000 € 385,000
CFO € 292,000 € 306,000 € 303,000
OM € 328,000 € 396,000 € 294,000
Executive Remuneration in the Netherlands 2016 | 9
Majority of salary increases around 2%; some high increases due to rebalancing the pay-mix or market re-alignment

2.2 Short Term Incentive
Short term incentive levels as reported in each year relate to performance over that one year period. In this section we focus on the target STI and we compare these to the maximum and the actual STI.
2.2.1 Target STI levelsThe table below shows the median target STI values per position in each of the indices for 2013, 2014 and 2015, excluding financial sector companies.
The table above shows that the median target STI values have increased significantly for the CEO and CFO in the AEX and the OM in the AScX from 2013 to 2015. For the other positions the median target STI value remained roughly at the same level.
Index Position 2013 2014 2015
AEX
CEO € 752,000 € 817,000 € 883,000
CFO € 400,000 € 458,000 € 492,000
OM € 371,000 € 396,000 € 398,000
AMX
CEO € 327,000 € 306,000 € 328,000
CFO € 227,000 € 224,000 € 225,000
OM € 219,000 € 217,000 € 246,000
AScX
CEO € 180,000 € 195,000 € 191,000
CFO € 114,000 € 140,000 € 133,000
OM € 136,000 € 198,000 € 198,000
| Executive Remuneration in the Netherlands 201610
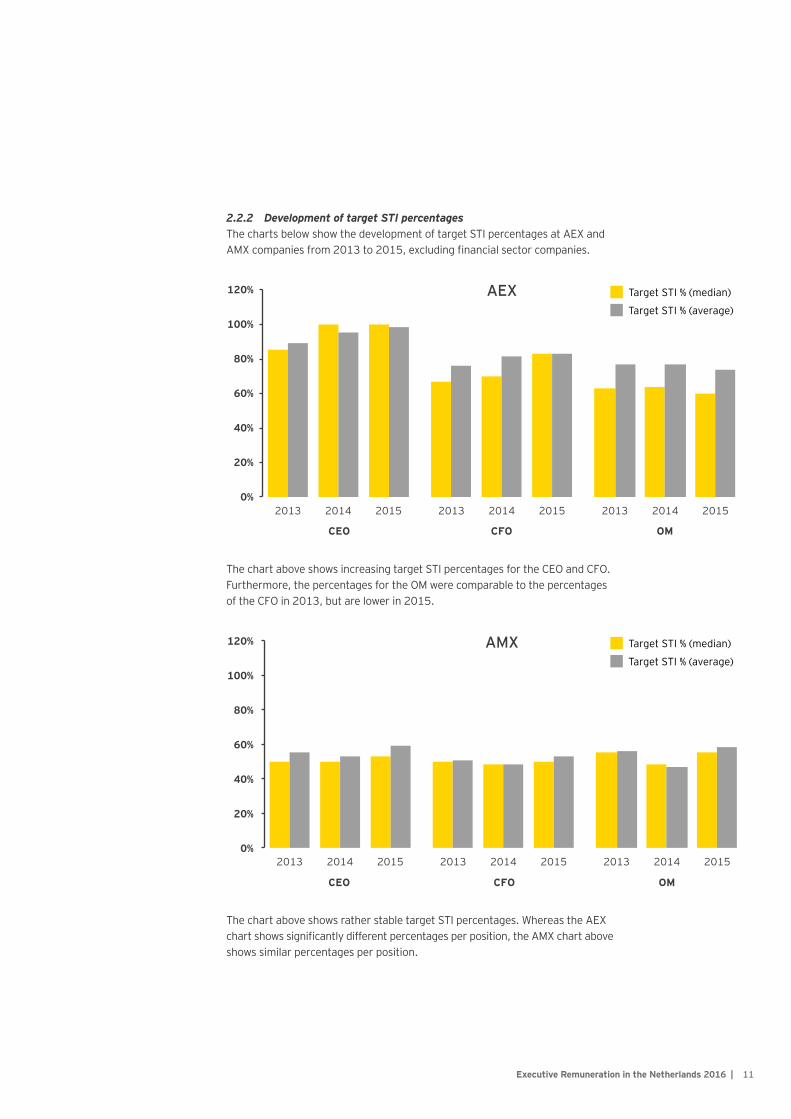
2.2.2 Development of target STI percentagesThe charts below show the development of target STI percentages at AEX and AMX companies from 2013 to 2015, excluding financial sector companies.
The chart above shows increasing target STI percentages for the CEO and CFO. Furthermore, the percentages for the OM were comparable to the percentages of the CFO in 2013, but are lower in 2015.
The chart above shows rather stable target STI percentages. Whereas the AEX chart shows significantly different percentages per position, the AMX chart above shows similar percentages per position.
AEX
AMX
Target STI % (median)
Target STI % (median)
Target STI % (average)
Target STI % (average)
Executive Remuneration in the Netherlands 2016 | 11
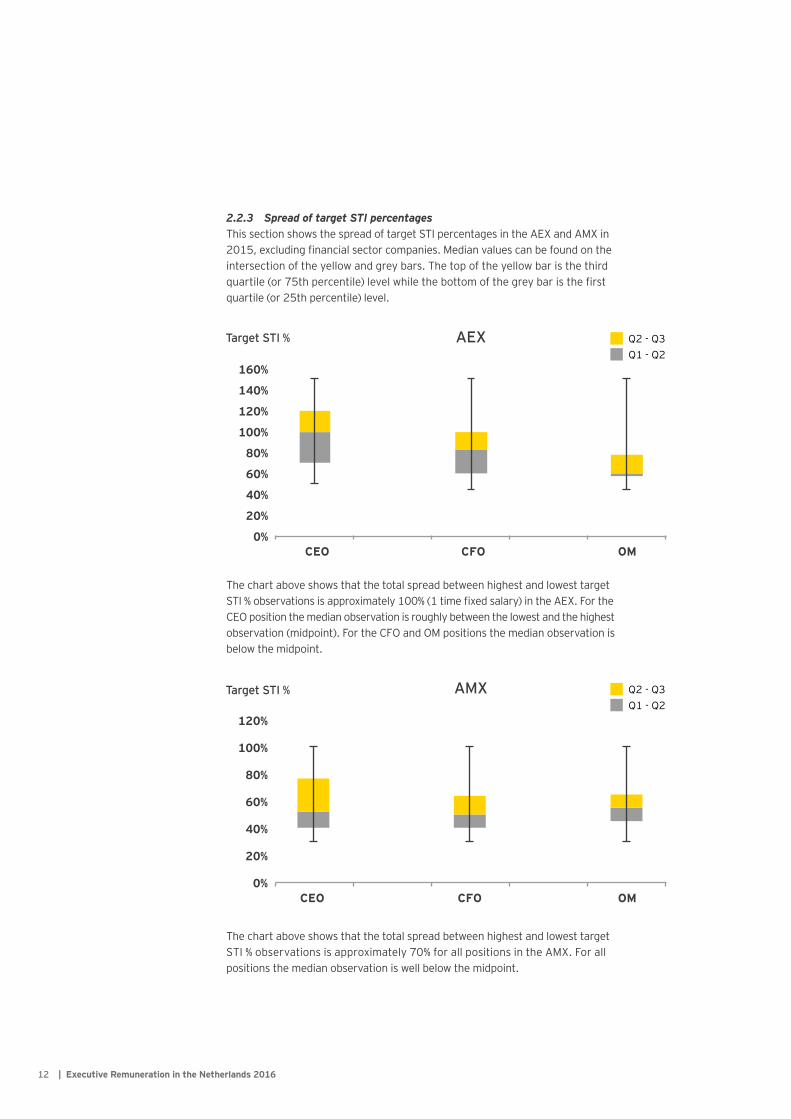
2.2.3 Spread of target STI percentagesThis section shows the spread of target STI percentages in the AEX and AMX in 2015, excluding financial sector companies. Median values can be found on the intersection of the yellow and grey bars. The top of the yellow bar is the third quartile (or 75th percentile) level while the bottom of the grey bar is the first quartile (or 25th percentile) level.
The chart above shows that the total spread between highest and lowest target STI % observations is approximately 100% (1 time fixed salary) in the AEX. For the CEO position the median observation is roughly between the lowest and the highest observation (midpoint). For the CFO and OM positions the median observation is below the midpoint.
The chart above shows that the total spread between highest and lowest target STI % observations is approximately 70% for all positions in the AMX. For all positions the median observation is well below the midpoint.
Q1 - Q2
Q1 - Q2
Q2 - Q3
Q2 - Q3
Target STI %
Target STI %
AEX
AMX
| Executive Remuneration in the Netherlands 201612
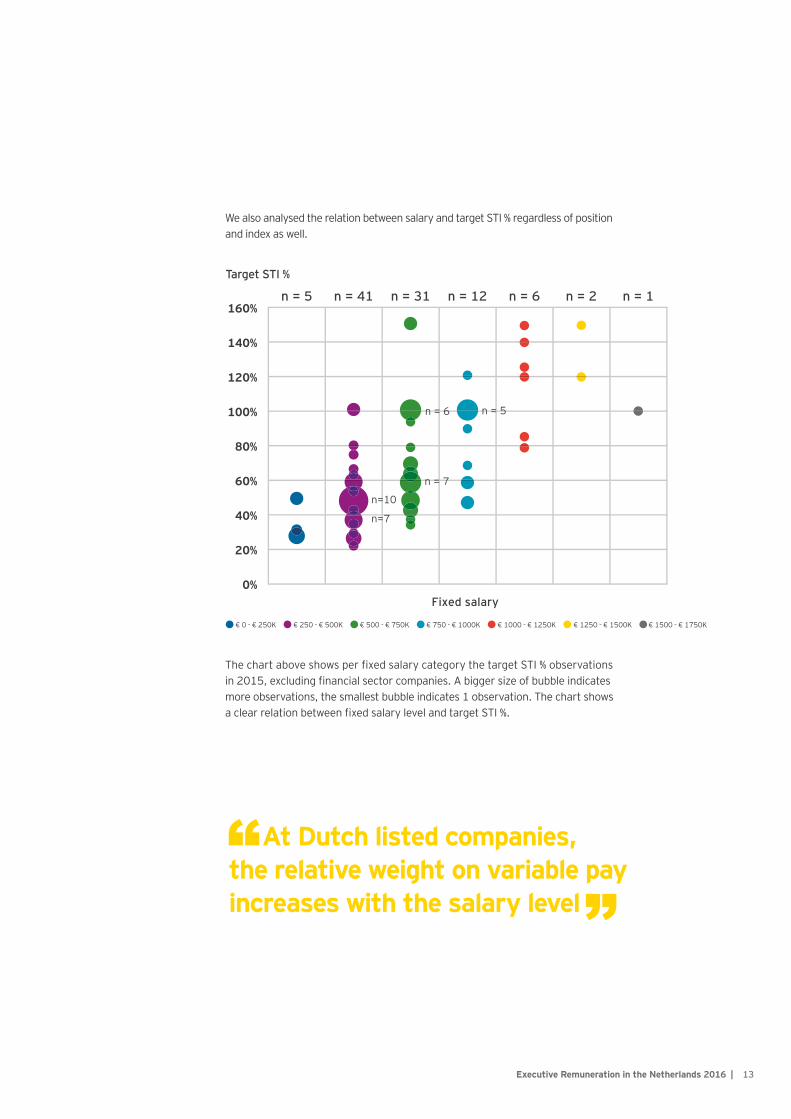
We also analysed the relation between salary and target STI % regardless of position and index as well.
The chart above shows per fixed salary category the target STI % observations in 2015, excluding financial sector companies. A bigger size of bubble indicates more observations, the smallest bubble indicates 1 observation. The chart shows a clear relation between fixed salary level and target STI %.
Target STI %
Executive Remuneration in the Netherlands 2016 | 13
At Dutch listed companies, the relative weight on variable pay increases with the salary level
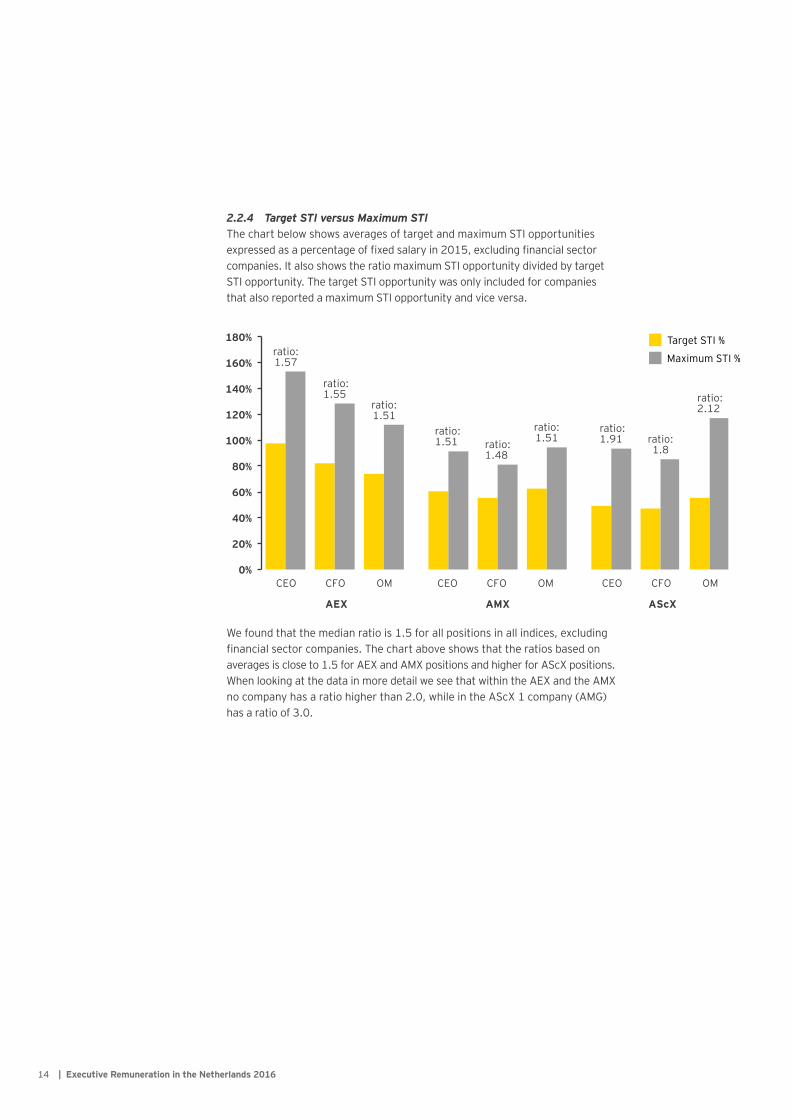
2.2.4 Target STI versus Maximum STIThe chart below shows averages of target and maximum STI opportunities expressed as a percentage of fixed salary in 2015, excluding financial sector companies. It also shows the ratio maximum STI opportunity divided by target STI opportunity. The target STI opportunity was only included for companies that also reported a maximum STI opportunity and vice versa.
We found that the median ratio is 1.5 for all positions in all indices, excluding financial sector companies. The chart above shows that the ratios based on averages is close to 1.5 for AEX and AMX positions and higher for AScX positions. When looking at the data in more detail we see that within the AEX and the AMX no company has a ratio higher than 2.0, while in the AScX 1 company (AMG) has a ratio of 3.0.
Target STI %
Maximum STI %
| Executive Remuneration in the Netherlands 201614
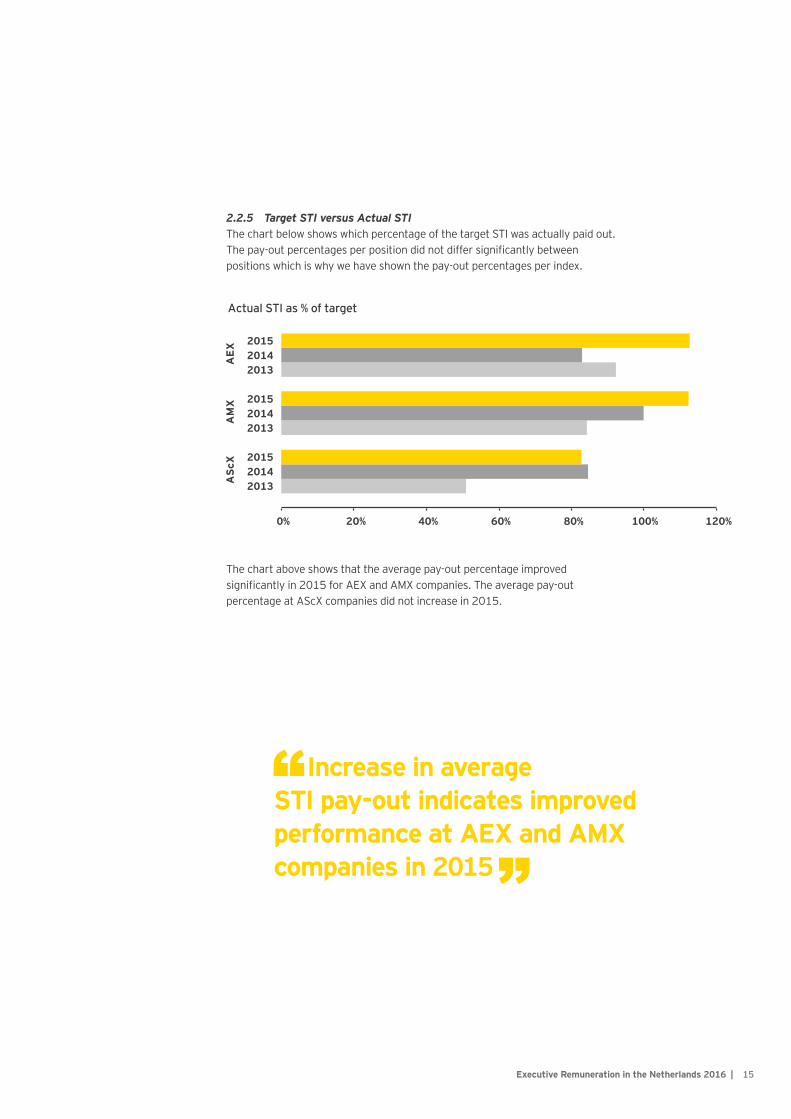
2.2.5 Target STI versus Actual STI The chart below shows which percentage of the target STI was actually paid out. The pay-out percentages per position did not differ significantly between positions which is why we have shown the pay-out percentages per index.
The chart above shows that the average pay-out percentage improved significantly in 2015 for AEX and AMX companies. The average pay-out percentage at AScX companies did not increase in 2015.
Target STI %
Maximum STI %
Actual STI as % of target
Executive Remuneration in the Netherlands 2016 | 15
Increase in average STI pay-out indicates improved performance at AEX and AMX companies in 2015
2.3 Long Term Incentive
Almost all long term incentives are granted conditionally at the beginning of a 3 year performance period. After this period a percentage of this conditional grant becomes unconditional (vests).
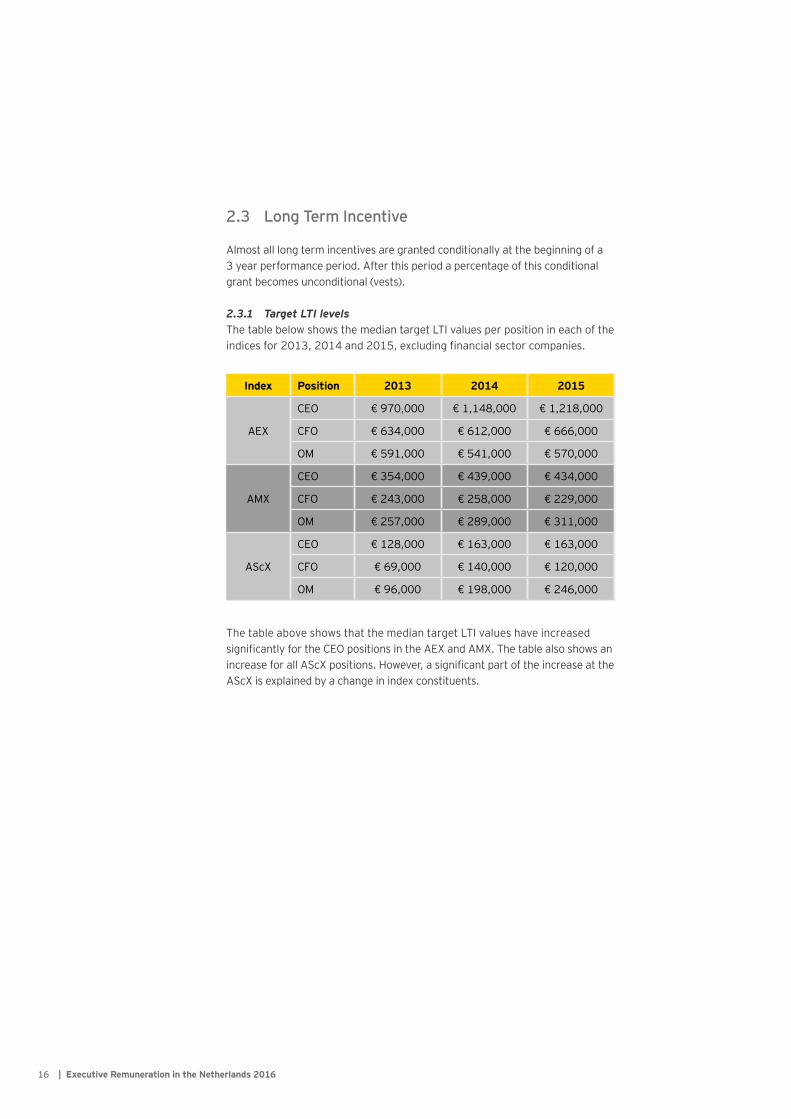
2.3.1 Target LTI levelsThe table below shows the median target LTI values per position in each of the indices for 2013, 2014 and 2015, excluding financial sector companies.
The table above shows that the median target LTI values have increased significantly for the CEO positions in the AEX and AMX. The table also shows an increase for all AScX positions. However, a significant part of the increase at the AScX is explained by a change in index constituents.
Index Position 2013 2014 2015
AEX
CEO € 970,000 € 1,148,000 € 1,218,000
CFO € 634,000 € 612,000 € 666,000
OM € 591,000 € 541,000 € 570,000
AMX
CEO € 354,000 € 439,000 € 434,000
CFO € 243,000 € 258,000 € 229,000
OM € 257,000 € 289,000 € 311,000
AScX
CEO € 128,000 € 163,000 € 163,000
CFO € 69,000 € 140,000 € 120,000
OM € 96,000 € 198,000 € 246,000
| Executive Remuneration in the Netherlands 201616
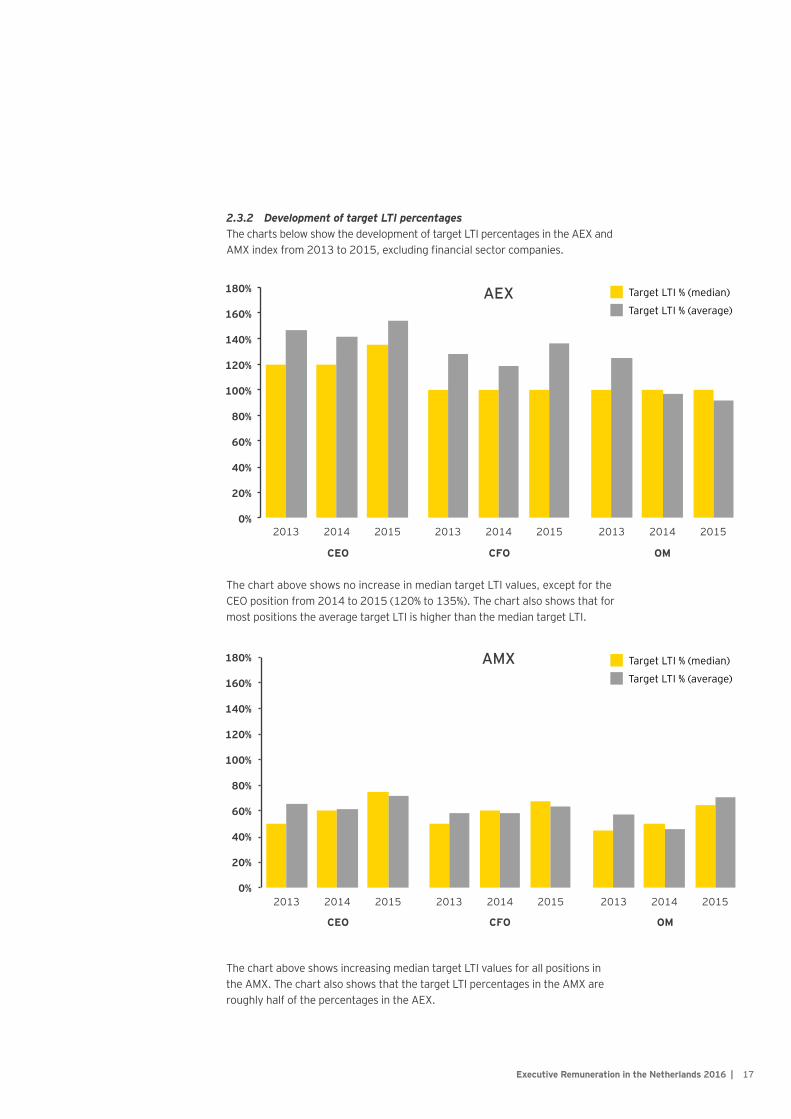
2.3.2 Development of target LTI percentagesThe charts below show the development of target LTI percentages in the AEX and AMX index from 2013 to 2015, excluding financial sector companies.
The chart above shows no increase in median target LTI values, except for the CEO position from 2014 to 2015 (120% to 135%). The chart also shows that for most positions the average target LTI is higher than the median target LTI.
The chart above shows increasing median target LTI values for all positions in the AMX. The chart also shows that the target LTI percentages in the AMX are roughly half of the percentages in the AEX.
Target LTI % (median)
Target LTI % (median)
Target LTI % (average)
Target LTI % (average)
AMX
AEX
Executive Remuneration in the Netherlands 2016 | 17
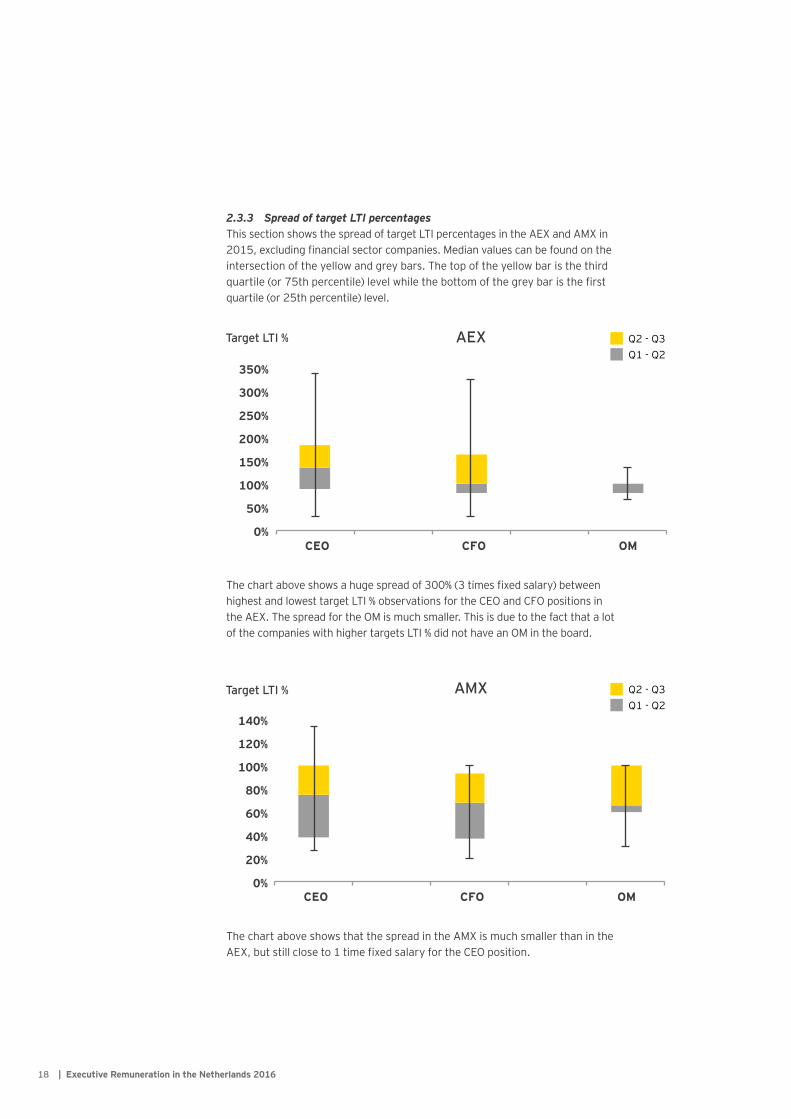
2.3.3 Spread of target LTI percentagesThis section shows the spread of target LTI percentages in the AEX and AMX in 2015, excluding financial sector companies. Median values can be found on the intersection of the yellow and grey bars. The top of the yellow bar is the third quartile (or 75th percentile) level while the bottom of the grey bar is the first quartile (or 25th percentile) level.
The chart above shows a huge spread of 300% (3 times fixed salary) between highest and lowest target LTI % observations for the CEO and CFO positions in the AEX. The spread for the OM is much smaller. This is due to the fact that a lot of the companies with higher targets LTI % did not have an OM in the board.
The chart above shows that the spread in the AMX is much smaller than in the AEX, but still close to 1 time fixed salary for the CEO position.
Q1 - Q2
Q1 - Q2
Q2 - Q3
Q2 - Q3
Target LTI %
Target LTI % AMX
AEX
| Executive Remuneration in the Netherlands 201618
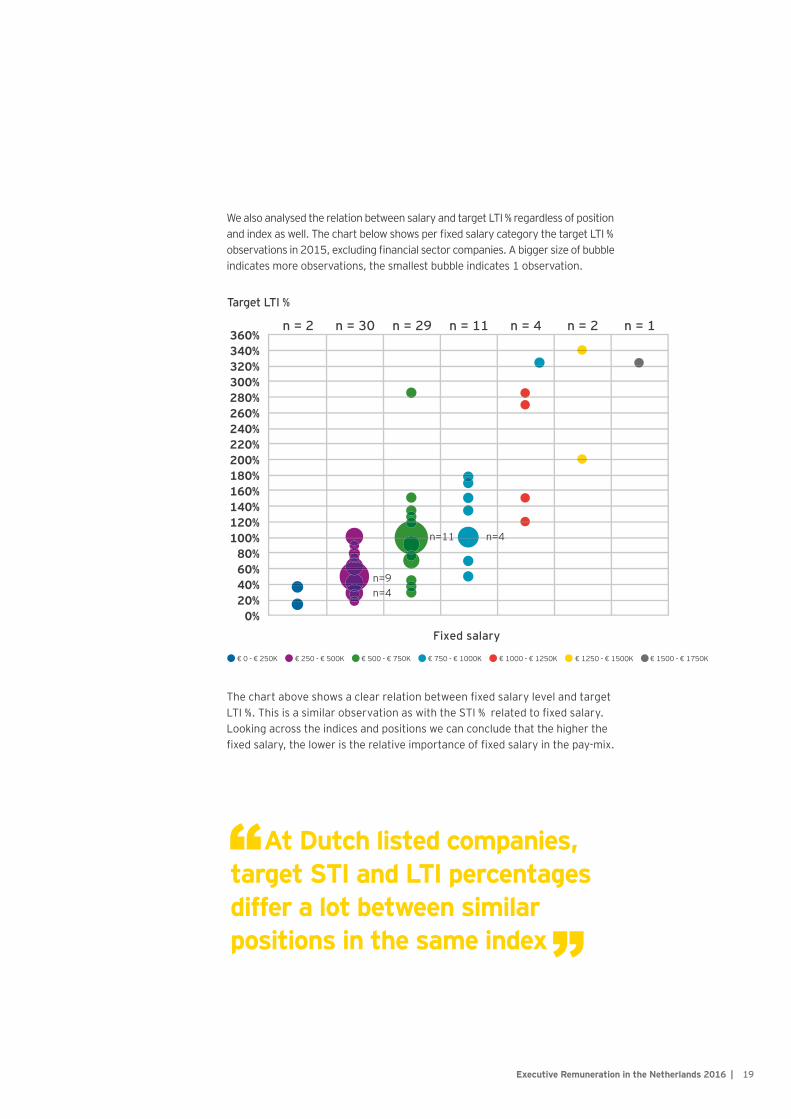
We also analysed the relation between salary and target LTI % regardless of position and index as well. The chart below shows per fixed salary category the target LTI % observations in 2015, excluding financial sector companies. A bigger size of bubble indicates more observations, the smallest bubble indicates 1 observation.
The chart above shows a clear relation between fixed salary level and target LTI %. This is a similar observation as with the STI % related to fixed salary. Looking across the indices and positions we can conclude that the higher the fixed salary, the lower is the relative importance of fixed salary in the pay-mix.
Target LTI %
Executive Remuneration in the Netherlands 2016 | 19
At Dutch listed companies, target STI and LTI percentages differ a lot between similar positions in the same index
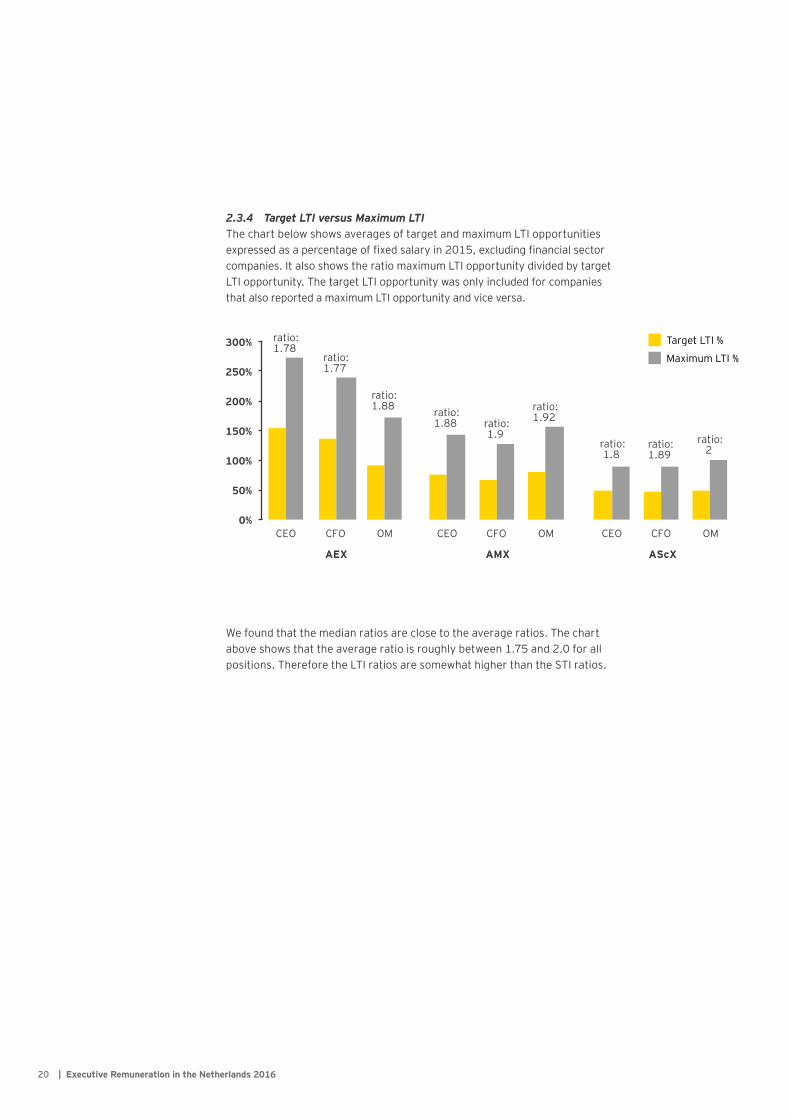
2.3.4 Target LTI versus Maximum LTIThe chart below shows averages of target and maximum LTI opportunities expressed as a percentage of fixed salary in 2015, excluding financial sector companies. It also shows the ratio maximum LTI opportunity divided by target LTI opportunity. The target LTI opportunity was only included for companies that also reported a maximum LTI opportunity and vice versa.
We found that the median ratios are close to the average ratios. The chart above shows that the average ratio is roughly between 1.75 and 2.0 for all positions. Therefore the LTI ratios are somewhat higher than the STI ratios.
Target LTI %
Maximum LTI %
| Executive Remuneration in the Netherlands 201620
2.4 Total remuneration
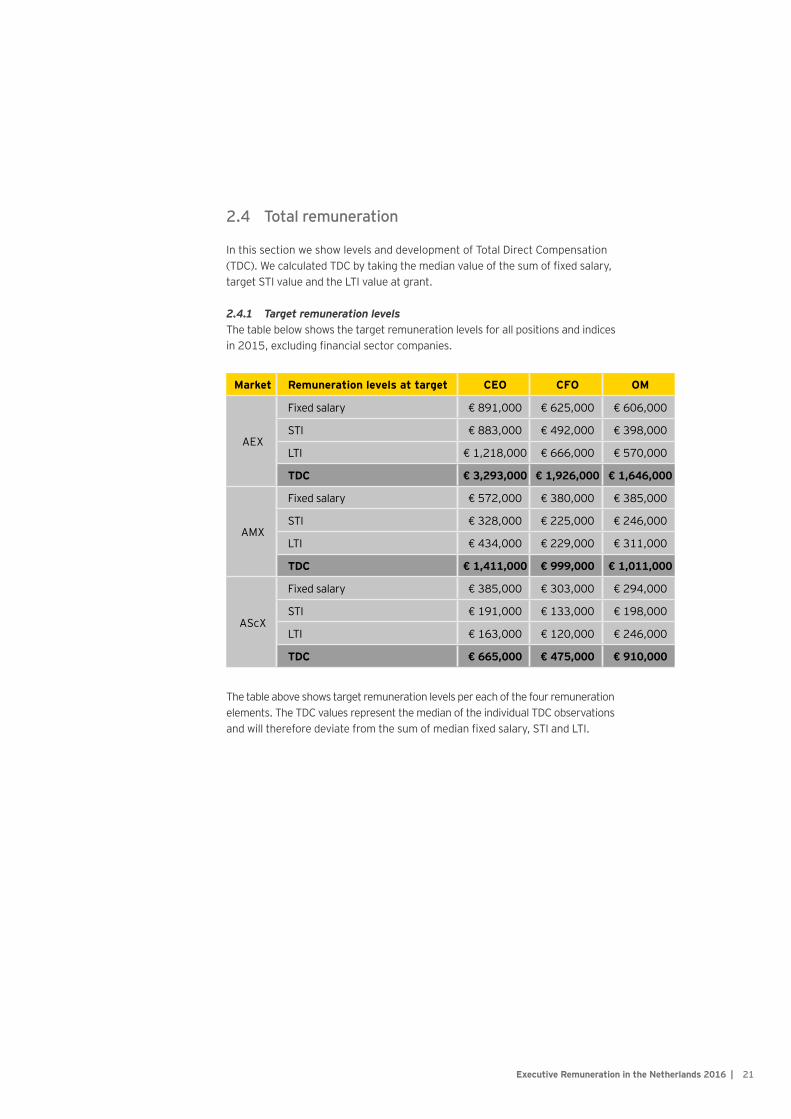
In this section we show levels and development of Total Direct Compensation (TDC). We calculated TDC by taking the median value of the sum of fixed salary, target STI value and the LTI value at grant.
2.4.1 Target remuneration levelsThe table below shows the target remuneration levels for all positions and indices in 2015, excluding financial sector companies.
The table above shows target remuneration levels per each of the four remuneration elements. The TDC values represent the median of the individual TDC observations and will therefore deviate from the sum of median fixed salary, STI and LTI.
Market Remuneration levels at target CEO CFO OM
AEX
Fixed salary € 891,000 € 625,000 € 606,000
STI € 883,000 € 492,000 € 398,000
LTI € 1,218,000 € 666,000 € 570,000
TDC € 3,293,000 € 1,926,000 € 1,646,000
AMX
Fixed salary € 572,000 € 380,000 € 385,000
STI € 328,000 € 225,000 € 246,000
LTI € 434,000 € 229,000 € 311,000
TDC € 1,411,000 € 999,000 € 1,011,000
AScX
Fixed salary € 385,000 € 303,000 € 294,000
STI € 191,000 € 133,000 € 198,000
LTI € 163,000 € 120,000 € 246,000
TDC € 665,000 € 475,000 € 910,000
Target LTI %
Maximum LTI %
Executive Remuneration in the Netherlands 2016 | 21
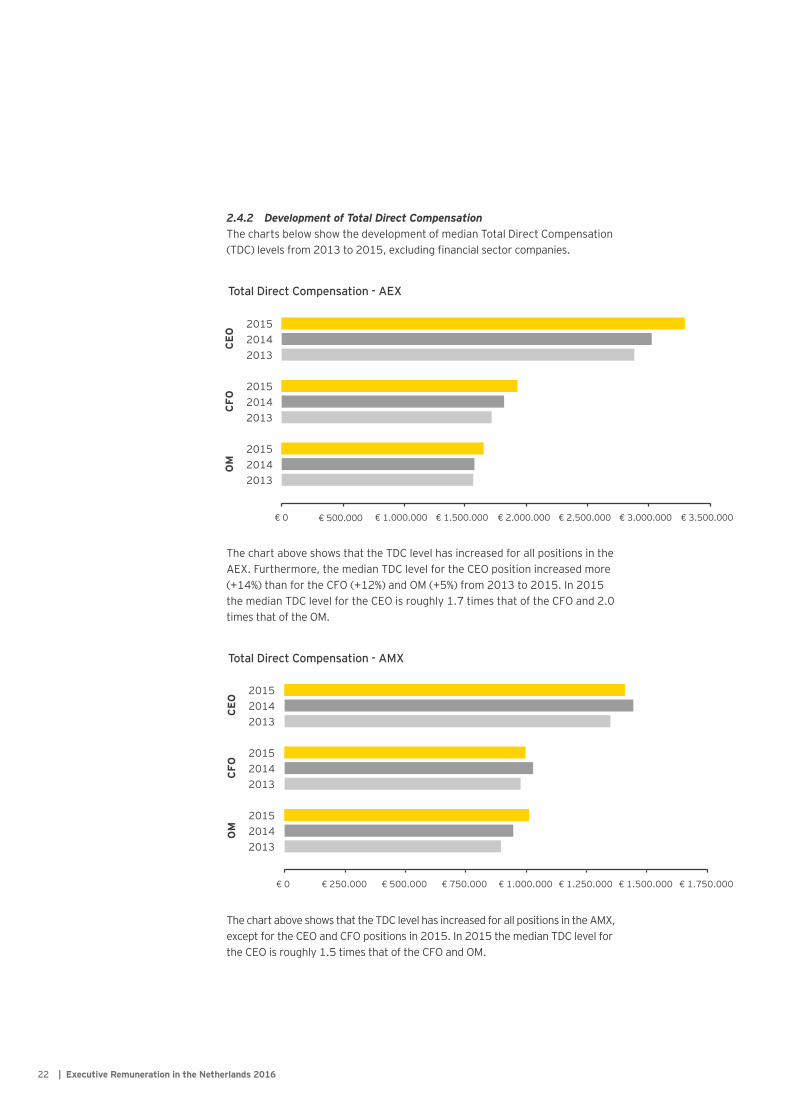
2.4.2 Development of Total Direct Compensation The charts below show the development of median Total Direct Compensation (TDC) levels from 2013 to 2015, excluding financial sector companies.
The chart above shows that the TDC level has increased for all positions in the AEX. Furthermore, the median TDC level for the CEO position increased more (+14%) than for the CFO (+12%) and OM (+5%) from 2013 to 2015. In 2015 the median TDC level for the CEO is roughly 1.7 times that of the CFO and 2.0 times that of the OM.
The chart above shows that the TDC level has increased for all positions in the AMX, except for the CEO and CFO positions in 2015. In 2015 the median TDC level for the CEO is roughly 1.5 times that of the CFO and OM.
Total Direct Compensation - AEX
Total Direct Compensation - AMX
| Executive Remuneration in the Netherlands 201622
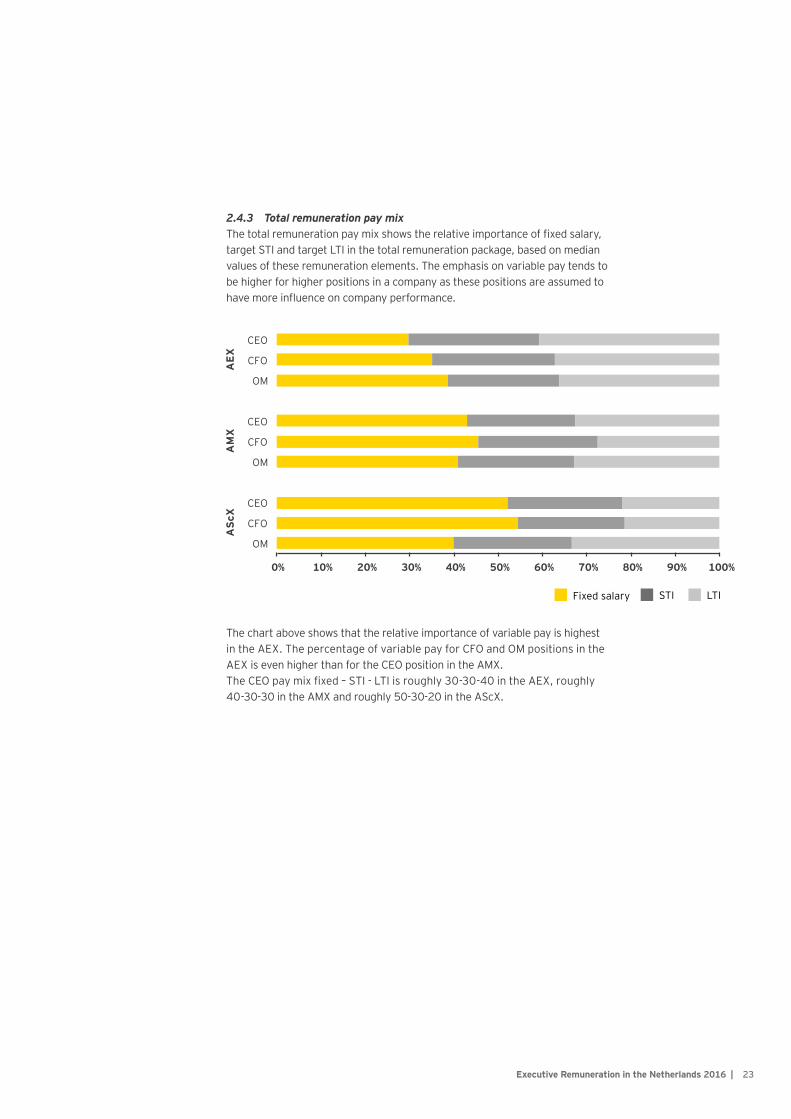
2.4.3 Total remuneration pay mixThe total remuneration pay mix shows the relative importance of fixed salary, target STI and target LTI in the total remuneration package, based on median values of these remuneration elements. The emphasis on variable pay tends to be higher for higher positions in a company as these positions are assumed to have more influence on company performance.
The chart above shows that the relative importance of variable pay is highest in the AEX. The percentage of variable pay for CFO and OM positions in the AEX is even higher than for the CEO position in the AMX.The CEO pay mix fixed – STI - LTI is roughly 30-30-40 in the AEX, roughly 40-30-30 in the AMX and roughly 50-30-20 in the AScX.
Fixed salary STI LTI
Executive Remuneration in the Netherlands 2016 | 23
Globally, EY has identified the following key trends in the current executive remuneration environment.
Transparency and say on payBoth in Europe and globally, an increased emphasis is seen on transparency and disclosure of executive remuneration policy and practice. In July 2015, the European Parliament voted to adopt several amendments to the Shareholders’ Rights Directive (SRD), including new reporting requirements that aim for higher degrees of transparency, and requirements aimed at strengthening stakeholders’ say on directors’ pay. An increased degree of say on pay has also led to a shift in executive compensation structure in the United States, whereby compensation packages are based on an increasing portion of long-term incentives. In Asia, many countries are focusing on disclosure of either remuneration principles and/or actual remuneration levels.
Increased scrutiny of performance metric selectionAs a growing awareness is seen globally about the alignment of pay and performance, so is an awareness of the importance of appropriate performance criteria. Several companies are adopting non-financial performance metrics into their incentive schemes, in addition to more traditional financial metrics. Among financial performance metrics,
surveys from Europe and the US suggest that the popularity of relative Total Shareholder Return (TSR) has increased considerably over the past few years and that it is now the most widely used financial performance metric among listed companies. However, critics argue that the link between executive performance and TSR is generally low, and that its relevance in executive incentive plans is therefore questionable. Moreover, among the previously mentioned amendments to the SRD are also new requirements for share-based executive pay. The purpose of these amendments is to ensure that share-based remuneration does not represent the most significant part of directors’ variable remuneration. These amendments may potentially introduce a ceiling for pay-outs from schemes that use TSR.
Tailored and data driven compensation programs designA shift is seen away from the “one size fits all” compensation paradigm to a more tailored and analytical approach to executive remuneration. By designing and implementing a compensation program that truly reflects company goals, values and business strategy, companies may expect to experience a better alignment of executive and shareholder interests as well as a wider range of desirable leadership behaviours from executives. Moreover, an increased awareness is seen about the importance of identifying appropriate peer groups when benchmarking executive
2.5 Global Remuneration Trends and Regulatory Developments
| Executive Remuneration in the Netherlands 201624

remuneration levels. The assessment and design of compensation elements are thus more data driven than previously, with an increased focus on obtaining and comparing data on relevant parameters from market practice. Besides this international trend, there is in the Netherlands and some other countries also an appeal on increasing discretionary responsibility for Remuneration Committees in their judgment of the performance of executives.
Increased need for complianceThere is globally a growing concern around compliance. Compliance requirements typically include tax and social security compliance, but depending on the country in question, may also feature other registration or reporting obligations, currency controls, country-specific rules regarding executive remuneration or the publishing thereof, etc. It is expected that developments such as the OECD’s Base Erosion and Profit Shifting (BEPS) initiative will further increase this burden. The BEPS initiative is an action plan, developed by OECD, aimed at addressing issues around global tax rules and their application by multi-national companies. Among the several implications BEPS will have for executive remuneration, rewarding and transfer pricing principles will be more aligned. In this regard, it is anticipated that tax authorities will, going forward, e.g. closely scrutinize the targets established for executives of
subsidiaries to confirm whether the targets are in line with the operating model and the risk profile of the subsidiary.
CEO pay ratioA topic that no company in the Netherlands has reported on yet is the CEO pay ratio. We expect that more and more companies will start to analyse and report on the CEO pay ratio since disclosure regulation is starting to evolve. As of 2017 US listed companies need to disclose the ratio between CEO total compensation versus median total compensation of employees. It will be interesting to see how regulation evolves in Europe, especially with regard to how the pay ratio should be calculated and what choices companies have in this respect. We believe that one ratio for every company would not be meaningful since companies can be very different in terms of geographical spread and type of business. It is more relevant to see how the pay ratio of a company develops over time. Therefore, we believe that companies could benefit from obtaining insight in the current pay ratio and understanding how this fits their overall remuneration philosophy and structures in order to determine whether change is necessary.
Executive Remuneration in the Netherlands 2016 | 25

26 | Executive Remuneration in the Netherlands 2016
3. Remuneration Design
This section provides insight in the practices and developments with regard to the design of variable pay plans. The most relevant disclosed design features of variable pay plans are the type, number and weight of the performance measures. In this chapter we also discuss how companies dealt with the pension cap for salaries above €100,000 and present a section about sustainability.
3.1 STI design
Short term performance is typically measured by the level of profit a company generates in a year. However, focusing on maximizing annual profit can be very harmful for sustainable profitability. For instance, executives who are solely incentivized to maximize the annual profit might reject sound investments or cut R&D costs to increase the bottom line and thereby potentially harming long run business performance.
Most companies have tried to mitigate this risk by providing executives with long term incentives as well. In addition, in the absence of one perfect short term performance measure, companies have chosen to combine different short term performance measures to mitigate this risk. Finally, a trend that can be observed over a longer period is that companies have been placing more emphasis on non-financial measures as well.
3.1.1 Number of STI performance measuresThe table below shows the average number of performance measures used in STI plans and the average percentage of STI pay out which depends on financial measures.
The table above shows that larger companies use more STI performance measures than smaller companies. It also shows that the number of performance measures is (still) increasing in AMX companies. The weighted average of the STI pay out which is based on financial measures is approximately 61% for all indices.
Year AEX AMX AScX
Measures % financial Measures % financial Measures % financial
2013 4.0 66% 2.6 61% 2.3 68%
2014 3.7 68% 2.7 65% 2.5 62%
2015 3.7 59% 3.0 63% 2.5 59%
Executive Remuneration in the Netherlands 2016 | 27
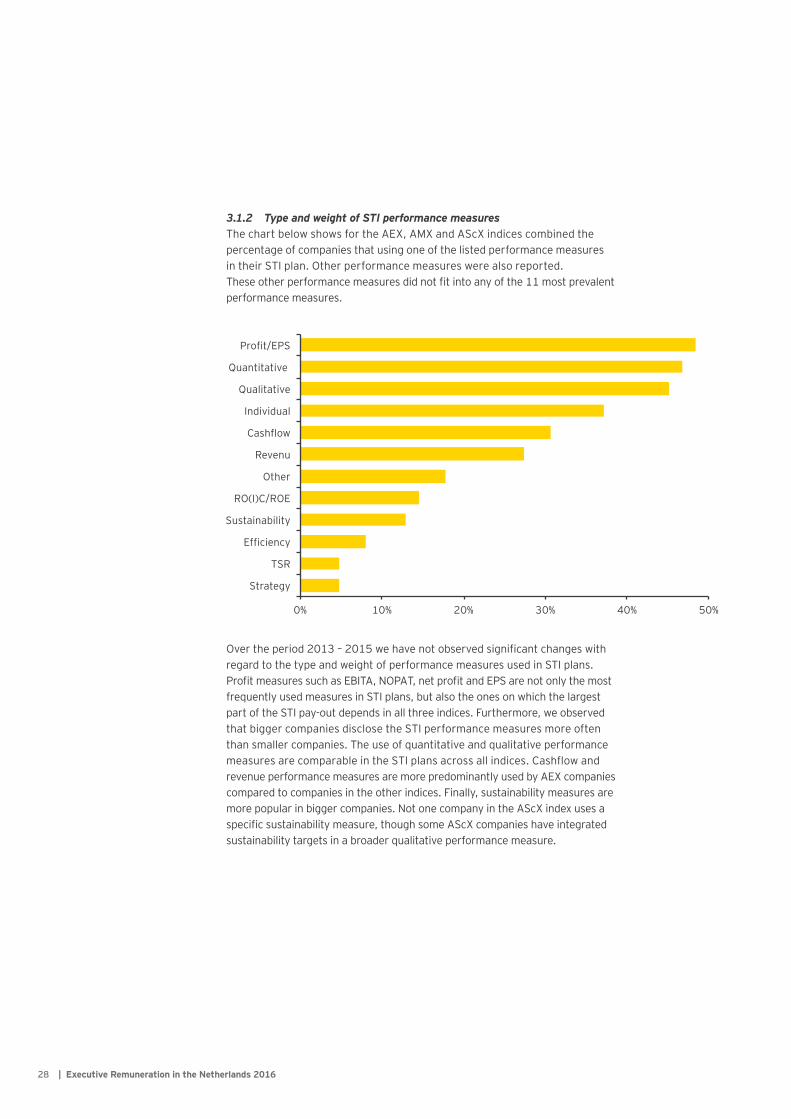
3.1.2 Type and weight of STI performance measuresThe chart below shows for the AEX, AMX and AScX indices combined the percentage of companies that using one of the listed performance measures in their STI plan. Other performance measures were also reported. These other performance measures did not fit into any of the 11 most prevalent performance measures.
Over the period 2013 – 2015 we have not observed significant changes with regard to the type and weight of performance measures used in STI plans. Profit measures such as EBITA, NOPAT, net profit and EPS are not only the most frequently used measures in STI plans, but also the ones on which the largest part of the STI pay-out depends in all three indices. Furthermore, we observed that bigger companies disclose the STI performance measures more often than smaller companies. The use of quantitative and qualitative performance measures are comparable in the STI plans across all indices. Cashflow and revenue performance measures are more predominantly used by AEX companies compared to companies in the other indices. Finally, sustainability measures are more popular in bigger companies. Not one company in the AScX index uses a specific sustainability measure, though some AScX companies have integrated sustainability targets in a broader qualitative performance measure.
| Executive Remuneration in the Netherlands 201628
3.2 LTI design
Long term incentives are offered to executives to increase focus on the longer term and thereby align the interest of executives with those of the companies’ (long term) shareholders. It is common practice that long term incentives are granted conditionally and become unconditional after 3 years based on the performance over these 3 years. In most cases an additional lock-up or holding period of 2 year applies before executives can actually sell or cash their LTI rights. This means that the most common cycle for LTI plans from grant to cash is 5 years. This is in accordance with the Dutch Corporate Governance Code.
Across the 3 indices, roughly 80% of LTI plans are share plans, 15% are options plans and 5% are cash-based plans, including phantom share plans and Stock Appreciation Rights.
3.2.1 Number of LTI performance measuresAn important difference between LTI plans and STI plans is the use of relative performance measures. In STI plans financial performance is in general measured in absolute terms, while in LTI plans performance is often measured relative to other companies. The table below shows the average number of performance measures used in LTI plans and the average percentage of the LTI pay out which depends on relative performance measures.
The table above shows that – in line with STI plan findings - larger companies use more performance measures than smaller companies. In addition, the average number of LTI performance measures has increased all three indices from 2013 to 2015. The table also shows that the weighted average percentage of LTI pay out which depends on relative performance measures has decreased at AEX companies from 2013 to 2015. The weight of relative performance measures is higher at AScX companies because relative TSR is frequently used, but less often combined with other performance measures compared to larger companies. Besides relative TSR examples of other relative LTI performance measures used are relative Return on Average Invested Capital and relative sales growth.
Year AEX AMX AScX
Measures % relative Measures % relative Measures % relative
2013 2.5 53% 1.8 49% 1.4 76%
2014 2.6 48% 1.7 49% 1.6 76%
2015 2.7 46% 2.1 49% 1.8 76%
Executive Remuneration in the Netherlands 2016 | 29
3.2.3 Shareholding requirementsMost companies offer LTI grants every year in order to continuously provide long term incentives. This prevents that focus on the longer term is reduced if performance targets of previous grants might have become or might seem unattainable. An alternative to strengthen the executives’ focus on the longer term is the use of shareholding requirements. Executives are then required to hold at least a certain amount of shares, often expressed as a percentage of fixed salary, in the company. The chart and table below show the levels of shareholding requirements in 2015 and the development from 2013 to 2015.
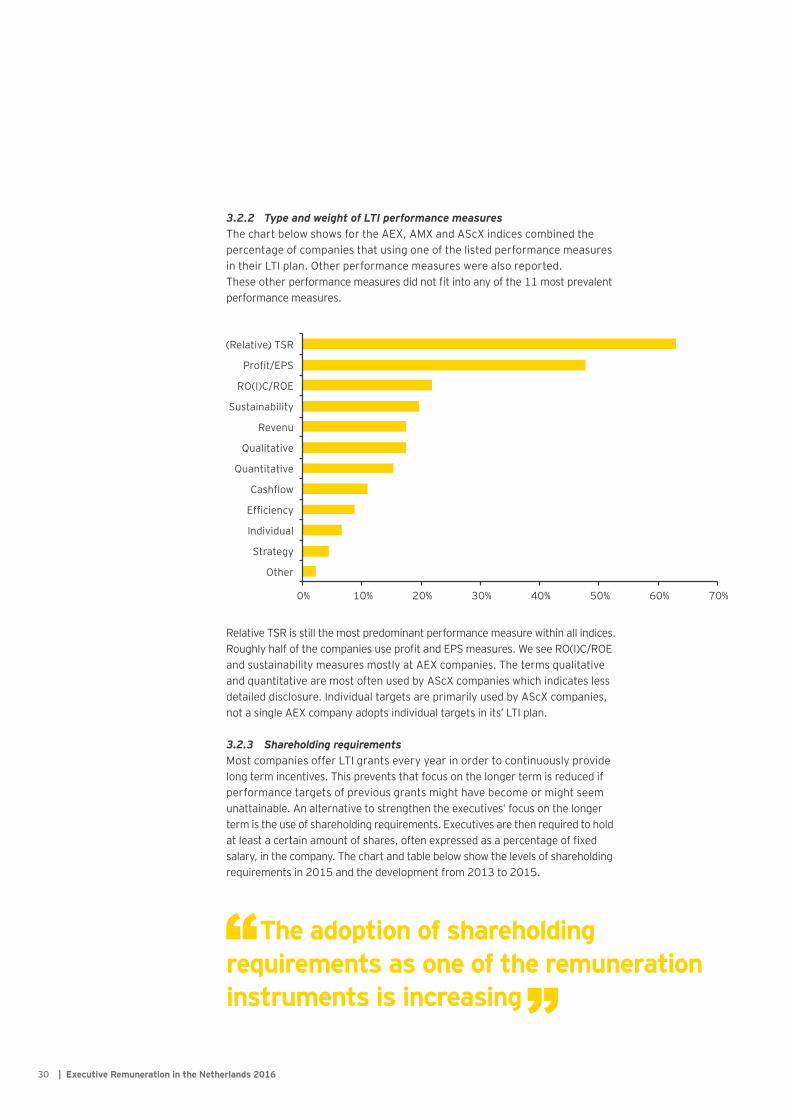
3.2.2 Type and weight of LTI performance measuresThe chart below shows for the AEX, AMX and AScX indices combined the percentage of companies that using one of the listed performance measures in their LTI plan. Other performance measures were also reported. These other performance measures did not fit into any of the 11 most prevalent performance measures.
Relative TSR is still the most predominant performance measure within all indices. Roughly half of the companies use profit and EPS measures. We see RO(I)C/ROE and sustainability measures mostly at AEX companies. The terms qualitative and quantitative are most often used by AScX companies which indicates less detailed disclosure. Individual targets are primarily used by AScX companies, not a single AEX company adopts individual targets in its’ LTI plan.
| Executive Remuneration in the Netherlands 201630
The adoption of shareholding requirements as one of the remuneration instruments is increasing
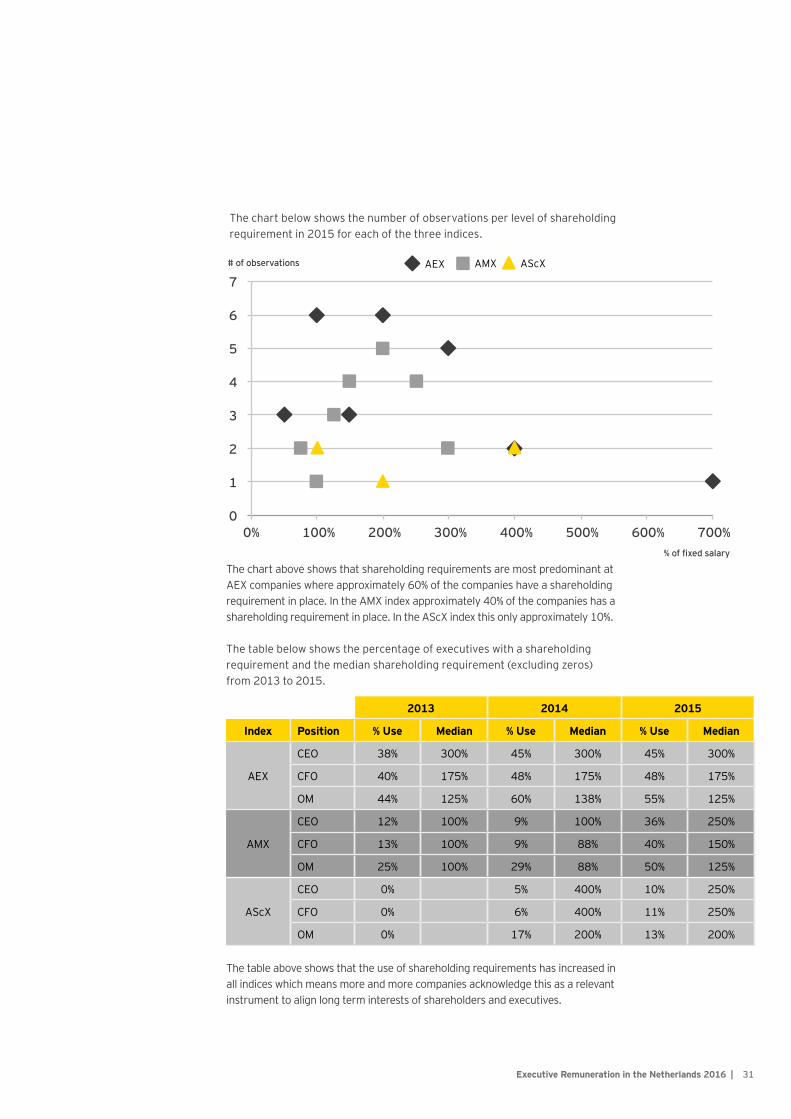
The chart above shows that shareholding requirements are most predominant at AEX companies where approximately 60% of the companies have a shareholding requirement in place. In the AMX index approximately 40% of the companies has a shareholding requirement in place. In the AScX index this only approximately 10%.
The chart below shows the number of observations per level of shareholding requirement in 2015 for each of the three indices.
AMXAEX AScX
The table below shows the percentage of executives with a shareholding requirement and the median shareholding requirement (excluding zeros) from 2013 to 2015.
The table above shows that the use of shareholding requirements has increased in all indices which means more and more companies acknowledge this as a relevant instrument to align long term interests of shareholders and executives.
2013 2014 2015
Index Position % Use Median % Use Median % Use Median
AEX
CEO 38% 300% 45% 300% 45% 300%
CFO 40% 175% 48% 175% 48% 175%
OM 44% 125% 60% 138% 55% 125%
AMX
CEO 12% 100% 9% 100% 36% 250%
CFO 13% 100% 9% 88% 40% 150%
OM 25% 100% 29% 88% 50% 125%
AScX
CEO 0% 5% 400% 10% 250%
CFO 0% 6% 400% 11% 250%
OM 0% 17% 200% 13% 200%
# of observations
% of fixed salary
Executive Remuneration in the Netherlands 2016 | 31
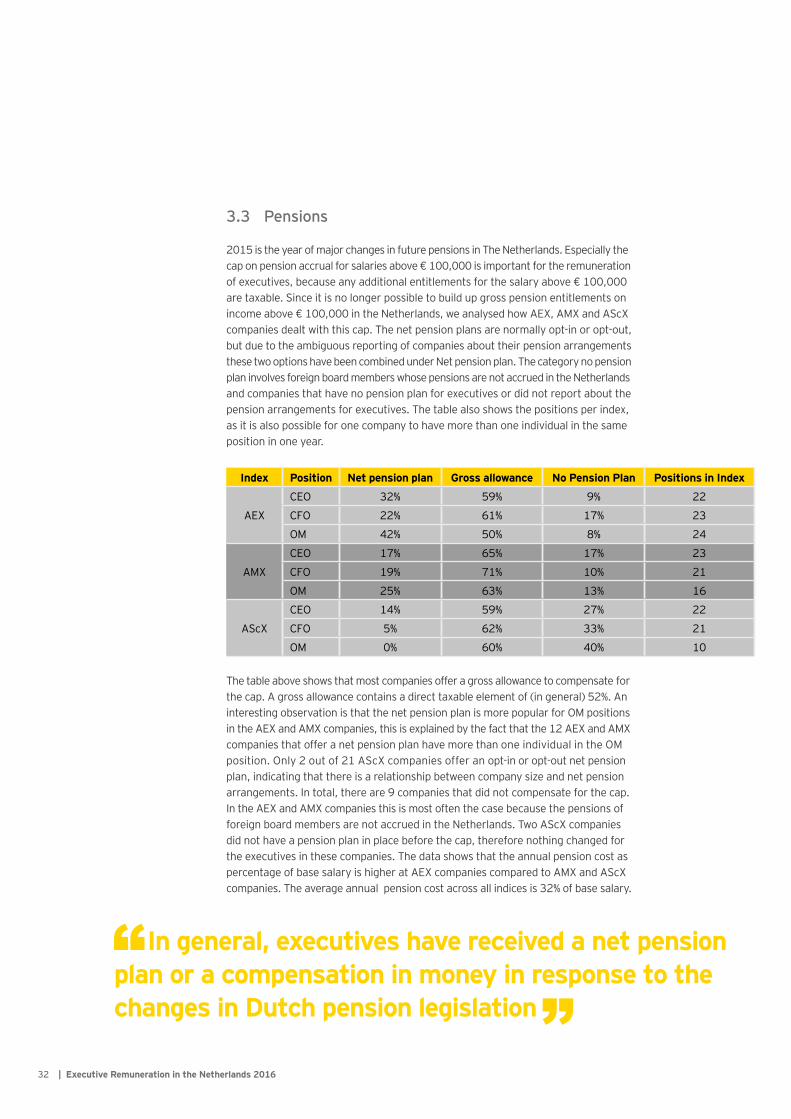
The table above shows that most companies offer a gross allowance to compensate for the cap. A gross allowance contains a direct taxable element of (in general) 52%. An interesting observation is that the net pension plan is more popular for OM positions in the AEX and AMX companies, this is explained by the fact that the 12 AEX and AMX companies that offer a net pension plan have more than one individual in the OM position. Only 2 out of 21 AScX companies offer an opt-in or opt-out net pension plan, indicating that there is a relationship between company size and net pension arrangements. In total, there are 9 companies that did not compensate for the cap. In the AEX and AMX companies this is most often the case because the pensions of foreign board members are not accrued in the Netherlands. Two AScX companies did not have a pension plan in place before the cap, therefore nothing changed for the executives in these companies. The data shows that the annual pension cost as percentage of base salary is higher at AEX companies compared to AMX and AScX companies. The average annual pension cost across all indices is 32% of base salary.
3.3 Pensions
2015 is the year of major changes in future pensions in The Netherlands. Especially the cap on pension accrual for salaries above € 100,000 is important for the remuneration of executives, because any additional entitlements for the salary above € 100,000 are taxable. Since it is no longer possible to build up gross pension entitlements on income above € 100,000 in the Netherlands, we analysed how AEX, AMX and AScX companies dealt with this cap. The net pension plans are normally opt-in or opt-out, but due to the ambiguous reporting of companies about their pension arrangements these two options have been combined under Net pension plan. The category no pension plan involves foreign board members whose pensions are not accrued in the Netherlands and companies that have no pension plan for executives or did not report about the pension arrangements for executives. The table also shows the positions per index, as it is also possible for one company to have more than one individual in the same position in one year.
Index Position Net pension plan Gross allowance No Pension Plan Positions in Index
AEX
CEO 32% 59% 9% 22
CFO 22% 61% 17% 23
OM 42% 50% 8% 24
AMX
CEO 17% 65% 17% 23
CFO 19% 71% 10% 21
OM 25% 63% 13% 16
AScX
CEO 14% 59% 27% 22
CFO 5% 62% 33% 21
OM 0% 60% 40% 10
| Executive Remuneration in the Netherlands 201632
In general, executives have received a net pension plan or a compensation in money in response to the changes in Dutch pension legislation
3.4 Sustainability
In the report from last year, we mentioned that companies have become more interested in sustainability. This year we studied the use of sustainable remuneration in the Netherlands, by examining the reports and remuneration policies of AEX, AMX and AScX companies. Furthermore, 10 participants from 8 AEX and AMX companies were interviewed to explore how sustainable remuneration has developed within the company. In this section we will first present a literature review of sustainable remuneration based on three studies. Thereafter, we will discuss the findings of our own research about sustainable remuneration.
Literature ReviewPresently, it is increasingly recognized that organizations have a purpose other than just making profit. Since mainly institutional shareholders are more interested in sustainability, and customers increasingly demand sustainable products, organizations are under considerable pressure to improve their sustainability performance. In the Netherlands, increasing attention is given to these issues1.
In an effort to integrate sustainability into the corporate strategy, a few Dutch organizations, primarily operating in polluting industries, have included sustainability targets in the scorecard of executives. The remuneration systems in these industries have linked various environmental, social, and governance goals to executive remuneration. By rewarding executives if determined sustainability targets are met, companies attempt to create a more equal focus between financial and non-financial performance2. The underlying thought of sustainable remuneration systems is that executives need an external stimulus to act responsibly, and that rewards trigger the extrinsic motivation of executives and consequently help to steer their behavior in order to improve overall performance.
The study from Kolk and Perego3 revealed that sustainable remuneration systems help to create an alignment between the organization’s sustainability goals and the corporate strategy. Furthermore, the design of the remuneration systems appears to be relevant, since short-term targets are more likely to have a negative impact on sustainability performance. A probable explanation for this correlation is that executives are conceivably more focused on annual organizational performance when their bonus is based on short-term targets.
1 Funk, K. (2003). Sustainability and Performance. MIT Sloan Management Review, 44(2), 65-70.2 Maas, K., & Rosendaal, S. (2015). Sustainability Targets in Executive Remuneration: Targets,
Time frame, Country and Sector Specification. Business Strategy and the Environment, 1-12.3 Kolk, A., & Perego, P. (2014). Sustainable Bonuses: Sign of Corporate Responsibility or Window
Dressing? Journal of Business Ethics, 119, 1-15.
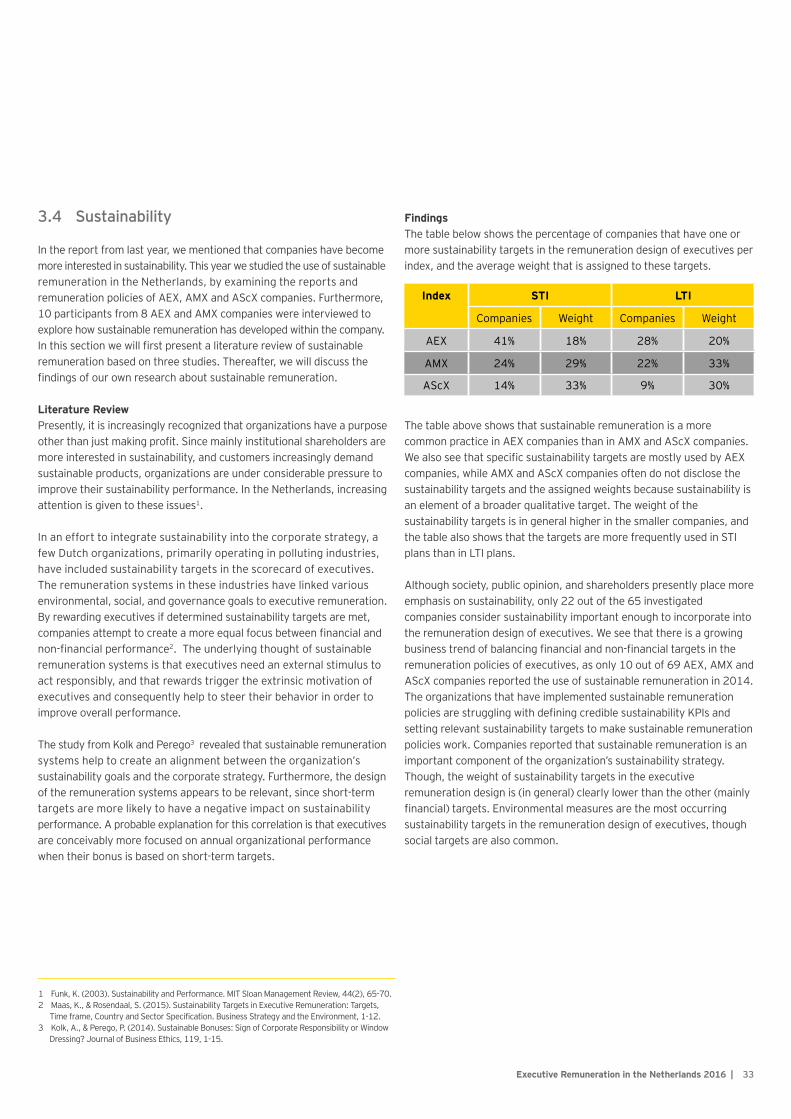
FindingsThe table below shows the percentage of companies that have one or more sustainability targets in the remuneration design of executives per index, and the average weight that is assigned to these targets.
The table above shows that sustainable remuneration is a more common practice in AEX companies than in AMX and AScX companies. We also see that specific sustainability targets are mostly used by AEX companies, while AMX and AScX companies often do not disclose the sustainability targets and the assigned weights because sustainability is an element of a broader qualitative target. The weight of the sustainability targets is in general higher in the smaller companies, and the table also shows that the targets are more frequently used in STI plans than in LTI plans.
Although society, public opinion, and shareholders presently place more emphasis on sustainability, only 22 out of the 65 investigated companies consider sustainability important enough to incorporate into the remuneration design of executives. We see that there is a growing business trend of balancing financial and non-financial targets in the remuneration policies of executives, as only 10 out of 69 AEX, AMX and AScX companies reported the use of sustainable remuneration in 2014. The organizations that have implemented sustainable remuneration policies are struggling with defining credible sustainability KPIs and setting relevant sustainability targets to make sustainable remuneration policies work. Companies reported that sustainable remuneration is an important component of the organization’s sustainability strategy. Though, the weight of sustainability targets in the executive remuneration design is (in general) clearly lower than the other (mainly financial) targets. Environmental measures are the most occurring sustainability targets in the remuneration design of executives, though social targets are also common.
Index STI LTI
Companies Weight Companies Weight
AEX 41% 18% 28% 20%
AMX 24% 29% 22% 33%
AScX 14% 33% 9% 30%
Executive Remuneration in the Netherlands 2016 | 33
EY viewpoint: sustainable remuneration
Extrinsic motivators and stakeholder pressure stress the importance of sustainability for the company, though intrinsic motivation seems to be needed in addition to make companies really sincere about sustainability. Due to the (often) low weight of the sustainability targets, the influence of sustainability performance on executive pay is (usually) limited. Companies are advised to choose relevant sustainability KPIs, to integrate sustainability into the corporate strategy and not make it something nice to have for the company.
Companies also revealed that executives have become more involved with sustainability initiatives since the implementation of sustainable remuneration policies. Moreover, executives put in more effort to accomplish the determined sustainability targets. Hence, sustainable remuneration policies help to place sustainability higher on the corporate agenda and correspondingly result in a higher focus on sustainability throughout the whole organization. Furthermore, the performance of executives is more closely monitored for the reason that organizations measure and report their sustainability performance.
| Executive Remuneration in the Netherlands 201634
Sustainability has made its entrance in the boardroom, but the influence on executive remuneration is (still) low

Appendices
35Executive Remuneration in the Netherlands 2016 |
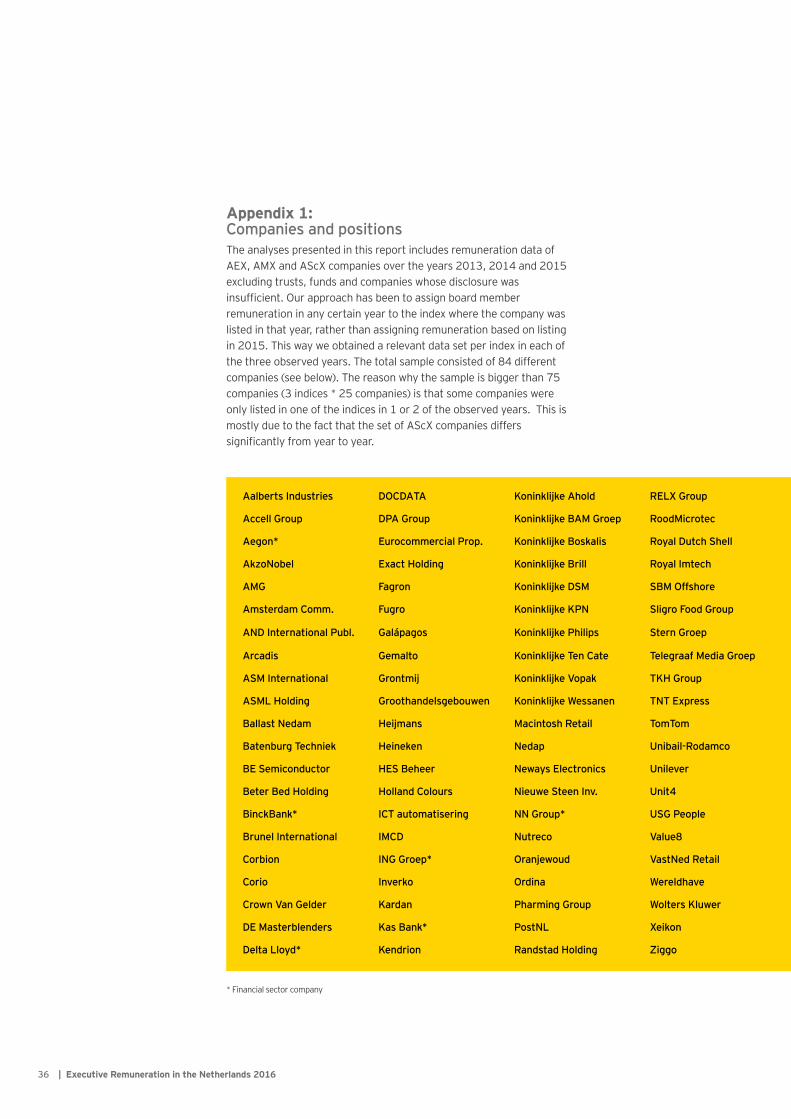
Appendix 1: Companies and positionsThe analyses presented in this report includes remuneration data of AEX, AMX and AScX companies over the years 2013, 2014 and 2015 excluding trusts, funds and companies whose disclosure was insufficient. Our approach has been to assign board member remuneration in any certain year to the index where the company was listed in that year, rather than assigning remuneration based on listing in 2015. This way we obtained a relevant data set per index in each of the three observed years. The total sample consisted of 84 different companies (see below). The reason why the sample is bigger than 75 companies (3 indices * 25 companies) is that some companies were only listed in one of the indices in 1 or 2 of the observed years. This is mostly due to the fact that the set of AScX companies differs significantly from year to year.
Aalberts Industries DOCDATA Koninklijke Ahold RELX Group
Accell Group DPA Group Koninklijke BAM Groep RoodMicrotec
Aegon* Eurocommercial Prop. Koninklijke Boskalis Royal Dutch Shell
AkzoNobel Exact Holding Koninklijke Brill Royal Imtech
AMG Fagron Koninklijke DSM SBM Offshore
Amsterdam Comm. Fugro Koninklijke KPN Sligro Food Group
AND International Publ. Galápagos Koninklijke Philips Stern Groep
Arcadis Gemalto Koninklijke Ten Cate Telegraaf Media Groep
ASM International Grontmij Koninklijke Vopak TKH Group
ASML Holding Groothandelsgebouwen Koninklijke Wessanen TNT Express
Ballast Nedam Heijmans Macintosh Retail TomTom
Batenburg Techniek Heineken Nedap Unibail-Rodamco
BE Semiconductor HES Beheer Neways Electronics Unilever
Beter Bed Holding Holland Colours Nieuwe Steen Inv. Unit4
BinckBank* ICT automatisering NN Group* USG People
Brunel International IMCD Nutreco Value8
Corbion ING Groep* Oranjewoud VastNed Retail
Corio Inverko Ordina Wereldhave
Crown Van Gelder Kardan Pharming Group Wolters Kluwer
DE Masterblenders Kas Bank* PostNL Xeikon
Delta Lloyd* Kendrion Randstad Holding Ziggo
* Financial sector company
| Executive Remuneration in the Netherlands 201636
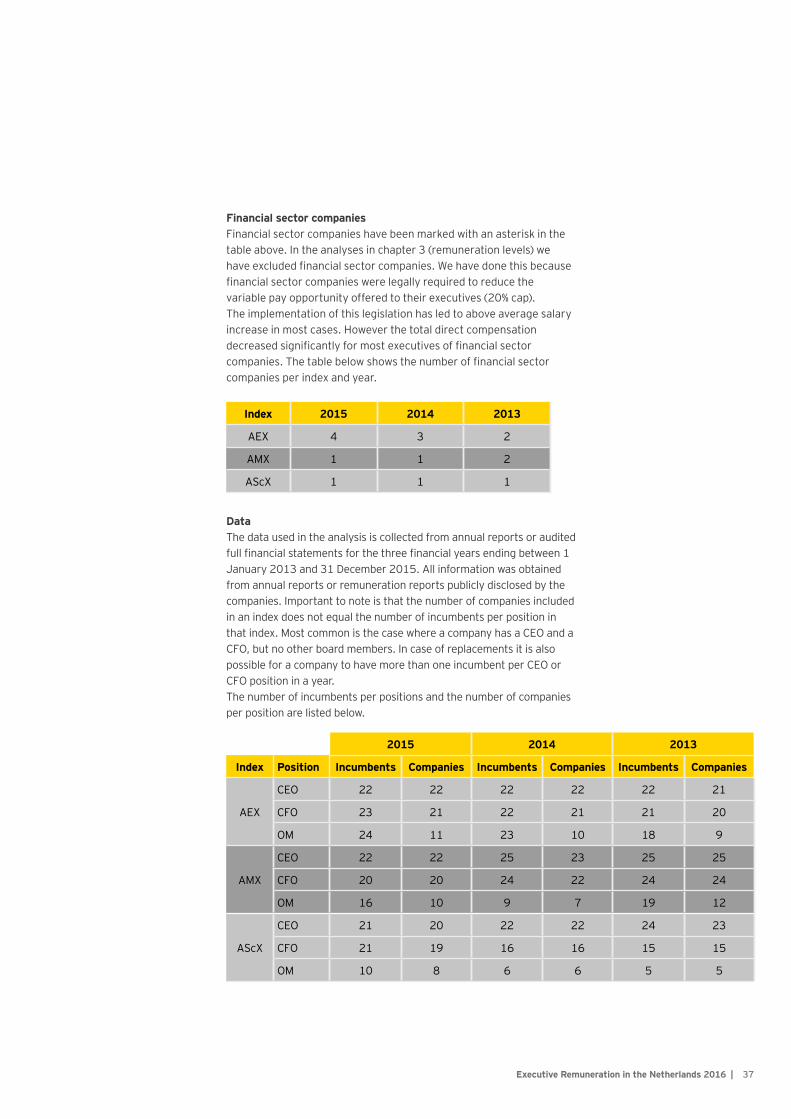
Financial sector companiesFinancial sector companies have been marked with an asterisk in the table above. In the analyses in chapter 3 (remuneration levels) we have excluded financial sector companies. We have done this because financial sector companies were legally required to reduce the variable pay opportunity offered to their executives (20% cap).The implementation of this legislation has led to above average salary increase in most cases. However the total direct compensation decreased significantly for most executives of financial sector companies. The table below shows the number of financial sector companies per index and year.
DataThe data used in the analysis is collected from annual reports or audited full financial statements for the three financial years ending between 1 January 2013 and 31 December 2015. All information was obtained from annual reports or remuneration reports publicly disclosed by the companies. Important to note is that the number of companies included in an index does not equal the number of incumbents per position in that index. Most common is the case where a company has a CEO and a CFO, but no other board members. In case of replacements it is also possible for a company to have more than one incumbent per CEO or CFO position in a year. The number of incumbents per positions and the number of companies per position are listed below.
2015 2014 2013
Index Position Incumbents Companies Incumbents Companies Incumbents Companies
AEX
CEO 22 22 22 22 22 21
CFO 23 21 22 21 21 20
OM 24 11 23 10 18 9
AMX
CEO 22 22 25 23 25 25
CFO 20 20 24 22 24 24
OM 16 10 9 7 19 12
AScX
CEO 21 20 22 22 24 23
CFO 21 19 16 16 15 15
OM 10 8 6 6 5 5
Index 2015 2014 2013
AEX 4 3 2
AMX 1 1 2
AScX 1 1 1
Executive Remuneration in the Netherlands 2016 | 37
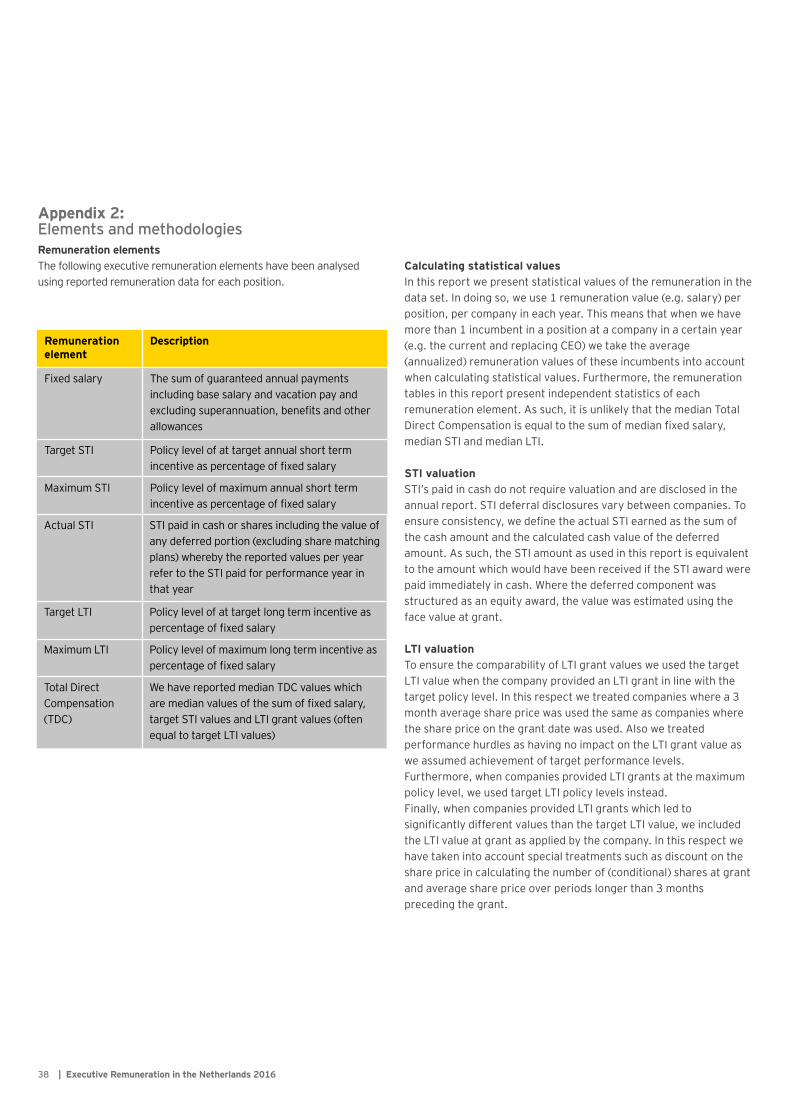
Remuneration element
Description
Fixed salary The sum of guaranteed annual payments including base salary and vacation pay and excluding superannuation, benefits and other allowances
Target STI Policy level of at target annual short term incentive as percentage of fixed salary
Maximum STI Policy level of maximum annual short term incentive as percentage of fixed salary
Actual STI STI paid in cash or shares including the value of any deferred portion (excluding share matching plans) whereby the reported values per year refer to the STI paid for performance year in that year
Target LTI Policy level of at target long term incentive as percentage of fixed salary
Maximum LTI Policy level of maximum long term incentive as percentage of fixed salary
Total Direct Compensation (TDC)
We have reported median TDC values which are median values of the sum of fixed salary, target STI values and LTI grant values (often equal to target LTI values)
Appendix 2: Elements and methodologies Remuneration elementsThe following executive remuneration elements have been analysed using reported remuneration data for each position.
Calculating statistical valuesIn this report we present statistical values of the remuneration in the data set. In doing so, we use 1 remuneration value (e.g. salary) per position, per company in each year. This means that when we have more than 1 incumbent in a position at a company in a certain year (e.g. the current and replacing CEO) we take the average (annualized) remuneration values of these incumbents into account when calculating statistical values. Furthermore, the remuneration tables in this report present independent statistics of each remuneration element. As such, it is unlikely that the median Total Direct Compensation is equal to the sum of median fixed salary, median STI and median LTI.
STI valuationSTI’s paid in cash do not require valuation and are disclosed in the annual report. STI deferral disclosures vary between companies. To ensure consistency, we define the actual STI earned as the sum of the cash amount and the calculated cash value of the deferred amount. As such, the STI amount as used in this report is equivalent to the amount which would have been received if the STI award were paid immediately in cash. Where the deferred component was structured as an equity award, the value was estimated using the face value at grant.
LTI valuationTo ensure the comparability of LTI grant values we used the target LTI value when the company provided an LTI grant in line with the target policy level. In this respect we treated companies where a 3 month average share price was used the same as companies where the share price on the grant date was used. Also we treated performance hurdles as having no impact on the LTI grant value as we assumed achievement of target performance levels. Furthermore, when companies provided LTI grants at the maximum policy level, we used target LTI policy levels instead. Finally, when companies provided LTI grants which led to significantly different values than the target LTI value, we included the LTI value at grant as applied by the company. In this respect we have taken into account special treatments such as discount on the share price in calculating the number of (conditional) shares at grant and average share price over periods longer than 3 months preceding the grant.
| Executive Remuneration in the Netherlands 201638
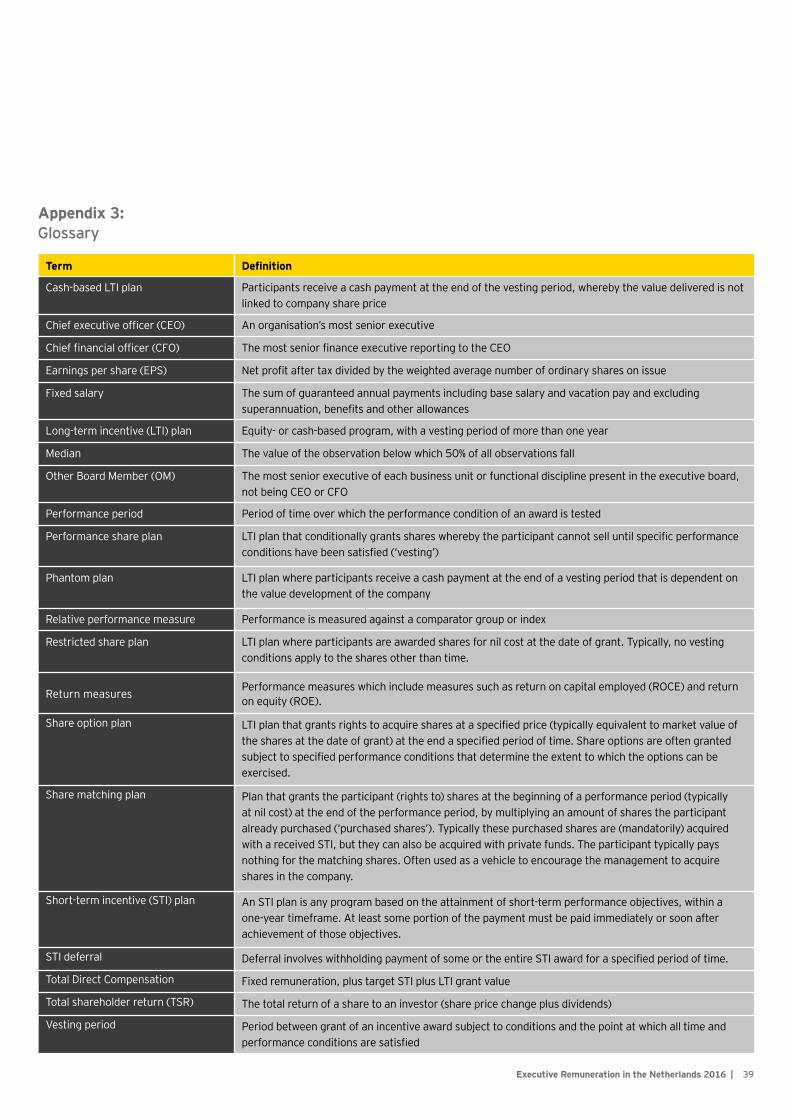
Appendix 3: Glossary
Term Definition
Cash-based LTI plan Participants receive a cash payment at the end of the vesting period, whereby the value delivered is not linked to company share price
Chief executive officer (CEO) An organisation’s most senior executive
Chief financial officer (CFO) The most senior finance executive reporting to the CEO
Earnings per share (EPS) Net profit after tax divided by the weighted average number of ordinary shares on issue
Fixed salary The sum of guaranteed annual payments including base salary and vacation pay and excluding superannuation, benefits and other allowances
Long-term incentive (LTI) plan Equity- or cash-based program, with a vesting period of more than one year
Median The value of the observation below which 50% of all observations fall
Other Board Member (OM) The most senior executive of each business unit or functional discipline present in the executive board, not being CEO or CFO
Performance period Period of time over which the performance condition of an award is tested
Performance share plan LTI plan that conditionally grants shares whereby the participant cannot sell until specific performance conditions have been satisfied (‘vesting’)
Phantom plan LTI plan where participants receive a cash payment at the end of a vesting period that is dependent on the value development of the company
Relative performance measure Performance is measured against a comparator group or index
Restricted share plan LTI plan where participants are awarded shares for nil cost at the date of grant. Typically, no vesting conditions apply to the shares other than time.
Return measures Performance measures which include measures such as return on capital employed (ROCE) and return on equity (ROE).
Share option plan LTI plan that grants rights to acquire shares at a specified price (typically equivalent to market value of the shares at the date of grant) at the end a specified period of time. Share options are often granted subject to specified performance conditions that determine the extent to which the options can be exercised.
Share matching plan Plan that grants the participant (rights to) shares at the beginning of a performance period (typically at nil cost) at the end of the performance period, by multiplying an amount of shares the participant already purchased (‘purchased shares’). Typically these purchased shares are (mandatorily) acquired with a received STI, but they can also be acquired with private funds. The participant typically pays nothing for the matching shares. Often used as a vehicle to encourage the management to acquire shares in the company.
Short-term incentive (STI) plan An STI plan is any program based on the attainment of short-term performance objectives, within a one-year timeframe. At least some portion of the payment must be paid immediately or soon after achievement of those objectives.
STI deferral Deferral involves withholding payment of some or the entire STI award for a specified period of time.
Total Direct Compensation Fixed remuneration, plus target STI plus LTI grant value
Total shareholder return (TSR) The total return of a share to an investor (share price change plus dividends)
Vesting period Period between grant of an incentive award subject to conditions and the point at which all time and performance conditions are satisfied
Executive Remuneration in the Netherlands 2016 | 39
EY | Assurance | Tax | Transactions | Advisory
About EY EY is a global leader in assurance, tax, transaction and advisory services. The insights and quality services we deliver help build trust and confidence in the capital markets and in economies the world over. We develop outstanding leaders who team to deliver on our promises to all of our stakeholders. In so doing, we play a critical role in building a better working world for our people, for our clients and for our communities.
EY refers to the global organization, and may refer to one or more, of the member firms of Ernst & Young Global Limited, each of which is a separate Legal entity. Ernst & Young Global Limited, a UK company limited by guarantee, does not provide services to clients. For more information about our organization, please visit ey.com.
About EY’s People Advisory ServicesIn today’s market, people make the difference between success and failure.As your organization grows, getting the right people in the right place whenyou need them is what gives you competitive advantage. Our performance and reward professionals help you design compensation programs and equity incentives that really engage your key people. Our global mobility team advises many of the world’s largest global employers — as well as those just venturing into their first foreign country. We help you meet your executive tax compliance obligations, stay on top of regulatory change, manage your global talent effectively and improve your function’s strategic alignment. Let us help your organization achieve its potential by turning complexity into competitive advantage. It’s how EY makes a difference.
© 2016 Ernst & Young Belastingadviseurs LLP.All Rights Reserved.
ED None155010207
This publication contains information in summary form and is therefore intended for general guidance only. It is not intended to be a substitute for detailed research or the exercise of professional judgment.Neither EYGM Limited nor any other member of the global EY organization can accept any responsibility for loss occasioned to any person acting or refraining from action as a result of any material in this publication. On any specific matter, reference should be made to the appropriate advisor.
ey.com/nl