
Executive directors’ remuneration - Homepage | PwC … directors’ remuneration – Practices and...
68
Executive directors’ remuneration Practices and trends report South Africa June 2012 www.pwc.co.za
Transcript of Executive directors’ remuneration - Homepage | PwC … directors’ remuneration – Practices and...

Executive directors’ remunerationPractices and trends report
South AfricaJune 2012
www.pwc.co.za
PwC
Table of contents
Glossary 1
Executive summary 2
Information 3
Remuneration – where are we? 5
Fixed pay – greater or lesser of a deal? 7
Variable pay 9
Prescribed officers – what do we see? 21
A governance storm or light drizzle? 23
The profile of an executive director 29
Executive directors’ remuneration – JSE trends 34
About PwC 63
Acknowledgements 64
Executive directors’ remuneration – Practices and trends report 1
Glossary
• Total guaranteed package (TGP) – refers to all components of remuneration that are guaranteed, including base salary and benefits that typically accrue on a monthly basis (pension, medical, and car allowance among others).
• Short-term incentive (STI) – refers to all cash-based payments that are paid to an individual based on company and individual performance for a 12-month period. STI differs from the target STI which is reflective of the company’s policy regarding the potential STI earnings.
• Long-term incentive (LTI) – refers to all cash and equity-based awards that accrue to an individual based on company performance over a period longer than 12 months.
• Variable pay – refers to short-term incentives and long-term incentives.
• Total remuneration (TR) – refers to the TGP plus the short-term incentive.
• Total earnings (TE) – refers to the TGP, plus both the short-term incentive and the long-term incentive pay.

2 PwC
Executive summary
As the global economy has shown signs of market recovery but not at the pace anticipated, we are finding companies are once again investing in recruiting and retaining talent in an effort to align people strategy with business strategy. However, this is all in a market that is facing regulatory, shareholder and media scrutiny over executive remuneration, while at the same time, trying to preserve shareholder returns in the face of what appears to be an ever increasing payroll cost. Consequently, it is not surprising that the key challenge facing companies is to budget for low base pay increases, whilst remaining competitive in the market to retain and motivate key employees. With regard to variable pay, companies are starting to question the effectiveness of deferral and are looking more towards incorporating non-financial performance criteria in long-term incentive plans.
New regulation is constantly being developed globally and is forcing companies to revisit their remuneration mix and their decision-
making on executive remuneration practices – the development of claw-back provisions is just but one such example. At the time of writing this publication, the European Union is in the process of finalising the most updated text of the Capital Requirements Directive (CRD 4), which proposes the introduction of a one-to-one cap of variable to fixed pay. The prescriptive elements of these regulations are aimed at large European Banks, however, they are likely to make their way to the rest of the world. Although South African remuneration practices are less regulated than in Europe and the US, we tend to emulate these markets (especially the UK) over time.
In this publication, we report on trends in the remuneration paid to executive directors of JSE-listed companies over the last 12 months. In addition, we have provided some insight on the following:
• shareholder and institutional investor sentiment with regard to executive remuneration,
• the type and combination of company performance conditions for long-term incentives,
• whether deferral is effective for short-term incentives, and
• what is in the pipeline globally in terms of remuneration governance legislation?
For the first time, we have also looked at:
• prescribed officers and the available data from remuneration reports,
• female representation on boards globally, and
• a holistic approach to the implementation of a new long-term incentive plan.
We hope that you will find this trends publication and the issues it raises of interest and assistance.
Gerald Seegers Director: Human Resources Service
Gerald Seegers
Welcome to PwC’s fourth edition of the Executive directors – Practices and remuneration trends report: South Africa 2012.
Executive directors’ remuneration – Practices and trends report 3
Sources of information
The data set out in this publication is drawn from information publicly available for the 12-month reporting period ending on 30 April 2012 (the ‘cut off date’). The information has been taken from the annual reports of 373 companies that are listed on the Johannesburg Securities Exchange (JSE).
Format of information and definitions
Since the introduction of this annual publication in June 2009, our belief remains that there is no direct correlation between market capitalisation – calculated by reference to the number of shares in issue and the prevailing share price – and the remuneration of executive directors. However, we are of the view that market capitalisation is a good proxy for size and complexity, and is an appropriate metric to set peer groups and for benchmarking purposes. It is against this backdrop that data is analysed in terms of:
• Large-cap
The top 40 JSE-listed companies, valued by means of market capitalisation.
• Medium-cap
41 to 100 of the JSE-listed companies, valued by means of market capitalisation.
Information
Remuneration levels rarely follow a normal distribution curve. For this reason, we have used a quartile/percentile range in preference to averages and standard deviations that assume normality.
These quartiles/percentiles are defined as:
• Lowerquartile(25thpercentile)
75% of the sample earns more and 25% earn less than this level
• Median(50thpercentile)
50% of the sample earns more and 50% of the sample earns less than this level
• Upperquartile(75thpercentile)
25% of the sample earns more and 75% earn less than this level

4 PwC
• Small-cap
101 to 373 of the JSE-listed companies, valued by means of market capitalisation.
Those companies that are listed on the AltX have been aggregated into the above valuations. Where the AltX is evaluated as a standalone group, it refers to 59 companies with a market value of R13.926 bn.
In addition to analysing the remuneration paid to executive directors across the JSE as a whole, we have also analysed the remuneration paid by reference to four main industries (in addition to AltX) – basic resources, financial services, industrial and services. In respect of each industry, we have split the data in accordance with the market
capitalisation of the companies and the AltX. Further details about each industry and the sectors which make up that industry are set out in the annexure to this publication.
The remuneration values expressed in this publication are the totals paid to executive directors excluding the value of awards allocated under long-term incentive plans and gains made on the settlement of awards allocated under long-term incentive plans.
Where values are given, they are annual values in each case.
Terms used
The terms used throughout this publication are as set out in the glossary.
Executive directors’ remuneration – Practices and trends report 5
Remuneration – where are we?
Introduction
The past year was marked by a considerable amount of stakeholder action groups challenging decisions made by government. The predicted and long awaited economic recovery following the global economic crises has not materialised in its entirety. Although certain sectors have produced significant growth, others continue to struggle. This sentiment, together with ever increasing commodity prices, has sparked interesting debates in the media surrounding predicted and required growth in South Africa. Coupled with discussions on economic growth targets and the performance of South African companies, the topic of executive remuneration remained a very hot one in 2011 and 2012. We have seen shareholders and institutional investors becoming more vocal than ever regarding perceived excessive payments made to executive directors.
It remains a tough act to balance the interests of all stakeholders including shareholders, the wider base of employees, government, the general public and especially the expectations of executives directing companies on a daily business to remain profitable, increase profitability or return to profitability.
In our report we have investigated the general quartiles of total remuneration, the elements which make up total remuneration as well as whether regulation and legislation, similar to what is currently proposed in the UK and Australia, is the solution in South Africa.
As was the case in 2011, the 2012 reporting period saw increases in TGP and total remuneration paid to executive directors vary quite considerably from industry to industry and across large-cap, medium-cap and small-cap companies. This is possibly a product of uncertain economic times and companies seeking to retain what they perceive to be their top talent, or bidding to obtain talent from elsewhere in the market.
For the 2012 reporting period we noted that actual STI payments to CEOs of large cap companies rose significantly from the 2011 reporting period. CFO and other executive directors’ actual STI for the 2012 reporting period, for large cap companies, exceeded that of medium and small cap companies. However, they did not increase by the same margin from the 2011 reporting period as did large cap companies’ CEO actual STI. Actual STI is designed to be a factor of financial outperformance and it is therefore an indication that high growth was delivered in certain sectors during the 2012 reporting period.
Reward mix for executives
The typical reward mix and what this should be remains a question posed by companies on a daily basis. Disclosure thereof has become standard practice amongst JSE-listed companies.
6 PwC
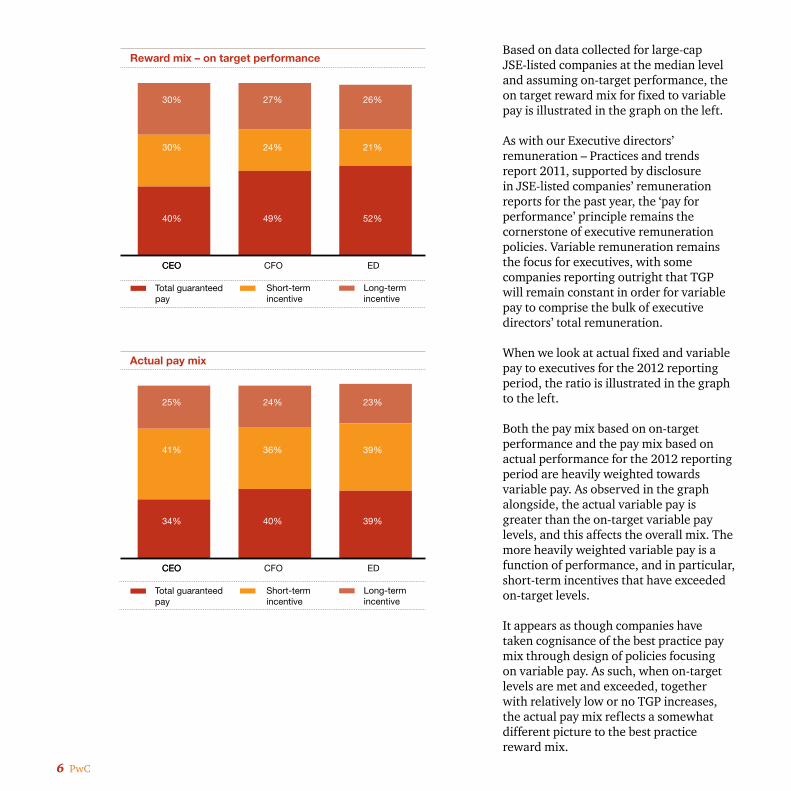
Based on data collected for large-cap JSE-listed companies at the median level and assuming on-target performance, the on target reward mix for fixed to variable pay is illustrated in the graph on the left.
As with our Executive directors’ remuneration – Practices and trends report 2011, supported by disclosure in JSE-listed companies’ remuneration reports for the past year, the ‘pay for performance’ principle remains the cornerstone of executive remuneration policies. Variable remuneration remains the focus for executives, with some companies reporting outright that TGP will remain constant in order for variable pay to comprise the bulk of executive directors’ total remuneration.
When we look at actual fixed and variable pay to executives for the 2012 reporting period, the ratio is illustrated in the graph to the left.
Both the pay mix based on on-target performance and the pay mix based on actual performance for the 2012 reporting period are heavily weighted towards variable pay. As observed in the graph alongside, the actual variable pay is greater than the on-target variable pay levels, and this affects the overall mix. The more heavily weighted variable pay is a function of performance, and in particular, short-term incentives that have exceeded on-target levels.
It appears as though companies have taken cognisance of the best practice pay mix through design of policies focusing on variable pay. As such, when on-target levels are met and exceeded, together with relatively low or no TGP increases, the actual pay mix reflects a somewhat different picture to the best practice reward mix.
CEOCEO CFO ED
40%
30%
30%
49%
27%
24%
52%
26%
21%
Total guaranteedpay
Short-termincentive
Long-termincentive
Reward mix – on target performance
CEOCEO CFO ED
34%
25%
41%
40%
24%
36%
39%
23%
39%
Total guaranteedpay
Short-termincentive
Long-termincentive
Actual pay mix

Executive directors’ remuneration – Practices and trends report 7
Introduction
TGP quartiles of companies surveyed will be dealt with in greater detail later in this report. In this section we look at whether TGP in uncertain times has increased or decreased, resulting in a change in the best practice pay mix which we have seen over the past years.
Average increases
The general trend for TGP increases in South Africa for wider based employees, for the 12-month period prior to March 2012, was 6.7% to 7.2% on average.1 In comparison, last year’s average TGP increase trend for the 12-month period prior to March 2011, ranged between 7.6% and 8.0%2 and it is therefore evident that companies are approaching TGP increases with greater caution. This is understandable when considering the greater reward and economic landscape both nationally and internationally.
1 Benchmarking for Success – PwC Salary and wage movement survey, March 2012
2 Salary and Wage Movement Survey, March 2011 – PwC Remchannel
Fixed pay – greater or lesser of a deal?
When looking at executive director TGP increases for the 2012 reporting period, we note that the median increase for large, medium and small cap companies listed on the JSE was 6% to 8%. In instances where increases exceeded 8%, this tended to be a function of change in leadership. Generally, for 2012 the executive director’s median TGP increase mirrored the general average TGP increase for wider based employees.
The reported inflation rate in South Africa in April 2012 was 6.1%, with the average inflation rate for 2011 recorded as 5.03%. Therefore, the overall 2012 TGP increases appear to be in line with or slightly higher than the average South African inflation rate.
In terms of UK data, it is important to note that the surveys extend to base salary, excluding benefits, due to different approaches in remuneration structuring. Therefore, UK base salary data cannot be used as a direct comparison, however, it does provide an indication in terms of increases. In the UK, we see that the median FTSE 100 and FTSE 250 actual base salary increases in 2011 across all levels of executives ranged from 3% to 4%. Salary increases expected in 2012 across the FTSE 100 and the FTSE 250 are identical, with rises expected to be between 2% and 4%, broadly in line with 2011 rates.3
3 Getting the balance of executive pay right – PwC UK executive reward survey, January 2012

8 PwC
The trends reported in the UK reflect substantially lower increases than in South Africa. Also, in light of global economic conditions, coupled with increased shareholder activism and public scrutiny, we expect that 2013 TGP increases in South Africa should not significantly exceed inflation. Anticipated TGP increases will largely depend on whether markets on the whole increase and any increases in TGP not aligned to share price performance are likely to meet strong resistance from shareholders.
Companies are not expected to place greater emphasis on TGP in the year ahead and TGP increases for executives should be aligned, to or even less than, increases for wider based employees. It is envisaged that companies will continue to focus on variable pay as the differentiating element to either reward performance or attract critical skills. It will, however, be interesting to see whether recent proposals pertaining to bonus capping will change companies’ approach in future.
Executive directors’ remuneration – Practices and trends report 9
Variable pay
Short-term incentives (STI)
Getting tough on performance
Within the South African context, two notable trends have been identified for the STI component of incentive pay. Firstly, it appears as though the actual pay levels have increased. Intuitively, the actual levels may naturally increase as guaranteed pay increases, but the increases appear to surpass CPI levels. Secondly, institutional investors have become increasingly more vocal on issues of performance and the need to create the environment for STIs to be more transparent and more aligned with performance.
Ideally, the combination of these two factors would result in better company performance, coupled with more effective incentive pay frameworks. Unfortunately, the equation is not as simple as that, and the phenomenon of incentives exists as a dynamic, complex system. We note that there remains a
fair amount of managerial influence in the determination of incentive structures as well as incentive pay-out levels. Managerial influence is proposed as a counter-argument to the agency approach, which suggests that individuals are rational value maximising beings, leading to stronger performance and pay relationships.
The reality is that individuals, both at the shareholder and management levels, do not represent wholly rational beings. Management becomes accustomed to their incentive payments in good periods, and they develop the ability to create strong arguments for incentive pay even in period of weakened economic performance. Shareholders, represented through their remuneration committees, become accustomed to the levels of pay that are expected by management as well
The relationship between pay and performance has long been a critical talking point of executive remuneration. The volatile economic conditions, triggered by the financial crisis, has heightened the scrutiny on incentives and placed renewed emphasis on the relationship between performance and pay. The problem is not uniquely Western, with organisations across the globe turning toward incentive pay as an appropriate way to manage risk and reward. Globalisation of organisations and the continual war for talent is reinforcing the emphasis on incentive pay. The focus on incentive pay provides organisations with flexibility in uncertain times, while providing attractive leverage in the event of sound business performance. However, the global convergence of governance norms has galvanized the resolve to ensure that incentives are appropriate.
10 PwC
as falling into the trap of ‘group-think’ in terms of how incentives should be structured and managed. Thus, while there continues to be a big focus on improving the link between performance and pay, there is much work still to be done.
Our research suggests that organisations are focusing on the following areas as they become tougher on performance:
• Holisticviewofperformance – organisations are increasingly using a mix of financial, non-financial, and personal performance measures to determine STI. The over-emphasis on financial measures appears to be waning and a more balanced approach to performance is being implemented. A focus on sustainability, both financially, and non-financially remains one of the strong design components of recent STI plans.
• Gettingthetargetsright– organisations are looking to ensure that appropriate threshold, on-target and stretch targets are set to ensure appropriate lower and upper bound pay-out levels. The payout levels need to be sufficient to protect against unwarranted incentive payments, while still providing sufficient reward in the case of exceptional performance.
• Implementationofincentivedeferrals – organisations are increasingly implementing bonus deferrals where a portion of the STI is deferred for a period of time and paid out as cash subject to continued performance, or a portion of the STI is deferred into shares, thereby creating a strong incentive to ensure continued organisational performance.
The first two discussion points mentioned above, namely: ‘a holistic view of performance’ and ‘getting the targets right’, play an important role in providing the environment for sufficient differentiation between individuals within STI scheme structures.
Our consulting engagements with clients have highlighted the challenge of differentiating between individuals and the danger of not differentiating sufficiently. While a more egalitarian approach has noble intentions, experience has highlighted that mediocrity develops in environments devoid of sufficient differentiation. It occurs in organisations where the appraisals place too many of the individuals at below par performance, and it occurs in organisations that appraise all their employees as stars. In the former case, employees don’t believe there is a reasonable probability of a favourable appraisal, so they end up not pursuing the targets in any event. In the latter case, the organisation runs the risk of developing a comfort zone and a sense of entitlement.
How does one create a reasonable level of differentiation without subscribing to a false moderated view of the organisation? Importantly, it starts with the acceptance that differentiation is the cornerstone of a performance culture. With this acceptance comes the courage to manage, and to make tough decisions based on performance. We would encourage robust debate between managers and employees about set objectives and performance against those objectives.
The next step is to then ensure the design mechanics, in terms of a holistic set of measures and appropriately set targets, support the objective of appropriate differentiation. In doing so, the organisation will go some way to developing a stronger link between performance and pay.
What do executives want?The third discussion point mentioned above, namely ‘implementation of incentive deferrals’, is a hot topic as it is seen as a mechanism to ensure sustainability, and drive medium to long-term performance. PwC’s recent Psychology of Incentives Survey4, suggests that while the intention is to encourage performance, the mechanism may have a negative effect on performance.
The research indicates that executives, even those operating at the most strategic level, value short-term certainty over long-term uncertainty, even where the long-term gain may be higher. In short, executives
4 Making executive pay work – The psychology of incentives: 2012
Executive directors’ remuneration – Practices and trends report 11
apply a discount factor to deferral payments due to the uncertainty, and these discount factors exceed rational economic discount rates. Thus, the longer the executive has to wait for the incentive, the less it is worth. The outcome is that deferrals may be counter-productive from both a retention and performance management perspective if they do not take into account the discount factors applied by executives.
A strong sentiment coming out of the Psychology of Incentives Survey is the issue of complexity and ambiguity. We have long advocated the fact that STI need to measure tangible outcomes linked to personal and team or divisional performance; ‘line of sight’ as it is termed within the industry. Our research suggests that executives prefer internal measures of profit rather than any other external measure, while at the same time executives prefer fewer measures rather than more. Again, the issue is certainty. Executives are more likely to behave in a particular way where there is greater certainty about the outcome. While being mindful of rent-seeking behaviour, the research suggests a strong argument for more simple approaches to the design and implementation of STI. It is clear from the research that complexity and ambiguity destroy value, and that companies should look to make their incentive structures simpler rather than more complicated.
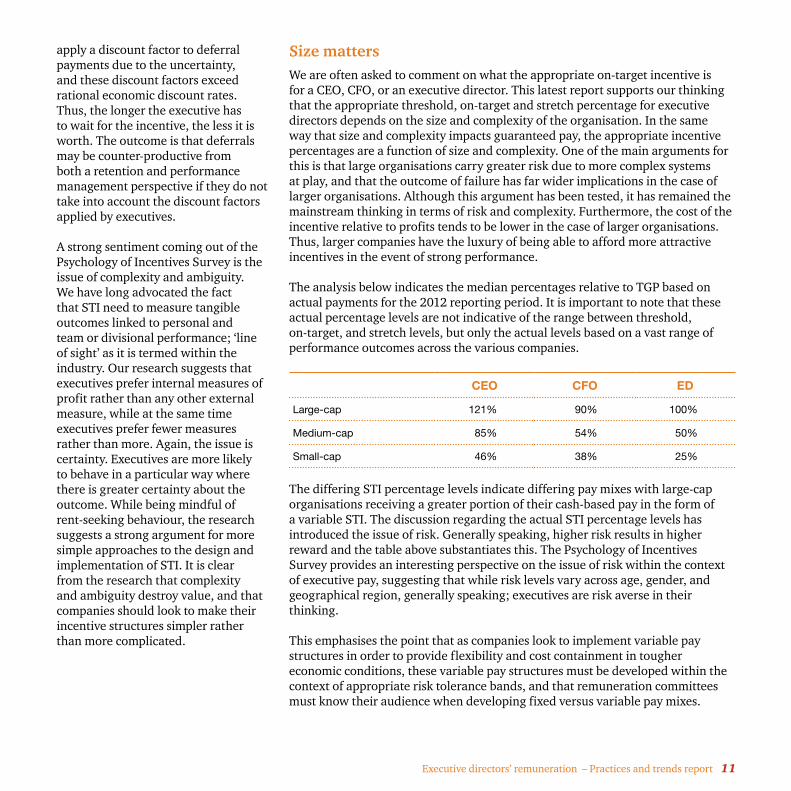
Size mattersWe are often asked to comment on what the appropriate on-target incentive is for a CEO, CFO, or an executive director. This latest report supports our thinking that the appropriate threshold, on-target and stretch percentage for executive directors depends on the size and complexity of the organisation. In the same way that size and complexity impacts guaranteed pay, the appropriate incentive percentages are a function of size and complexity. One of the main arguments for this is that large organisations carry greater risk due to more complex systems at play, and that the outcome of failure has far wider implications in the case of larger organisations. Although this argument has been tested, it has remained the mainstream thinking in terms of risk and complexity. Furthermore, the cost of the incentive relative to profits tends to be lower in the case of larger organisations. Thus, larger companies have the luxury of being able to afford more attractive incentives in the event of strong performance.
The analysis below indicates the median percentages relative to TGP based on actual payments for the 2012 reporting period. It is important to note that these actual percentage levels are not indicative of the range between threshold, on-target, and stretch levels, but only the actual levels based on a vast range of performance outcomes across the various companies.
CEO CFO ED
Large-cap 121% 90% 100%
Medium-cap 85% 54% 50%
Small-cap 46% 38% 25%
The differing STI percentage levels indicate differing pay mixes with large-cap organisations receiving a greater portion of their cash-based pay in the form of a variable STI. The discussion regarding the actual STI percentage levels has introduced the issue of risk. Generally speaking, higher risk results in higher reward and the table above substantiates this. The Psychology of Incentives Survey provides an interesting perspective on the issue of risk within the context of executive pay, suggesting that while risk levels vary across age, gender, and geographical region, generally speaking; executives are risk averse in their thinking.
This emphasises the point that as companies look to implement variable pay structures in order to provide flexibility and cost containment in tougher economic conditions, these variable pay structures must be developed within the context of appropriate risk tolerance bands, and that remuneration committees must know their audience when developing fixed versus variable pay mixes.

12 PwC
Will bonus capping gain traction?
• Bonus pool calculations didn’t sufficiently take account of firms’ capital and liquidity costs and the risks they faced.
• Performance management systems often focused too heavily on financial performance and didn’t take into account multi-year performance.
Following on from the review, the major outcome has been the discussion of a possible implementation of bonus capping. In response to the issue of capital and liquidity risks, the EU set up the Capital Requirements Directive (CDR). The most recent evolution of this directive has become known as the CDR4 and is currently the focus of discussions involving the European Parliament, European Commission, and European Council. Early indications are that the Council has raised the issue of the suitability of the maximum ratio of variable to fixed pay. It is now looking increasingly likely that a leverage cap of 1:1 will be implemented, since there is very little political support for not doing so, and the Members of the European Parliaments’ (MEPs) position has gained significant momentum since MEPs voted on it in early May 2012. The current draft text refers to ‘variable pay’ and is clearly intended
to include all variable remuneration in the definition. The current draft text also contains fairly broad definitions of ‘fixed’ and ‘variable’ remuneration, which appear quite all-encompassing. The fact that definitions appear in the text at all suggest that MEPs are reluctant to leave definition of these terms to subsequent EBA deliberations.
This leaves open the possibility that, unless specific transitional rules apply, the pay ratio could apply as early as 1 January 2013.
Due to the short time frame and potential impact of this cap, firms now appear to be planning for its introduction, including the scenario of a 1:1 cap applying to total variable pay, as early as 1 January 2013. The final regulations may be less onerous than the current proposals, but the actions of the regulators indicate the vigour with which they are pursuing these reforms. If these reforms gain traction within the European context, we would expect to see some of these changes being implemented within the South African environment, most likely through updates to King III. As such, the actual pay mix levels as indicated earlier in the report may become a thing of the past, and the mix between short-term and long-term incentives will become a critical decision point.
Financial services pay models in the UK have changed profoundly since the financial crisis as a result of European Union (EU) and domestic regulation, but the story is far from over. It’s likely that all financial services firms will face increased challenges as further regulations impacting remuneration arrangements are introduced over the next few years. The relevance of both the UK market and the financial services industry group is that both play a leading role in shaping executive remuneration trends globally.
Following the financial crisis, the Financial Stability Board (FSB) and a number of national regulators conducted reviews into the governance and structure of remuneration arrangements within the financial services sector. The main conclusions drawn from these reviews were that:
• Firms (and regulators) had failed to appreciate the extent to which remuneration policies and practices could encourage excessive risk taking.
• The structure of remuneration specifically could encourage excessive risk taking by focusing on cash-based, STIs.
Executive directors’ remuneration – Practices and trends report 13
STI payment levels
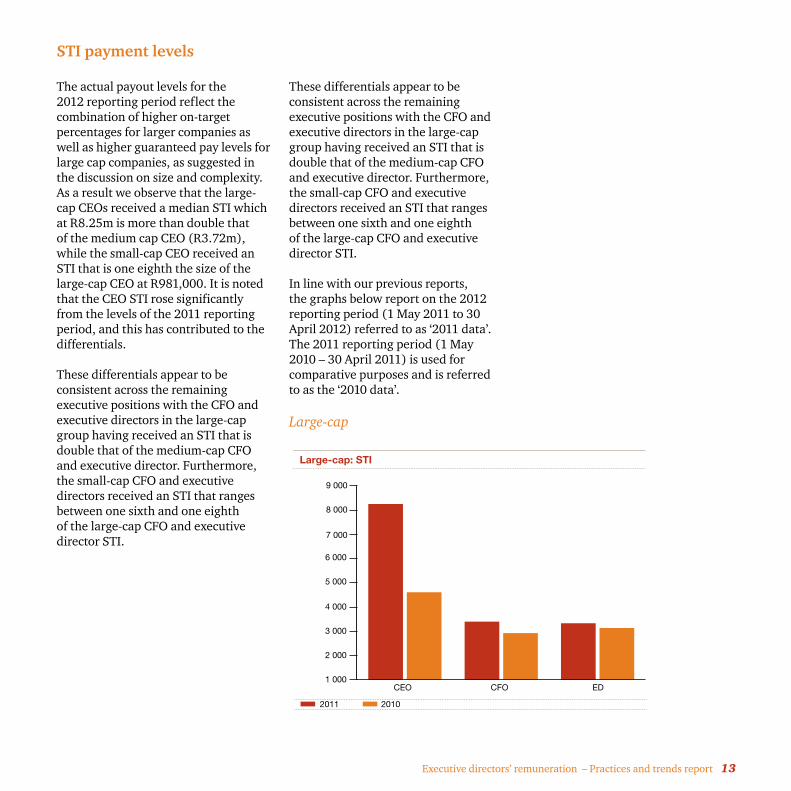
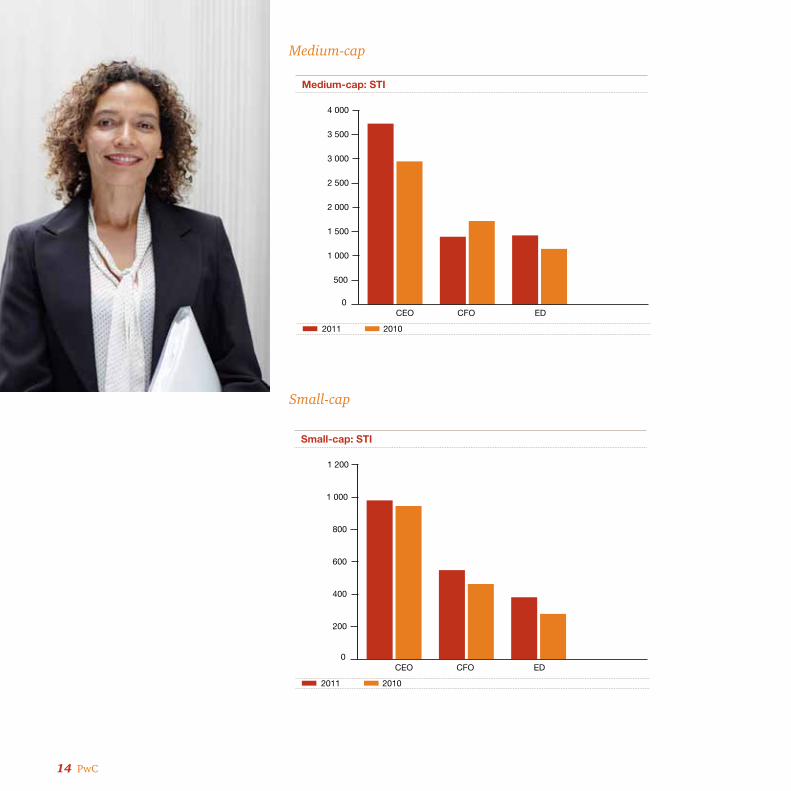
The actual payout levels for the 2012 reporting period reflect the combination of higher on-target percentages for larger companies as well as higher guaranteed pay levels for large cap companies, as suggested in the discussion on size and complexity. As a result we observe that the large-cap CEOs received a median STI which at R8.25m is more than double that of the medium cap CEO (R3.72m), while the small-cap CEO received an STI that is one eighth the size of the large-cap CEO at R981,000. It is noted that the CEO STI rose significantly from the levels of the 2011 reporting period, and this has contributed to the differentials.
These differentials appear to be consistent across the remaining executive positions with the CFO and executive directors in the large-cap group having received an STI that is double that of the medium-cap CFO and executive director. Furthermore, the small-cap CFO and executive directors received an STI that ranges between one sixth and one eighth of the large-cap CFO and executive director STI.
These differentials appear to be consistent across the remaining executive positions with the CFO and executive directors in the large-cap group having received an STI that is double that of the medium-cap CFO and executive director. Furthermore, the small-cap CFO and executive directors received an STI that ranges between one sixth and one eighth of the large-cap CFO and executive director STI.
In line with our previous reports, the graphs below report on the 2012 reporting period (1 May 2011 to 30 April 2012) referred to as ‘2011 data’. The 2011 reporting period (1 May 2010 – 30 April 2011) is used for comparative purposes and is referred to as the ‘2010 data’.
Large-cap
1 000
2 000
3 000
4 000
5 000
6 000
7 000
8 000
9 000
CEO CFO ED
2011 2010
Large-cap: STI
14 PwC
Medium-cap
0
500
1 000
1 500
2 000
2 500
3 000
3 500
4 000
CEO CFO ED
2011 2010
Medium-cap: STI
Small-cap
0
200
400
600
800
1 000
1 200
CEO CFO ED
2011 2010
Small-cap: STI
Executive directors’ remuneration – Practices and trends report 15
Long-term Incentives (LTIs)
Challenges
With executive remuneration continuing to be in the spotlight, LTI plans are not excluded from public scrutiny.
One of the main challenges faced by companies is the setting of performance conditions and ensuring the LTI addresses retention. We have seen the following as key LTI challenges pertaining to performance conditions and potential solutions in the market:
Challenge Potential solutions
Setting of three-year financial targets • Using a more balanced scorecard which includes strategic, operational and financial performance conditions.
• A greater focus on annual performance periods, whereby the line of sight over the short-term is clearer and targets can be set with more ease. In addition, elements of deferral in shares and risk adjustment are incorporated in these arrangements.
• The use of restricted shares (i.e. no performance conditions attached) based on strategic key performance indicators achieved with a vesting period of up to five years.
At least two main performance conditions: Earnings per Share (EPS) and Total Shareholder Return (TSR)
EPS and TSR have not only found its way into a number of UK companies’ share plans, but also many South African companies. These measures are in line with historic market practice, but often are not aligned to company strategy. Both these measures may be valuable if incorporated as part of a range of key performance indicators as opposed to being used on their own. This will provide a more holistic and sustainable approach to shareholder value creation over the longer term.
A recent PwC UK publication5 confirmed the challenges above and highlighted certain external factors which should be taken into account for the retail industry; such as views of institutional shareholders, increased governance and risk adjustment, and a general trend to de-leverage incentive plans to decrease risk.
5 Motivating and retaining executives in difficult times: Executive remuneration trends in the retail sector www.pwc.co.uk/hrs – February 2012

16 PwC
In South Africa, trends around LTI plans continue to revolve around addressing retention risks with shareholder activism and the impact of the Companies Act 71 of 2008 (the Act) becoming more and more prevalent.
Retention risksScarce skills and retention risks continue to be a concern for remuneration committees and executives alike. Many companies prefer to address these risks through their share-based LTI plans by:
• implementing specific plans aimed at making ad-hoc awards without any performance conditions, as and when the need to address retention arises, and/or
• introducing a retention element to their normal annual allocations in addition to the performance element.
Whereas ad-hoc retention awards remain preferable and more acceptable to shareholders, there may be merit in making smaller annual retention awards as opposed to a big ad-hoc awards which might pose a retention risk if the award vests. From an executive’s perspective, the psychological effect of having certainty that at least a portion of the regular share awards will vest if they stay with the company should not be discounted.
It may have a significant impact on the positive morale of the workforce where share awards are not viewed favourably or are even disregarded due to awards being underwater as a result of various factors, including the economic downturn, performance condition targets being set incorrectly etc. We have seen opposing views from institutional investors in this regard where some are opposed to the making of a combination of LTI awards with and without performance conditions on an annual basis, whilst others were generally comfortable with this approach. Making these types of ‘combination’ awards also opens up the debate of whether all employees or only specific categories of employees should receive combination awards and whether the quantum of annual retention awards should make up a portion of the regular annual award levels or should rather be calculated on top of the performance-based awards.
Shareholder activismWe have seen more shareholder activism in general around LTIs, but especially where new plans are introduced by companies. Gone are the days where companies could introduce a share plan with only a brief consultation process with shareholders. Lobbying shareholders, from as early as the design process of the LTI plan, is becoming more ubiquitous. We are seeing that shareholders, especially institutional
investors, want more and more input in the design and parameters of share plans. The following matters were raised in our recent dealings with institutional investors:
• In the past, a limit of around 10% of issued share capital to be awarded under a company’s share plan was widely accepted by shareholders. Such limits are now being considered excessive and many companies had to lower these limits or face shareholders not approving new plans.
• Shareholders want to know what performance conditions and vesting periods will be applied to a new share plan. Some investors go one step further and are very specific as to the nature of the performance condition they wish to see and we are noting that a return on invested capital related condition is widely favoured amongst institutional investors. In the past, these types of detail were largely left to the remuneration committee to determine, and rightly so, as business circumstances and the appropriateness of certain type of performance conditions may change.
• Longer vesting periods – typically between three and five years.
Executive directors’ remuneration – Practices and trends report 17
Institutional investors appear to favour the market purchase of shares as opposed to the issuance of shares to settle LTI awards. This does not come as a surprise as this approach will cause no dilution to shareholders and has been the preferential settlement method for a number of years.
Shareholders deserve the right to have a say in executive remuneration and specifically LTI plans. In our dealings with institutional investors, we have seen that in certain instances, valid suggestions were made which were implemented by companies. However, there may be a sentiment that these shareholders are trying to exert too much control over these matters and may be perceived as an attempt to take over the role of the remuneration committee which is, after all, the representative of shareholders.
Companies ActThe requirements of the Act are discussed in more detail later in this report.
The Act has a significant impact on share plans and we have seen varying interpretations by companies in this regard. In the past, companies could easily avoid taking share plans to shareholders for resolution by purchasing shares in the market in settlement of the plan awards. This would also scope the plan out of the ambit of Schedule 14 of the JSE Listings Requirements. However, we have seen the majority of companies
opting to take the more conservative approach in interpreting the provisions in the Act dealing with employee share plans and therefore seek the necessary approvals from shareholders in terms of the Act, irrespective of the settlement method adopted.
Share ownershipThe PwC UK executive reward survey6 (the PwC UK Reward Survey) posed the question whether it is time to move away from the approach of linking pay to long-term performance and instead adopt an approach of a total competitive package which is not linked to company performance but simply requires a significant proportion of the package to be held in shares over the longer term. In the UK, the majority of listed companies have share ownership guidelines in place. This survey showed the median level of share ownership for CEOs at 200% of base salary.
In South Africa it appears that companies are dispersed among having similar guidelines and not having such guidelines at all. In the past few months we have seen large listed companies introducing such requirements and it remains to be seen whether more companies will adopt similar requirements or increase its shareholding requirements in a response to shareholder activism.
6 Getting the balance of executive pay right: PwC executive reward survey – January 2012
Analysis of LTI plansThe analysis shown below is based on the large-cap JSE listed companies, unless otherwise stated.
Prevalence of instruments
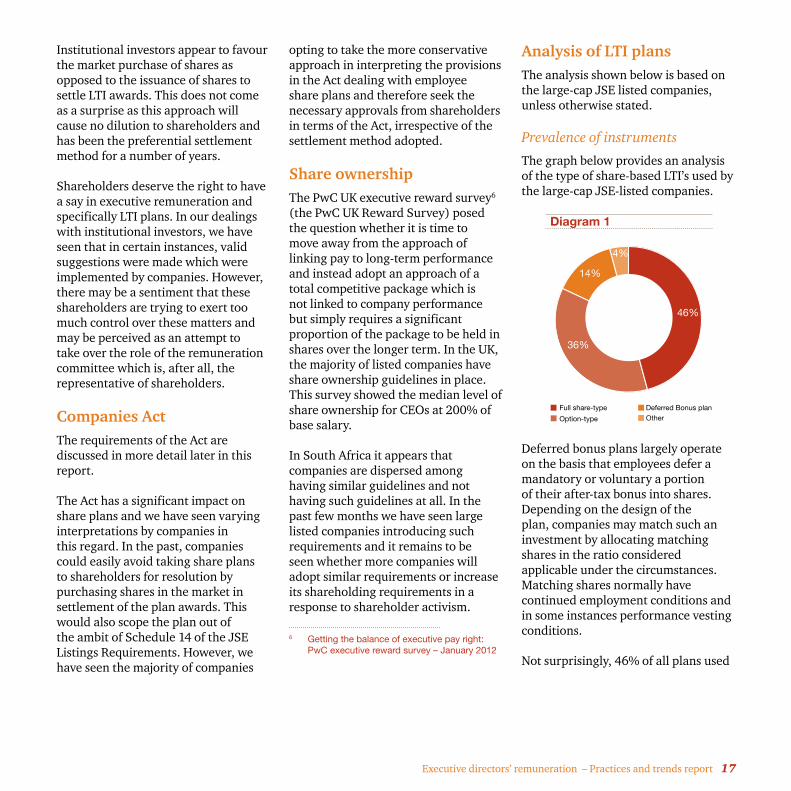
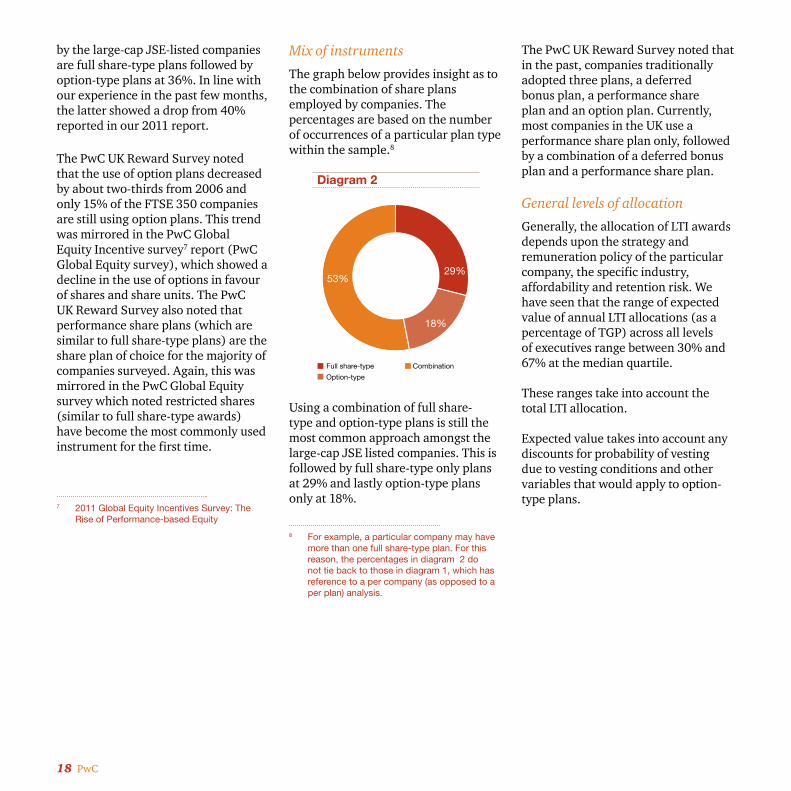
The graph below provides an analysis of the type of share-based LTI’s used by the large-cap JSE-listed companies.
Deferred bonus plans largely operate on the basis that employees defer a mandatory or voluntary a portion of their after-tax bonus into shares. Depending on the design of the plan, companies may match such an investment by allocating matching shares in the ratio considered applicable under the circumstances. Matching shares normally have continued employment conditions and in some instances performance vesting conditions.
Not surprisingly, 46% of all plans used
36%
4%
46%
Full share-type
Option-type
Deferred Bonus planOther
Diagram 1
14%
18 PwC
by the large-cap JSE-listed companies are full share-type plans followed by option-type plans at 36%. In line with our experience in the past few months, the latter showed a drop from 40% reported in our 2011 report.
The PwC UK Reward Survey noted that the use of option plans decreased by about two-thirds from 2006 and only 15% of the FTSE 350 companies are still using option plans. This trend was mirrored in the PwC Global Equity Incentive survey7 report (PwC Global Equity survey), which showed a decline in the use of options in favour of shares and share units. The PwC UK Reward Survey also noted that performance share plans (which are similar to full share-type plans) are the share plan of choice for the majority of companies surveyed. Again, this was mirrored in the PwC Global Equity survey which noted restricted shares (similar to full share-type awards) have become the most commonly used instrument for the first time.
7 2011 Global Equity Incentives Survey: The Rise of Performance-based Equity
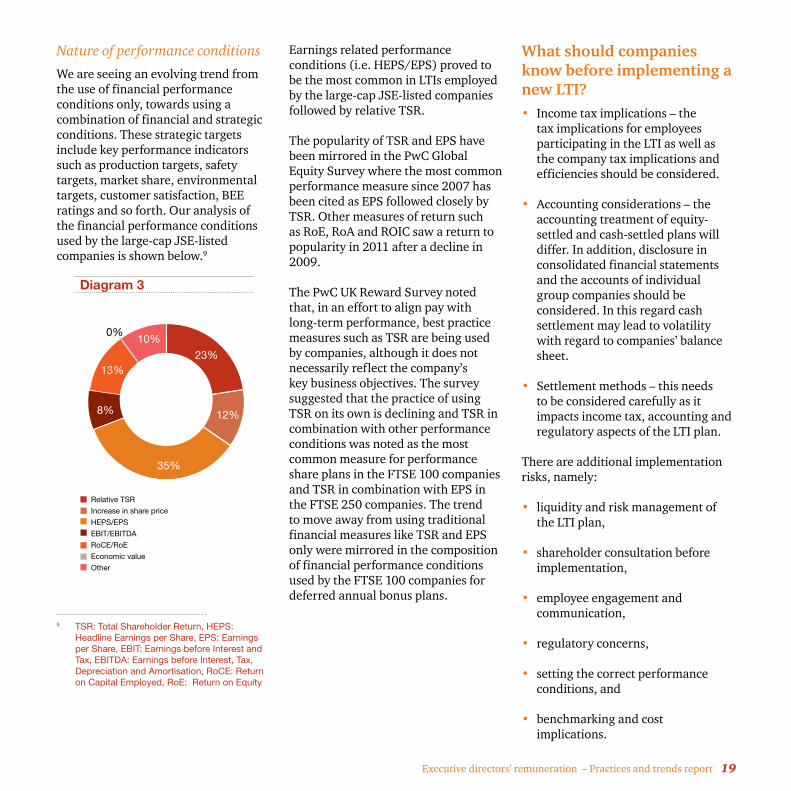
Mix of instruments
The graph below provides insight as to the combination of share plans employed by companies. The percentages are based on the number of occurrences of a particular plan type within the sample.8
Using a combination of full share-type and option-type plans is still the most common approach amongst the large-cap JSE listed companies. This is followed by full share-type only plans at 29% and lastly option-type plans only at 18%.
8 For example, a particular company may have more than one full share-type plan. For this reason, the percentages in diagram 2 do not tie back to those in diagram 1, which has reference to a per company (as opposed to a per plan) analysis.
18%
29%
Full share-type
Option-type
Combination
Diagram 2
53%
The PwC UK Reward Survey noted that in the past, companies traditionally adopted three plans, a deferred bonus plan, a performance share plan and an option plan. Currently, most companies in the UK use a performance share plan only, followed by a combination of a deferred bonus plan and a performance share plan.
General levels of allocation
Generally, the allocation of LTI awards depends upon the strategy and remuneration policy of the particular company, the specific industry, affordability and retention risk. We have seen that the range of expected value of annual LTI allocations (as a percentage of TGP) across all levels of executives range between 30% and 67% at the median quartile.
These ranges take into account the total LTI allocation.
Expected value takes into account any discounts for probability of vesting due to vesting conditions and other variables that would apply to option-type plans.
Executive directors’ remuneration – Practices and trends report 19
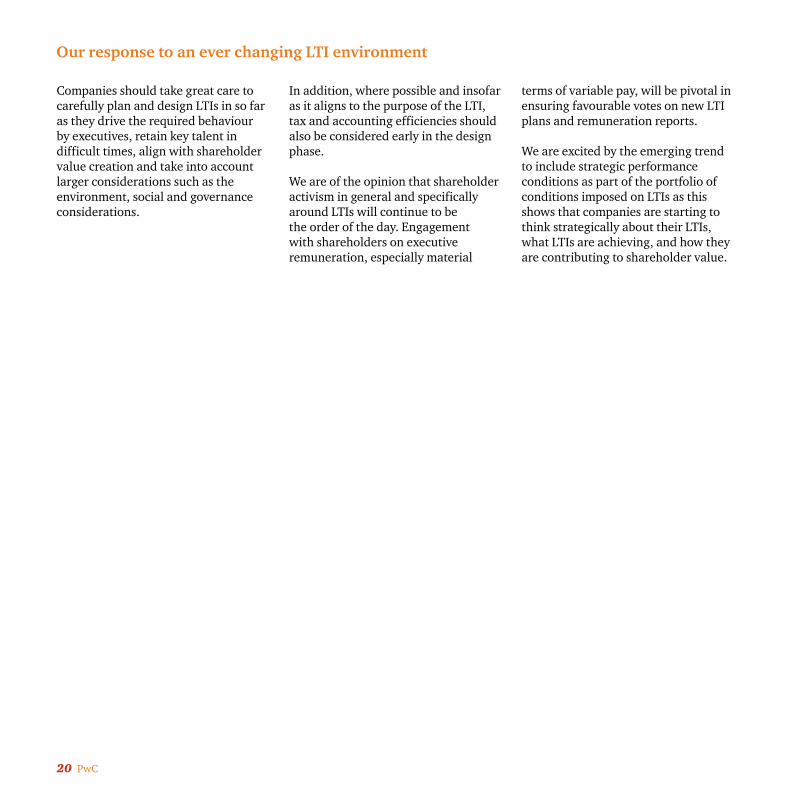
Nature of performance conditions
We are seeing an evolving trend from the use of financial performance conditions only, towards using a combination of financial and strategic conditions. These strategic targets include key performance indicators such as production targets, safety targets, market share, environmental targets, customer satisfaction, BEE ratings and so forth. Our analysis of the financial performance conditions used by the large-cap JSE-listed companies is shown below.9
9 TSR: Total Shareholder Return, HEPS: Headline Earnings per Share, EPS: Earnings per Share, EBIT: Earnings before Interest and Tax, EBITDA: Earnings before Interest, Tax, Depreciation and Amortisation, RoCE: Return on Capital Employed, RoE: Return on Equity
Relative TSR
Increase in share price
HEPS/EPS
EBIT/EBITDA
RoCE/RoE
Economic value
Other
Diagram 3
23%
12%
35%
8%
13%
10%0%
Earnings related performance conditions (i.e. HEPS/EPS) proved to be the most common in LTIs employed by the large-cap JSE-listed companies followed by relative TSR.
The popularity of TSR and EPS have been mirrored in the PwC Global Equity Survey where the most common performance measure since 2007 has been cited as EPS followed closely by TSR. Other measures of return such as RoE, RoA and ROIC saw a return to popularity in 2011 after a decline in 2009.
The PwC UK Reward Survey noted that, in an effort to align pay with long-term performance, best practice measures such as TSR are being used by companies, although it does not necessarily reflect the company’s key business objectives. The survey suggested that the practice of using TSR on its own is declining and TSR in combination with other performance conditions was noted as the most common measure for performance share plans in the FTSE 100 companies and TSR in combination with EPS in the FTSE 250 companies. The trend to move away from using traditional financial measures like TSR and EPS only were mirrored in the composition of financial performance conditions used by the FTSE 100 companies for deferred annual bonus plans.
What should companies know before implementing a new LTI?• Income tax implications – the
tax implications for employees participating in the LTI as well as the company tax implications and efficiencies should be considered.
• Accounting considerations – the accounting treatment of equity-settled and cash-settled plans will differ. In addition, disclosure in consolidated financial statements and the accounts of individual group companies should be considered. In this regard cash settlement may lead to volatility with regard to companies’ balance sheet.
• Settlement methods – this needs to be considered carefully as it impacts income tax, accounting and regulatory aspects of the LTI plan.
There are additional implementation risks, namely:
• liquidity and risk management of the LTI plan,
• shareholder consultation before implementation,
• employee engagement and communication,
• regulatory concerns,
• setting the correct performance conditions, and
• benchmarking and cost implications.
20 PwC
Our response to an ever changing LTI environment
Companies should take great care to carefully plan and design LTIs in so far as they drive the required behaviour by executives, retain key talent in difficult times, align with shareholder value creation and take into account larger considerations such as the environment, social and governance considerations.
In addition, where possible and insofar as it aligns to the purpose of the LTI, tax and accounting efficiencies should also be considered early in the design phase.
We are of the opinion that shareholder activism in general and specifically around LTIs will continue to be the order of the day. Engagement with shareholders on executive remuneration, especially material
terms of variable pay, will be pivotal in ensuring favourable votes on new LTI plans and remuneration reports.
We are excited by the emerging trend to include strategic performance conditions as part of the portfolio of conditions imposed on LTIs as this shows that companies are starting to think strategically about their LTIs, what LTIs are achieving, and how they are contributing to shareholder value.

Executive directors’ remuneration – Practices and trends report 21
Prescribed officers – what do we see?
Introduction
Companies have grappled with the following question – which individuals should be included under the realm of prescribed officers as prescribed by the Act?
This is as the definition of this special class of employee is a typical catch-all provision, drafted widely to include all individuals involved in any material aspect of the company or any part thereof. Quite simply, this can be any person that has general executive authority over the company, or a significant portion thereof, concerning the financial affairs, legal requirements or day-to-day operational responsibility.
King III was also recently amended to provide that the remuneration of prescribed officers, and no longer the top three earning employees who are not executive directors, should be disclosed on an individual basis.
Approach followed
The question of which individuals are prescribed officers with the implication that their total remuneration inclusive of fixed pay, bonuses, ad-hoc payments and long-term share-based gains should be disclosed as is the case with board directors, is purely a factual question.
In the broader sense, any employee can be defined as a prescribed officer. This is regardless of the designated title or office held. The Act seems to indicate that a prescribed officer carries similar if not the identical duties and responsibilities as that of a director in a majority of the instances. This is as employees could have immense authority or ability to influence the management or direction of a company, without being designated as a director.
Besides the disclosure element anyone who is appointed to a position or office construed to be a prescribed officer should understand the implications and potential consequences, as well as personal liability of accepting such a position or office. Accountability must be applied to such a person, towards the company and its shareholders. The Act sets a high standard of integrity, which encourages prescribed officers, as with directors, to act honestly and to bear the responsibility of their actions.
22 PwC
Market information
The current 2012 reporting period was the first year for disclosure of prescribed officers’ remuneration information.
Having said that, the Act came into effect on 1 May 2011 and therefore, limited listed companies have identified their prescribed officers in their published annual reports. From our review we noticed that companies that have financial year ends beyond June 2011 have complied with this disclosure requirement. In the financial services industry, it seems like the requirement was embraced at large. Based on our research, companies have predominantly disclosed prescribed officers’ remuneration on an individual basis as opposed to disclosure based on an average.
We have also found that there is commitment by companies to make the reporting transparent with regard to prescribed officers as companies have constituted sub-committees to review designations in light of this requirement and to educate directors and officers pertaining to the Act and other governance requirements.
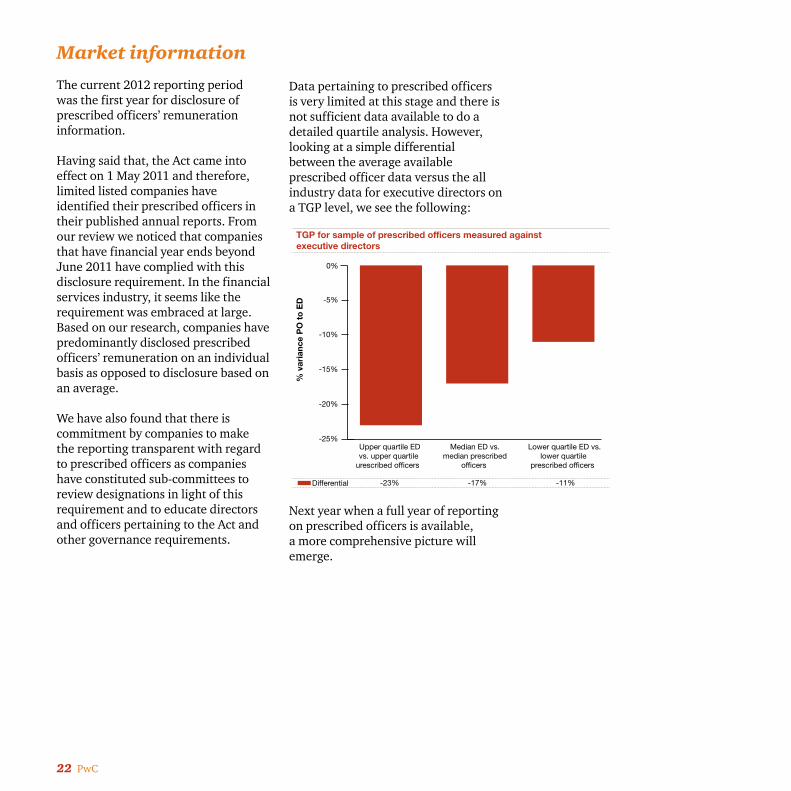
Data pertaining to prescribed officers is very limited at this stage and there is not sufficient data available to do a detailed quartile analysis. However, looking at a simple differential between the average available prescribed officer data versus the all industry data for executive directors on a TGP level, we see the following:
Next year when a full year of reporting on prescribed officers is available, a more comprehensive picture will emerge.
-25%
-20%
-15%
-10%
-5%
0%
Lower quartile ED vs.lower quartile
prescribed officers
Median ED vs. median prescribed
officers
Upper quartile EDvs. upper quartile
urescribed officers
% v
aria
nce
PO
to
ED
Differential -23% -17% -11%
TGP for sample of prescribed officers measured againstexecutive directors
Executive directors’ remuneration – Practices and trends report 23
Local and global view
With the Act becoming effective in May 2011, the 2012 reporting period proved to be the year during which the ambiguous provisions contained therein challenged companies from a practical perspective.
There were also some changes to King III, mostly to accommodate the prescribed officers’ disclosure requirement introduced in the Act.
Governance codes such as the Code for Responsible Investing in South Africa (CRISA) saw the light in late 2011, with its effective date of reporting being 1 February 2012. This code is particularly relevant for institutional investors. In addition, Business Leadership South Africa (BLSA) announced that it would be releasing a code on remuneration and labour practices for its members.
Globally, the UK has continued to consult on further pay governance reforms with eminent legislation on pay in the pipeline. The US has not had any further legislative reforms since the Dodd-Frank Bill; however, shareholders are becoming more vocal in this country as far as it pertains to non-binding votes on remuneration.
Until recently, the European Union Commission’s (EU Commission) green paper on corporate governance was the latest regulatory guidelines issued by this body insofar remuneration and other governance aspects. However, on 16 May 2012 the EU’s top executive official, Michel Barnier, announced that he has a plan which could pave the way for a pan-EU law next year that would give investors legal clout to take on Europe’s top executives over pay.
In his statement Barnier hinted at mandatory shareholder vote on remuneration as well as a vote by shareholders on the two key ratios of remuneration, the ratio between the lowest and the highest paid in the company and the ratio between the fixed and variable parts of remuneration. Publication of pay packages for the top 20 to 30 executives of the biggest EU banks was also mentioned.
Prior to proposing and writing the first draft of EU laws regulating pay, support will have to be gained from the EU Commission, the EU’s executive authority; this includes the support of all 27 member countries as well as the European parliament.
A governance storm or light drizzle?
24 PwC
In Australia, after extensive consultation and recommendations by the Corporations and Markets Advisory Committee, amendments to the Australian Corporations Act 2001 is proposed relating to:
• disclosure of steps to shareholders of how bonuses were clawed back, non-compliance resulting in shareholders being able to strike down the remuneration report. In terms of the two-strike rule, the board can be asked to step down if more than 25% no votes are obtained at two consecutive shareholder meetings,
• more transparent disclosure of termination payments and ‘golden handshakes’, and
• relieving certain unlisted entities from the obligation of preparing a remuneration report and therefore reducing the regulatory burden on companies.
South Africa
Purpose and requirements of the Companies Act
The Act deals with various corporate aspects, but noteworthy for remuneration are the provisions relating to company administration, issue of shares and share dealings by directors and prescribed officers.
The purpose of the Act is to promote competitiveness and development of the South African economy. To achieve these objectives, focus has amongst other been placed on:
• promoting the efficiency of companies and their management,
• encouraging transparency and high standards of corporate governance, and
• making company law compatible and harmonious with best practice jurisdictions internationally.
As a result, a significant number of the provisions of the Act may have a direct impact on the administration of remuneration and especially LTIs.
In terms of the Act, companies are required to set in motion considerable changes. Most of these impact the duties of executive directors charged with the fiduciary responsibility which rests more heavily on them as the Act gains traction. Companies are required to:
• change the company name to reflect new rules on name endings,
• approve and adopt a new Memorandum of Incorporation,
• carefully consider the role of shareholders’ agreements,
• review and amend all notices to shareholders and other documents to ensure that these are in the prescribed form and/or language,
• endorse share certificates in terms of the Act where the transfer of shares is restricted,
• optional conversion of par value shares to shares having no par value,
• directors to ensure that companies limited by guarantee must elect to become a profit company and make the necessary consequential changes or become a non-profit company,
Executive directors’ remuneration – Practices and trends report 25
• clearly identify prescribed officers as required in the Act,
• check that all directors, prescribed officers, committee members, company secretaries and auditors are eligible and not disqualified as defined in the Act,
• review whether adequate indemnity and/or insurance has been provided for directors and prescribed officers,
• educate directors, prescribed officers and other relevant staff as to their responsibilities so that there is no misunderstanding as to their future responsibilities,
• institute audit committee and social and ethics committees with correct membership,
• re-examine the extent of the company’s responsibility to have its financial statements audited correctly and examine future disclosure requirements,
• directors are required to strictly comply with the Act, especially with the provisions dealing with:
• the duties, conduct and liabilities of directors,
• rights of shareholders to receive notices and have access to information,
• meetings of shareholders and directors, and the adoption of resolutions,
• approvals required for any distributions, financial assistance (as well as intra-group loans), insider share issues and options, and
• any fundamental transactions, mergers and acquisitions or offers of take-over (except to the extent that the transitional arrangements may delay its effect).
• Listed companies should comply with the amended JSE Listings Requirements.
These conditions are clear requirements for the directors to implement.
How does the Companies Act impact on executive remuneration?
The Act, as was the case with its predecessor, requires disclosure of directors’ total remuneration on an individual level. As well as the disclosure of prescribed officers’ total remuneration, dealt with earlier in this report.
The requirement to obtain shareholders vote on remuneration to directors, for their services as directors, has generally been interpreted by companies as a shareholders vote on non-executive directors’ fees only.
From our experience of the market and based on disclosure, the only shareholders votes passed relating to executive directors’ pay has pertained to LTI and share-based allocations.
The provisions of the Act which may be of relevance for LTI’s include:
• shareholder approval for the issue of shares,
• the provisions relating to the granting of financial assistance, and
• the definition of employee share schemes and the standards for qualifying as such.
The issue of shares to certain categories of individuals, including directors and prescribed officers, may require approval by a special resolution of the shareholders of a company.
Approval by means of a special resolution may also be required for the provision of financial assistance for the issue or purchase of shares in the company or the provision of loans or other financial assistance to directors or prescribed officers in general. In addition, the solvency and liquidity test will have to be satisfied and the terms under which the financial assistance will be provided should be fair and reasonable.
However, an exemption may be available from compliance with the special resolution requirements to the extent that the issue of shares or provision of financial assistance is made pursuant to a qualifying employee share scheme.
26 PwC
An employee share scheme is defined as a scheme established by a company for the purpose of offering participation therein solely to employees, officers and other persons closely involved in the business of the company or a subsidiary of the company, either by means of the issue of shares in the company or by the grant of options for shares in the company.
Further requirements to be satisfied include the appointment of a compliance officer and adequate disclosure to both participating employees and shareholders.
Due to the restrictive definition of employee share schemes, limited to option schemes and the issue of shares, a significant amount of uncertainty has been created as to the extent to which these exemptions will be available in terms of a typical LTI. As a result of the number of differing interpretations on this subject, clarity should be obtained before any grants are made in terms of an LTI plan.
King III
The non-binding advisory vote by shareholders on companies’ remuneration policies can be said to have become embedded practice at shareholders’ meetings. Despite companies having accepted this as market practice, quite a few companies were unpleasantly surprised to find that shareholders do not merely consider this vote as a ‘rubber stamp’ and during 2012 some top companies’ remuneration reports received ‘against’ votes from shareholders.
The requirement to disclose the remuneration of the three most highly-paid employees was removed and replaced with a requirement to disclose the remuneration of persons falling within the definition of prescribed officers per the Act. This amendment is welcomed and provides clarity and alignment on this aspect between King III and the Act.
Code for Responsible Investing in South Africa (CRISA) and Business Leaders South Africa (BLSA)
CRISA sets out the governance duties of institutional investors in relation to the overall governance system including engagement with parties on environmental, social and governance issues when making investment decisions.
The large institutional investors all participated in the development of this code, which comprise five main principles:
• incorporation of sustainability considerations into investment analysis as part of delivery of risk-adjusted returns to beneficiaries,
• acceptance of ownership responsibilities in investment activities,
• collaborate to promote acceptance of CRISA principles and other codes and standards applicable to institutional investors,
• recognition of circumstances and relationships which hold potential for conflicts of interest and manage these, and
• transparency about the content of their policies, how the policies are implemented and how CRISA is applied to enable stakeholders to make informed assessments.
Some institutional investors have publicly disclosed how they vote at shareholders’ meetings and in our non-mandatory environment relating to remuneration governance, the ultimate beneficiaries could require institutional investors to be more transparent about the manner in which they carried out their fiduciary duties.
Recent media reports have hinted at the power the Government Employees’ Pension Fund (managed by the Public Investment Corporation), has as the largest institutional investor, to regulate excessive executive remuneration, by way of its institutional investor vote.
In addition, the BLSA has also announced that it will be releasing a code on remuneration and labour practices in South Africa applicable to its members.
International trends
Introduction
We have already made mention of developments in Europe, Australia and have briefly mentioned UK reform proposals. However, as South African remuneration governance follows that of the UK relatively closely, we have expanded on the type of remuneration reforms making headlines in the UK.
Executive directors’ remuneration – Practices and trends report 27
Changes to shareholder voting rights
In March 2012 the Department for Business, Innovation and Skills (BIS) issued a consultation document containing its proposed changes to shareholder voting rights.
The main proposals are:
• Anannualbindingvoteoncompany’sfutureremunerationpolicies
Such a proposed binding vote will require a separate section of the remuneration report covering the forward-looking policy. The following information is likely to be contained in this forward looking report:
• composition and potential pay levels for each director,
• how proposed pay structures reflect and support company strategy and key performance indicators,
• what the performance criteria are and how performance will be assessed,
• total reward for each director under different performance scenarios,
• how and why the company has used benchmarks and other comparison data to inform pay levels and structures,
• how employee pay (ratio between broad based employee remuneration and executive remuneration) and employee views have been taken into account, and
• how shareholders’ views have been sought and taken into account, including the results from the previous year’s votes on remuneration.
• Anincreasedlevelofrequiredsupportforthebindingvote
A simple majority is currently the requirement; UK government is however considering a higher level of support from shareholders as it believes that this will encourage companies to improve their engagement with shareholders on pay. A requirement of between 50% and 75% is being investigated. In practice, the fact that the vote will probably be binding may deliver the increased level of engagement desired.
• Anadvisoryvoteontheimplementationofremunerationpolicy
It is proposed that an advisory vote be retained for the historic part of the remuneration report to allow shareholders to signal whether they are happy with how the previously agreed remuneration policy has been implemented and on how the remuneration committee has exercised its discretion. It is anticipated that the level of support for the advisory vote to avoid sanctions will be increased to a 75% majority.
Sanctions for failing to achieve 75% on the advisory vote include a statement to the market (within 30 days) setting out:
• the number and proportion of shareholders voting for, against and abstaining,
• the main issues shareholders have raised (which affected the voting outcome), and
• how the company proposes to work with shareholders to address these issues.
• Abindingvoteonterminationpaymentsofmorethanoneyear’ssalary
Proposals were made to amend the UK Companies Act to provide shareholders (of UK-listed companies) with a binding vote on any termination payment that exceeds (in value) the equivalent of one year’s salary.
In determining the amount of the potential termination payment, all benefits and incentives that vested or continued to vest at cession or thereafter would be included. Clearly this proposal could impact the existing terms of directors’ service contracts and these would need to be amended when the new legislation comes into force (expected around October 2013).
Consultation closed at the end of April 2012 and the BIS published a summary of the feedback received. It is expected that UK government will announce final proposals shortly, to enable legislation to be passed in the next parliamentary session.

28 PwC
Conclusion
Although, the current developments in South Africa indicate that remuneration governance will remain non-mandatory, apart from the specific requirements of the Act, it will be interesting to see how the economic climate, public pressure and the political environment impact this. It could mean that South Africa may move to a more legislated environment, similar to the sentiments expressed in the UK and the early proposals by representatives of the EU and Australian government.

Executive directors’ remuneration – Practices and trends report 29
Introduction
In our 15th annual Global CEO survey10, the issue of leadership talent was highlighted as one of the most pressing global challenges in the current environment. At first consideration this would seem to be an unlikely situation. There have never been as many educated people in the world, nor has it ever been as simple for employers to tap this vast pool online.
It is presumed that highly skilled talent is also highly mobile and that networking advances also mean that many more tasks can be handled remotely or can be outsourced easily. However, the reality is quite different. The ever-increasing complexity of the work environment and technology enhancements appear to be driving the talent crunch.
As a result, managing skills shortages is one of the main priorities keeping CEOs awake at night. Our research indicates that 66% of CEOs would like
10 PwC Global CEO survey 2012 – Delivering results: Value and growth in a volatile world
to be spending more time developing the leadership and talent pipeline, outweighing other priorities including:
• improving organisational efficiency,
• developing strategy and managing risk, meeting with regulators and policy makers, and
• meeting with providers of capital.
Therefore, as development of leadership is a top priority for CEOs, pay levels of suitable qualified and experienced executives will be shaped accordingly.
Before considering the remuneration paid to executive directors of JSE-listed companies, we consider the profile of this leadership talent that CEOs seek to develop.
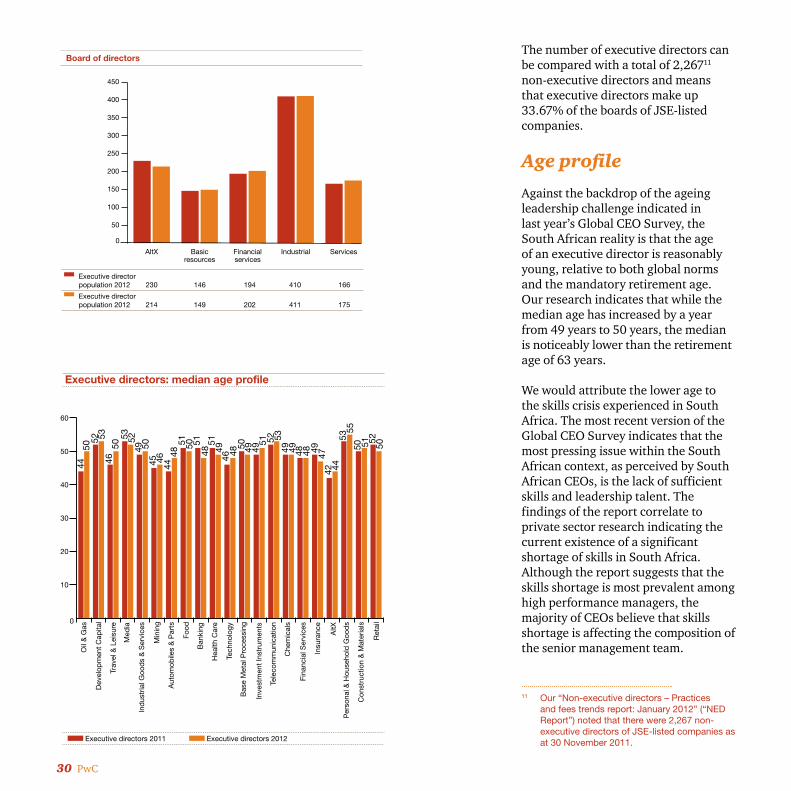
Number of executive directors
As at 30 April 2012, there were 1,151 executive directors of JSE-listed companies. This is an increase of five executive directors over the 2011 figure of 1,146. Interestingly, the number of executive directors increased in all of the industry groups, except in the AltX group of companies, where the number of executive directors declined by 7% over the most recent year. The most noticeable increase was a 5.4% increase in the services industry group, followed by a 4.1% increase in the financial services industry group.
The growth in the number of directors is in line with the findings of our Global CEO Survey. In the report, more than half of the CEOs surveyed indicated that they had increased headcount in the most recent year, and we expected this trend to filter through to the executive team.
The profile of an executive director
30 PwC
The number of executive directors can be compared with a total of 2,26711 non-executive directors and means that executive directors make up 33.67% of the boards of JSE-listed companies.
Age profile
Against the backdrop of the ageing leadership challenge indicated in last year’s Global CEO Survey, the South African reality is that the age of an executive director is reasonably young, relative to both global norms and the mandatory retirement age. Our research indicates that while the median age has increased by a year from 49 years to 50 years, the median is noticeably lower than the retirement age of 63 years.
We would attribute the lower age to the skills crisis experienced in South Africa. The most recent version of the Global CEO Survey indicates that the most pressing issue within the South African context, as perceived by South African CEOs, is the lack of sufficient skills and leadership talent. The findings of the report correlate to private sector research indicating the current existence of a significant shortage of skills in South Africa. Although the report suggests that the skills shortage is most prevalent among high performance managers, the majority of CEOs believe that skills shortage is affecting the composition of the senior management team.
11 Our “Non-executive directors – Practices and fees trends report: January 2012” (“NED Report”) noted that there were 2,267 non-executive directors of JSE-listed companies as at 30 November 2011.
0
50
100
150
200
250
300
350
400
450
ServicesIndustrialFinancialservices
Basicresources
AltX
Board of directors
Executive directorpopulation 2012 230 146 194 410 166
Executive directorpopulation 2012 214 149 202 411 175
0
10
20
30
40
50
60
Ret
ail
Con
stru
ctio
n &
Mat
eria
ls
Per
sona
l & H
ouse
hold
Goo
ds
AltX
Insu
ranc
e
Fina
ncia
l Ser
vice
s
Che
mic
als
Tele
com
mun
icat
ion
Inve
stm
ent
Inst
rum
ents
Bas
e M
etal
Pro
cess
ing
Tech
nolo
gy
Hea
lth C
are
Ban
king
Food
Aut
omob
iles
& P
arts
Ind
ustr
ial G
ood
s &
Ser
vice
s
Min
ing
Med
ia
Trav
el &
Lei
sure
Dev
elop
men
t C
apita
l
Oil
& G
as44
50
4646
51 51515151
4445
49
535346
52
4948 48 47484848 49 49
5252
494949 505050 50
525050
5355
53
42 44
Executive directors: median age profile
Executive directors 2011 Executive directors 2012
Executive directors’ remuneration – Practices and trends report 31
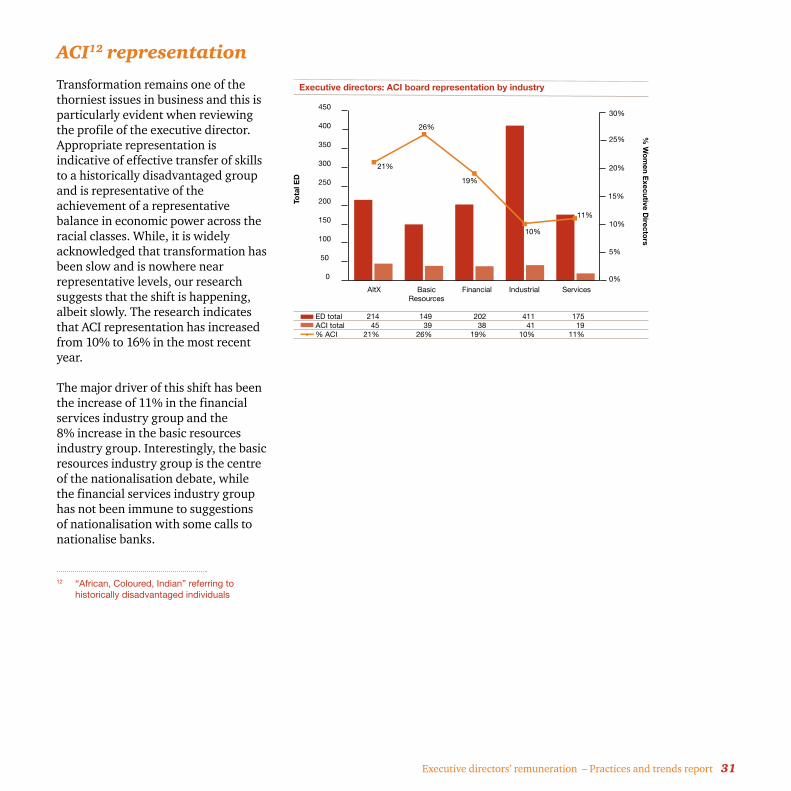
ACI12 representation
Transformation remains one of the thorniest issues in business and this is particularly evident when reviewing the profile of the executive director. Appropriate representation is indicative of effective transfer of skills to a historically disadvantaged group and is representative of the achievement of a representative balance in economic power across the racial classes. While, it is widely acknowledged that transformation has been slow and is nowhere near representative levels, our research suggests that the shift is happening, albeit slowly. The research indicates that ACI representation has increased from 10% to 16% in the most recent year.
The major driver of this shift has been the increase of 11% in the financial services industry group and the 8% increase in the basic resources industry group. Interestingly, the basic resources industry group is the centre of the nationalisation debate, while the financial services industry group has not been immune to suggestions of nationalisation with some calls to nationalise banks.
12 “African, Coloured, Indian” referring to historically disadvantaged individuals
0
50
100
150
200
250
300
350
400
450
ServicesIndustrialFinancialBasicResources
AltX0%
5%
10%
15%
20%
25%
30%
ED total 214 149 202 411 175ACI total 45 39 38 41 19% ACI 21% 26% 19% 10% 11%
21%
11%
19%
26%
Executive directors: ACI board representation by industry
10%
Tota
l ED
% W
om
en Executive D
irectors
32 PwC
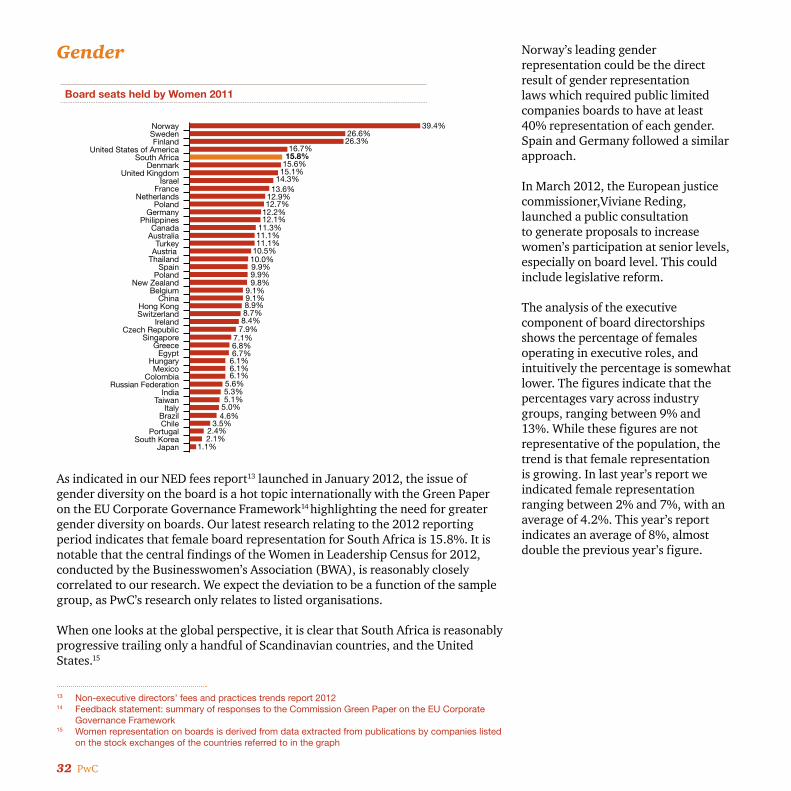
Gender
As indicated in our NED fees report13 launched in January 2012, the issue of gender diversity on the board is a hot topic internationally with the Green Paper on the EU Corporate Governance Framework14 highlighting the need for greater gender diversity on boards. Our latest research relating to the 2012 reporting period indicates that female board representation for South Africa is 15.8%. It is notable that the central findings of the Women in Leadership Census for 2012, conducted by the Businesswomen’s Association (BWA), is reasonably closely correlated to our research. We expect the deviation to be a function of the sample group, as PwC’s research only relates to listed organisations.
When one looks at the global perspective, it is clear that South Africa is reasonably progressive trailing only a handful of Scandinavian countries, and the United States.15
13 Non-executive directors’ fees and practices trends report 201214 Feedback statement: summary of responses to the Commission Green Paper on the EU Corporate
Governance Framework15 Women representation on boards is derived from data extracted from publications by companies listed
on the stock exchanges of the countries referred to in the graph
Board seats held by Women 2011
JapanSouth Korea
PortugalChileBrazil
ItalyTaiwan
IndiaRussian Federation
ColombiaMexico
HungaryEgypt
GreeceSingapore
Czech RepublicIreland
SwitzerlandHong Kong
ChinaBelgium
New ZealandPoland
SpainThailandAustria Turkey
AustraliaCanada
PhilippinesGermany
PolandNetherlands
FranceIsrael
United KingdomDenmark
South AfricaUnited States of America
FinlandSwedenNorway 39.4%
26.6%
12.7%12.9%13.6%
14.3%15.1%15.6%15.8%16.7%
26.3%
9.8%9.9%9.9%10.0%10.5%11.1%11.1%11.3%12.1%12.2%
9.1%
6.1%6.1%6.7%6.8%7.1%
7.9%8.4%8.7%8.9%9.1%
6.1%
1.1%2.1%2.4%
3.5%4.6%5.0%5.1%5.3%5.6%
Norway’s leading gender representation could be the direct result of gender representation laws which required public limited companies boards to have at least 40% representation of each gender. Spain and Germany followed a similar approach.
In March 2012, the European justice commissioner,Viviane Reding, launched a public consultation to generate proposals to increase women’s participation at senior levels, especially on board level. This could include legislative reform.
The analysis of the executive component of board directorships shows the percentage of females operating in executive roles, and intuitively the percentage is somewhat lower. The figures indicate that the percentages vary across industry groups, ranging between 9% and 13%. While these figures are not representative of the population, the trend is that female representation is growing. In last year’s report we indicated female representation ranging between 2% and 7%, with an average of 4.2%. This year’s report indicates an average of 8%, almost double the previous year’s figure.
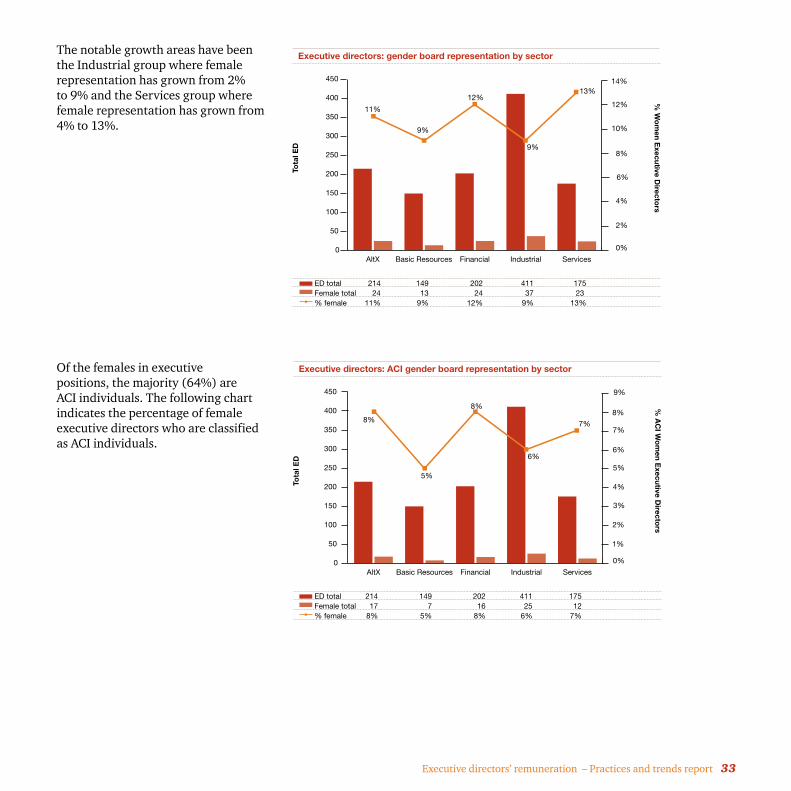
Executive directors’ remuneration – Practices and trends report 33
The notable growth areas have been the Industrial group where female representation has grown from 2% to 9% and the Services group where female representation has grown from 4% to 13%.
Of the females in executive positions, the majority (64%) are ACI individuals. The following chart indicates the percentage of female executive directors who are classified as ACI individuals.
0
50
100
150
200
250
300
350
400
450
ServicesIndustrialFinancialBasic ResourcesAltX
0%
2%
4%
6%
8%
10%
12%
14%
ED total 214 149 202 411 175Female total 24 13 24 37 23 % female 11% 9% 12% 9% 13%
11%
13%
9%
12%
9%
Executive directors: gender board representation by sector
Tota
l ED
% W
om
en Executive D
irectors
0
50
100
150
200
250
300
350
400
450
ServicesIndustrialFinancialBasic ResourcesAltX
0%
1%
2%
3%
4%
5%
6%
7%
8%
9%
ED total 214 149 202 411 175Female total 17 7 16 25 12% female 8% 5% 8% 6% 7%
8% 7%
6%
8%
5%
Executive directors: ACI gender board representation by sector
Tota
l ED
% A
CI W
om
en Executive D
irectors

34 PwC
Introduction
In response to feedback from our client base, the analysis in this year’s report has been refined to show greater detail and present more informative trends. In particular, we have provided a more comprehensive analysis based on the position held by executive directors. As such, we have now included the comparisons for the CEO, CFO and the Executive Director, as opposed to including all positions together.
The analysis has been done according to industry classifications across the Resources, Financial Services, Industrials and Services sectors. Within the industry analysis, companies have been separated into large, medium, and small cap companies.
In line with our previous reports, the graphs below report on the 2012 reporting period (1 May 2011 to 30 April 2012) referred to as ‘2011 data’. The 2011 reporting period (1 May 2010 – 30 April 2011) is used for comparative purposes and is referred to as the ‘2010 data’.
Executive directors’ remuneration – JSE trends
AnalysisBasic resourcesThe basic resources sector has experienced volatile trading conditions through 2011, with fluctuating exchange rates and commodity prices. The impact of higher commodity prices was seen through improved performance across the basic resources industry. The aggregated revenue from JSE listed mining houses with a revenue exceeding R200m increased by 36%, from R222bn to R303bn in 2011, resulting in net operating cash flows increasing by 49%. Despite this increase in earnings, the sector has disappointed in terms of an increase in market capitalisation, suggesting that the stability of global economic recovery and local cost pressures appear to be weighing on the sentiment of future expectations.
Interestingly, it appears as though the trends occurring at senior and executive level pay are mirroring the uncertainty of the industry. The most notable trend is that TGP for CFOs has declined across the large, medium, and small-cap groups. CEOs only experienced a decline in the small cap group, while executive directors experienced growth in TGP levels across the large, medium, and small cap groups.
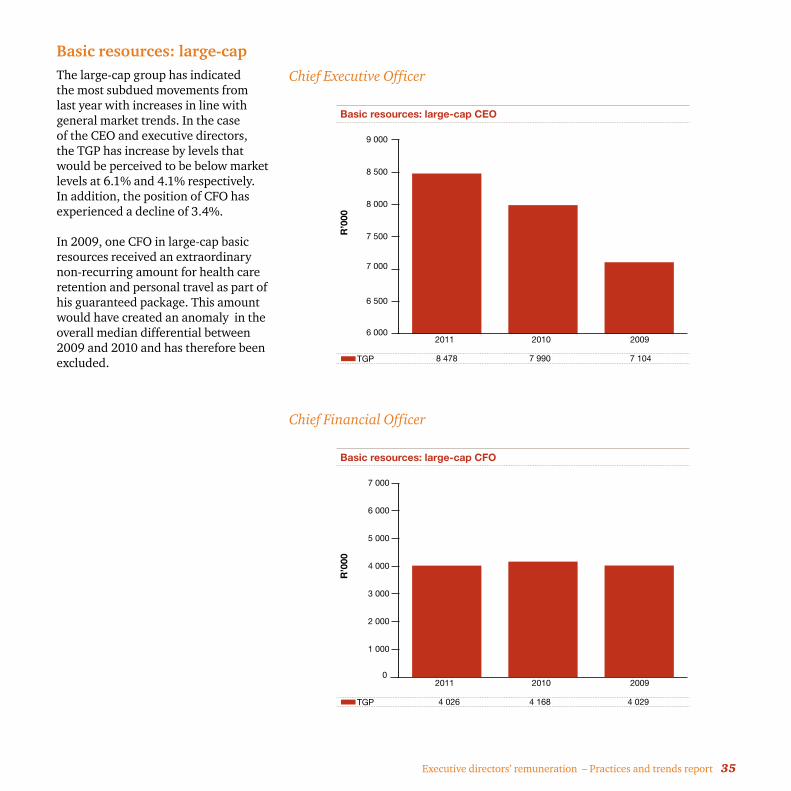
Executive directors’ remuneration – Practices and trends report 35
Basic resources: large-cap The large-cap group has indicated the most subdued movements from last year with increases in line with general market trends. In the case of the CEO and executive directors, the TGP has increase by levels that would be perceived to be below market levels at 6.1% and 4.1% respectively. In addition, the position of CFO has experienced a decline of 3.4%.
In 2009, one CFO in large-cap basic resources received an extraordinary non-recurring amount for health care retention and personal travel as part of his guaranteed package. This amount would have created an anomaly in the overall median differential between 2009 and 2010 and has therefore been excluded.
Chief Executive Officer
Chief Financial Officer
6 000
6 500
7 000
7 500
8 000
8 500
9 000
2011 2010 2009R
’000
TGP 8 478 7 990 7 104
Basic resources: large-cap CEO
0
1 000
2 000
3 000
4 000
5 000
6 000
7 000
2011 2010 2009
R’0
00
TGP 4 026 4 168 4 029
Basic resources: large-cap CFO
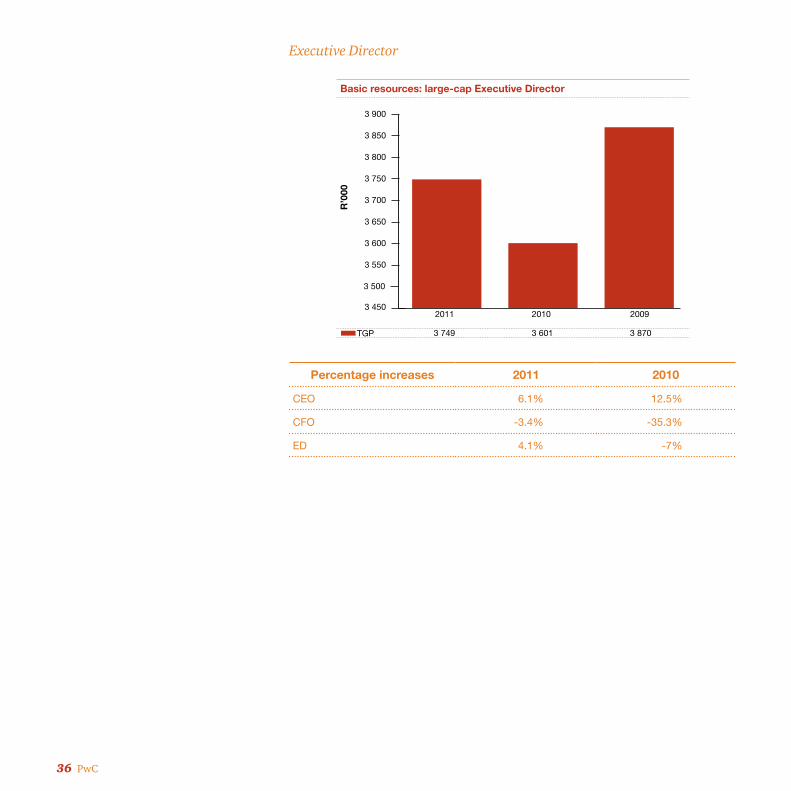
36 PwC
Executive Director
Percentage increases 2011 2010
CEO 6.1% 12.5%
CFO -3.4% -35.3%
ED 4.1% -7%
3 450
3 500
3 550
3 600
3 650
3 700
3 750
3 800
3 850
3 900
2011 2010 2009
R’0
00TGP 3 749 3 601 3 870
Basic resources: large-cap Executive Director
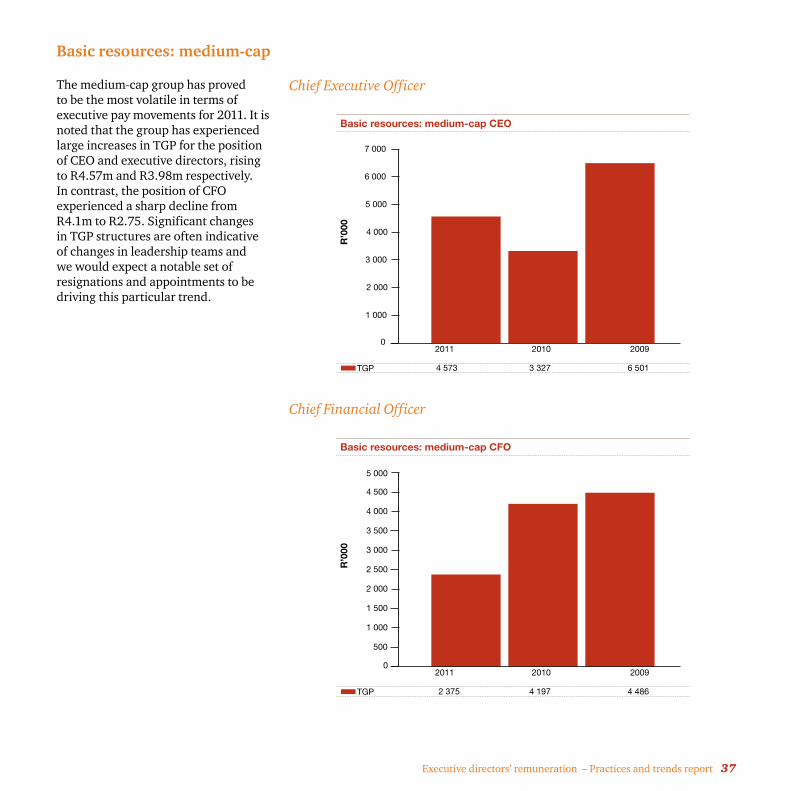
Executive directors’ remuneration – Practices and trends report 37
Basic resources: medium-cap
Chief Executive Officer
Chief Financial Officer
0
1 000
2 000
3 000
4 000
5 000
6 000
7 000
2011 2010 2009R
’000
TGP 4 573 3 327 6 501
Basic resources: medium-cap CEO
0
500
1 000
1 500
2 000
2 500
3 000
3 500
4 000
4 500
5 000
2011 2010 2009
R’0
00
TGP 2 375 4 197 4 486
Basic resources: medium-cap CFO
The medium-cap group has proved to be the most volatile in terms of executive pay movements for 2011. It is noted that the group has experienced large increases in TGP for the position of CEO and executive directors, rising to R4.57m and R3.98m respectively. In contrast, the position of CFO experienced a sharp decline from R4.1m to R2.75. Significant changes in TGP structures are often indicative of changes in leadership teams and we would expect a notable set of resignations and appointments to be driving this particular trend.
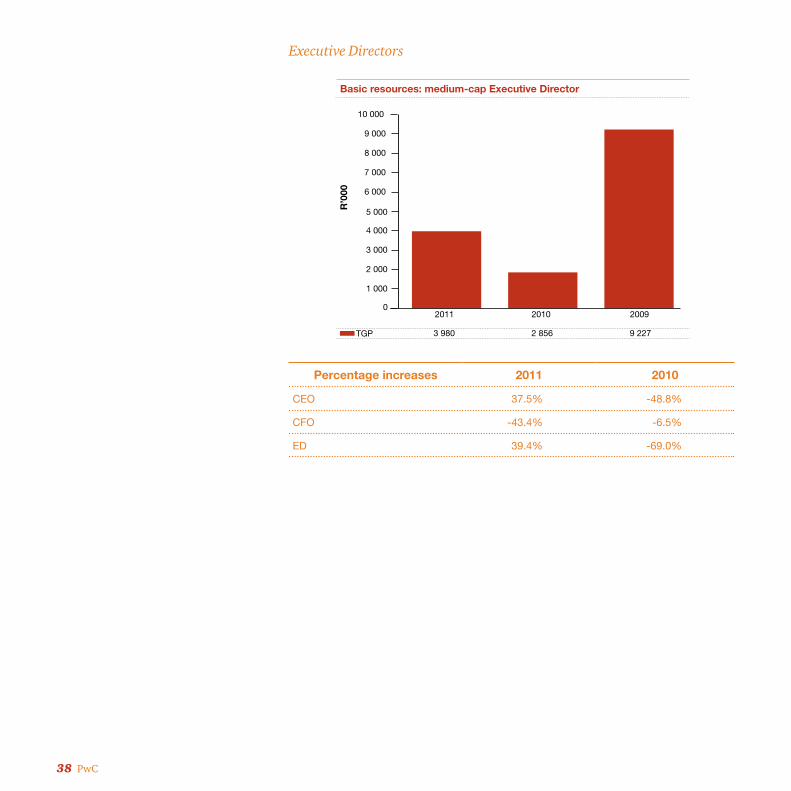
38 PwC
Executive Directors
Percentage increases 2011 2010
CEO 37.5% -48.8%
CFO -43.4% -6.5%
ED 39.4% -69.0%
0
1 000
2 000
3 000
4 000
5 000
6 000
7 000
8 000
9 000
10 000
2011 2010 2009
R’0
00TGP 3 980 2 856 9 227
Basic resources: medium-cap Executive Director
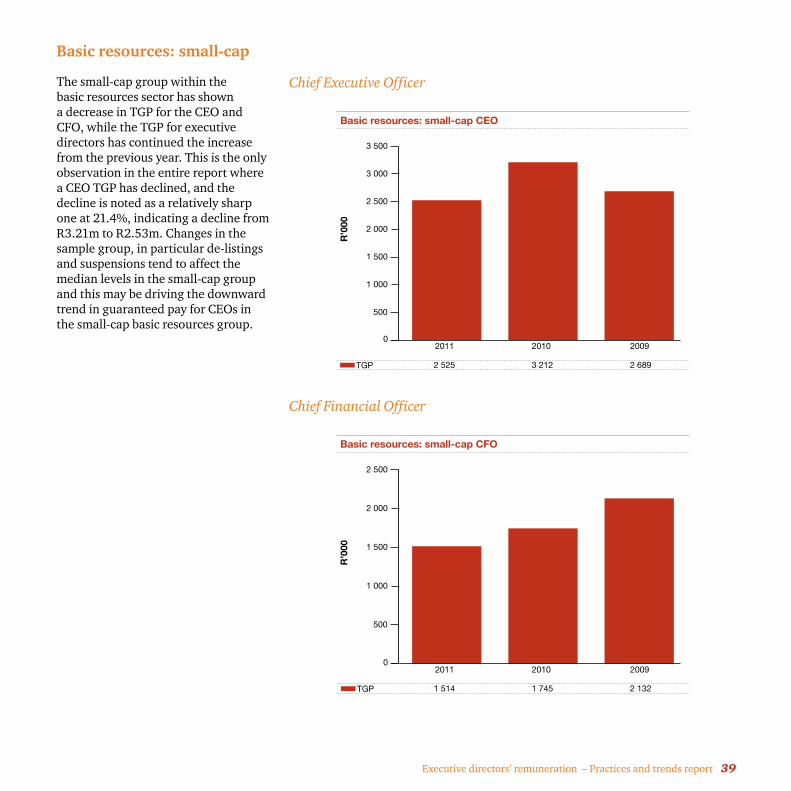
Executive directors’ remuneration – Practices and trends report 39
Basic resources: small-cap
The small-cap group within the basic resources sector has shown a decrease in TGP for the CEO and CFO, while the TGP for executive directors has continued the increase from the previous year. This is the only observation in the entire report where a CEO TGP has declined, and the decline is noted as a relatively sharp one at 21.4%, indicating a decline from R3.21m to R2.53m. Changes in the sample group, in particular de-listings and suspensions tend to affect the median levels in the small-cap group and this may be driving the downward trend in guaranteed pay for CEOs in the small-cap basic resources group.
Chief Executive Officer
Chief Financial Officer
0
500
1 000
1 500
2 000
2 500
3 000
3 500
2011 2010 2009R
’000
TGP 2 525 3 212 2 689
Basic resources: small-cap CEO
0
500
1 000
1 500
2 000
2 500
2011 2010 2009
R’0
00
TGP 1 514 1 745 2 132
Basic resources: small-cap CFO

40 PwC
Executive Directors
Percentage increases 2011 2010
CEO -21.4% 19.5%
CFO -13.3% -18.1%
ED 14.2% 14.5%
0
200
400
600
800
1 000
1 200
1 400
1 600
1 800
2 000
2011 2010 2009
R’0
00TGP 1 831 1 604 1 401
Basic resources: small-cap Executive Director
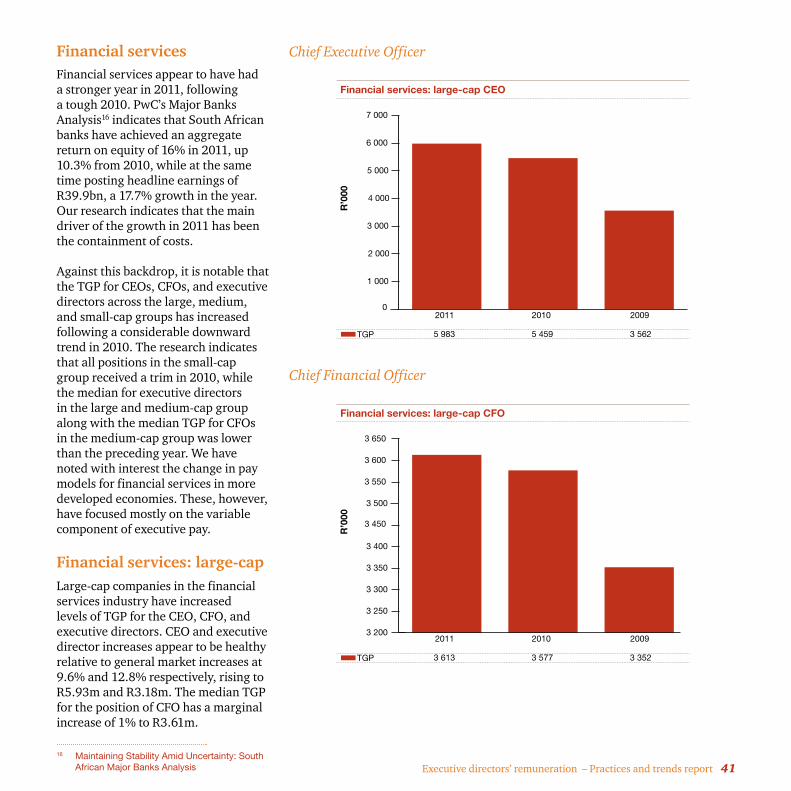
Executive directors’ remuneration – Practices and trends report 41
Financial servicesFinancial services appear to have had a stronger year in 2011, following a tough 2010. PwC’s Major Banks Analysis16 indicates that South African banks have achieved an aggregate return on equity of 16% in 2011, up 10.3% from 2010, while at the same time posting headline earnings of R39.9bn, a 17.7% growth in the year. Our research indicates that the main driver of the growth in 2011 has been the containment of costs.
Against this backdrop, it is notable that the TGP for CEOs, CFOs, and executive directors across the large, medium, and small-cap groups has increased following a considerable downward trend in 2010. The research indicates that all positions in the small-cap group received a trim in 2010, while the median for executive directors in the large and medium-cap group along with the median TGP for CFOs in the medium-cap group was lower than the preceding year. We have noted with interest the change in pay models for financial services in more developed economies. These, however, have focused mostly on the variable component of executive pay.
Financial services: large-capLarge-cap companies in the financial services industry have increased levels of TGP for the CEO, CFO, and executive directors. CEO and executive director increases appear to be healthy relative to general market increases at 9.6% and 12.8% respectively, rising to R5.93m and R3.18m. The median TGP for the position of CFO has a marginal increase of 1% to R3.61m.
16 Maintaining Stability Amid Uncertainty: South African Major Banks Analysis
Chief Executive Officer
Chief Financial Officer
0
1 000
2 000
3 000
4 000
5 000
6 000
7 000
2011 2010 2009
R’0
00TGP 5 983 5 459 3 562
Financial services: large-cap CEO
3 200
3 250
3 300
3 350
3 400
3 450
3 500
3 550
3 600
3 650
2011 2010 2009
R’0
00
TGP 3 613 3 577 3 352
Financial services: large-cap CFO
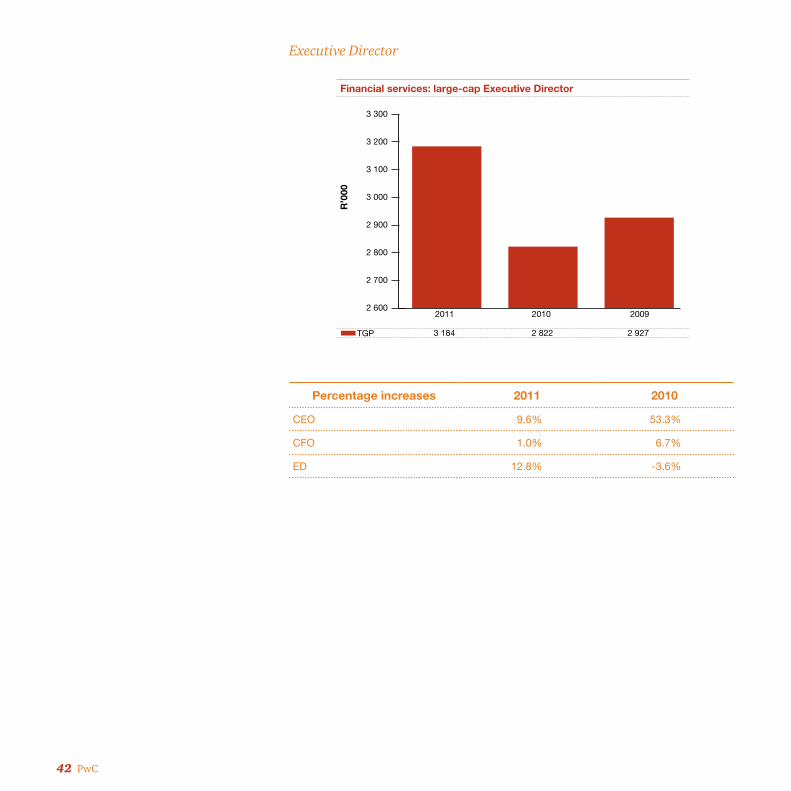
42 PwC
Executive Director
Percentage increases 2011 2010
CEO 9.6% 53.3%
CFO 1.0% 6.7%
ED 12.8% -3.6%
2 600
2 700
2 800
2 900
3 000
3 100
3 200
3 300
2011 2010 2009
R’0
00TGP 3 184 2 822 2 927
Financial services: large-cap Executive Director
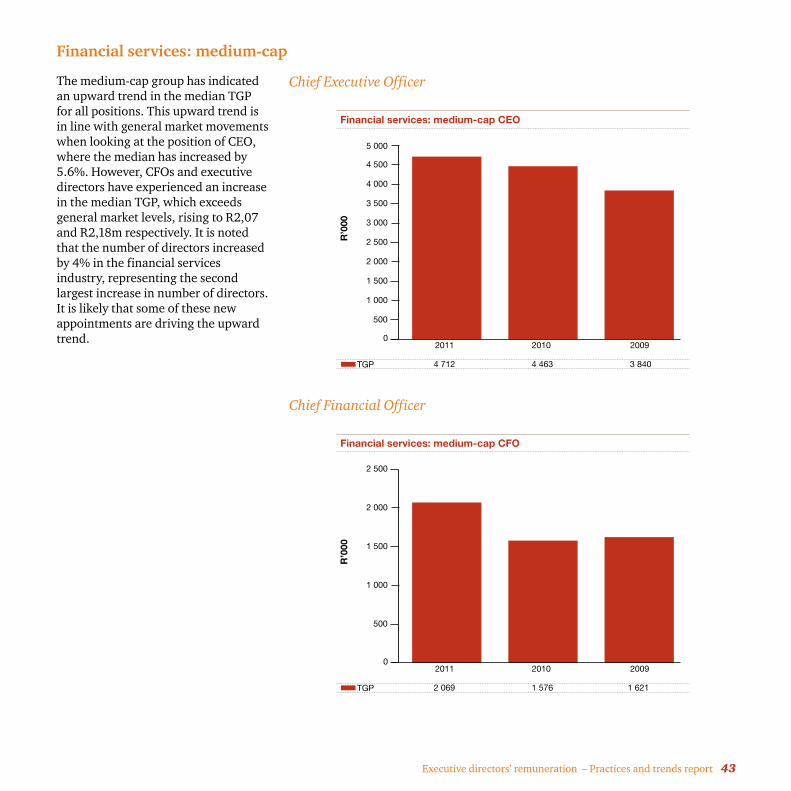
Executive directors’ remuneration – Practices and trends report 43
Financial services: medium-cap
The medium-cap group has indicated an upward trend in the median TGP for all positions. This upward trend is in line with general market movements when looking at the position of CEO, where the median has increased by 5.6%. However, CFOs and executive directors have experienced an increase in the median TGP, which exceeds general market levels, rising to R2,07 and R2,18m respectively. It is noted that the number of directors increased by 4% in the financial services industry, representing the second largest increase in number of directors. It is likely that some of these new appointments are driving the upward trend.
Chief Executive Officer
Chief Financial Officer
0
500
1 000
1 500
2 000
2 500
3 000
3 500
4 000
4 500
5 000
2011 2010 2009R
’000
TGP 4 712 4 463 3 840
Financial services: medium-cap CEO
0
500
1 000
1 500
2 000
2 500
2011 2010 2009
R’0
00
TGP 2 069 1 576 1 621
Financial services: medium-cap CFO
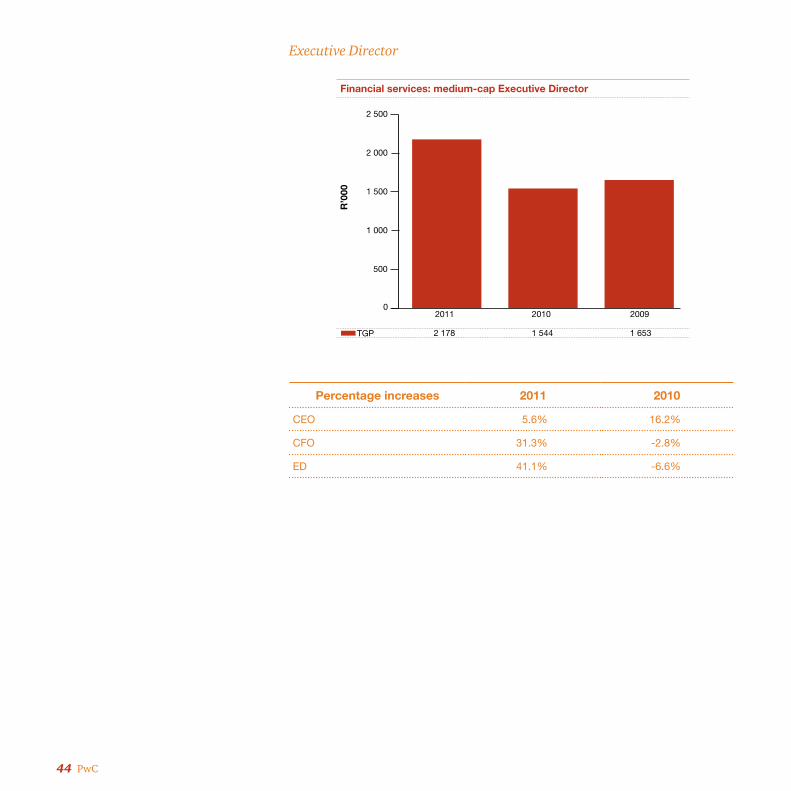
44 PwC
Executive Director
Percentage increases 2011 2010
CEO 5.6% 16.2%
CFO 31.3% -2.8%
ED 41.1% -6.6%
0
500
1 000
1 500
2 000
2 500
2011 2010 2009
R’0
00TGP 2 178 1 544 1 653
Financial services: medium-cap Executive Director
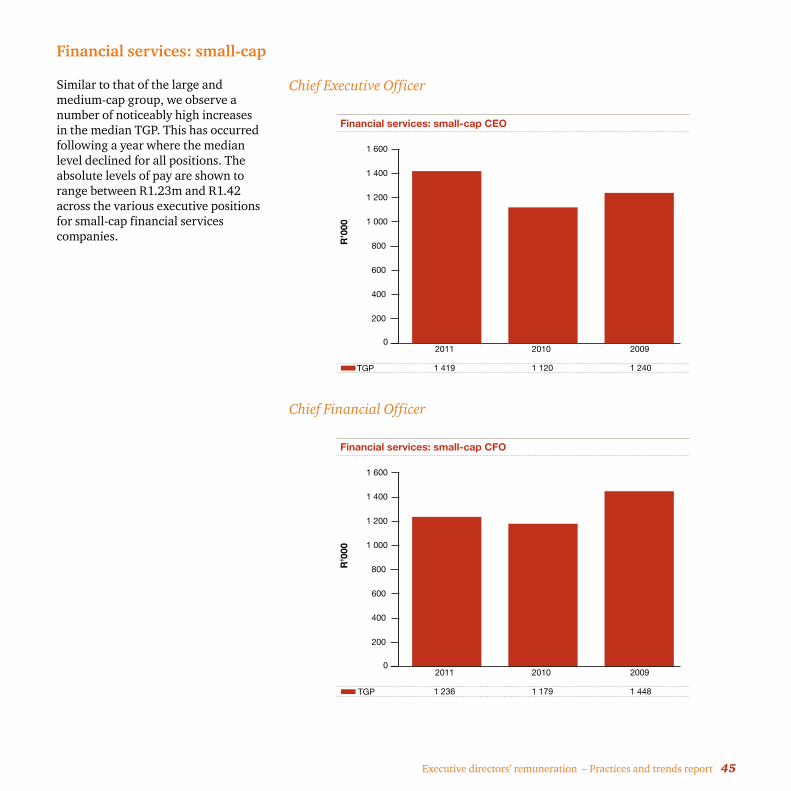
Executive directors’ remuneration – Practices and trends report 45
Financial services: small-cap
Similar to that of the large and medium-cap group, we observe a number of noticeably high increases in the median TGP. This has occurred following a year where the median level declined for all positions. The absolute levels of pay are shown to range between R1.23m and R1.42 across the various executive positions for small-cap financial services companies.
Chief Executive Officer
Chief Financial Officer
0
200
400
600
800
1 000
1 200
1 400
1 600
2011 2010 2009R
’000
TGP 1 419 1 120 1 240
Financial services: small-cap CEO
0
200
400
600
800
1 000
1 200
1 400
1 600
2011 2010 2009
R’0
00
TGP 1 236 1 179 1 448
Financial services: small-cap CFO
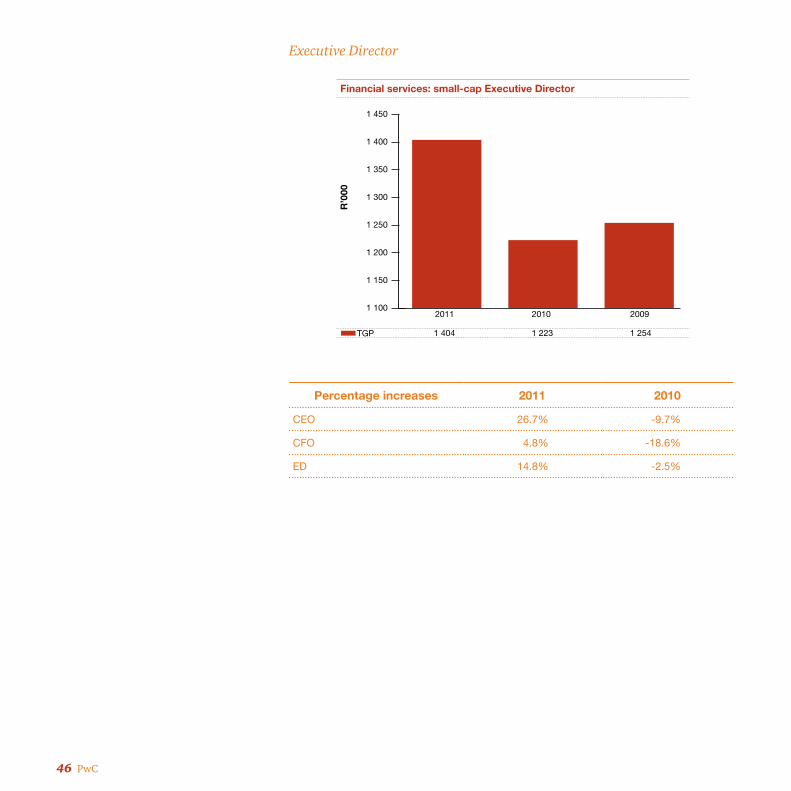
46 PwC
Executive Director
Percentage increases 2011 2010
CEO 26.7% -9.7%
CFO 4.8% -18.6%
ED 14.8% -2.5%
1 100
1 150
1 200
1 250
1 300
1 350
1 400
1 450
2011 2010 2009
R’0
00TGP 1 404 1 223 1 254
Financial services: small-cap Executive Director
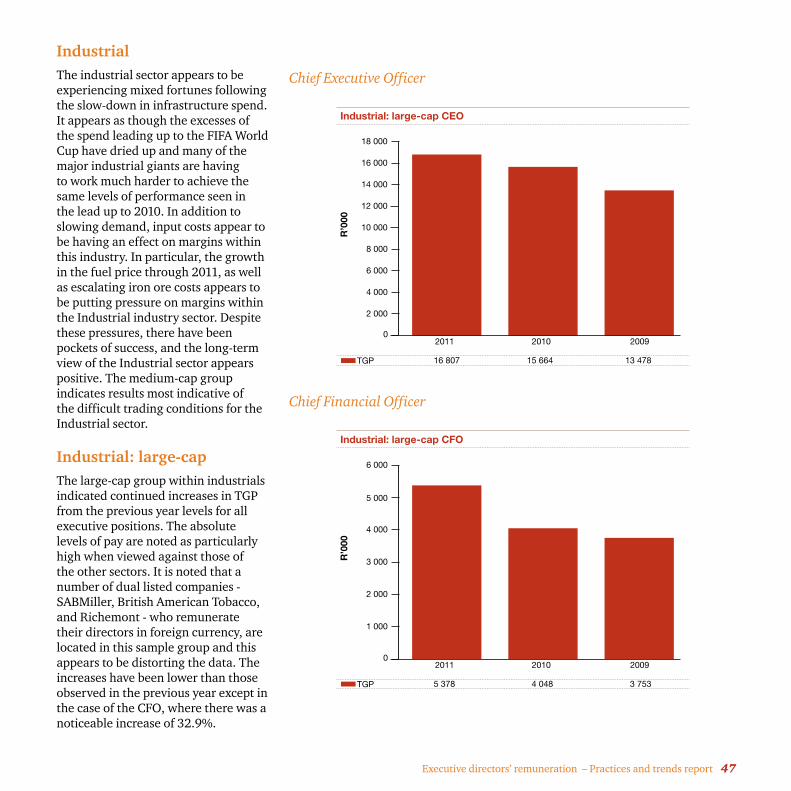
Executive directors’ remuneration – Practices and trends report 47
IndustrialThe industrial sector appears to be experiencing mixed fortunes following the slow-down in infrastructure spend. It appears as though the excesses of the spend leading up to the FIFA World Cup have dried up and many of the major industrial giants are having to work much harder to achieve the same levels of performance seen in the lead up to 2010. In addition to slowing demand, input costs appear to be having an effect on margins within this industry. In particular, the growth in the fuel price through 2011, as well as escalating iron ore costs appears to be putting pressure on margins within the Industrial industry sector. Despite these pressures, there have been pockets of success, and the long-term view of the Industrial sector appears positive. The medium-cap group indicates results most indicative of the difficult trading conditions for the Industrial sector.
Industrial: large-capThe large-cap group within industrials indicated continued increases in TGP from the previous year levels for all executive positions. The absolute levels of pay are noted as particularly high when viewed against those of the other sectors. It is noted that a number of dual listed companies - SABMiller, British American Tobacco, and Richemont - who remunerate their directors in foreign currency, are located in this sample group and this appears to be distorting the data. The increases have been lower than those observed in the previous year except in the case of the CFO, where there was a noticeable increase of 32.9%.
Chief Executive Officer
Chief Financial Officer
0
2 000
4 000
6 000
8 000
10 000
12 000
14 000
16 000
18 000
2011 2010 2009R
’000
TGP 16 807 15 664 13 478
Industrial: large-cap CEO
0
1 000
2 000
3 000
4 000
5 000
6 000
2011 2010 2009
R’0
00
TGP 5 378 4 048 3 753
Industrial: large-cap CFO
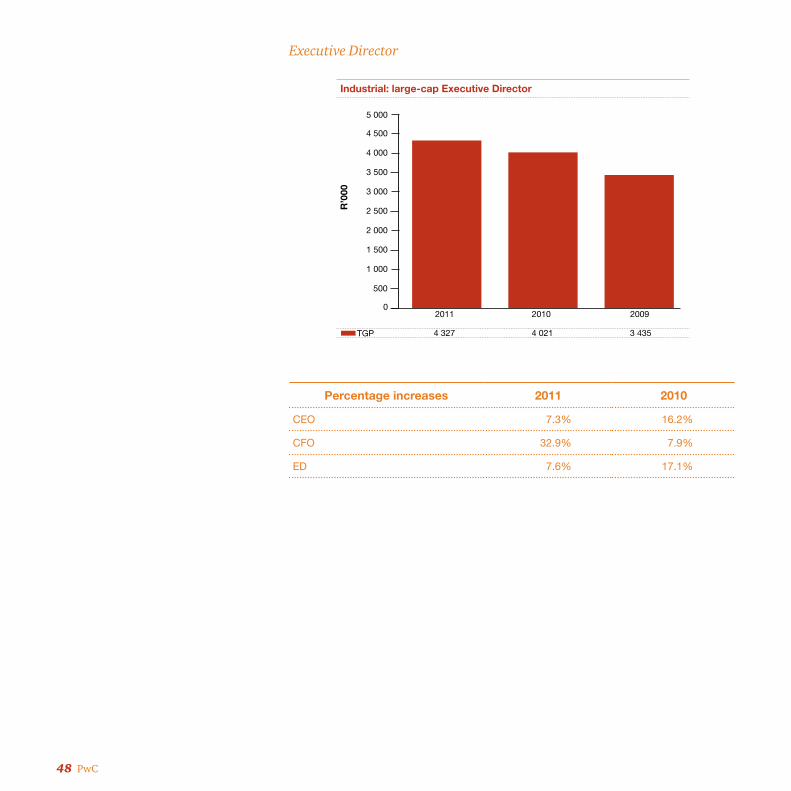
48 PwC
Executive Director
Percentage increases 2011 2010
CEO 7.3% 16.2%
CFO 32.9% 7.9%
ED 7.6% 17.1%
0
500
1 000
1 500
2 000
2 500
3 000
3 500
4 000
4 500
5 000
2011 2010 2009
R’0
00TGP 4 327 4 021 3 435
Industrial: large-cap Executive Director
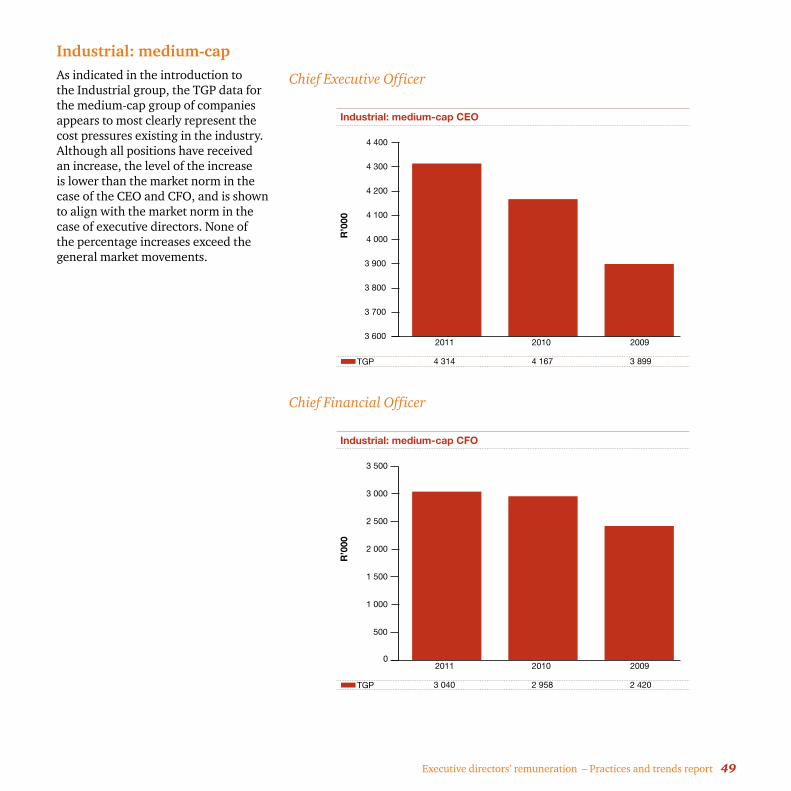
Executive directors’ remuneration – Practices and trends report 49
Industrial: medium-capAs indicated in the introduction to the Industrial group, the TGP data for the medium-cap group of companies appears to most clearly represent the cost pressures existing in the industry. Although all positions have received an increase, the level of the increase is lower than the market norm in the case of the CEO and CFO, and is shown to align with the market norm in the case of executive directors. None of the percentage increases exceed the general market movements.
Chief Executive Officer
Chief Financial Officer
3 600
3 700
3 800
3 900
4 000
4 100
4 200
4 300
4 400
2011 2010 2009R
’000
TGP 4 314 4 167 3 899
Industrial: medium-cap CEO
0
500
1 000
1 500
2 000
2 500
3 000
3 500
2011 2010 2009
R’0
00
TGP 3 040 2 958 2 420
Industrial: medium-cap CFO
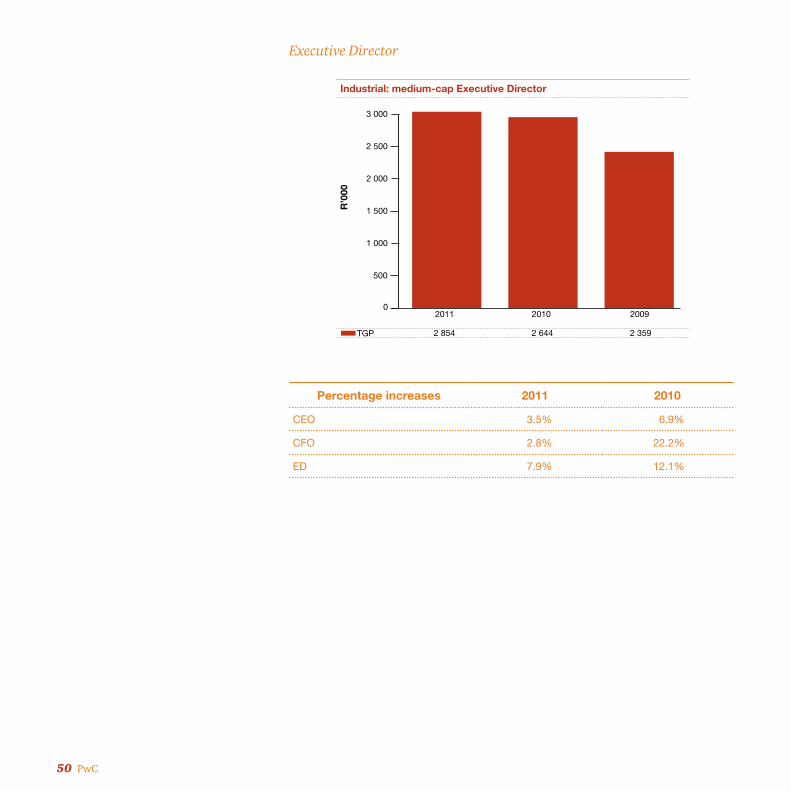
50 PwC
Executive Director
Percentage increases 2011 2010
CEO 3.5% 6.9%
CFO 2.8% 22.2%
ED 7.9% 12.1%
0
500
1 000
1 500
2 000
2 500
3 000
2011 2010 2009
R’0
00TGP 2 854 2 644 2 359
Industrial: medium-cap Executive Director
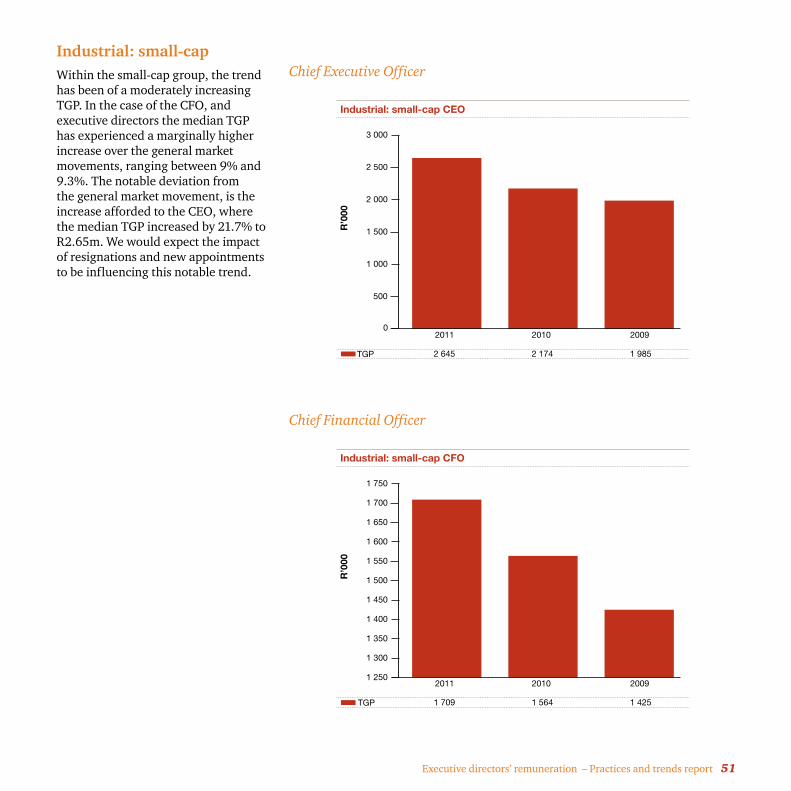
Executive directors’ remuneration – Practices and trends report 51
Industrial: small-capWithin the small-cap group, the trend has been of a moderately increasing TGP. In the case of the CFO, and executive directors the median TGP has experienced a marginally higher increase over the general market movements, ranging between 9% and 9.3%. The notable deviation from the general market movement, is the increase afforded to the CEO, where the median TGP increased by 21.7% to R2.65m. We would expect the impact of resignations and new appointments to be influencing this notable trend.
Chief Executive Officer
Chief Financial Officer
0
500
1 000
1 500
2 000
2 500
3 000
2011 2010 2009R
’000
TGP 2 645 2 174 1 985
Industrial: small-cap CEO
1 250
1 300
1 350
1 400
1 450
1 500
1 550
1 600
1 650
1 700
1 750
2011 2010 2009
R’0
00
TGP 1 709 1 564 1 425
Industrial: small-cap CFO
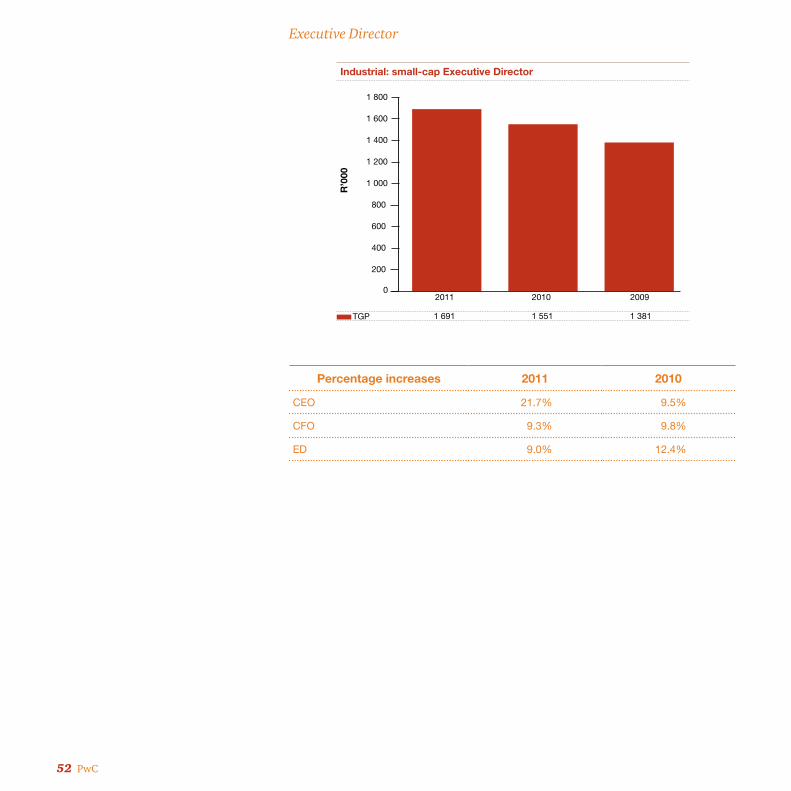
52 PwC
Executive Director
Percentage increases 2011 2010
CEO 21.7% 9.5%
CFO 9.3% 9.8%
ED 9.0% 12.4%
0
200
400
600
800
1 000
1 200
1 400
1 600
1 800
2011 2010 2009
R’0
00
TGP 1 691 1 551 1 381
Industrial: small-cap Executive Director
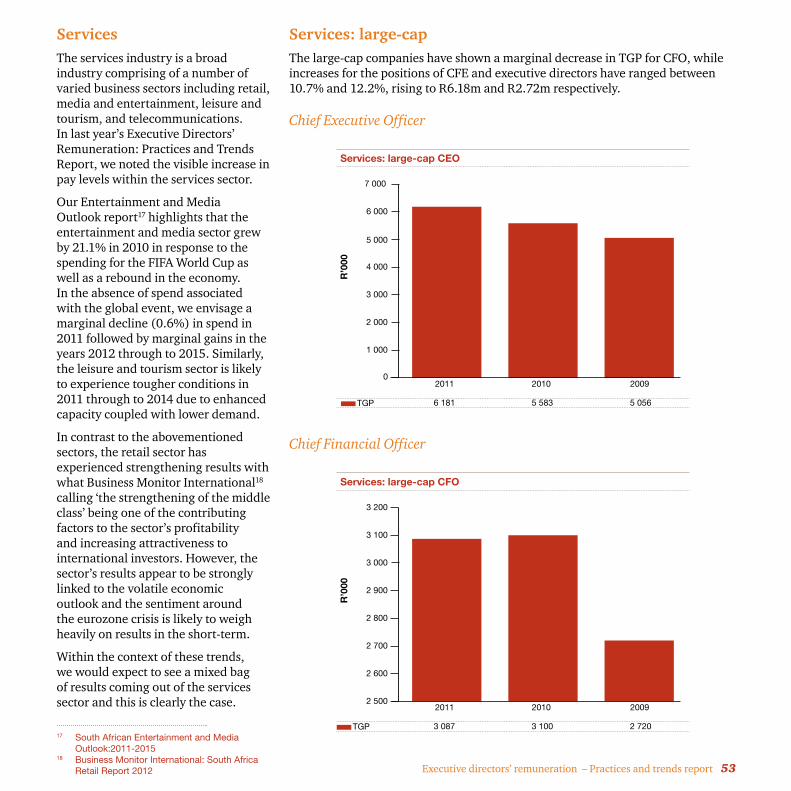
Executive directors’ remuneration – Practices and trends report 53
ServicesThe services industry is a broad industry comprising of a number of varied business sectors including retail, media and entertainment, leisure and tourism, and telecommunications. In last year’s Executive Directors’ Remuneration: Practices and Trends Report, we noted the visible increase in pay levels within the services sector.
Our Entertainment and Media Outlook report17 highlights that the entertainment and media sector grew by 21.1% in 2010 in response to the spending for the FIFA World Cup as well as a rebound in the economy. In the absence of spend associated with the global event, we envisage a marginal decline (0.6%) in spend in 2011 followed by marginal gains in the years 2012 through to 2015. Similarly, the leisure and tourism sector is likely to experience tougher conditions in 2011 through to 2014 due to enhanced capacity coupled with lower demand.
In contrast to the abovementioned sectors, the retail sector has experienced strengthening results with what Business Monitor International18 calling ‘the strengthening of the middle class’ being one of the contributing factors to the sector’s profitability and increasing attractiveness to international investors. However, the sector’s results appear to be strongly linked to the volatile economic outlook and the sentiment around the eurozone crisis is likely to weigh heavily on results in the short-term.
Within the context of these trends, we would expect to see a mixed bag of results coming out of the services sector and this is clearly the case.
17 South African Entertainment and Media Outlook:2011-2015
18 Business Monitor International: South Africa Retail Report 2012
Services: large-capThe large-cap companies have shown a marginal decrease in TGP for CFO, while increases for the positions of CFE and executive directors have ranged between 10.7% and 12.2%, rising to R6.18m and R2.72m respectively.
Chief Executive Officer
Chief Financial Officer
0
1 000
2 000
3 000
4 000
5 000
6 000
7 000
2011 2010 2009
R’0
00
TGP 6 181 5 583 5 056
Services: large-cap CEO
2 500
2 600
2 700
2 800
2 900
3 000
3 100
3 200
2011 2010 2009
R’0
00
TGP 3 087 3 100 2 720
Services: large-cap CFO
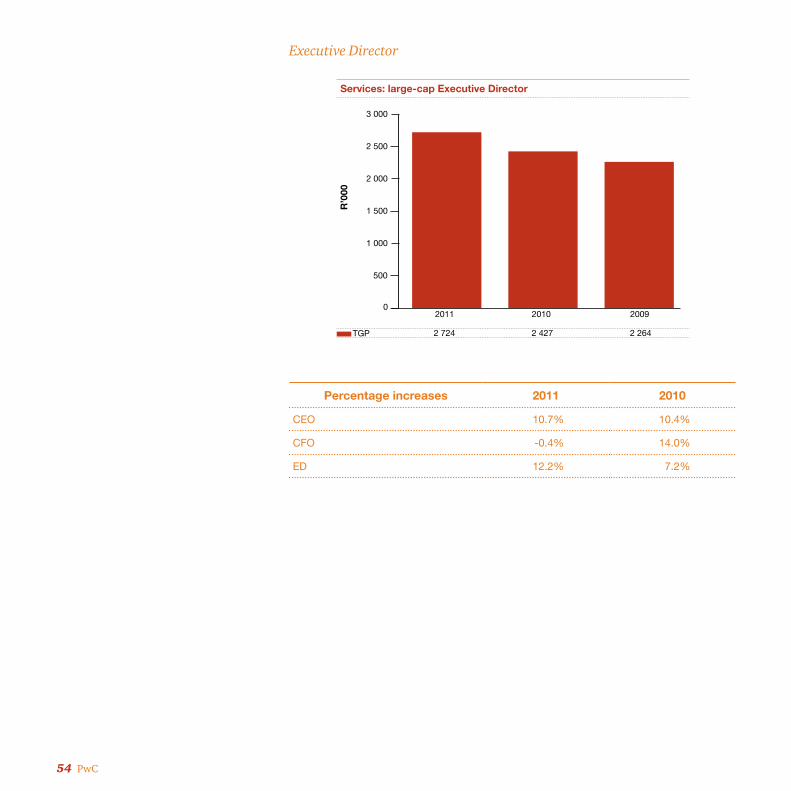
54 PwC
Executive Director
Percentage increases 2011 2010
CEO 10.7% 10.4%
CFO -0.4% 14.0%
ED 12.2% 7.2%
0
500
1 000
1 500
2 000
2 500
3 000
2011 2010 2009
R’0
00TGP 2 724 2 427 2 264
Services: large-cap Executive Director
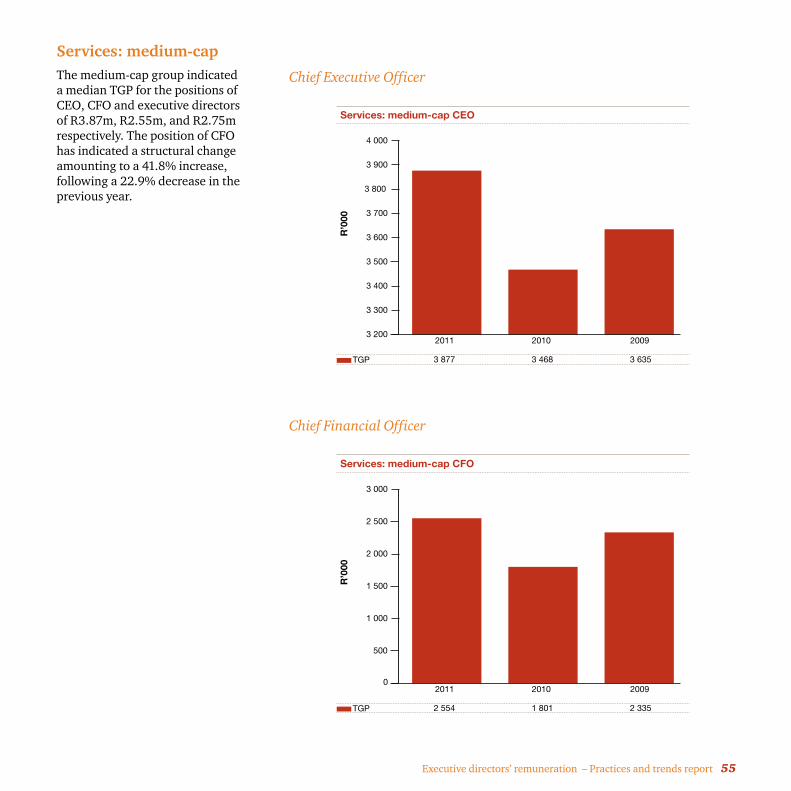
Executive directors’ remuneration – Practices and trends report 55
Services: medium-capThe medium-cap group indicated a median TGP for the positions of CEO, CFO and executive directors of R3.87m, R2.55m, and R2.75m respectively. The position of CFO has indicated a structural change amounting to a 41.8% increase, following a 22.9% decrease in the previous year.
Chief Executive Officer
Chief Financial Officer
3 200
3 300
3 400
3 500
3 600
3 700
3 800
3 900
4 000
2011 2010 2009R
’000
TGP 3 877 3 468 3 635
Services: medium-cap CEO
0
500
1 000
1 500
2 000
2 500
3 000
2011 2010 2009
R’0
00
TGP 2 554 1 801 2 335
Services: medium-cap CFO
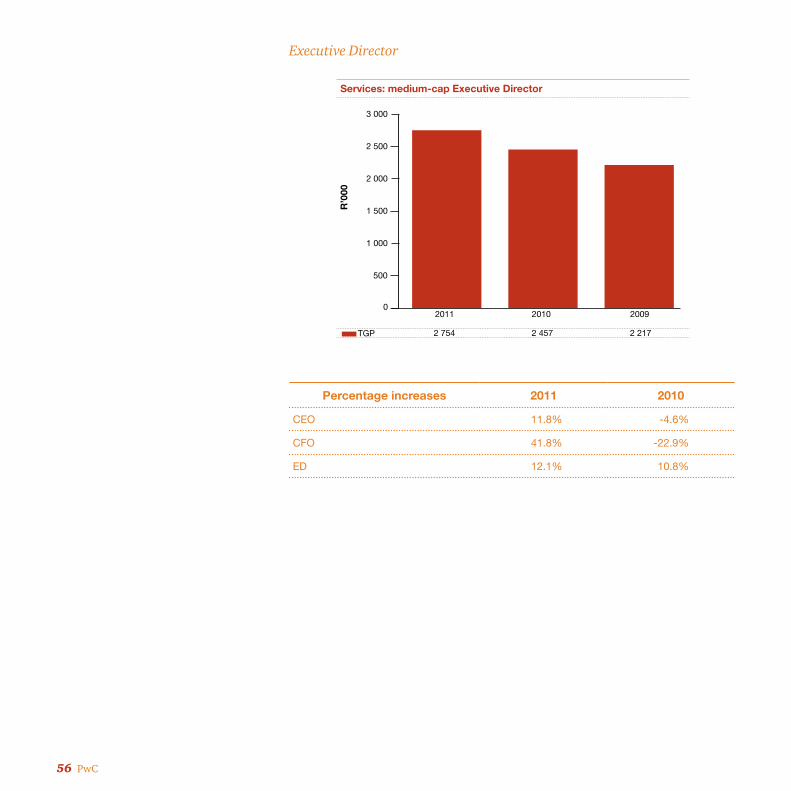
56 PwC
Executive Director
Percentage increases 2011 2010
CEO 11.8% -4.6%
CFO 41.8% -22.9%
ED 12.1% 10.8%
0
500
1 000
1 500
2 000
2 500
3 000
2011 2010 2009
R’0
00TGP 2 754 2 457 2 217
Services: medium-cap Executive Director
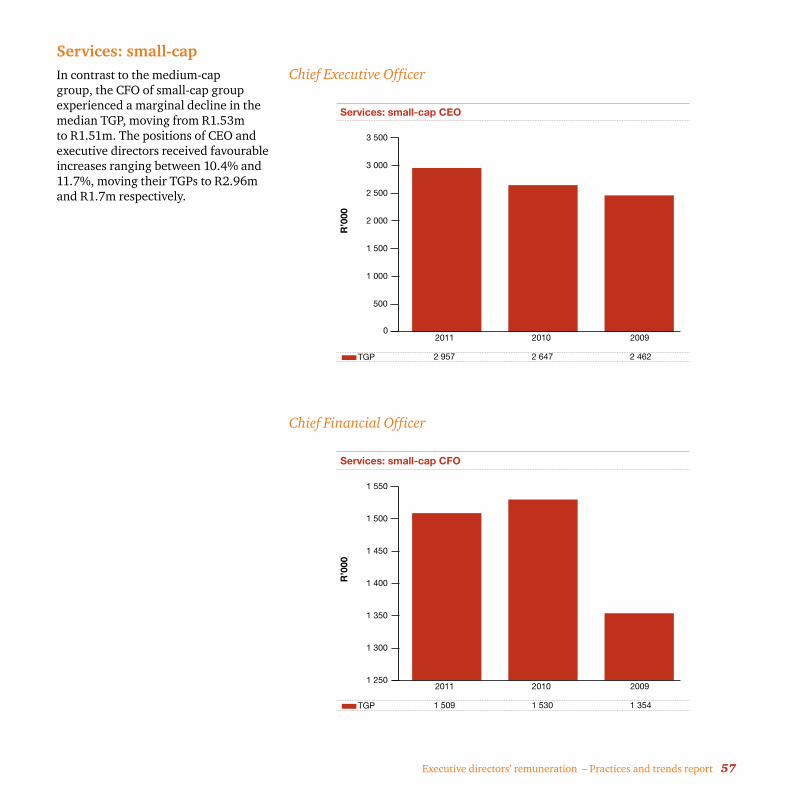
Executive directors’ remuneration – Practices and trends report 57
Services: small-capIn contrast to the medium-cap group, the CFO of small-cap group experienced a marginal decline in the median TGP, moving from R1.53m to R1.51m. The positions of CEO and executive directors received favourable increases ranging between 10.4% and 11.7%, moving their TGPs to R2.96m and R1.7m respectively.
Chief Executive Officer
Chief Financial Officer
0
500
1 000
1 500
2 000
2 500
3 000
3 500
2011 2010 2009R
’000
TGP 2 957 2 647 2 462
Services: small-cap CEO
1 250
1 300
1 350
1 400
1 450
1 500
1 550
2011 2010 2009
R’0
00
TGP 1 509 1 530 1 354
Services: small-cap CFO

58 PwC
Executive Director
Percentage increases 2011 2010
CEO 11.7% 7.5%
CFO -1.4% 13.0%
ED 10.4% -3.9%
1 450
1 500
1 550
1 600
1 650
1 700
1 750
2011 2010 2009
R’0
00TGP 1 696 1 536 1 598
Services: small-cap Executive Director
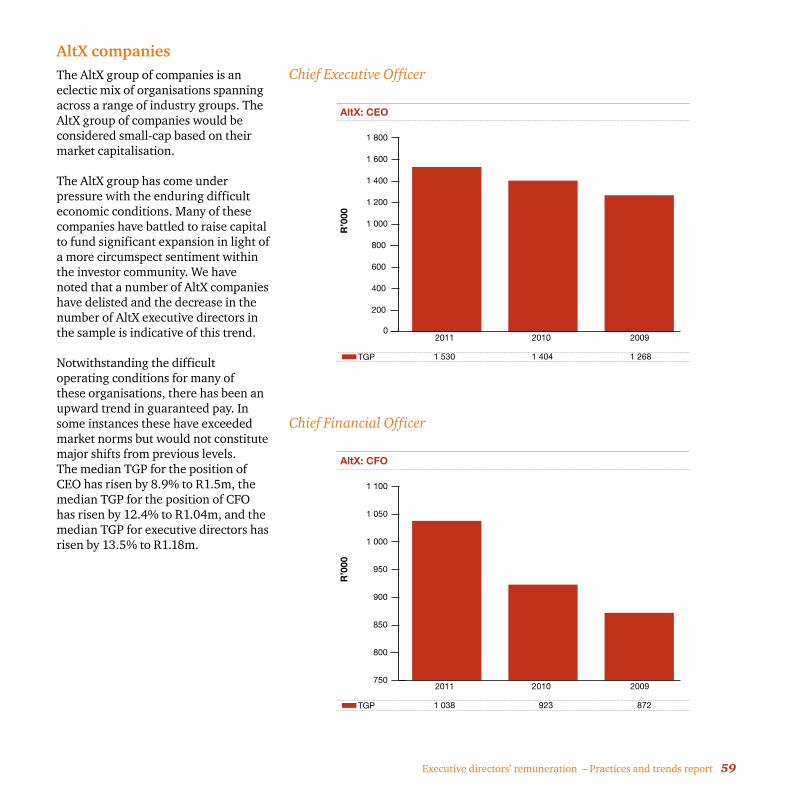
Executive directors’ remuneration – Practices and trends report 59
AltX companiesThe AltX group of companies is an eclectic mix of organisations spanning across a range of industry groups. The AltX group of companies would be considered small-cap based on their market capitalisation.
The AltX group has come under pressure with the enduring difficult economic conditions. Many of these companies have battled to raise capital to fund significant expansion in light of a more circumspect sentiment within the investor community. We have noted that a number of AltX companies have delisted and the decrease in the number of AltX executive directors in the sample is indicative of this trend.
Notwithstanding the difficult operating conditions for many of these organisations, there has been an upward trend in guaranteed pay. In some instances these have exceeded market norms but would not constitute major shifts from previous levels. The median TGP for the position of CEO has risen by 8.9% to R1.5m, the median TGP for the position of CFO has risen by 12.4% to R1.04m, and the median TGP for executive directors has risen by 13.5% to R1.18m.
Chief Executive Officer
Chief Financial Officer
0
200
400
600
800
1 000
1 200
1 400
1 600
1 800
2011 2010 2009R
’000
TGP 1 530 1 404 1 268
AltX: CEO
750
800
850
900
950
1 000
1 050
1 100
2011 2010 2009
R’0
00
TGP 1 038 923 872
AltX: CFO
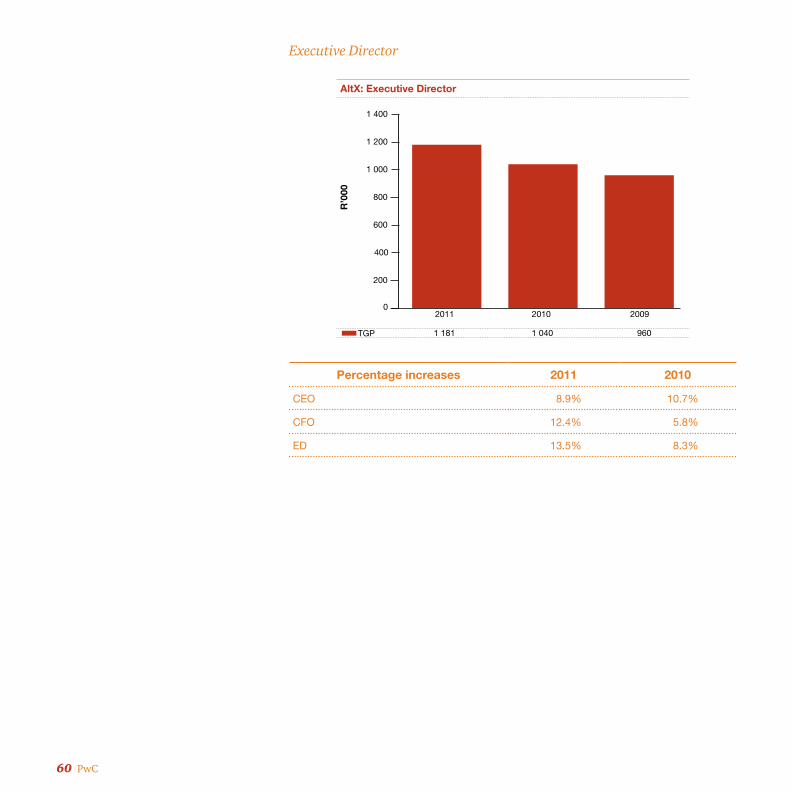
60 PwC
Executive Director
Percentage increases 2011 2010
CEO 8.9% 10.7%
CFO 12.4% 5.8%
ED 13.5% 8.3%
0
200
400
600
800
1 000
1 200
1 400
2011 2010 2009
R’0
00TGP 1 181 1 040 960
AltX: Executive Director
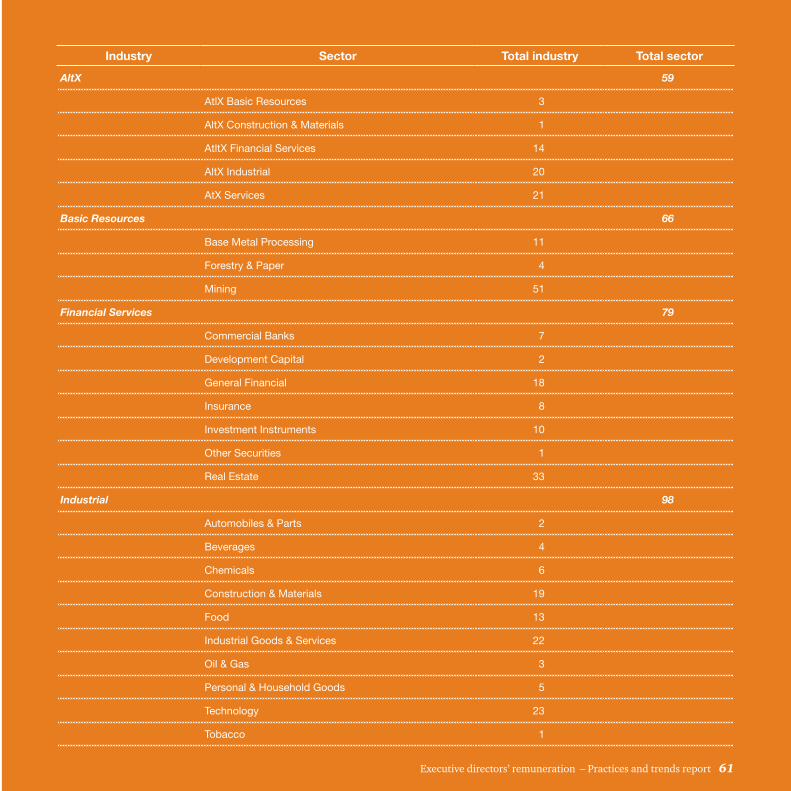
61Executive directors’ remuneration – Practices and trends report 61
Industry Sector Total industry Total sector
AltX 59
AtlX Basic Resources 3
AltX Construction & Materials 1
AtltX Financial Services 14
AltX Industrial 20
AtX Services 21
Basic Resources 66
Base Metal Processing 11
Forestry & Paper 4
Mining 51
Financial Services 79
Commercial Banks 7
Development Capital 2
General Financial 18
Insurance 8
Investment Instruments 10
Other Securities 1
Real Estate 33
Industrial 98
Automobiles & Parts 2
Beverages 4
Chemicals 6
Construction & Materials 19
Food 13
Industrial Goods & Services 22
Oil & Gas 3
Personal & Household Goods 5
Technology 23
Tobacco 1
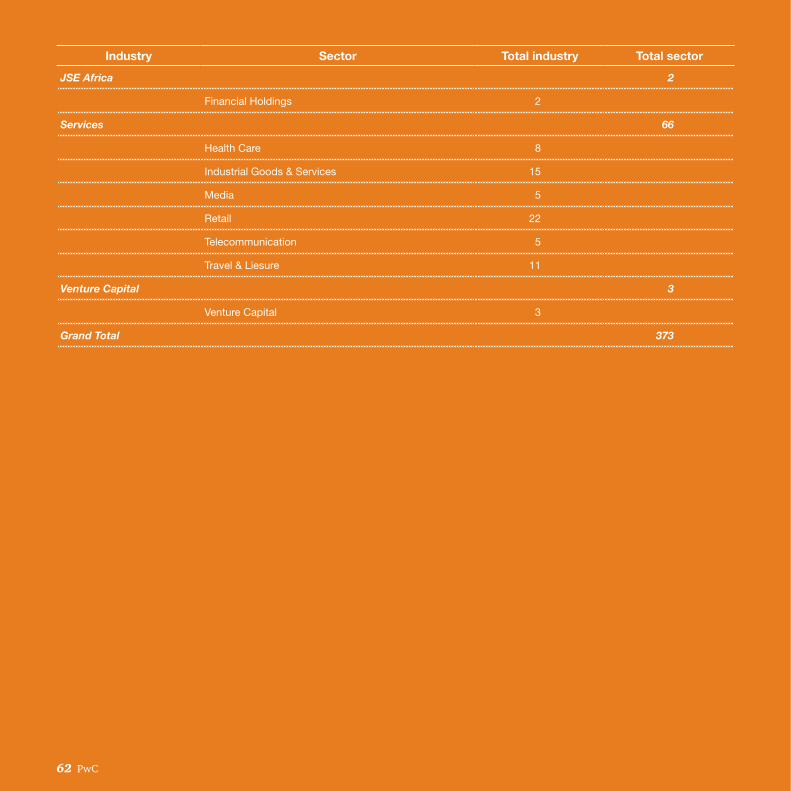
6262 PwC
Industry Sector Total industry Total sector
JSE Africa 2
Financial Holdings 2
Services 66
Health Care 8
Industrial Goods & Services 15
Media 5
Retail 22
Telecommunication 5
Travel & Liesure 11
Venture Capital 3
Venture Capital 3
Grand Total 373

Executive directors’ remuneration – Practices and trends report 63
About PwC
At PwC we apply our industry knowledge and professional expertise to identify, report, protect, realise and create value for our clients and their stakeholders. The strength of this value proposition is based on the breadth and depth of the firm’s client relationships. Networks are built around clients to provide them with our collective knowledge and resources. Our international network, experience, industry knowledge and business understanding are used
to build trust and create value for clients. We are committed to making PwC distinctive through consistent behaviours that enable the success of our clients and people. We call this the PwC Experience and it shapes the way in which we interact with clients, with one another and with the communities in which we operate. This, along with our core values of Teamwork, Leadership and Excellence – and our strong Code of Conduct – guides us in all that we do.

64 PwC
Acknowledgements
We would like to thank the following people for their valuable contribution to this report:
• Paul Shaw, Manager, PwC
• Julia Fourie, Senior Manager, PwC
• Karen Crous, Associate Director, PwC
• David Yzelle, Independent project researcher
If you would like more information on the issues raised in this report, please contact:
• Gerald Seegers + 27 11 797 4560 [email protected]
• Karen Crous +27 11 797 4616 [email protected]
• Paul Shaw +27 11 797 4356 [email protected]
• Julia Fourie +27 21 529 2170 [email protected]
For press enquiries, please contact:
• Sonja Nel +27 11 797 4207 [email protected]


The information contained in this publication is provided for general information purposes only, and does not constitute the provision of legal or professional advice in any way. Before making any decision or taking any action, a professional adviser should be consulted. No responsibility for loss to any person acting or refraining from action as a result of any material in this publication can be accepted by the author, copyright owner or publisher.
This publication has been prepared for general guidance on matters of interest only, and does not constitute professional advice. You should not act upon the information contained in this publication without obtaining specific professional advice. No representation or warranty (express or implied) is given as to the accuracy or completeness of the information contained in this publication, and, to the extent permitted by law, PricewaterhouseCoopers Inc, its subsidiary and associated companies and entities and their respective directors, employees agents and subcontractors do not accept or assume any liability, responsibility or duty of care for any consequences of you or anyone else acting, or refraining to act, in reliance on the information contained in this publication or for any decision based on it.
© 2012 PricewaterhouseCoopers (“PwC”), a South African firm, PwC is part of the PricewaterhouseCoopers International Limited (“PwCIL”) network that consists of separate and independent legal entities that do not act as agents of PwCIL or any other member firm, nor is PwCIL or the separate firms responsible or liable for the acts or omissions of each other in any way. No portion of this document may be reproduced by any process without the written permission of PwC. (12-11258)